
Abstract
The development of information technologies and the massive generation of data in today’s digital world provides new opportunities for official statistics. Big data, especially produced by a marketplace have a great potential to produce a list of online shops. The aim of this paper is to develop an online shop sampling frame from marketplace data. Using the shop and item datasets, an item-level data algorithm is developed to determine whether a shop is active or not to be included in the frame. In this study, the focus is for online shops in Jakarta Province, Indonesia. The algorithm is built using divide and conquer principle and statistical method. The frame produced consists of 13 attributes such as Shop ID, number of items, annual revenue, shop types, Business scale classification and the location (URL and physical address). The frame contains of 101,443 active online shops which most of it are micro enterprises.
Introduction
The development of information technologies and the massive generation of data in today’s digital world provide new opportunities for official statistics. We can find various types of data in different parts of the world in various forms, types, and variations. The technologies come up with a huge data lake, called big data. The rise of big data is not a competitor to survey data or traditional research approaches. Instead, all forms of data, including big data can be used to create better insight into public policy [1, 2].
One of the key aspects of a sample design in every survey is its frame. A sampling frame has significant implications on the cost and the quality of any survey [3]. The simplest approach for a household survey sampling frame is often to use postal codes [4]. An access panel can be also used as a sampling frame for voluntary household surveys [5]. Agricultural data collected through the Population Census can be used to build a Master Sampling Frame for agriculture censuses and surveys [6]. In this digital era, new ways of creating a sampling frame are needed for better, up-to-date, and more granular survey results. BPS Statistics Indonesia has constructed its maize sampling frame by making use of different sources of spatial information including satellite imageries [7]. However, it is difficult to derive a suitable sampling frame for surveys of online shops [8].
Currently there are plenty of efforts to measure the digital economy, including developing a digital economy satellite account. Expanded coverage of the digital economy can provide comprehensive estimates of retail and wholesale e-commerce activity and an estimate of cloud services [9]. Marketplaces are one of three categories of e-commerce where the website facilitates online transactions for online merchants. Several studies shows that marketplaces and online shops can be utilized to produce online price statistics [10] and CPI data [11].
Processing administrative register and transaction data from marketplaces can be a great opportunity for government statistical agencies to build an online shop sampling frame. The use of technology in terms of marketing and retail industry is growing very rapidly in Indonesia. In January 2020, 64% of the Indonesian population were internet users and 88% of those were e-commerce users [12]. Besides sampling frames, several National Statistics Offices in the world have used marketplace data as a data source to complement data generated from conventional statistical methods such as censuses and surveys [13].
Administrative data, statistical registers, censuses, and data from other sample surveys are common sources for a sampling frame. Beresewicz [15] argued that big data is another type of secondary data source and a new kind of automated data collection made via the internet and the internet of things. Although big data and traditional survey data have different statistical features, big data can be used for sampling frames or enriching existing frames [16]. Although marketplace data presents an opportunity for constructing an online shop sampling frame, marketplace data can be highly inconsistent, noisy, ambiguous, or incomplete [14].
The objective of this paper is to develop an online shop sampling frame from marketplace data. The sampling frame is produced by defining active shops in a marketplace platform. The frame includes the size of the shops, especially online small and medium enterprises (SMEs).
For an economic survey, the sampling frame should be a subset of the frozen frame [17]. A frozen frame is a subset of the snapshot that comprises all statistical units that are active, or potentially active, or active within the previous reference period, often a year. A frozen frame also includes administrative units that are linked to these statistical units, the aim being to include all units and all characteristics that are used by subsequent processes. In other words, the sampling frame for an economic survey is a down-trimmed version of the snapshot (of all active or potentially active or active within a previous reference period) that is easier to manipulate because the possibly large number of inactive units are not there. The sampling frame may be further restricted by containing only units for which there are values for the characteristics that are to be used for frame extraction and sample selection [18].
Turner [3] has proposed that a perfect sampling frame is one that is complete, accurate, and up to date. We assume because marketplace data has real-time transactions it is up to date, but completeness and accuracy are still questionable [22, 23].
The quality of a sampling frame can be judged in terms of how well its ideal properties relate to the target population [19]. Burg et al. in [20] proposed how to assess the quality of data included in a frame by separating quality into several components called error types, namely coverage error, domain classification error, contact information errors, alignment errors, and unit coverage error caused by missing, erroneous or duplicated frame units. Domain classification error corresponds to incorrect auxiliary information. Contact information plays an important role in indicator assessment and monitoring and can be called a bridge that connects units in the sampling frame with the survey. Alignment and unit coverage errors are closely related, for example in social statistics alignment between persons and addresses may cause unit coverage errors in the identification of the statistical unit, which in this case are usually households.
Most big data sources have underlying electronic platforms which were not set up for statistical purposes. Therefore, the characteristics of the specific electronic platforms influence the data captured at several levels: they influence which objects, individuals or events are observed and what can be measured, as well as frequency, timing, precision, and reliability. Because the data captured by the electronic platform was not set up on purpose for statistical use, using it for a sampling frame may be problematic if the intended population for a sample survey is not covered [15]. Not only under-coverage, but duplicate records or over-coverage are also problems related to electronic platforms data. However, from Beresewicz et al’s theoretical point of view [15], we can treat electronic platform operators and their data as an imperfect sampling frame that may be directly or indirectly connected to the target population.
To draw valid statistical results from any sample survey, regardless of its sampling frame, it is necessary to exactly identify the observed population and specify the target population of interest. Identifying the relationship between these two populations might not be an easy task and can vary between sampling frame sources. Therefore, reducing duplicate records and identifying units corresponding to the target population is important during sampling frame construction.
Materials and methods
Materials
In this study, the dataset was retrieved from a marketplace’s non-public Application Programming Interface (API). The data was for the period from August 2019 until December 2020. As of March 2021, there were 6.5 million shop accounts with 145.3 million distinct items, 1 billion rows, and 1.7 TB of data from one Indonesian marketplace.
Overall, the data is divided into two types; shop, and item datasets. The shop dataset contains information on the online shops, such as the type of shop, the location (province, district, sub-district), and the shop’s creation date. Whereas the item dataset contains specific information on item details, such as the number of items sold since the shop was created, the number of items sold in the last 30 days, item prices, category, sub-category, sub-sub-category, etc.
The Indonesian capital, Jakarta, was selected for this study because more than 30% of shop accounts in the selected marketplace were located in this province. This selection reduced the size of the study to 1.3 million shop accounts with 54.6 million items from 27 categories.
We use a serverless data warehouse, Big Query as the processing platform having regard to the large amount of data, data interoperability, processing speed, and ease of running the code. The speed of processing large data and the convenience of this medium will be worth the costs incurred.
Methods
In a survey, there is a process for removing duplicates and out-of-scope units in the frame, including those who have emigrated or died. Checking the validity of units is also an important step process in the frame. This concept is also applicable in the frame that uses marketplace data as a source. Removing duplicates, non-active, out-of-scope, and invalid shops are also important in marketplace surveys
However, making marketplace data as a frame’s source might be more challenging than other sources. In a marketplace survey or another online business survey, the existence and validity of online businesses as statistical units must be confirmed to reduce non-response units. This means that only ‘active shop’ that can be included in the frame. However, making an active shop definition is not as simple as thought. Fake, dummy, seasonal, and non-transactional shops must be identified using a specific algorithm. Often, the problems not only come from the shop’s behavior but also from the data retrieving/scraping process. Therefore, an algorithm for making an active definition is an important step in making an online shop sampling frame.
Using the shop and item datasets, an item-level data algorithm is developed to determine whether a shop is active or not. The method for building the algorithm uses the Divide and Conquer Principle where a complex problem is divided into sub-problems that are easier to solve [21].
Item/product processing
The algorithm is built based on error types in marketplace data. Characteristics identification of both transaction and aggregate data are important in terms of making online shop sampling frame. These efforts are made with the aim of assessing the quality of data included in the frame.
Seasonal items
The shops with mostly seasonal items will raise contact information errors in the frame. When a shop is seasonal, i.e., not available every month, the URL address of the shop may not be available which will raise non-response rate of the survey. the changes in item monthly sales within the period will reflect the shop behavior in general. Therefore, seasonal items are used as parameters to define active shops.
The determination of seasonal items is done by calculating the ratio of monthly sales with the average sales of items in a year. Then, the first threshold is defined from the variance of the monthly sales ratio as
where
The variance threshold value is determined using the cumulative percentage of data that has been sorted by the variance value. In determining the threshold value should be done by considering the effect on the amount of data and the information that will be lost. If the specified threshold value is too small, a lot of data will be lost. On the other hand, if it is too large, the threshold cannot filter out the anomalies. The first threshold is defined as follows:
Minimum month contains transactions in a year
To determine the minimum number of months in a year for each item ID, the second threshold
To avoid losing important data, the determination of the threshold value cannot be mutually independent with
When the number of months Item ID is k and there are several items sold in
An example to get
In Table 1 the number of months is 4. The average annual sales will be
Here is the logical formulation:
where
The threshold value is determined by using the best incision between the logic above and the value of
Here is an example of logic in determining the second threshold
If the threshold value of the number of months is 4 then the variance is 3 ( If the threshold value for the number of months is 5 then the variance is 4 (
From the logic above, it can be concluded that the threshold value for
Non-unique item ID
As discussed, the behavior of items in the aggregate (shop-level) will reflect the characteristics of the shop. Non-unique item IDs will cause inconsistencies between items and their categories. In shop-level data, this anomaly will cause an error in deriving statistical units. This concept refers to guide 5.1.1.5 in [20]. The method used in identifying non-unique item IDs is by counting the distinct counts from each category, sub-category, sub-sub-category, and item name. Threshold values are used to determine the maximum number of counts from each category to a unique item name.
In general, there are 2 cases where the Item ID is not unique, they are:
Category/Sub-Category/Sub-Sub-category/Item Name is different, but the items sold are the same, and Category/Sub-Category/Sub-Sub-category/Item Name is different, and the items sold are different.
The second case can be handled with special treatment. Special treatment could be done by reencoding a non-unique Item ID, but this will make a mess in the data structure. So, at this stage, only extreme cases will be eliminated.
The third threshold
Active shops definition
From the threshold value that has been defined before, it will be used as a part of an algorithm for determining active shops in the marketplace. The development of the algorithm is done by modifying the Boyer-Moore Majority Vote algorithm. This action is reasonable because if only using the voting principle, the algorithm will eliminate important information on items that can pass a predetermined threshold value. For example, from threshold 1 to 3 say shop A is inactive, win by voting. Then, we will lose the remaining active items on those inactive labeled shops.
Therefore, the Boyer-Moore Majority Vote algorithm was modified by considering the following logic:
The active shop will be determined based on the characteristics of items sold, Threshold If in the shop there is no single item that meets the combined conditions of For threshold 3 ( The combination of If the combination of
From the logic above, the logic is formed as depicted in Fig. 1.
In the frame, revenue is used as an auxiliary variable and as a base calculation for SMEs classification. The auxiliary variable may be valuable in making a sampling design [22]. Therefore, it is important to check aggregated revenue. Revenue anomalies may lead to domain classification errors in the frame which should be avoided. The anomaly can be caused by the variable price of goods which is a component in revenue formation. So, a deep investigation until item-level data may be required.
The first step to check the revenue consistency by calculating a ratio between the revenue of month
where
After calculating the ratio for each month using the above method, the variance of the ratio is calculated for each Shop ID. Then, the variance is sorted from largest to smallest.
Discrepancies appear when describing revenue in the line chart. The revenue rose sharply in December 2020. From January to November 2020, the store’s revenue was only under 50 million rupiah, but in December it touched 400 million rupiah. In further analysis, the shops with this behavior were identified with the previous seasonal pattern technique. The only possible cause of the anomaly came from its components, namely the price and monthly sales of items. Therefore, deep-tracing to item-level data is highly recommended.
The following is data from item-level which caused Shop’s revenue to rise.
Anomaly in item data level
Active shop definition workflow.
Frame metadata
We can conclude from the table above, that the revenue anomaly in the shop level is caused by an anomaly in the item-data level. Upon further inspection, the item with that Item ID is a sunscreen product. The market price of sunscreen products with the appropriate brand is around 150 thousand rupiah. This raises suspicion about prices in the previous month which tend to be very small and unrealistic.
The frame produced consists of 13 attributes as shown in Table 3. The foreign key that connects the frame with other information related to items is Shop ID. The classification of enterprises using annual revenue is based on Indonesia law number 20 of 2008 about micro, small, and medium enterprise (SMEs). Because this frame is made from the online shop in the marketplace, the contact information is the URL and shop’s username which are unique and could be used as shop’s address. The metadata of the active shops is shown in Table 3.
The processed data from marketplace identified 101,443 online shops in the frame.
Unit proportion each SMEs.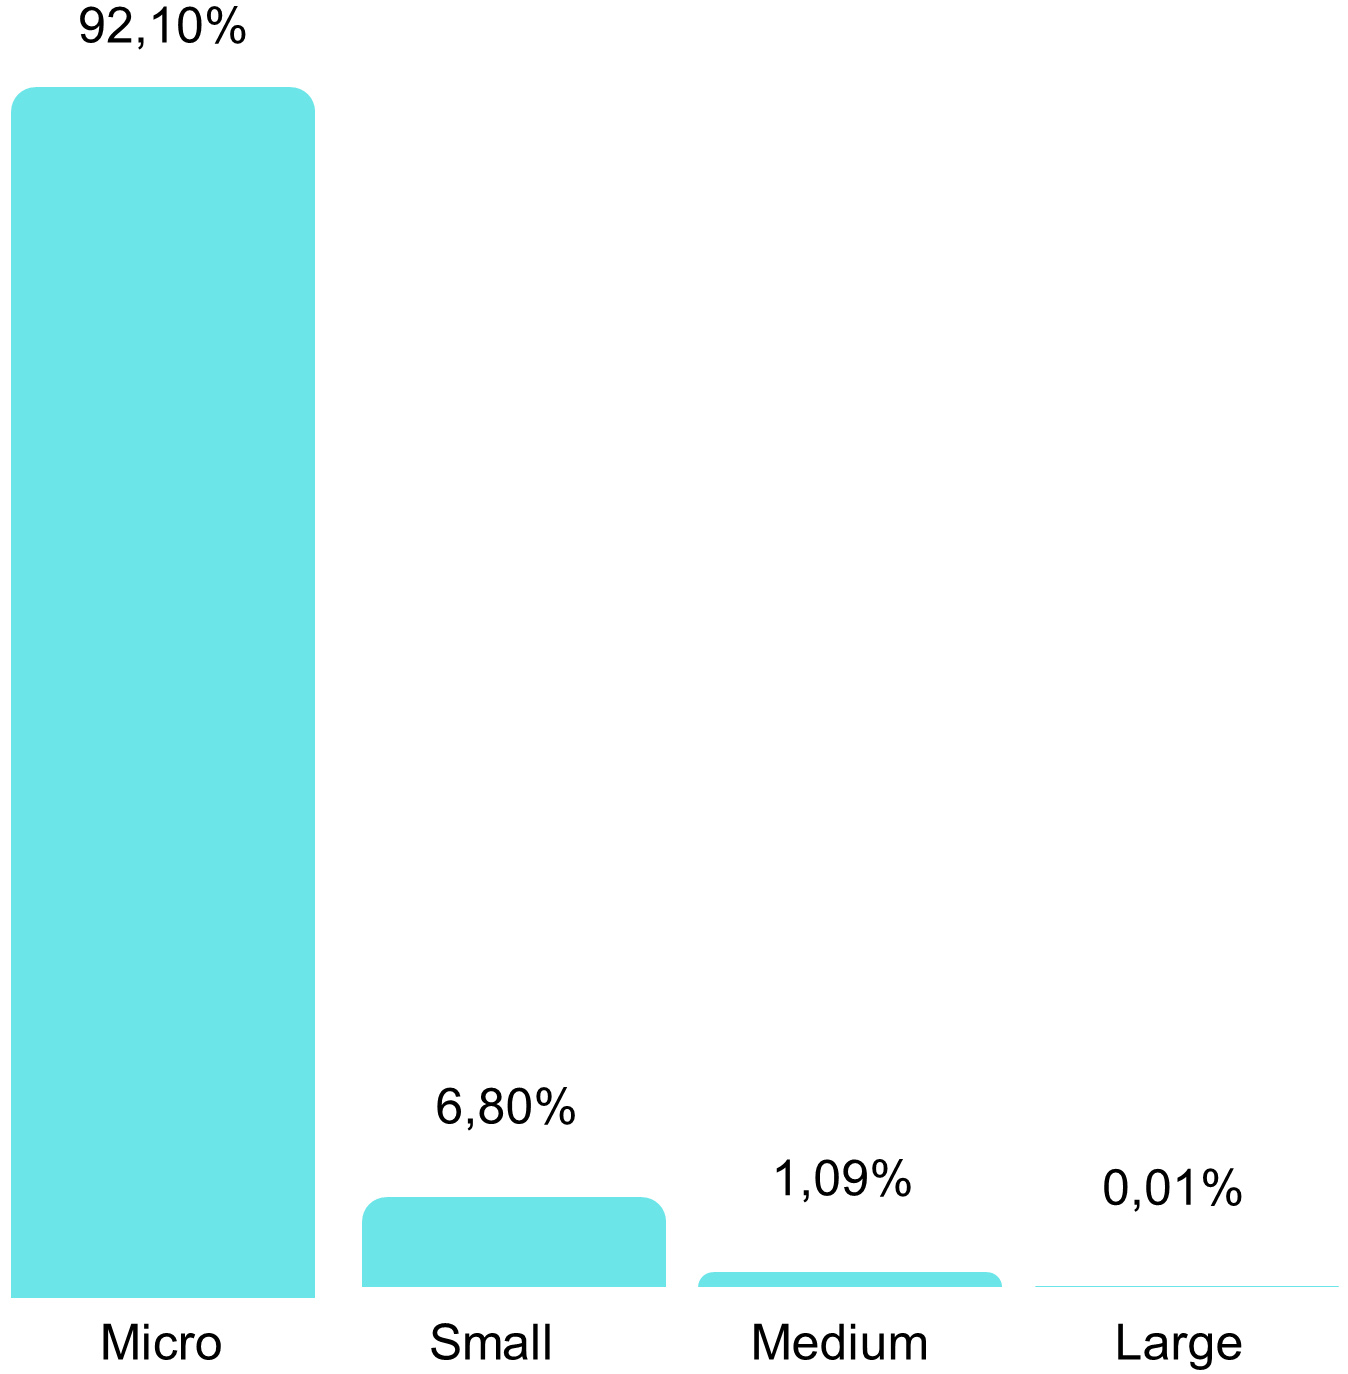
There were 92.10% of active online shops classified as Micro businesses with annual revenue of less than IDR300 million as shown in Fig. 2. Note that, in this study, the data was collected from the marketplace that had C2C (Customer to Customer) model business. Therefore, shops with micro business scale were more dominant in the frame. The current frame could be combined with other marketplaces with different business models, e.g., B2C B2B.
Proportion of active online shops included in the frame based on regencies in DKI Jakarta Province.
Figure 3 shows that most of online shops were based in West Jakarta (33.71%), whereas the least is listed in the Kepulauan Seribu regency. Plenty of businesses and shops such as Glodok, China town, and Mangga Dua, which are located in West Jakarta. These areas are popular as the center of small and large shops of electronics, house appliances, and other items.
The main reason for building active shop definition is to make the complexity of big data match with the definition of frozen frame in social statistics. In the Statistical Business Register frame, not all legal or administrative units lead to the creation of a statistical unit or are necessarily linked to a corresponding statistical unit. This happens. because a legal/administrative unit is dormant, or inactive, or the information to determine whether the unit is active is simply not available in the source data [17]. In the online shop sampling frame, this phenomenon occurs because the shop is inactive (no transaction within the period), marketing strategy to make fake rival, shops with hype, and many more. This is more complex when understanding frozen frames from big data. Therefore, the active shop algorithm is important.
From the result of this study, we show a new methodology for processing raw marketplace data to develop an online shop sampling frame. Every year, BPS Statistics Indonesia collects e-commerce data through a survey. However, the frame of the survey is not quite up-to-date and does not cover sufficient online businesses.
Although big data, i.e., marketplace data, have the potential in providing an up-to-date online shop frame, it needs to be processed to remove some anomalies, discrepancies, redundant, and unclear data.
A good sampling frame is complete, accurate, and up to date. Big data characteristics in general lead to a premise that marketplace data is up to date. Because transactions are made within a second, this frame may suit the short-term survey. This frame is a perfect match with the survey with the target population being online shopping in the marketplace. However, the completeness of this frame may lead to under-coverage if the target population is set for only e-commerce shops. But it is still possible to set e-commerce shops as the target population by combining this frame with conventional frames or other big data resources. The online shop sampling frame covers newly registered shops in the marketplace, the conventional frame covers an online business from the private platform (messaging platform), and other big data resources cover other platforms.
Now people are used to the virtual world. The COVID-19 pandemic also triggers cultural change to do online transactions. Nowadays, there so many transactions are performed online. This new method of building sampling frames from big data is highly needed in the future. Therefore, additional contact information that differs from other frames is needed to do a survey. On the internet, URL is used to express an address and a username is used as a shop’s unique identifier. Like e-mail and telephone numbers, the URL and the username can be used to contact the shops.
Physical address is important in the survey as an alternative or major in survey design. When it is necessary, frame enrichment can be done by combining it with other big data sources. To get a complete address, google maps is one of the good options, but in developing countries like Indonesia, the results may be far from our expectations. Society is still in the process to further steps in technology and economy. Indonesia is a unique country that has massive growth in the marketplace. Therefore, the coverage of the frame may differ in other countries.
In this paper, we present a new methodology for building a sampling frame from marketplace data. The procedure is developed by considering quality assessment. In producing a sampling frame, over-coverage is handled by generating an algorithm to make active shop definition As a concept of frozen frame, the algorithm only allowing allows active shop in the list. After applying the methodology, the frame was produced with 101,443 active online shop units in DKI Jakarta Province. When producing an online shop sampling frame, appropriate contact information may be optional according to data resources. Therefore, the URL and username can be a shop virtual address.
However, this research requires further development to enrich the frame and expand the frame’s coverage. The physical address may be required in other sampling designs. Hence, frame enrichment is recommended by adding other big data resources. Expanding frame coverage by joining with other frames or sources is needed if the target population of the survey expanded.
Footnotes
Acknowledgments
This research is funded by Politeknik Statistika STIS in collaboration with Directorate of Analysis and Statistical Development, BPS Statistics Indonesia.