



Abstract
This paper investigates the noise emissions from thin airfoils experimentally. An attempt has been made to study the effect of line distribution of 3 mm diameter holes adjacent to the trailing edge on noise emission characteristics. Thin airfoils having chord length and span of 150 and 240 mm, respectively, are considered for the investigation. The airfoil is subjected to the flow Reynolds number (defined based on the chord length of airfoil) in the range of 2.0 × 10⁵ to 5.0 × 10⁵, and angles of attack of 0°, 2°, and 4°. The spectral results indicate that the modified airfoil with holes is effective in minimizing the lower frequency noise (<3.5 kHz) compared to that of the reference airfoil. The reduction in the low-frequency sound pressure levels for the modified airfoil is found up to 5 dB. The modified airfoil with holes is ineffective in reducing the higher frequency noise components, and in fact, generated a broadband frequency noise at higher Reynolds number. From the spectral studies, a critical Strouhal number is estimated to be around 0.15 that defines the limiting value for the effectiveness of the modified airfoil. The overall sound pressure level studies depicted that the modified airfoil is effective at higher angles of attack with the reduction of around 1–2 dB. The noise generated from the thin airfoils is found to have the directivity towards the upstream.
Keywords
Introduction
Aerodynamic noise during landing and take-off is one of the foremost environmental concerns in the development of airport industry. The major sources of noise are the propulsion system of an aircraft and the structural airframe. Hefty attempts are being made to mitigate the noise emissions from aircraft since the invention of high-speed jet engines, and have led to immense progress in noise reductions. For instance, a by-pass turbofan engine introduced in 1970s drastically reduced the jet noise by around 20–30 dB 1 albeit these engines were introduced for their better fuel economy. Besides the noise emissions from the engine, significant noise is emitted from the structural airframes during their interaction with high-velocity flow, which is a major challenge of noise mitigation. The airframe related noise is dominant during the flow over landing gears, over-extended flaps and slats, wake vortex from the fuselage and wing, and the turbulent boundary layer growth in the airframe. The aerodynamic noise is highly related to the local flow characteristics over the surfaces and aircraft configuration. During the landing and take-off conditions, the noise emissions depend on aerodynamic force acting on the lifting surface, the inflow turbulence, boundary layer developed on the surface. The dominant noise emissions are observed in the case of the interaction of the turbulent wakes with the lifting surface. Numerous analytical research works have been carried in the mechanism of airfoil noise generation since Lighthill has put forward his classical theory on flow-interaction noise. Ffowcs Williams and Hall 2 analytically solved the sound radiated by the turbulent flow due to the presence of an edge of a half plane. They suggested that the intensity of the sound radiated from the edge is proportional to the fifth power of the free stream velocity. The sound radiated by the eddies in the fluid motion that are quadrupole in nature is amplified by the presence of a half plane, and eddies far away from the half plane do not affect the predicted far-field noise.
The turbulent eddies generated within the boundary layer passes the sharp trailing edge thus leading to the generation of noise. Howe 3 analytically studied the effect of vortex shedding in the turbulent boundary layer noise produced by the convected coherent flow structures. Brooks and Hodgson 4 conducted experimental studies and, developed a semi-empirical model to predict the turbulent boundary layer trailing edge noise from the surface pressures near the trailing edge. They have found good accordance with the measured noise spectra with the predicted noise spectra from the surface pressures and the theoretical model developed by Howe. 5 Brooks et al. 6 classified the aerodynamic noise from airfoils into five categories, namely the boundary layer trailing edge noise, vortex shedding noise, laminar boundary layer vortex shedding noise, separation and stall noise, and tip vortex noise. Four mechanisms among these noises are associated with the interaction of trailing edge with the convected vortices within the boundary layer. The scattering of the noise sources near the trailing edge is likely to be the dominant noise generation mechanism in the airfoil. Thus, the trailing edge noise is considered as a significant contributor of airframe noise. According to Howe, 5 the acoustic intensity radiated by the trailing edge is proportional to the product of the span-wise correlation length due to the turbulence near the trailing edge and the wetted length of trailing edge. Therefore, the geometric discontinuity at the trailing edge directly affects the sound radiated.
Effect of trailing edge modification
The role of trailing edge is important for the aerodynamic lift generation, and any modification on it will adversely affect the lift characteristics. For instance, modification of the trailing edge by making a hole, serrations, brushes, and so on is observed to reduce the coefficient of lift.7–9 However, all the above modifications have significantly contributed to the reduction of noise radiations from the airfoil. The aerodynamic noise radiation depends on the turbulent intensity which can be minimized by reducing the abrupt change in the acoustic impedance of the trailing edge. 10 The trailing edge alteration ensures a smooth trailing edge boundary condition that is capable of reducing the radiation efficiency. The brief review of the research works carried out with alterations in the trailing edge is discussed in the following. Several active methods like blowing/injecting a fluid at the trailing edge,11,12 plasma actuators, 13 and acoustic excitation based on the feedback mechanisms, 14 so on, are employed for noise reduction. However, active methods are uncommon since it makes the system complex and needs additional power requirements. In contrast, passive methods are simple and easily implementable, however, requires an extensive parametric study for the robust performance. Frequently employed passive methods include the retrofitting of trailing edge by a serrated plate, morphed trailing edge, a porous and perforated trailing edge, and so on.
Howe 15 conducted a theoretical study in trailing edge noise reduction using serrated trailing edge and developed a relationship between different serration parameters and noise reduction level in the high-frequency range. Contradictory to Howe’s theory, 15 Gruber et al. 16 and Oerlemans et al. 17 have experimentally shown that the trailing edge noise reduction is better in the lower frequencies range. Ai et al. 18 investigated the aerodynamic and aeroacoustic performance of a NACA 63–418 airfoil using morphing trailing edge. Controlling the flow over the airfoil surface using morphing structures considerably improved the reduction in the noise levels by altering the flow boundary layer. The noise reduction of around 3 dB is reported using such morphing structures. Bohn 19 conducted experimental studies in a flat plate to reduce the noise by inserting a porous extension at the trailing edge. The results showed that the maximum noise reduction is observed at a frequency proportional to the ratio of eddy convection velocity to extension length of the porous plate. Herr and co-workers20,21 studied the competence of different permeable trailing edge namely the comb and slit type in noise reduction and observed a reduction of around 2 to 10 dB. Trailing edge noise due to vortex shedding was eliminated by such modifications. Finez et al., 22 extensively studied the effect of trailing edge brushes in reducing the turbulent boundary layer trailing edge noise on a NACA65(12)–10 airfoil and reported about 3 dB reduction in the frequency range of 600 to 2000 Hz. However, in the high-frequency range, a re-circulating bubble near the leading edge increases the noise emissions. Geyer et al. 23 experimentally showed that air resistivity and surface roughness of the material affects the noise generated by a porous airfoil. Noise reduction of more than 10 dB was observed at low and moderate frequencies. The noise reduction is seen to strongly depend on the resistivity, and at high frequencies, porous airfoils generate more noise compared to the normal airfoil. Koh et al. 24 numerically studied the impact of porous surfaces on the turbulent structures and the aerodynamic sound near the trailing edge. A noise reduction of around 11 and 4 dB are noted for a trailing edge with a sharp corner and a semicircular trailing edge, respectively. Graham 25 described the silent flight of an owl, whose feat is contributed to the porosity and permeability features of an owl’s wing. In similar lines, Clark et al.26,27 experimentally studied the trailing edge noise reduction using the methodology inspired from the owl’s wing. They applied downy hairs in the upper surface to suppress the noise generated due to the roughness. The applied rough surface and canopies alter the turbulent features before it is scattered at the trailing edge. They have succeeded in the attenuation of around 10 dB over wide frequency range with minimum impact on aerodynamic properties. Fink and Bailey 28 investigated the noise emissions due to the wing-tip vortex using an airfoil with one of the side edges exposed to flow field. The side edge of the airfoil is made of the porous material in their study. This resulted in the reduction of the induced drag and noise generation by lowering the pressure fluctuations at the side edge. The effect of porosity and elasticity of the trailing edge in the generation of aerodynamic noise were mathematically studied by Jaworsky and Peake. 29 They suggested that the far-field acoustic power scales dependence could be changed from U5 for an impermeable rigid edge to U6 and U7 for porous and elastic edges, respectively, by an appropriate selection of porosity and elasticity. Weidenfeld and Manela 30 numerically studied the effect of permeability on the low-frequency noise from airfoil and observed the noise reduction by 10%. Jiang et al. 31 experimentally studied the effect of integrated porous trailing edge on rotor blades and reported that the porosity and pore aspect ratio has a significant influence on the sound absorption and edge scattering, and observed noise reduction in the frequency range between 1 and 7 kHz.
It is a well-understood fact that the convective flow structures over an airfoil interact with the sharp trailing edge leading to the noise generation. Therefore, the modifications in the airfoil trailing edge influence the turbulent length scales, and disrupts its scattering mechanism. 15 Numerous researchers have modified the airfoil trailing edge by introducing the serrations, porosity, brushes, poroelastic extensions and so on, and observed the noise reductions up to 3–5 dB in the lower frequency range. In congruence with the above works, the present paper describes the following modification in the trailing edge of the airfoil for noise reduction. A line distribution of small holes closely towards the upstream of the trailing edge is proposed as the modification in the airfoil. This distribution of holes is expected to passively modify the flow and noise characteristics leading to an overall noise reduction from the airfoil. Albeit numerous works related to porous trailing edges are encountered in the literature, this study demonstrates the change in the noise morphology by a minor modification at the trailing edge with minimum losses in the aerodynamics characteristics, 8 and such investigations are not reported before.
Experimental methodology
Experimental facility
Experiments are carried out in an in-house fabricated semi-anechoic open-jet wind tunnel facility having the working space of 2.6 m × 2.6 m as shown in Figure 1. Walls of the semi-anechoic chamber are acoustically treated with polyurethane wedges of 30 cm long to absorb the incident sound waves. The anechoic room provides a reverberation free environment above 300 Hz. Blower is used to supply the air to the test section using a cubic contoured rectangular nozzle with exit dimensions of 200 mm × 20 mm and a contraction ratio of 9:1. The flow velocities are measured using the Pitot-static based digital anemometer probe, and a maximum free stream velocity of 60 m/s can be attained at the test section. Noise measurements are carried out using the microphone placed at 90° above the mid-span of the trailing edge at a far-field distance of 0.6 m. The acoustic data are recorded by a ¼” free-field condenser microphone (PCB make; model no. 378C01), having the sensitivity of 2 mV/Pa, at a sampling rate of 150 kSa/s. The data acquisition is done by the NI-PCI-6143 DAQ card connected to the computer using LabView software. The power spectral density of the acoustic signal is computed with a time window of 4096 points weighted by a Hanning window and 50% overlap, resulting in a frequency resolution of Δf = 36.62 Hz. Further, the directivity study of the airfoil noise is carried using the angular traverse arm. The microphone is traversed from 30° to 140° from the jet axis, and data are acquired at an interval of 10° as shown in Figure 1.
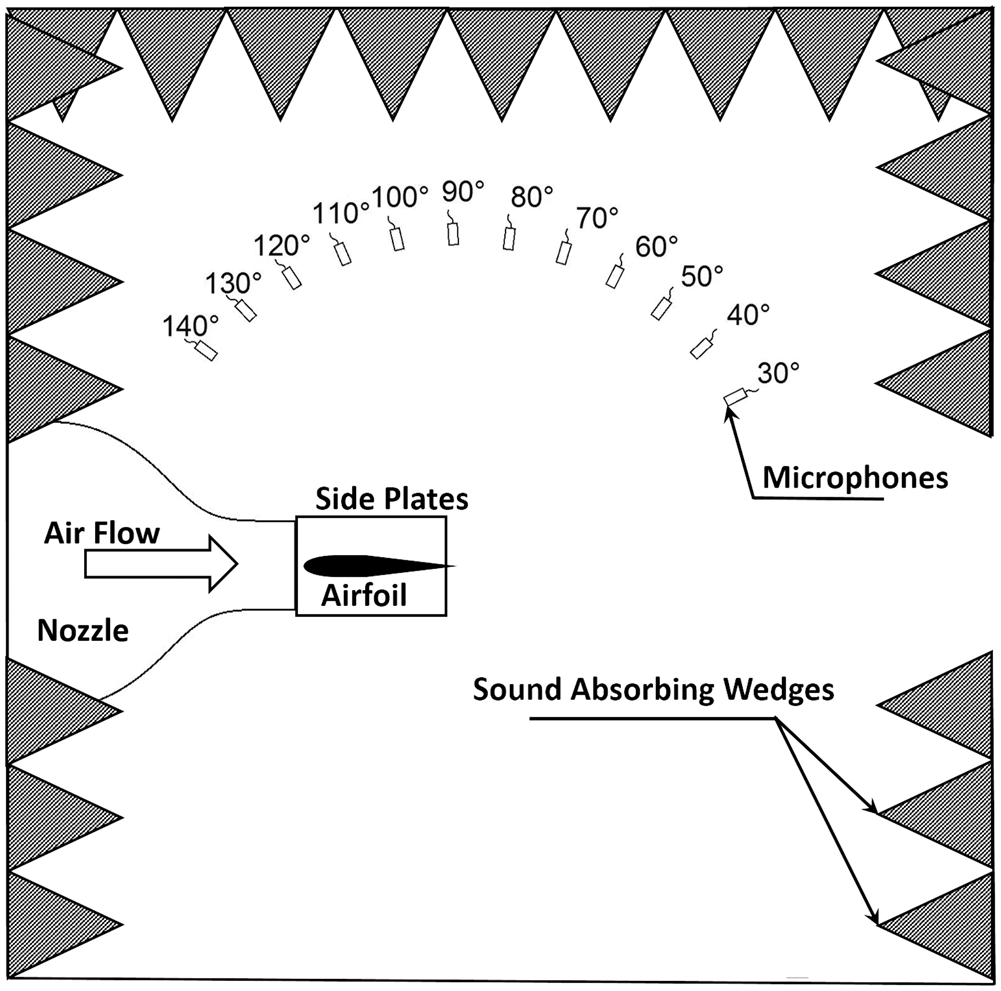
Schematic of the experimental setup.
Airfoil models
A thin airfoil model with a line distribution of holes adjacent to the trailing edge is fabricated for the acoustic studies as shown in Figure 2. The diameter (d ) of the holes is 3 mm that are drilled upstream at a distance of 10 mm from the trailing edge. The center-to-center distance of the successive holes is 8 mm. The noise emission characteristics of the modified airfoil are compared with the reference/base airfoil without the holes. These airfoils have the chord and span lengths of 150 and 240 mm, respectively. The thickness of the airfoil is 4.5 mm, which is 3% of the chord length that classifies these models under thin airfoil category. The leading edge of the airfoil is elliptical with a semi-major axis of 6 mm and minor axis of 4.5 mm. The trailing edge angle of the airfoils is 5°, and the care is taken while fabrication to ensure an adequate sharpness in the trailing edge to avoid the possible vortex shedding. The trailing edge thicknesses are found to be 0.085 and 0.248 mm for the reference and modified airfoils, respectively, and the surface roughness (Ra) of the reference and modified airfoils are 0.13 and 0.234 μm, respectively.

Thin airfoil with holes adjacent to trailing edge (a) schematic and (b) photograph. All the dimensions shown are in mm.
The airfoil models are placed in the free stream at a distance of 5 mm from the nozzle exit plane as shown in Figure 3. This is to ensure that the noise contribution due to the leading edge of the airfoil is insignificant. 32 The free stream velocity (U∞) is varied in the range of 23 to 52.7 m/s, and the corresponding Reynolds number (defined based on chord length) in the range of Rec = 2.0 × 10⁵ to 5.0 × 10⁵. The boundary layer over the airfoils is turbulent at this range of Reynolds number. 33 However, to ensure this fact, flow over the airfoil is tripped using a roughness tape of 100 grit size and 10 mm width pasted on either side of the airfoil at a distance of 20% of the chord length from the leading edge. The acoustic spectra obtained in both these cases are observed to have the same acoustic levels thus corroborating the turbulent flow regime over the airfoil (Figure 4). The acoustic emissions from the airfoils are recorded at geometric angles of attack (α) of 0°, 2°, and 4°. In addition, the airfoil is placed between the two side plates thus arresting the wing tip flow, and approximating the flow over the airfoil as two dimensional.

(a) Experimental setup showing the mounted thin airfoil inside anechoic chamber (b) view of the contour nozzle and airfoil used for the study.

Spectra comparison between the tripped and un-tripped airfoil at α = 0° and Rec = 5.0 × 10⁵.
The overall sound pressure levels (OASPL) values are repeatable within the range of ± 1.0 dB at all the Reynolds number and different microphone locations. The uncertainty in the hole diameter drilled at the trailing edge is ± 0.1 mm. The angles of attack and angular positions are accurate within ±0.1° and ±1°, respectively. The spectral and noise levels analyses are carried out in the chosen frequency range of 300 Hz to 10 kHz, since the former value being the cut-off frequency of the anechoic chamber, and no dominant noise components are seen beyond the latter frequency value.
Results and discussion
This section describes the results of the experiments carried out with the airfoils at different Reynolds number and angles of attack. In addition, the noise components are extracted in the two frequency ranges, namely the lower and higher frequency range, and are compared with the reference airfoil. The OASPL and the directivity studies are carried out to get further insights. To stress the insignificance nature of background noise compared to the airfoil noise, a typical comparison of spectra at a zero angle of attack and Rec = 5.0 × 10⁵ is shown in Figure 5. It is evident from the figure that the background noise spectra is lesser by around 20 dB/Hz compared to the noise from the airfoils, especially at the frequencies less than 4 kHz, where the trailing edge noise dominates. Further acoustic results are explained in the following sections.

Spectral comparison of airfoil at α = 0° and Rec = 5.0 × 10⁵.
Spectral comparison studies
Figure 6 shows the far-field acoustic spectra with the Reynolds number for the reference and modified airfoils at 0° angle of attack. The noise levels are observed to increase with the Reynolds number for both the airfoils. However, the following results are distinct in comparing the acoustic spectra of the two airfoils. In case of the reference airfoil (Figure 6(a)), the noise variation with Reynolds number is observed to be dominant up to the frequency of 3.5 kHz, and beyond this frequency, the noise levels are almost same at all the Reynolds number.
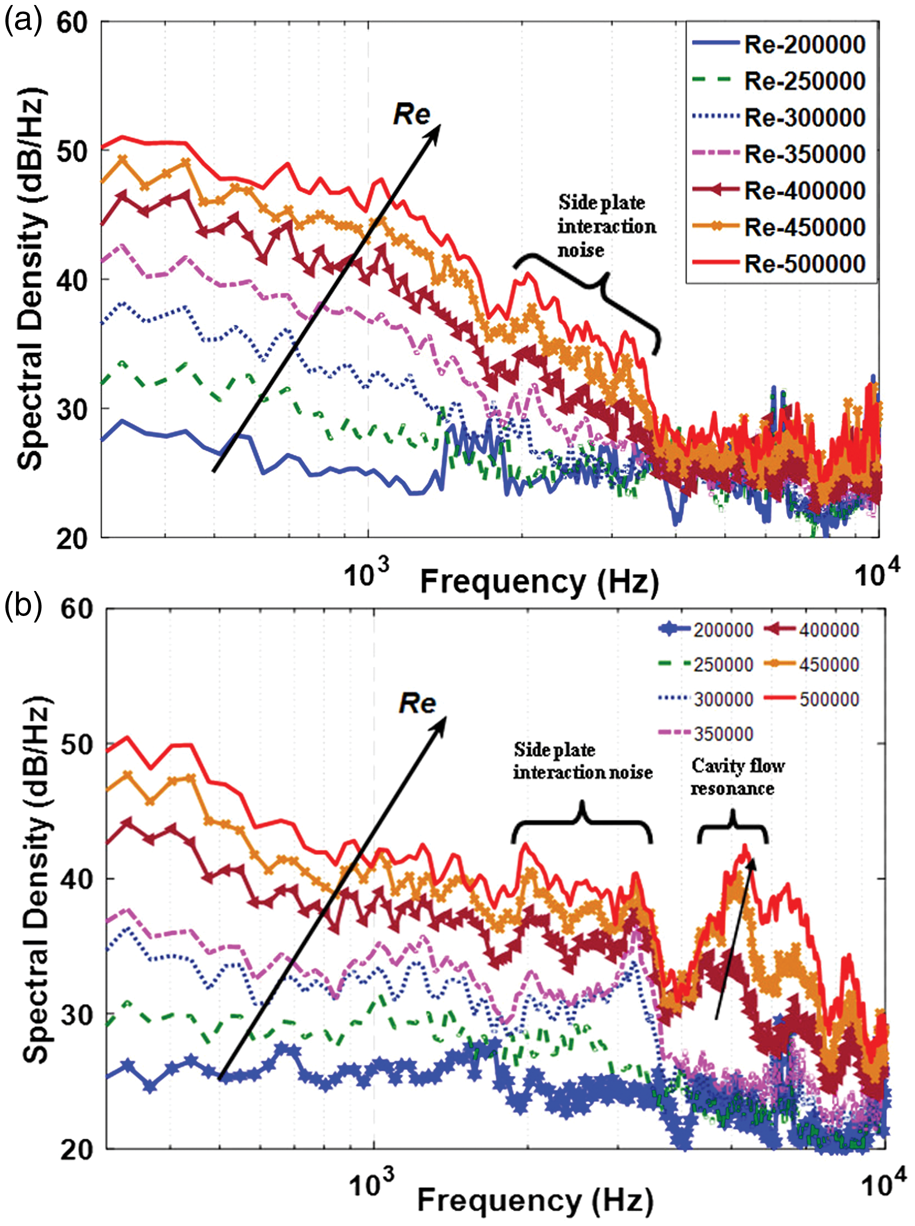
Far-field acoustic spectra at α = 0° for (a) reference airfoil and (b) airfoil with holes.
In the case of modified airfoil (Figure 6(b)), the spectra up to 3.5 kHz showed the similar behavior as that of the reference airfoil. However, in the higher frequency range (>3.5 kHz), a broadband noise is observed at the Reynolds number above 4.0 × 10⁵. This noise is supposed as the effect of holes in the modified airfoil as this is not noticed in the case of the reference airfoil. To confirm the above mentioned fact, the modified airfoil is tested at the Reynolds number of 5.0 × 10⁵ by plugging the holes, and its spectrum is compared with that of the reference airfoil as shown in Figure 7. The figure reveals that the noise spectra for the above airfoils are the same thus inferring the fact that higher frequency noise components (>3.5 kHz) observed in Figure 6(b) are due to the presence of line distribution of holes. A high amplitude broadband peak is observed at the frequency of 5.3 kHz at the Reynolds number of 5 × 10⁵ for the modified airfoil. It is conjectured that this frequency component is due to the presence of holes which are acting as the circular cavities subjected to a constant velocity freestream. This leads to the cavity flow resonances generated by a feedback mechanism between the acoustic and hydrodynamic disturbances. This frequency component is known to be dependent on hole diameter and the Reynolds number (Figure 6(b)). To substantiate the fact of frequency dependence on the hole diameter, similar experiments are carried out with the airfoil having the line distribution of holes of 4 mm diameter, and the spectral comparison at the Reynolds number of 5.0 × 10⁵ is shown in Figure 8. A shift in the primary peak from 5.3 kHz to 4.4 kHz is noticed with increase in the diameter thus confirming the presence of hole as the reason for the formation of this noise component. The corresponding Strouhal number estimated based on the hole diameter is found to be around
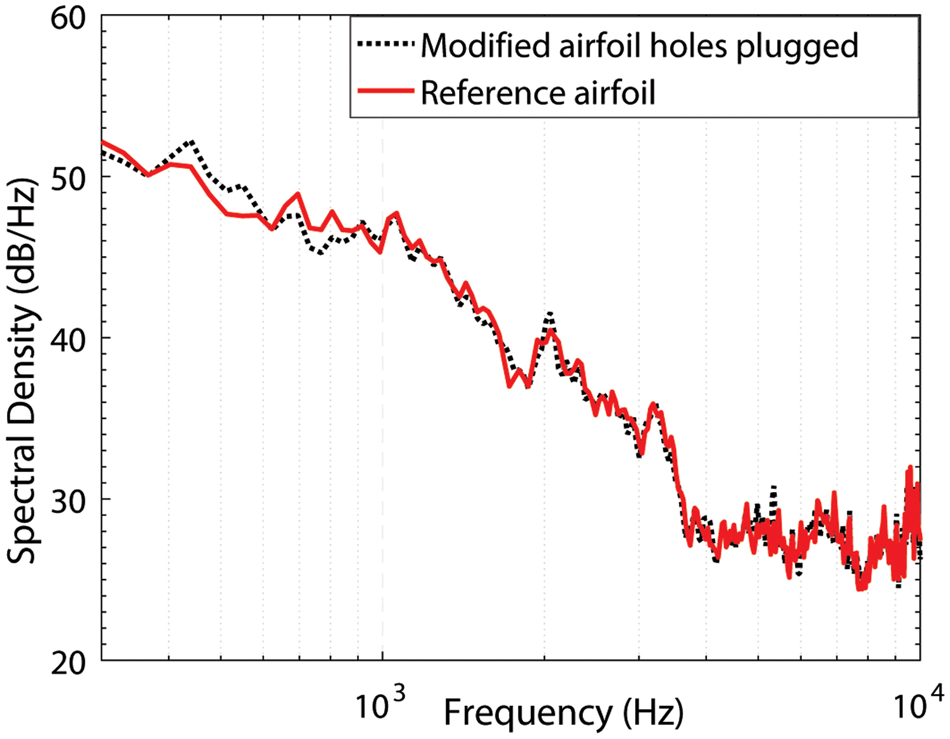
Comparison of spectra for the reference and modified airfoils with plugged holes.
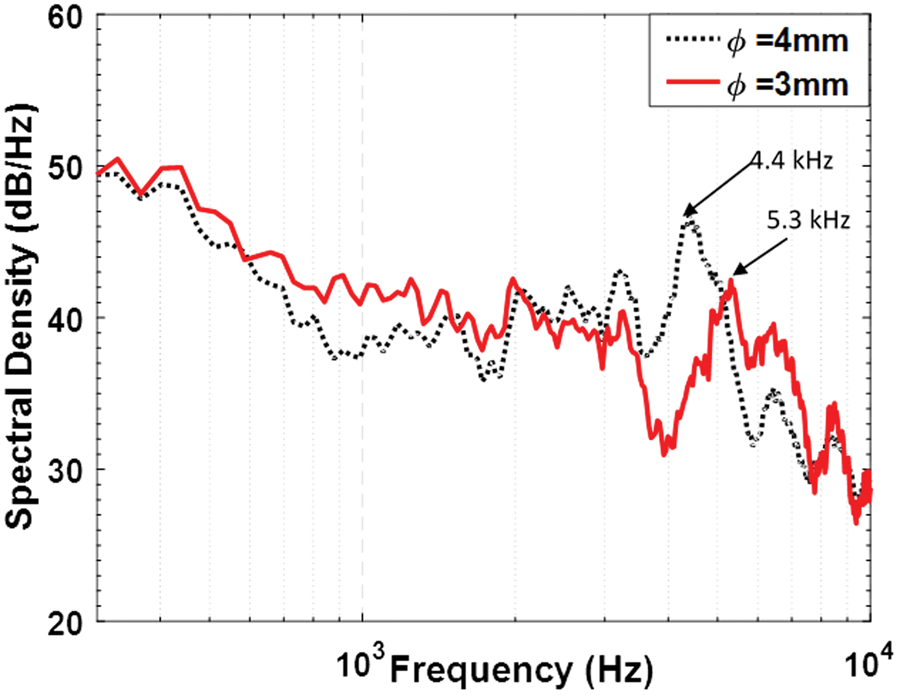
Spectra of modified airfoils with 3 mm and 4 mm diameter holes.
Figure 9 shows the spectral contours with Reynolds numbers at different angles of attack of α = 0°, 2°, and 4°, for the reference and modified airfoils. It is evident from the contours of the reference airfoil (Figure 9(a), (c) and (e)) that the low-frequency noise components are seen to be dominating, and gradually increasing with the Reynolds number at all angles of attack. However, in the case of modified airfoil, the noise components are observed to be distributed in a wider frequency range (Figure 9(b), (d) and (f)).
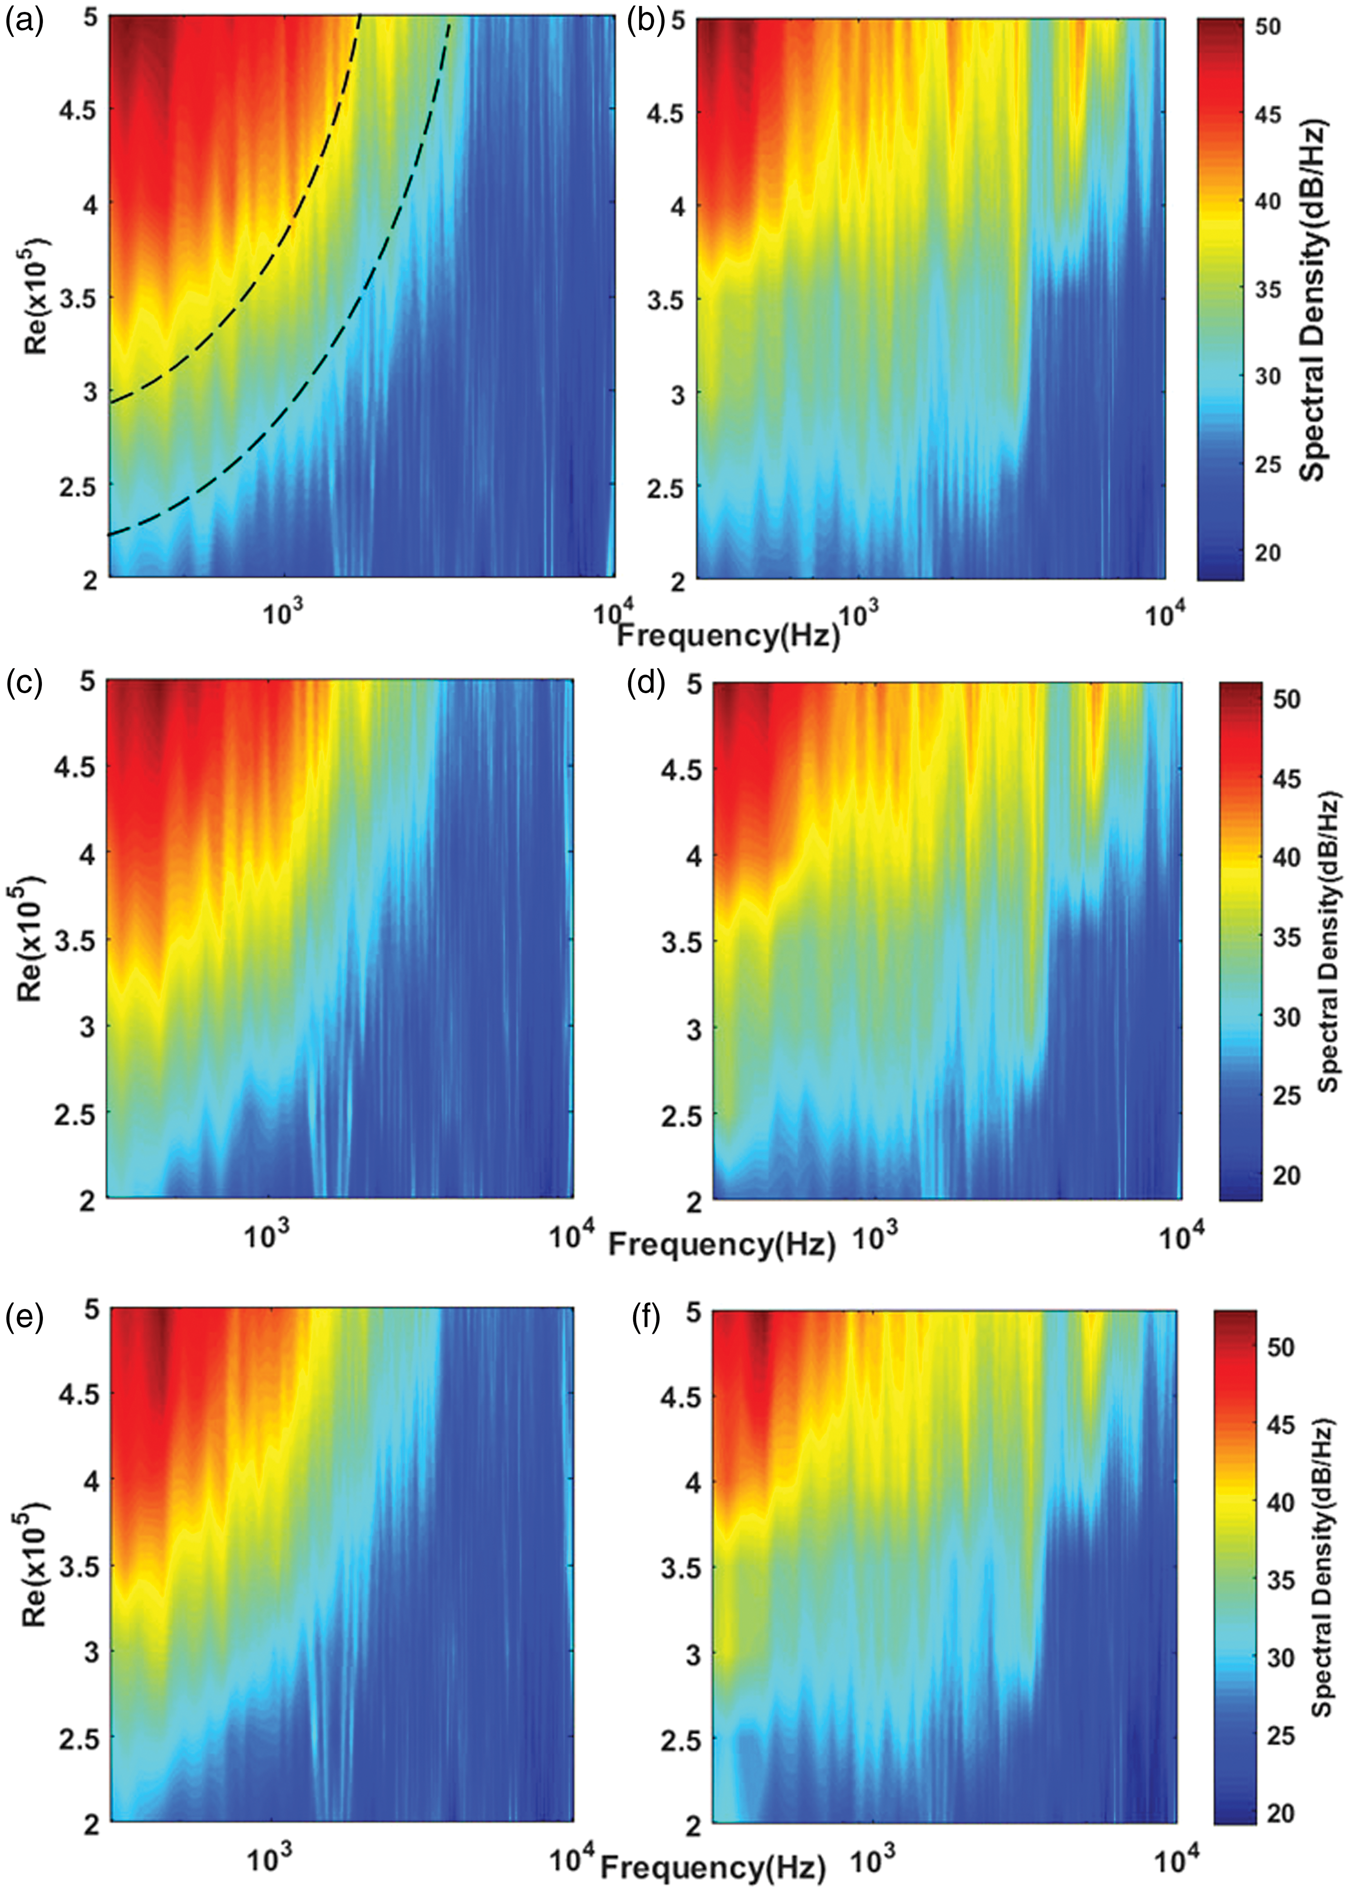
Contour plots of spectra at α = 0° (a and b), α = 2° (c and d), and α = 4° (e and f) for reference airfoil (a, c and e) and modified airfoil (b, d and f).
The dominancy in the higher frequency noise at larger Reynolds number is observed in the case of the modified airfoil. In the reference airfoil (Figure 9(a)), the low-frequency noise is noted to be smoothly varying with Reynolds number as indicated with the dashed line in the Figure 9(a) which is not the case with modified airfoils. To get a better understanding on this low-frequency noise variation with Reynolds number, the spectra are plotted with the Strouhal number as discussed in the following. Figure 10 shows the spectra comparison of the modified and reference airfoils at different Reynolds numbers at 0° angle of attack. In these plots, the spectral density is plotted against the Strouhal number (Stδ), estimated based on the boundary layer thickness (δ) at the trailing edge
34
using the relation, equation (1).

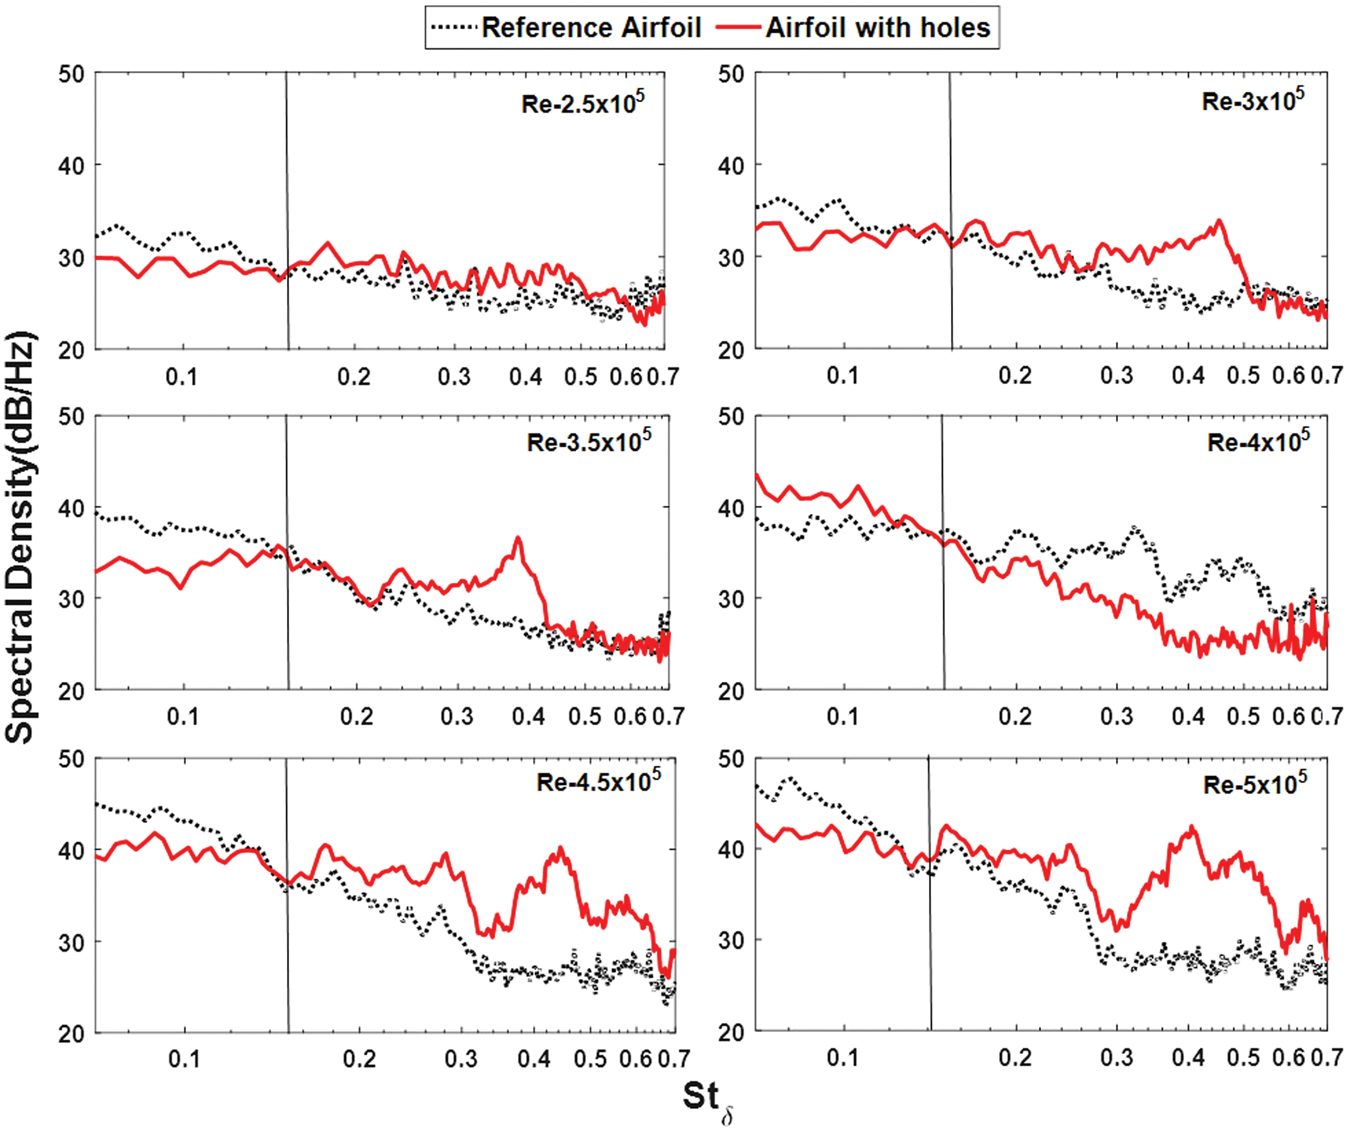
Far-field acoustic spectra of the reference airfoil and airfoil with holes at different Reynolds numbers at 0° angle of attack.
The boundary layer thickness (δ) over the thin airfoil can be considered as a turbulent flow over a flat plate at zero pressure gradient which can be estimated using the equation, equation (2).
35

It can be observed from the figure that for the Strouhal number, Stδ < 0.15, the noise levels of the modified airfoil are lesser compared to those of reference airfoil, and at Stδ > 0.15, the former noise levels are higher. The reason for this is depicted to the presence of holes in the trailing edge. Since the lower frequency noise components are due to the large scale turbulent eddies formed over the airfoil, the holes in the trailing edge enhance the scattering of the large-scale structures and thus lowering the noise levels. Subsequently, the holes distribution assists in increasing the large frequency noise components as the large-scale eddies at the trailing edge are disintegrated to the small-scale turbulent structures. The high-frequency noise components are observed to increase with the Reynolds number (Figure 10).
Figure 11 depicts the spectral contour showing the reduction in the sound pressure levels (SPL) for the modified airfoil with the Reynolds number at 0° angle of attack. The reduction in the sound pressure levels (SPLRed) is expressed as the difference between the sound pressure levels of reference airfoil (SPLRef) and the sound pressure levels of the modified airfoil (SPLMod), as shown in the relation, equation (3).

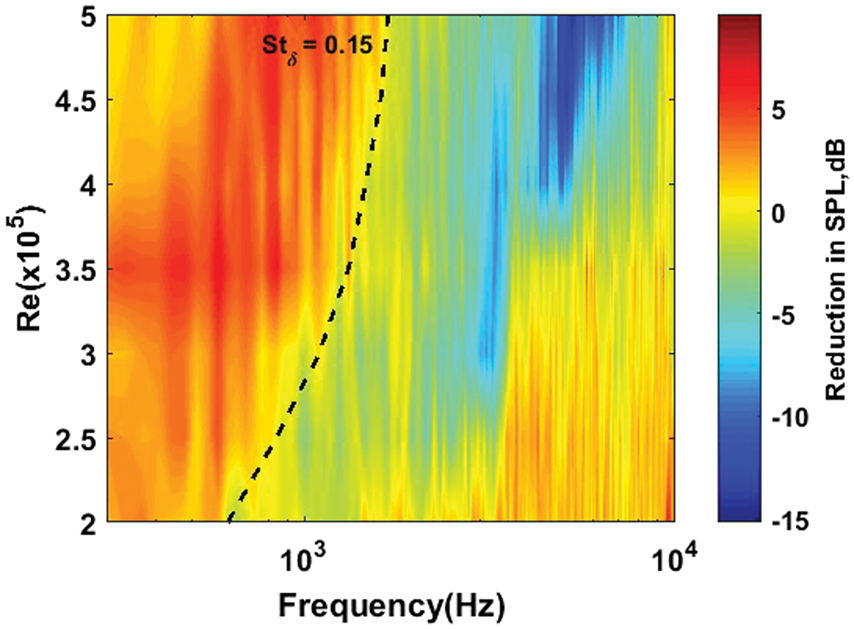
Contour plot of the reduction in noise level at α = 0°.
It is evident from the contours (Figure 11) that the noise levels in the lower frequency range have reduced by about 6 dB indicating that the airfoil with holes largely reduced the noise at all the Reynolds number. The SPLRed in the lower frequency range gradually increased with increase in Reynolds number. At the Reynolds number of 2.5 × 10⁵, the SPL reduction is up to the frequency of 842 Hz. As the Reynolds number increased to 5.0 × 10⁵, the SPL reduction occurs up to 1.7 kHz as noted from Figure 11. The dashed line in the contour of Figure 11 connects the loci of all the frequencies where SPLRed is zero. The corresponding frequencies are termed as critical frequencies. The Strouhal numbers calculated based on these critical frequencies and boundary layer thickness at the trailing edge are found to be almost constant, Stδ = 0.15, and is termed as critical Strouhal number. The critical frequency is seen to increase with a higher gradient at the lower Reynolds compared to that at the higher Reynolds number (Figure 11).
Sound pressure level studies
Figure 12 shows the variation of OASPL with the Reynolds number at different angles of attack of 0°, 2° and 4° for the modified and reference airfoils. The OASPL is calculated by integrating the mean-square acoustic pressure

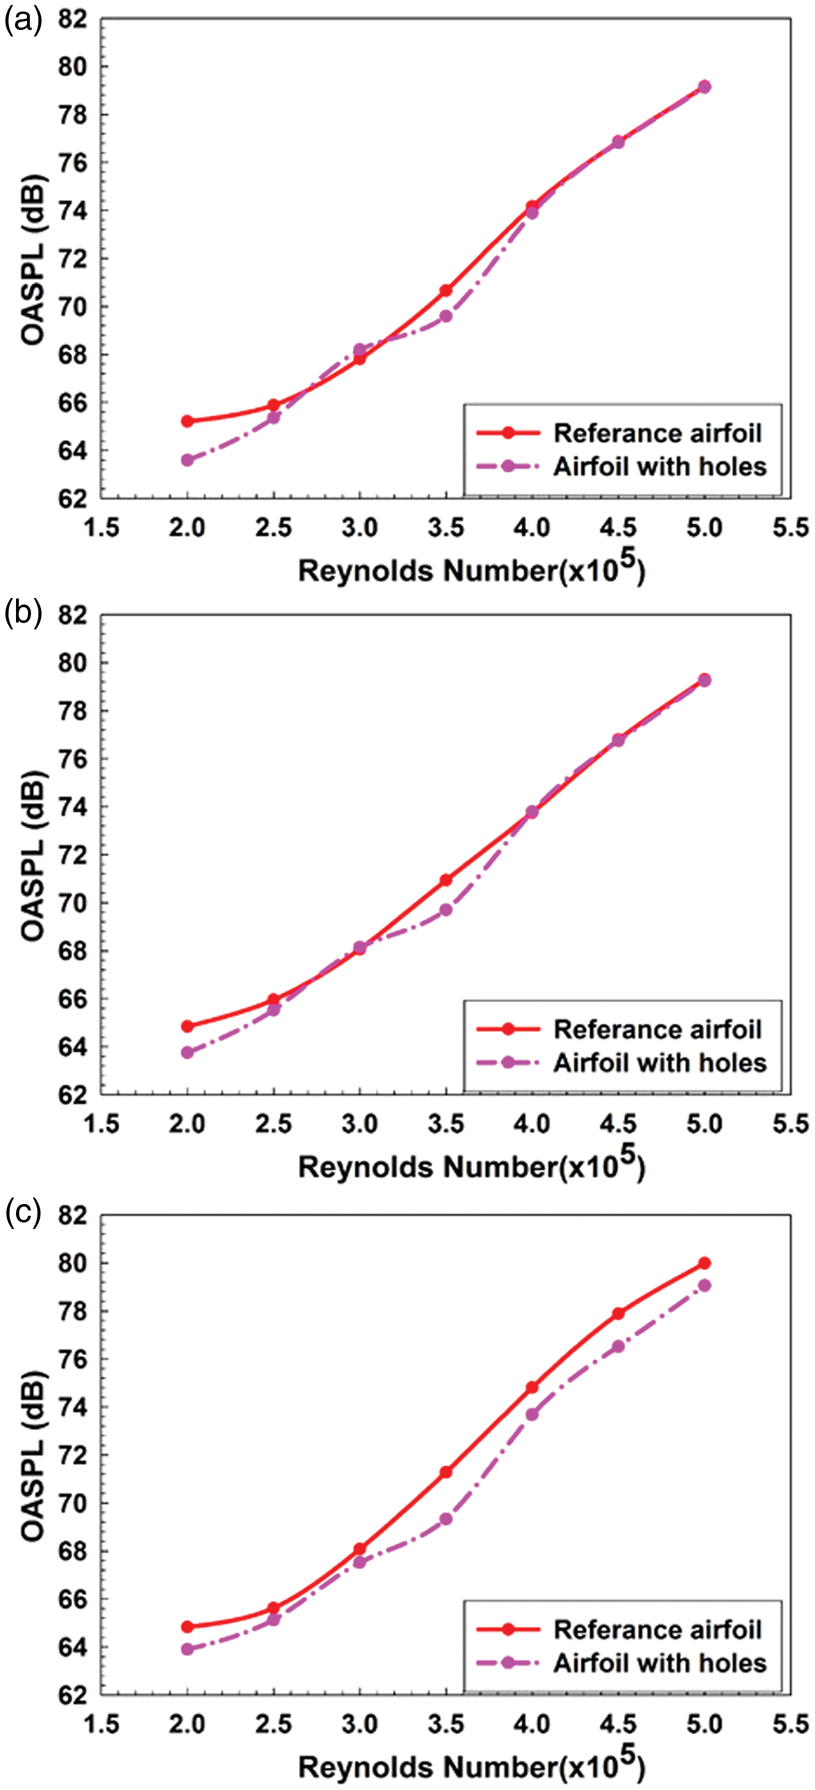
Overall sound pressure level variation with Reynolds number at angles of attack of (a) α = 0° (b) α =2° (c) α =4°.
At the lower angles of attack of α = 0 and 2°, the modified airfoil is observed to have a similar OASPL compared to those of the reference airfoil. The larger difference in the OASPL between the two airfoils is observed at α = 4°, where the noise from the modified airfoil is lower by 1–2 dB compared to that of the reference airfoil. Thus, the advantage of holes adjacent to the trailing edge can be sought when operating at higher angles of attack. Albeit the OASPL reductions are seen to be smaller, a significant reduction is observed in the lower frequency range (Figure 9) for the modified airfoil. To quantify the noise emissions from the low- and high-frequency sources, the SPL are estimated considering the frequency range below and above the critical frequency, respectively, as represented in Figure 13.
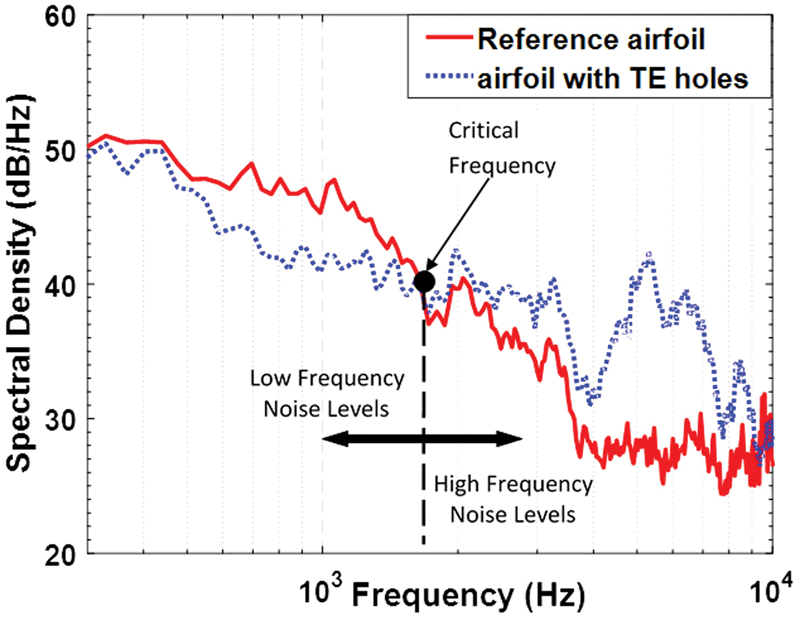
Typical spectrum indicating the region considered for low- and high-frequency noise levels.
Figure 14 shows the low- and high-frequency SPL with the Reynolds numbers at different angles of attacks. Interestingly, at Reynolds number of 2.0 × 10⁵, the low-frequency SPL is lower by almost 10 dB compared to the high-frequency SPL at all the angles of attack for both the airfoils. This indicates that at lower Reynolds number more noise contribution is from the higher frequency noise components. The low-frequency SPL of the reference airfoil is seen to increase with the Reynolds number from 55 dB to almost 80 dB, while the higher frequency SPL variation is from 65 to 70 dB at all the angles of attack. This indicates that the lower frequency components dominate the overall noise levels for the reference airfoil. Another interesting observation is that the low-frequency SPL of the modified airfoil is lesser by 2–3 dB compared to those of reference airfoil at all the Reynolds number and angles of attack. However, the high-frequency SPL of the modified airfoil gradually increases with the Reynolds number compared to the reference airfoil, and the difference of around 5–6 dB is observed at the Reynolds number of 5.0 × 10⁵ at all the angles of attack. This signifies that the modified airfoil is better in reducing the lower frequency noise components, however ineffective in higher frequency noise reduction. On comparing the high- and low-frequency SPL for the modified airfoil, it can be observed from Figure 14 that their difference is larger (around 8–10 dB) at lower Reynolds number, and both attains almost similar SPL at Reynolds number of 5.0 × 10⁵, thus indicating that contribution of low- and high-frequency noise components for an airfoil with holes is same at higher Reynolds number.

Variation for lower and higher frequency range for reference and modified airfoils at (a) α = 0° (b) α = 2° and (c) α = 4°.
Directivity studies
To assess the characteristics of the acoustic source at the trailing edge, the noise directivity is plotted in the Figures 15 to 17 at different Reynolds numbers and angles of attacks. Figure 15 shows the directivity pattern at the Reynolds number of 2.0 × 10⁵ at angles of attack of 0°, 2°, and 4°. The directivity measurements are carried in the angle range of 30° to 140° from the jet exit axis. In the downstream, the noise emission from the modified airfoil is lower compared to that of the reference airfoil while the higher noise levels are noticed in the upstream (∼130°) with the former. The difference in the noise emissions between the two airfoils is more at α = 2 and 4°. In addition, at all the Reynolds number, the noise levels in the upstream are found to be higher compared to the downstream for both the airfoils indicating that directivity of the acoustic sources is dominant towards the upstream. 36

Directivity plots of the reference and modified airfoils at (a) α = 0° (b) α = 2° (c) α = 4° for Rec = 2.0 × 10⁵.
Figure 16 shows the directivity pattern at Reynolds number of 3.0 × 10⁵ at angles of attack of 0°, 2°, and 4°. At this Reynolds number, the noise emissions from airfoil with holes are larger compared to the reference airfoil at angles of attack of 0° and 2°, and the noise dominance is observed at the upstream angle of around 130°. At α = 4°, the downstream noise patterns of both the airfoils are almost similar.
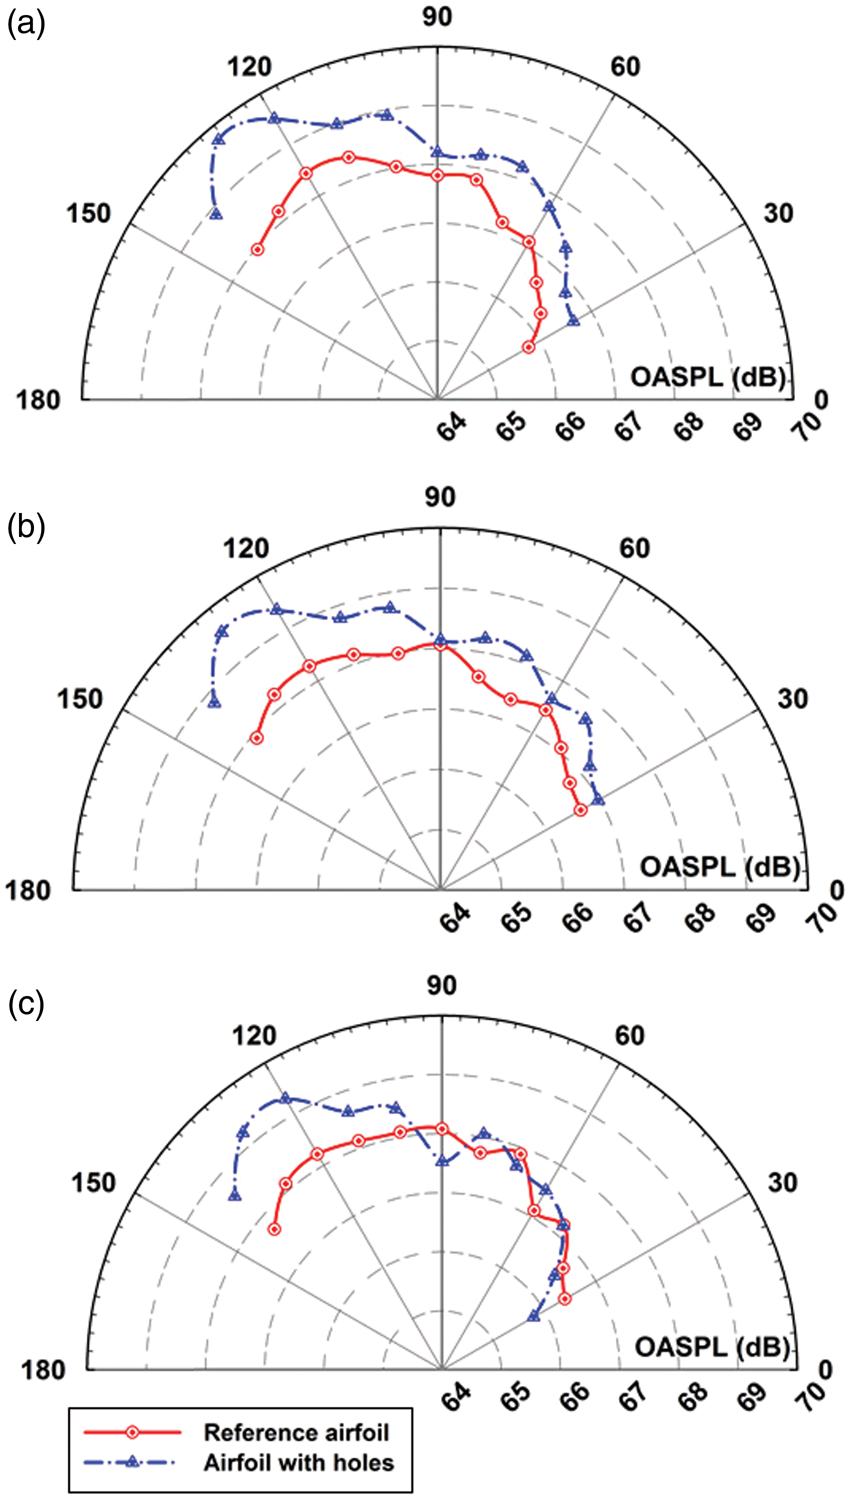
Directivity plots of the reference and modified airfoils at (a) α = 0° (b) α = 2° (c) α = 4° for Rec = 3.0 × 10⁵
Figure 17 shows the directivity pattern at the Reynolds number of 5.0 × 10⁵ at angles of attack of 0°, 2°, and 4°. In these directivity plots, a dipole acoustic source in the cardioid pattern is observed which is similar to the one observed by Ffowcs Williams and Hall. 2 At α = 0 and 2°, the noise emissions from the modified airfoil are slightly higher compared to the reference airfoil. However, at α = 4°, the modified airfoil has lower noise levels at most of the directivity angles. Thus, the advantage of providing the holes adjacent to the trailing edge of an airfoil is found at the higher angles of attack.
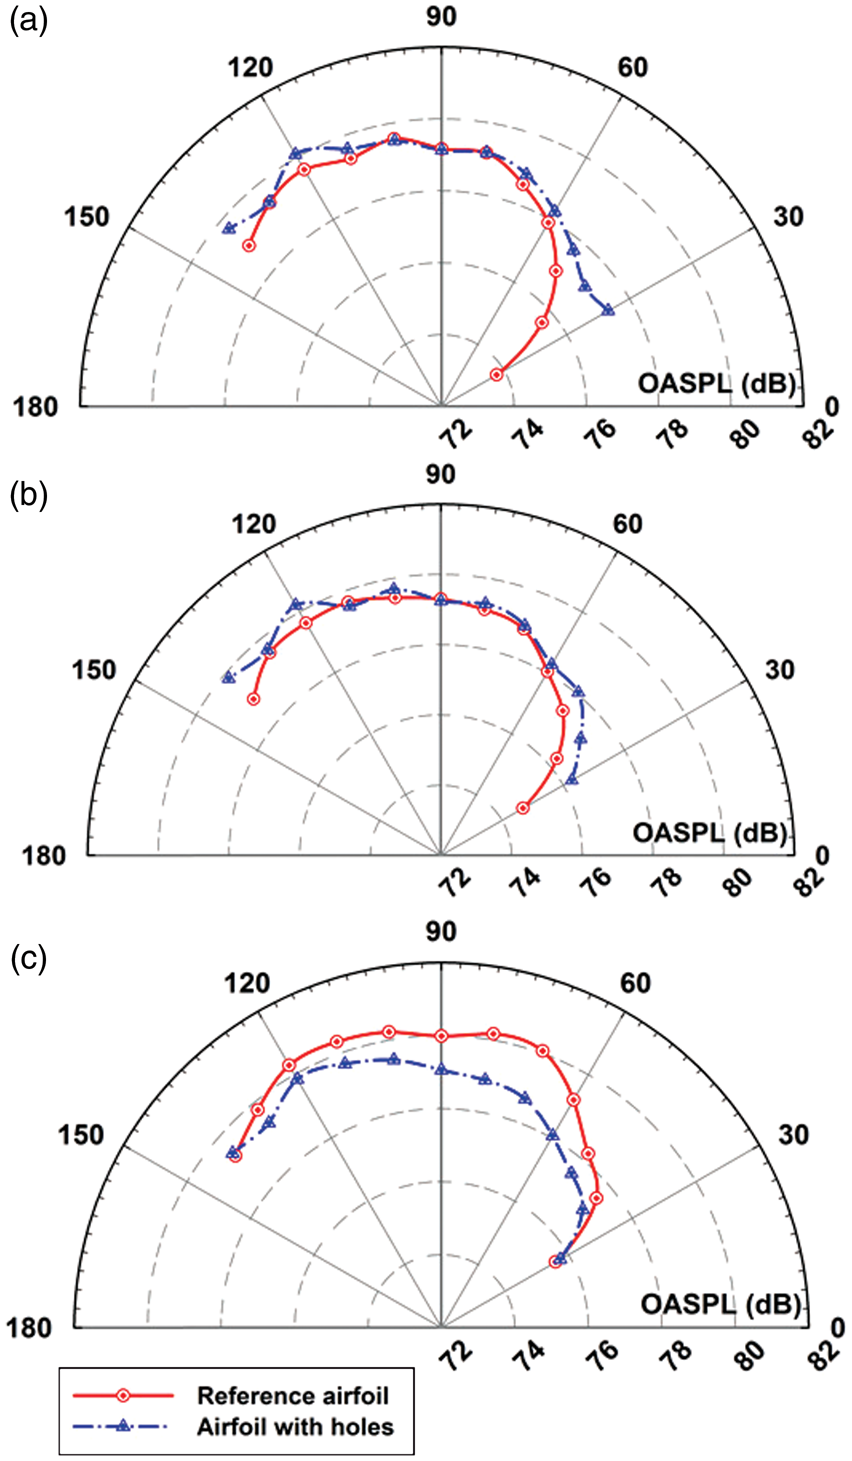
Directivity plots of the reference and modified airfoils at (a) α = 0° (b) α = 2° (c) α = 4° for Rec = 5.0 × 10⁵.
Conclusion
A comprehensive study has been carried out to investigate the acoustic performance of an airfoil with a line distribution of 3 mm diameter holes slightly upstream to the trailing edge. Experiments are conducted at the Reynolds number in the range of 2.0 × 10⁵ to 5.0 × 10⁵ at the angles of attack values of 0°, 2°, and 4°. The airfoil noise is characterized in terms of spectra, SPL, and directivity. The spectral study reveals that the airfoil with holes is better in reducing the lower frequency noise components at all the Reynolds number. The maximum reduction of up to 5 dB is noticed at the higher Reynolds number. It is conjectured that the holes in the modified airfoil disintegrate the large-scale turbulent structures to small-scale eddies thus reducing the low-frequency noise levels. Contrastingly, the higher frequency noise dominated by almost 6 dB in the case of modified airfoil compared to its counterpart. Thus, the reduction in the lower frequency noise and an increase in the higher frequency noise levels of the modified airfoil made the OASPL almost similar to that of the reference airfoil at lower angles of attack. The benefit of utilizing the modified airfoil is noted at α = 4°, where the OASPL reduction of up to 2 dB is noticed. From the spectral studies, a critical Strouhal number, defined based on the boundary layer thickness, is estimated to be around 0.15, below which the modified airfoils noise is found to be lower than its counterpart. Directivity study reveals that the acoustic source is dipole with cardioid pattern, and the acoustic directivity is towards the upstream at higher Reynolds numbers. In overall, an airfoil imposed with a line distribution of holes near the trailing edge can help in mitigating the lower frequency noise components, however, with a compromise in enhancing the higher frequency noise.
Footnotes
Declaration of conflicting interests
The author(s) declared no potential conflicts of interest with respect to the research, authorship, and/or publication of this article.
Funding
The author(s) disclosed receipt of the following financial support for the research, authorship, and/or publication of this article: The authors acknowledge the funding support from the Department of Science and Technology-Science and Engineering Research Board (DST-SERB), grant No. SB/FTP/ETA-0137/2013.