
Abstract
Is there an opposition bias in ballot initiative campaigns? While some early research suggested that the “no” side was advantaged in ballot initiative campaigns, recent work has demonstrated that both opposition and support spending in ballot measure campaigns are effective. We offer a new way to conceptualize status quo orientation in ballot measure elections. Specifically, we argue that opposition arguments are more effective than support arguments because of the well-known framing negativity bias and not because the starting position for uninformed voters is to default to no. We present the results of two survey experiments to test the impact of support and opposition arguments in ballot initiative campaigns. We find consistent evidence that opposition arguments are effective in generating more “no” votes and that support arguments are ineffective in generating more “yes” votes.
Keywords
Introduction
Citizens in states that have ballot initiatives experience a fundamentally different campaign environment than citizens in states that only have candidate elections. The very nature of ballot initiative elections, voting on issues instead of candidates, means that spending in these contests is largely unrestricted. In 2016 alone, over $1 billion was spent in ballot measure campaigns, 1 and this spending was especially concentrated in citizen initiative contests. How then, do citizens make sense of ballot initiative campaigns in this robust information environment?
While a great deal of literature addresses this topic, the findings are not entirely consistent. Early research suggested that, at the individual level, uncertain or confused voters would default to the status quo in initiative elections by voting “no” (Bowler and Donovan 1998). Corroborating this finding, others suggested that campaign spending had an asymmetric effect on voting; spending on the “no” side was seen as highly effective, and spending on the “yes” side was seen as highly ineffective (Lowenstein 1982; Magleby 1984), especially when that spending was by economic interest groups (Gerber 1999). Recent research, however, has suggested that early conclusions about the asymmetric effect of money in initiative elections were mistaken. Because spending is often endogenous to campaigns, 2 previous studies have underestimated the effect of spending on the yes side. Both Stratmann (2006) and de Figueiredo, Ji, and Kousser (2011) find that when corrections are made for endogeneity, the interest group and spending activities in ballot initiative campaigns both for and against measures coincide with more votes for and against measures, respectively. Rodgers and Middleton (2015) report evidence from a randomized precinct-level field experiment in Oregon where citizens were sent direct mail explaining arguments for and against ballot measures before voting. The mailers proved to be statistically and substantively significant, appearing to change people’s votes in ten of the twelve measures considered in the field experiment.
Based on early studies finding that at the individual level, voters were biased toward the status quo position and at the aggregate level, money exerted an asymmetric effect on voting in ballot measure elections, scholars concluded that ballot initiative voters are careful, thoughtful, and that citizens were not duped into supporting policies that favor narrow well-financed interests. Without evidence of this asymmetry, can we reconcile the seemingly contradictory findings from individual- and aggregate-level research?
In this article, we examine if individuals respond to cues both in favor and against measures in a similar manner. That is, do voters have a baked-in status quo bias that makes them resistant to new information urging them to vote yes on ballot initiatives? Our theory places status quo orientation in ballot measure elections in the framing literature, where we conceptualize this behavior as consistent with the well-known negativity bias. Our data come from survey experiments on six ballot measures questions: three of these questions are from a survey of Massachusetts registered voters conducted during the 2012 General Election, and three of these questions come from hypothetical ballot questions posed to a national sample of adults in May of 2013. The results of the experiments suggest that exposure to an argument in favor of ballot initiatives has no discernible positive effect on support for measures, while exposure to an argument opposing ballot initiatives consistently reduces support for that measure. Furthermore, political uncertainty, which we approach with a few different measurement strategies, does not lead to a higher probability of voting against ballot questions. While these findings are important for the academic literature, they are also applicable to practitioner decision making about how to spend precious resources in persuasion campaigns in ballot question elections. Our findings suggest that persuasion techniques will be more effective in opposition to, rather than in favor of ballot measures.
Framing and the Negativity Bias
The finding from recent research that money has a symmetric and significant effect on the outcome of ballot measure contests (de Figueiredo, Ji, and Kousser 2011; Rodgers and Middleton 2015; Stratmann 2006) poses a theoretical conundrum. Previous literature connected early asymmetric effect findings in the literature to other well-cited strands of research. Taken together, several empirical findings contributed to a larger story about the careful, thoughtful, and reasonable low-information voter, even when that voter is presented with a more complicated choice environment, like voting on ballot initiatives.
In reviewing this literature, Lupia and Matsusaka (2004) write that, “without preexisting public support, the financial resources of business groups are ineffective in changing the status quo, and the financial resources of most citizen groups are too scarce to bring about much change.” They then go on to connect the finding of the asymmetric effect of money to studies of individual-level voter decision making (Bowler and Donovan 1998; Lupia and McCubbins 1998; Matsusaka 2004). For instance, Bowler and Donovan (1998) argued that when individuals are uncertain, they are more likely to vote “no” on a given measure, reflecting a ceteris paribus status quo bias. This research was further connected to the findings from Lupia (1994) and Lupia and McCubbins (1998) that voters can make reasonable choices in complicated information environments with small pieces of information, and findings from Matsusaka (2004) that suggest that policy making by ballot initiative is largely majoritarian and does not reflect skillful attempts of nefarious minority interest groups to buy their preferred policies at the ballot box. However, this summary of the literature now stands in opposition to several recent studies; as de Figueiredo, Ji, and Kousser (2011, 509) conclude, “campaign finance is not the source of the status quo bias that may exist in American direct democracy.” They add that, “because business groups and other interests with money to spend can greatly increase an initiative’s chances of passage, observers are right to be concerned about the ability of moneyed interests to ‘buy’ favorable policy” (de Figueiredo, Ji, and Kousser 2011, 509).
While the literature has historically connected studies on the effect of money in ballot initiative campaigns to the status quo bias, these effects are not measured at the same level of analysis. 3 To equate the findings about the aggregate effects of money to individual level phenomena is to commit the ecological inference fallacy. Money can be effective in generating both yes and no votes in a direct democracy campaign, but voters may still have a status quo bias. That is, they may respond to messaging in different ways. Bowler and Donovan (1998) argued that in the face of uncertainty, initiative voters would default to the status quo position. That is one way to conceptualize status quo orientation. This conceptualization says that an individual who has given little thought to an issue or is confused might be more likely to oppose a measure simply because they lack context and information on the arguments for and against a measure or on the placement of important cue-givers (e.g., Lupia and McCubbins 1998); as they gain information, their certainty will increase leading to a higher likelihood of acceptance of the yes position. In directly trying to test this, Binder (2009) finds that confused voters are no more likely to vote “no” than voters that are not confused. However, we propose an alternative perspective on the status quo “no” orientation that is not connected to a lack of information; rather, a voter who acquires new information might be more likely to accept negative information than positive information.
This contention is well-supported in the literature on negativity bias—that is, that “negative events are more salient, potent, dominant in combinations, and generally efficacious than positive events” (Hibbing et al. 2014; Rozin and Royzman 2001, 297; see also Baumeister et al. 2001). The negativity bias theory posits that responses tend to be stronger and people tend to pay more attention to negative stimuli and events than positive stimuli and events (Hansen and Hansen 1988; Kahneman and Tversky 1979; 1984). The findings of this literature find negativity bias to be rampant in people’s daily interactions with the world. Biological studies also support that both the autonomic and central nervous systems are measurably higher when exposed to negative than positive stimuli (Rozin and Royzman 2001). These findings have also been supported by the framing literature. When frames are relative to a status quo position, there is a strong tendency of negative frames to overwhelm positive frames (Kahneman, Knetsch, and Thaler 1991; Samuelson and Zeckhauser 1988) because negative framing causes feelings of anxiety (Arceneaux 2012). Experimental research finds strong evidence of negativity bias even on highly politicized issues (Bolsen, Druckman, and Cook 2014). Given this, we proceed with our first and central hypothesis:
Recall that another way to conceptualize status quo orientation is that the status quo no position is favored by those who are uncertain (Bowler and Donovan 1998). Beyond the empirical work of Binder (2009), there are some additional theoretical reasons to doubt the logic behind this position. Most notably, there are some issues which tend to elicit a knee-jerk positive reaction. These issues, often called “valence issues” (e.g., Stokes’ 1963; 1992), are issues where voters tend to share a common preference, even if there has not been widespread discussion on these topics. Common examples of valence issues include creating jobs, caring for the elderly, being tough on crime, and favoring democratic forms of government (Kahn and Kenney 1999).
The theoretic perspective we have presented suggests that status quo orientation occurs dynamically; that is, uncertainty about a ballot initiative is likely to be generated through campaign information, not from a fixed starting point. Because of this, we do not expect that voters with greater fixed levels of uncertainty would be more or less likely to vote no on ballot measures. So, while we set up Hypothesis 2, based on Bowler and Donovan’s (1998) theory, we do not expect to find support for it:
The difficulty, to be sure, is in capturing ballot initiative uncertainty in measurement. If we were, for instance, to ask voters about their certainty about a given ballot measure, and then subsequently ask how they were planning to vote, the measure of uncertainty would be endogenous to their answering “don’t know,” in the survey. Ideally, we are looking for an exogenous measure of uncertainty. We conceive, then, of several different ways to operationalize uncertainty. The first way is with a general measure of uncertainty based on an individual’s factual level of information about politics constructed using a classic scale of general questions of political awareness. While this measure has been used in countless studies (Zaller 1992) and powerfully predicts differences in political behavior, some have criticized its validity in capturing actual political sophistication (Lupia 2015). An alternative way to measure uncertainty in ballot initiative races is with a proxy measure of political uncertainty in other political races. Each of our two experiments provides an alternative way to operationalize political uncertainty, leading us to be able to test two different measurement strategies. We also consider and discuss the role that education as another potential proxy for voter sophistication plays in voting on ballot initiatives.
A final piece of our argument regards issue type. Carmines and Stimson (1980) argue that there are two “faces” of issue voting: hard and easy issues. “Easy issues” are those which are understood by the public at an emotional “gut level,” are “symbolic rather than technical,” are “more likely to deal with policy ends than means,” and that are “long on the political agenda” (Carmines and Stimson 1980, 80). In short, easy issues are those where there is likely to be a strong top-of-the-head response based on a voter’s predispositions. “Hard issues,” are those that require relatively high levels of political sophistication, education, and/or effort to understand (Carmines and Stimson 1980). The moral stakes of hard issues and their potential impact on citizens’ vital interests must be understood at a much more abstract level than is the case with easy issues. As Evans and Pearson-Merkowitz (2012) explain, issues such as taxation, labor and employment, financial regulation, and natural resource and land use are all “hard” in nature and the debates surrounding these issues rarely make it into the information environment. Even when they do, most people are unaware of the details of these arguments. The unfortunate consequence of the “easy/hard” dichotomy is that people tend to interpret “hard” as meaning “difficult.” While “easy” issues do require very little thought, it is not because the issues are actually simple. Instead it is because the voter has received so many cues on the issue and the issue is so well positioned in the political sphere that voters can locate where they are in an ideological space by just looking at a single word. Abortion is the classic example here. Abortion as a policy is not simple. It encompasses many different medical procedures, and applies to many different medical scenarios. It also, prior to the passage of Roe v. Wade, was highly supported by most groups except Catholics (Nossif 2001). However, after Roe v. Wade the issue was forced on the political scene by a set of political entrepreneurs. Today, it is a litmus test for both parties and the issue is discussed in almost every legislative and presidential election, and Supreme Court nomination (Evans and Pearson-Merkowitz 2012). In effect the issue has “evolved” to one that clearly divides the electorate and the political parties (Adams 1997; Mctague and Pearson-Merkowitz 2013). As a result, voters have well-defined beliefs in this area and do not have to think about the issue.
However, on issues that regardless of their complexity have received little or no political attention, the very same voter has to think about the issue because they have not been privy to any political discussion on the topic, either because it is a new issue to the political scene or because it is simply not covered by the press and is not been put on the agenda by political elites. The issue is not necessarily difficult, it is just foreign to voters’ political ideology and requires some thought.
Because when issues remain on the political agenda for a long period and tap into gut value structures, people’s views tend to become crystalized (Carmines and Stimson 1980, 80) we hypothesize that voters will generally be more resistant to change their opinions on these issues:
Research Design
We designed two experiments to test our hypotheses about the existence of negativity bias and the status quo “no” vote in ballot initiative elections. Our general approach is to ask respondents of their vote intention or support for a ballot measure, comparing a control group to two treatment groups. In both experiments, in the first treatment, respondents are cued with a short argument in favor of the measure, while in the second treatment, they are cued with a short argument in opposition of the measure. The control group received no cues in opposition or support on the item and was just asked if they would support or oppose the ballot measure. Full question wording for the experiment is available in Tables 1 and 2. This allows us to test our central hypothesis, that opposition arguments are more persuasive on ballot initiatives than supportive arguments. In both experiments, we provide a test of Hypothesis 2, each with a different operationalization of political uncertainty owing to the challenges in measuring this construct. Across the two experiments, we consider six issues, split evenly into the hard/easy issue classification. 5 This gives us some insight to evaluate Hypothesis 3.
Study 1 (Massachusetts) Control/Treatment Question Wording.
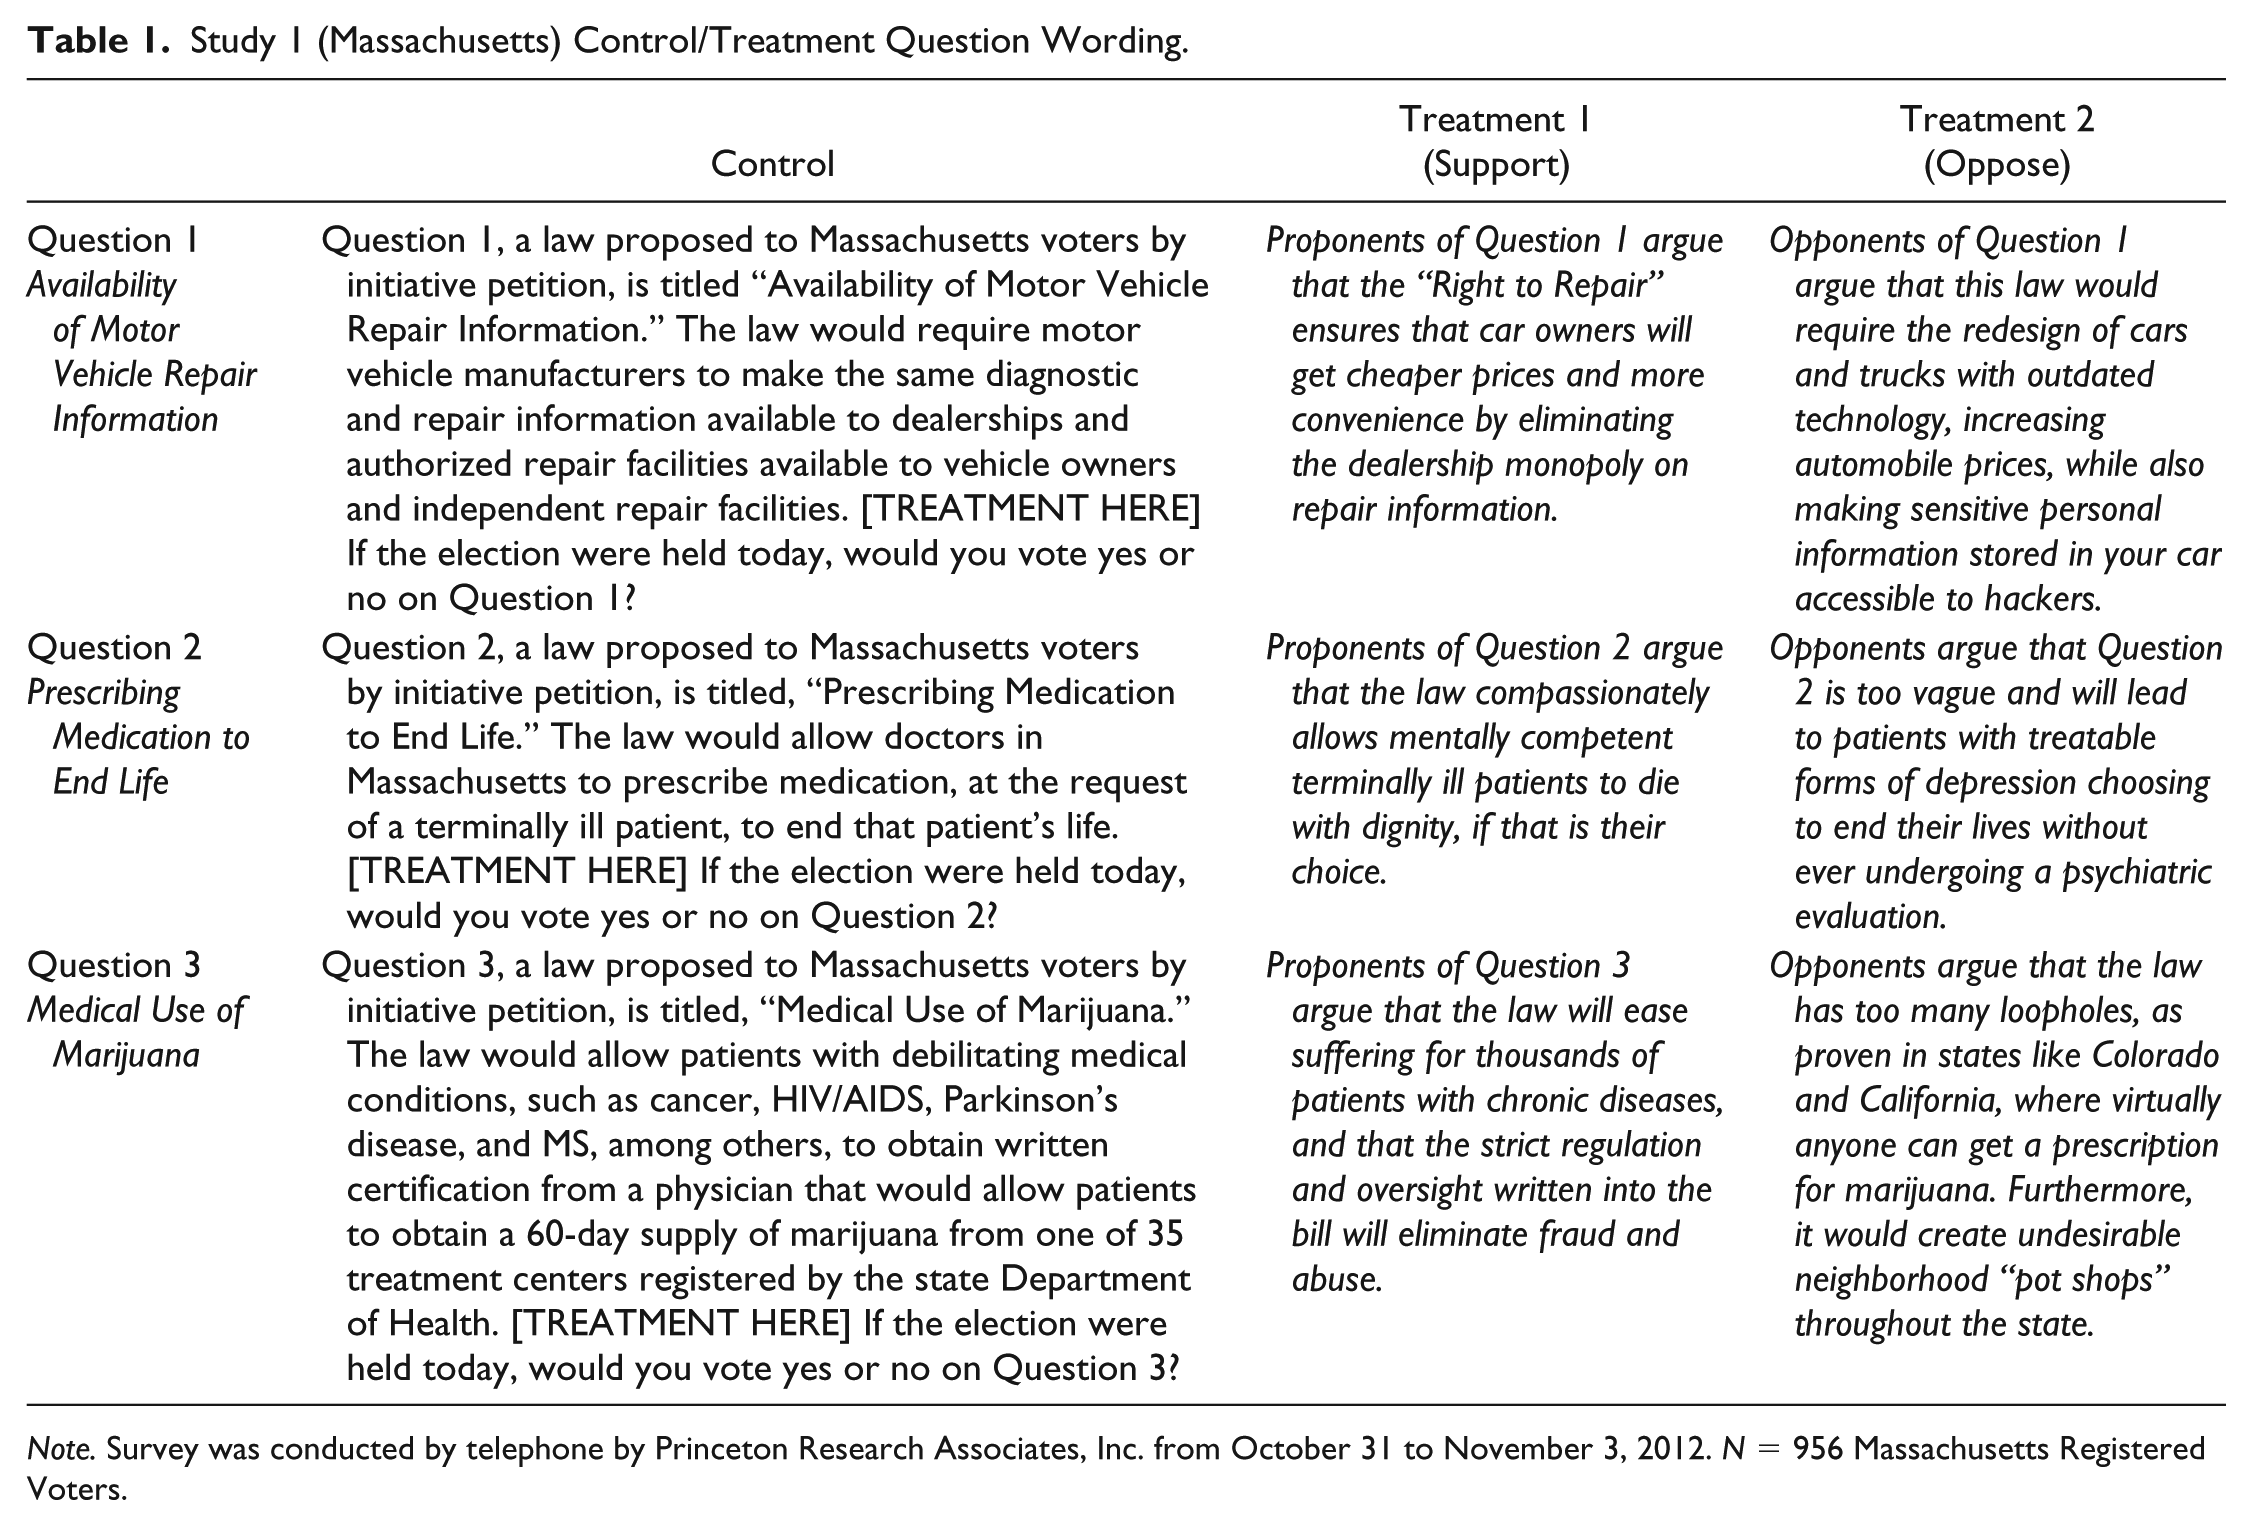
Note. Survey was conducted by telephone by Princeton Research Associates, Inc. from October 31 to November 3, 2012. N = 956 Massachusetts Registered Voters.
Study 2 (National) Control/Treatment Question Wording.
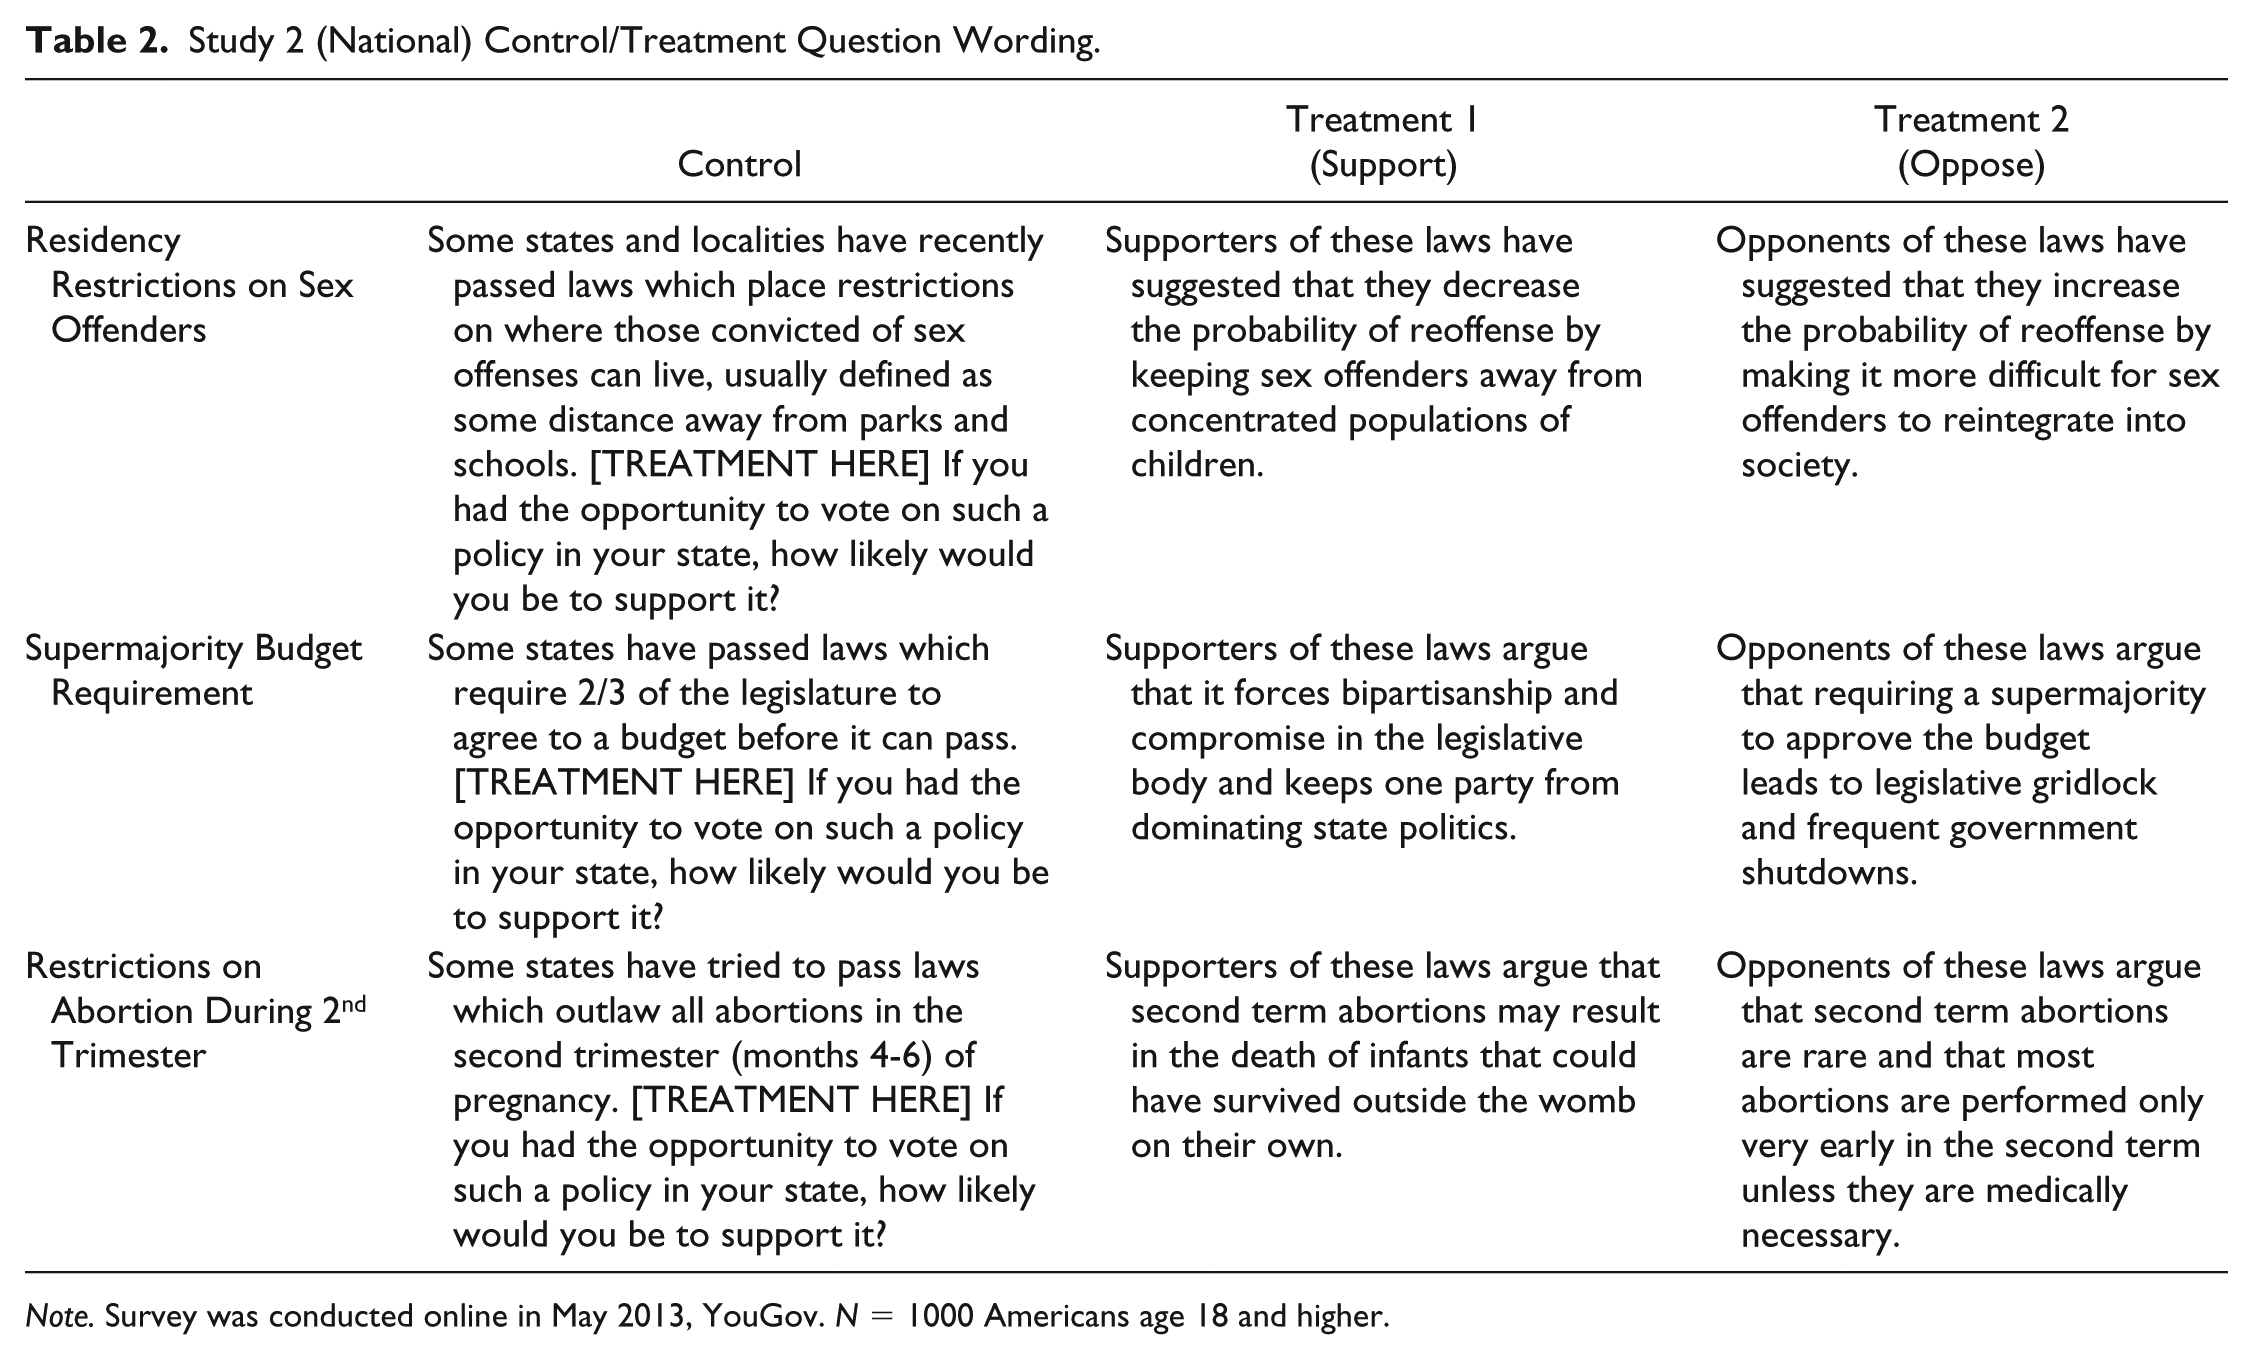
Note. Survey was conducted online in May 2013, YouGov. N = 1000 Americans age 18 and higher.
Experiment 1—Massachusetts, 2012
Our first study was fielded in the state of Massachusetts in 2012. The data set includes 956 registered voters in the state collected by telephone interview from October 31 to November 3 in advance of the November 6th General Election. 6 While most are familiar with the method of direct legislation practiced in states like California and Oregon where a qualified petition goes directly to the ballot in a process referred to as the “direct initiative,” Massachusetts uses a more deliberative process called the “indirect initiative.” After initiative proponents submit an initiative in Massachusetts, the legislature is given the length of their session to consider the bill and adopt it as is or to try to work out a compromise with proponents, if one exists. If the legislature fails to act, proponents must collect a second set of petition signatures to qualify the law for the ballot. Three initiatives qualified for the 2012 ballot in Massachusetts.
Question 1 (Availability of Motor Vehicle Repair Information) sought to require car manufacturers to allow consumers and independent repair shops to access diagnostic information stored in the car’s computer that only dealers could previously access. Question 1 was debated in the legislature, and passed in the state Senate. However, the state House capitulated to the pressure of the automobile makers, who opposed the bill. Proponents quickly collected the requisite signatures to pass the legislation. On the last day of the session, a legislative compromise was passed and a new version of the legislation was agreed upon. Since the measure had already qualified for the ballot, however, it went ahead. There was very little public debate on Question 1. On Election Day, despite the legislative compromise, voters supported passage of the “right to repair” in a landslide, 88% to 12%. Proponents and opponents of the bill spent $3,025,272 in total, but 85% was spent in favor of the proposition. 7
Question 2 (Prescribing Medication to End Life) sought to legalize physician-assisted suicide in the state of Massachusetts. It would allow a patient with a prognosis of less than 6 months to live to request lethal drugs in consultation with their doctor. It included a 15-day waiting period from the date of first request, and required a second affirmation, along with witnesses present for the affirmation. Proponents argued that the measure had appropriate safeguards and that it was humane. Opposition to the legislation was stated primarily on moral grounds, but proponents also argued that many of those who requested physician-assisted suicide suffered from depression about their illness. On Election Day, the measure was narrowly defeated, with 48% voting “yes” and 52% “no.” In total, $7,552,771 was spent on this referendum with proponents spending 30% of the total and opponents spending 70%.
Question 3 (Medical Use of Marijuana) sought to remove state criminal penalties for the use of marijuana for medical purposes. The law set forth a series of medical conditions for which a prescription for marijuana could be obtained, and a process for licensing state dispensaries. Proponents of the measure argued for the pain relieving attributes of marijuana and asserted that a more tightly written law could prevent the repetition of abuses of the law that have occurred in other states. Opponents argued that such laws are difficult to enforce and are equivalent to widespread legalization; additionally, physician groups opposed the measure stating that the benefits of marijuana on pain relief had not been scientifically established. The measure passed overwhelmingly with 63% voting yes and 37% voting no. Only $1,159,475 was spent on this initiative and of that, 99% was in support of the initiative. 8
The experimental treatments were developed by paraphrasing language directly from the voter guide provided to all registered voters in the state by mail. We present the text of the control question, along with the experimental treatments, in Table 1. In the supplementary appendix, we include the full text from the voter guide from which the treatments were developed. The Massachusetts experiment allows us to test Hypothesis 1 and gives us some insight into Hypothesis 3; we lack a measure of political awareness in these data and therefore cannot test Hypothesis 2. For issue type, we have one issue that is clearly meets the hard issue (Availability of Motor Vehicle Repair Information) and two issues that are easy issues (Medical Use of Marijuana and Prescribing Medication to End Life). 9
The three measures present us with a well suited electoral environment for testing the difference in arguments on easy and hard issues. Marijuana and Assisted Suicide policies represent issues that have been in the public discourse for some time and on which, opinions are likely a response to affect about an already existing symbol. Additionally, there is a moral component to views on marijuana and assisted suicide. By contrast, the right-to-repair represents a clear example of a hard issue. First of all, it contains complex information and secondly, this information is not at the top of voters’ heads. Furthermore, this particular technical and complex issue had an absent campaign environment. Therefore, the cued information supplied may be the only information that a voter might have to base their opinion on. Interestingly, there was also overwhelming support for the issue, indicating that voters had a “gut reaction” to the proposal in favor of more choice in automotive repair. We would speculate that this may have something to do with a positive affect toward choice and a negative affect toward car dealerships. We therefore categorize it as a hard issue with a strong positive valence.
There are, to be sure, some limitations of the Massachusetts study. First, because this experiment was fielded in the week directly preceding the election, it is possible that many respondents had already been exposed to arguments for and against these measures, which might dull the effect of any of the treatments on respondents. 10 In the case of Question 1, there was very little put into the information environment since the measure made it to the ballot by way of a timing accident. However, the spending on both Questions 1 and 3 were one-sided in favor of the propositions. It is therefore possible that for Questions 1 and 3, the “no” argument was more novel, and therefore would be stronger than the “yes” argument. On Question 2, however, the “no” side outspent the “yes” side by a two-to-one margin and provides a useful comparison.
Experiment 2—National Sample, 2013
Our second study was fielded in May of 2013. The data set includes 1000 American adults collected in an online convenience sample that uses propensity score matching and poststratification to achieve a representative sample of all Americans age 18 and over. 11 We fielded this survey to test the generalizability of the results found in the Massachusetts study. This was done precisely to verify that the patterns observed in the single-state study could be replicated in other parts of the country, with different issues, and outside of a campaign environment where information to voters may have already been saturated. The second study also incorporates a measure of political awareness as an explanatory variable allowing us to test Hypothesis 2. The three issues that we use in the experiment are attitudes about (1) second trimester abortion regulations, (2) a supermajority budget requirement (modeled after California’s famous Proposition 13 in 1978), and (3) sex offender residency restrictions. Abortion falls under the classic definition of an easy issue and is the very issue employed by Carmines and Stimson to define “easy” issues. The budget requirement is clearly a hard issue—while it regards taxes, the question is not about whether or not to raise taxes but how many members of a state legislature are required to do so. This question engages voters’ thoughts about both how large government should be but also about government process and how government is currently run. This complexity and its lack of salience outside of California should present voters with an issue they have not developed firm beliefs about. The sex offender residency restrictions fall somewhere in between easy and hard: on one hand, it is likely that there is a gut level or symbolic response to sex offenders (e.g., Dyck and Hagley 2012). On the other hand, residency restrictions are technical and complex and may elicit responses that reflect a considerable degree of uncertainty given their lack of salience.
As with the Massachusetts study, respondents were randomly assigned to either the control group or one of two treatment groups where they received a cue in support or opposition to the measure. However, since the issues are hypothetical, we allowed respondents to indicate how likely they would be to vote on each measure, if they had the opportunity to do so in their state. The responses are measured across a typical 5-point Likert scale ranging from “very unlikely” to “very likely.” The question wording of the control group questions and treatments are presented in Table 2.
There are also some limitations of the national study. The primary limitation is that survey respondents are asked a hypothetical question that includes 524 respondents from noninitiative states and 476 respondents from initiative states. In the supplementary appendix, Table A5, we demonstrate that the effects of the treatments are not statistically different between respondents in initiative and noninitiative states. Furthermore, despite the distance between the experimental setting and the electoral setting (as in Experiment 1) using national-level data with hypothetical examples gives one major advantage over the Massachusetts study. Given the concerns about the possibility of the conflation of campaign effects by conducting a survey in the last week of an election, we have as neutral as possible an information environment in the national-level survey. The survey was fielded in May of a nonelection year and there should are no obvious campaign-related concerns. To the extent that we find similar effects for positive and negative cues in the national data as with the Massachusetts data, we can be considerably more confident that the results in Massachusetts are not due to any unique circumstances surrounding that election or the arguments made by the campaigns. The national data also allow us to test Hypothesis 2 (that those with lower levels of political awareness are more likely to oppose initiatives) and to add further data to Hypothesis 3 regarding issue type.
Results
The Negativity Bias and the Status Quo No (Hypothesis 1)
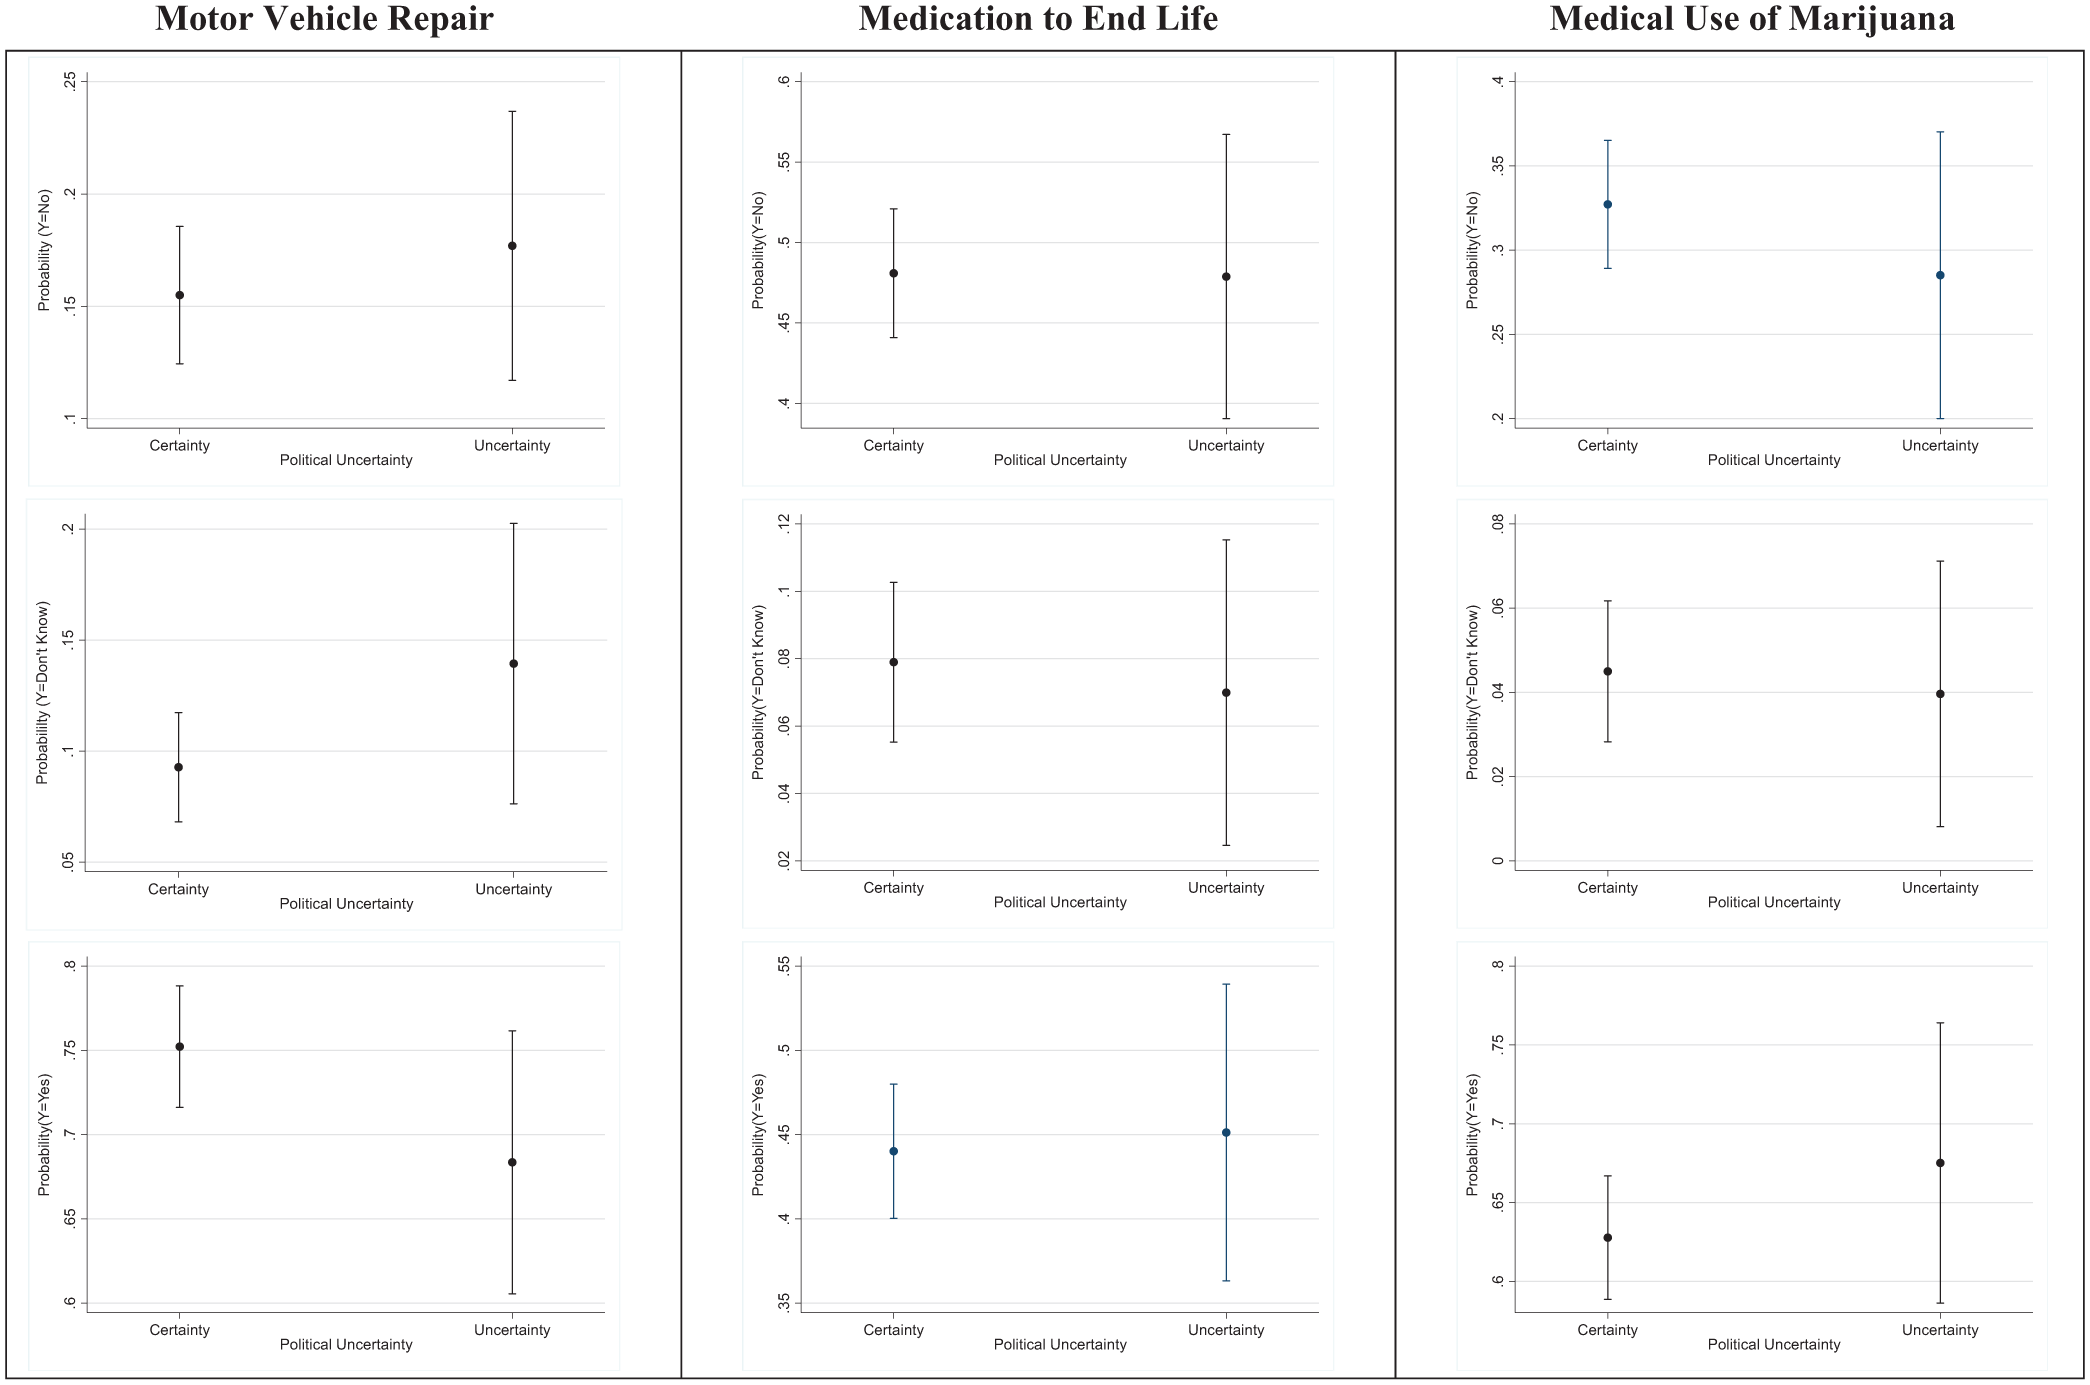
We begin by summarizing the results of the Massachusetts Experiment in Figure 1 and the National Experiment in Figure 2. In these figures, we present the effects of the experiments using difference of means tests; in the supplementary appendix (Tables A2 and A3), we offer models with control variables that demonstrate equivalent effects, both statistically and substantively. The experimental treatment effects are striking and consistent across the six issues considered. In each case, the support cue fails to increase voting behavior (in the Massachusetts survey) and voting intent/support (in the National survey) for any of the six issues considered: medical use of marijuana, assisted suicide, automotive repair laws, second trimester abortions, sex offender residency restrictions, and a supermajority state budget requirement. However, in each case, the oppose cue exerts a statistically significant effect leading respondents to either voting against/oppose each of the ballot measures.
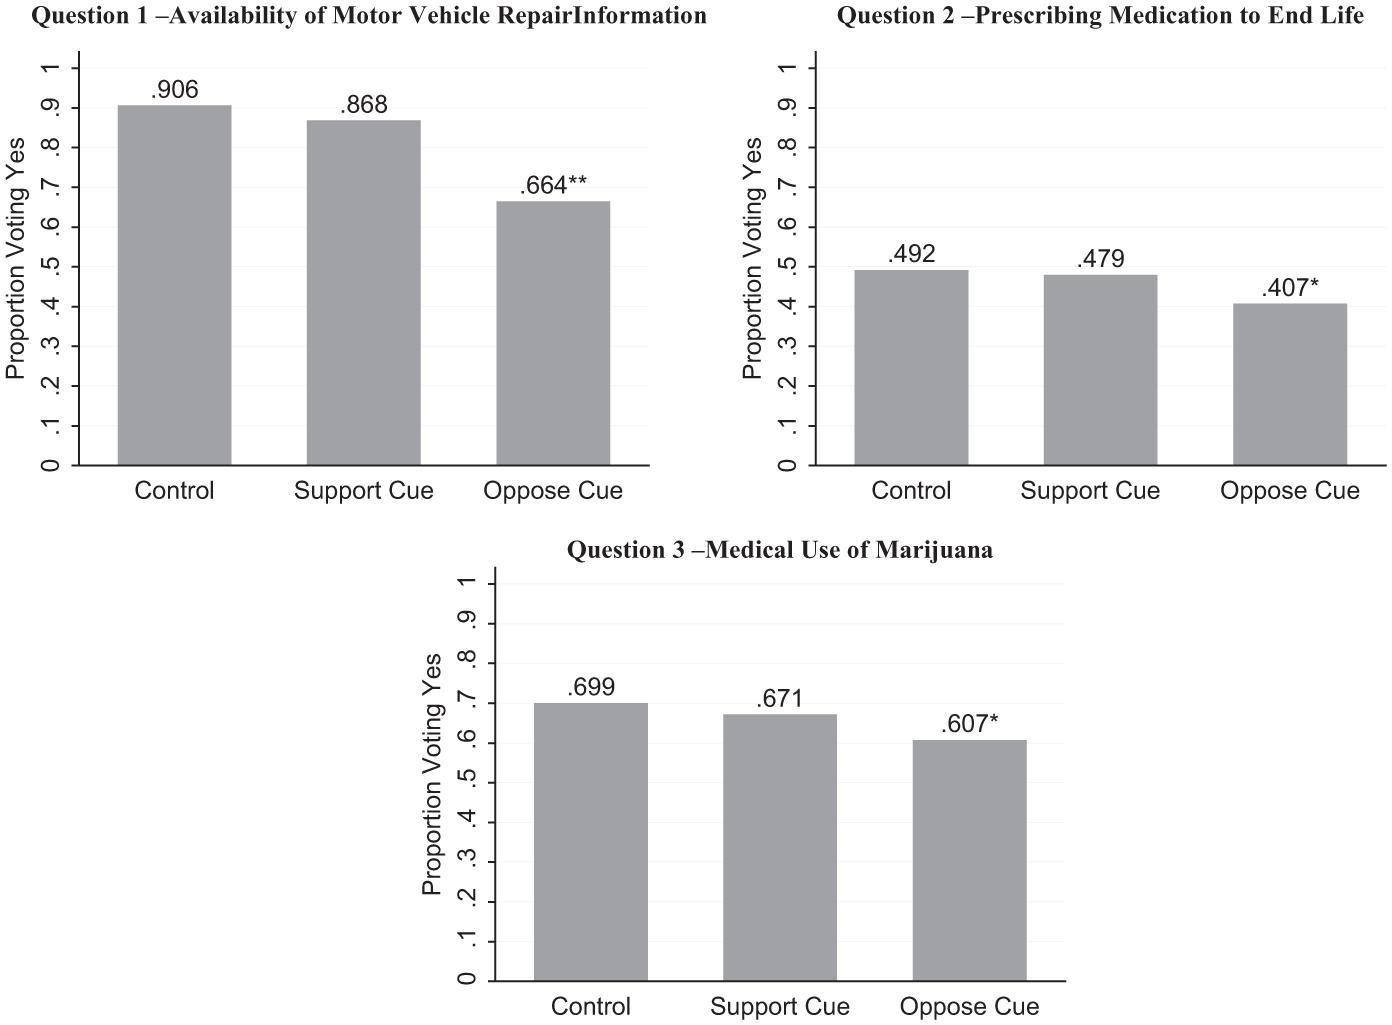
Positive and negative frames on three ballot initiatives, Massachusetts 2012 (Experiment 1)
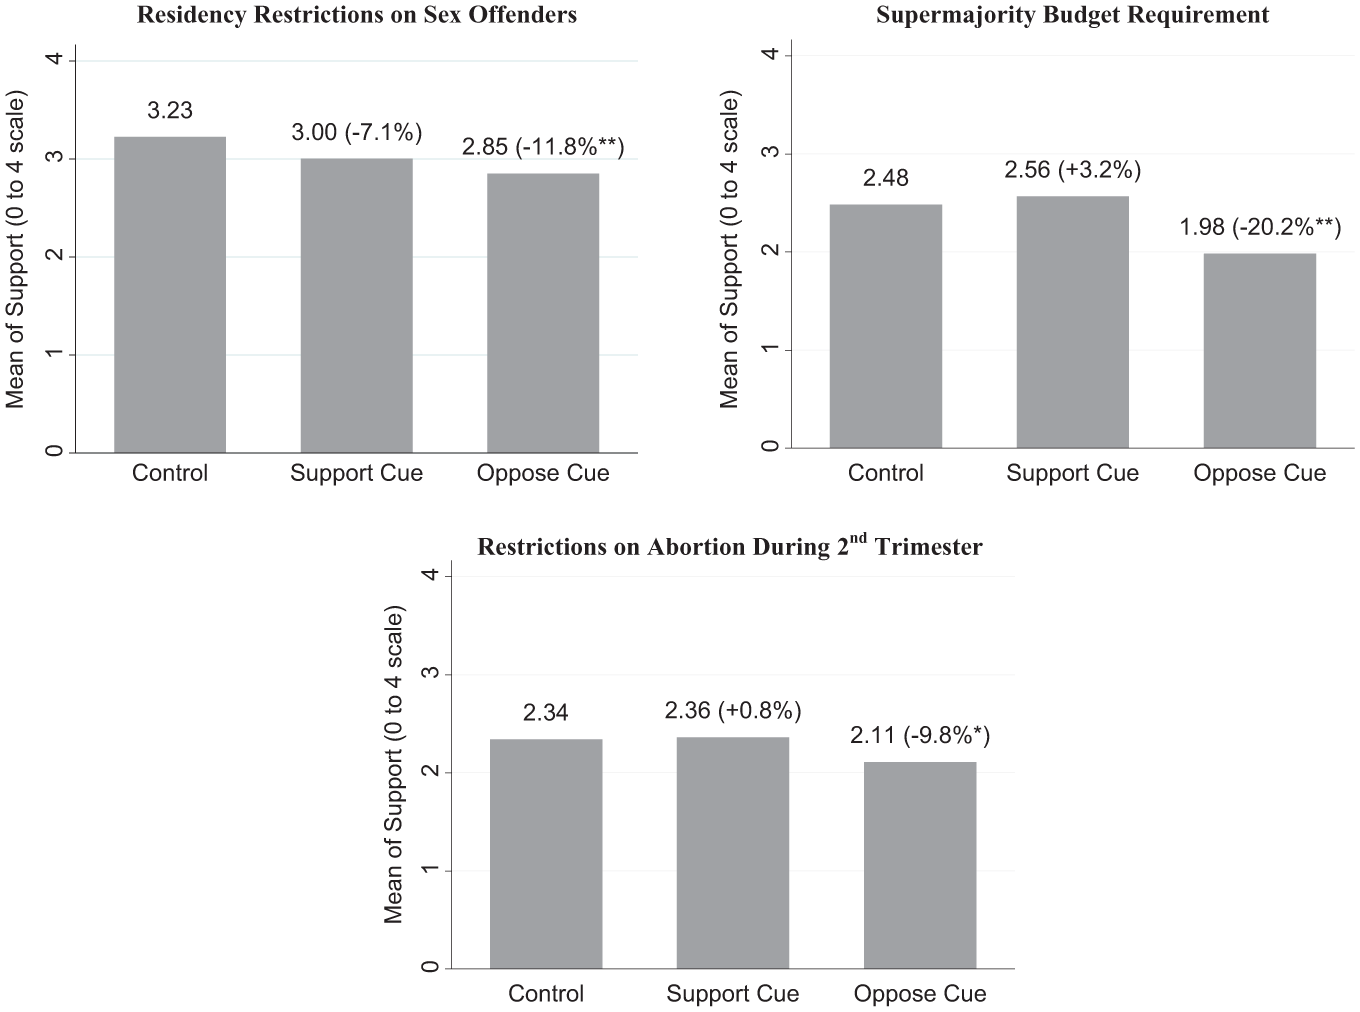
Positive and negative frames on three hypothetical issues, national-level data 2013 (Experiment 2).
The statistically significant effects of negative framing are of substantive import as well. In Figure 1, we present the effects from the Massachusetts data; the size of the effects is simply percentage point differences from the control group’s percent supporting the initiative. The oppose cue predicts a 24.2-percentage-point decrease in voting for Question 1 (Motor Vehicle Repair Information). For Question 2 (Medication to End Life), the oppose cue leads to a 8.5-percentage-point decrease in voting in the affirmative. For Question 3 (Medical Marijuana), the oppose cue also lead to a 9.2-percentage-point decrease in support.
In Figure 2, we present the findings from the national data. Because the dependent variable is a scale that ranges from 0 to 4, we present the means for the control and two treatments groups; the percentage change is calculated by the formula
The Status Quo No and Political Uncertainty (Hypothesis 2)
Thus far, we have presented support for the existence of a status quo no tendency in ballot initiative elections that is dependent on the information environment. Opposition cues appear to be considerably more persuasive in an experimental setting than support cues. The theoretical foundation for this finding (that negative frames are more persuasive than positive frames when the status quo position is known) is different from the theoretical foundation in previous research that characterized the status quo no as related to uncertainty and confusion. While we do not directly measure confusion and/or uncertainty about the ballot measure questions themselves, both of our experiments allow us to construct exogenous measures of political uncertainty. In the national experiment (Experiment 2), we measure political uncertainty using respondents’ political knowledge using a five-question battery that is common in many studies. 12 In the Massachusetts data (Experiment 1), we measure political uncertainty as the percent of voters who are uncertain about their vote choice for U.S. Senate. Massachusetts in 2012 saw a competitive race between incumbent Senator Scott Brown and challenger Elizabeth Warren. Among registered voters in the survey, 20% reported that they were either uncertain of who they were going to vote for, or that they still might change their mind about who they would vote for. While it’s certainly possible that uncertainty here will be predicted by ideology and party ID, our model controls for both of these factors, allowing us to isolate the aspect of this variable related to political uncertainty. While both measures are imperfect, they attempt to capture an exogenous proxy for political uncertainty that would lead to an individual to be less certain in their choices on ballot measures and therefore more likely to either choose the no or do not know outcome.
Beginning with the national data, we initially modeled support for the three hypothetical national ballot measures using a linear regression model with Huber-White robust standard errors to adjust for heteroscedasticity. 13 This model shows quite clearly the robustness of the results of the experimental treatment (Hypothesis 1). Positive cues were not statistically significant and negative cues induced “no” voting. The model also includes a 6-point additive index of the five political knowledge items in the survey. Notably, for both the supermajority budget requirement model and the abortion restrictions model, knowledge is negatively related (and statistically significant) to support for these measures; the coefficient on knowledge is not statistically significant for the residency restrictions model. This result, to be sure, suggests that higher levels of knowledge are associated with greater opposition to ballot measures in two of the three cases—note that this is exactly the opposite of what the initial status quo no theories posited. While the finding is significant for only 2 of the 3 measures (abortion and taxes), we find no support for Hypothesis 2. The linear models are presented in the supplementary appendix, Table A3.
To be sure, Hypothesis 2 states that low levels of awareness would predict opposition or uncertainty about ballot measures; therefore, we need to relax the linear assumption of the dependent variable. As coded, this is a 5-point scale of whether voters would be very likely (4), somewhat likely (3), unsure/don’t know (2), somewhat unlikely (1), or very unlikely (0) to support each proposition, if they had an opportunity to vote on the issue in their state. It is conceivable that low levels of awareness would predict “don’t know” as a more likely outcome at the expense of support.
To consider this possibility, we can treat the dependent variables as unordered categorical variables and model support for these measures using multinomial logit. The model coefficients are presented in Table 3. 14 The coefficients from multinomial logit are difficult to directly interpret as they represent predicted changes in the natural log of the odds-ratio of responding for each category as compared to a base category (in this case, an answer of “very likely to support”). 15 A clearer interpretation of these results is offered by graphing predicted probabilities with 95% confidence intervals; these results are presented in Figure 3.
Predicting Support for Hypothetical Propositions, National Sample, May 2013.
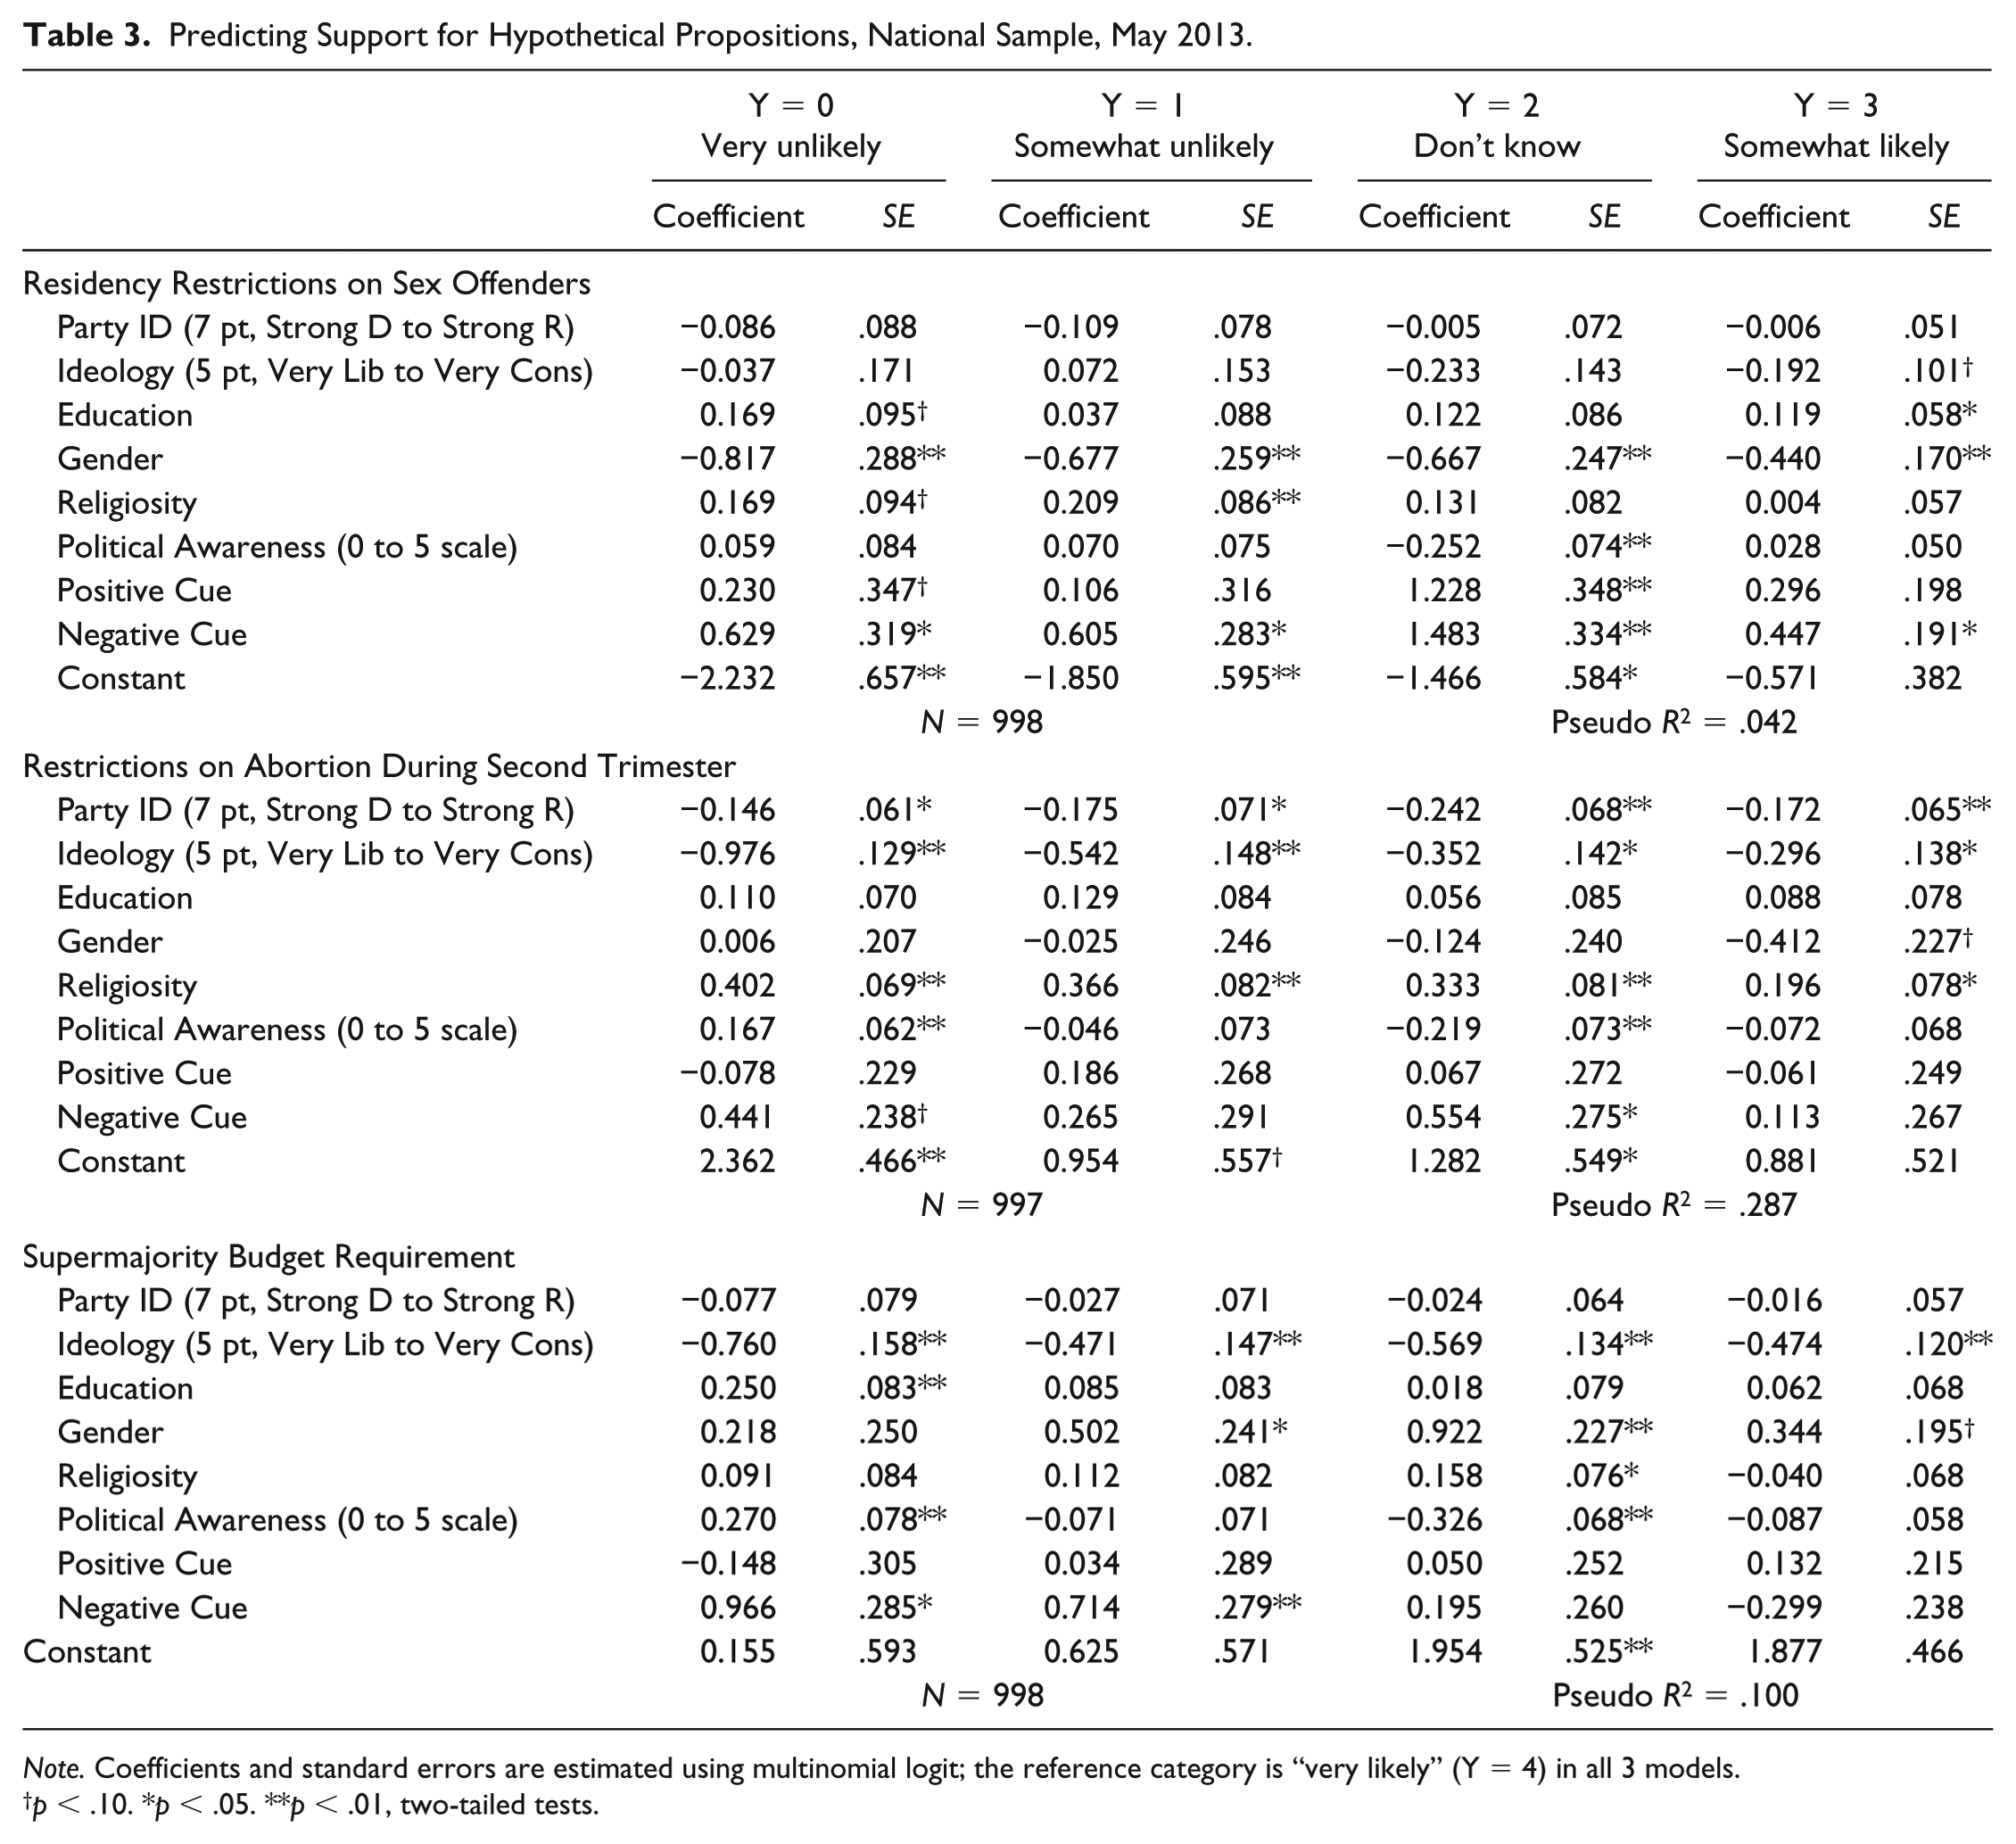
Note. Coefficients and standard errors are estimated using multinomial logit; the reference category is “very likely” (Y = 4) in all 3 models.
p < .10. *p < .05. **p < .01, two-tailed tests.
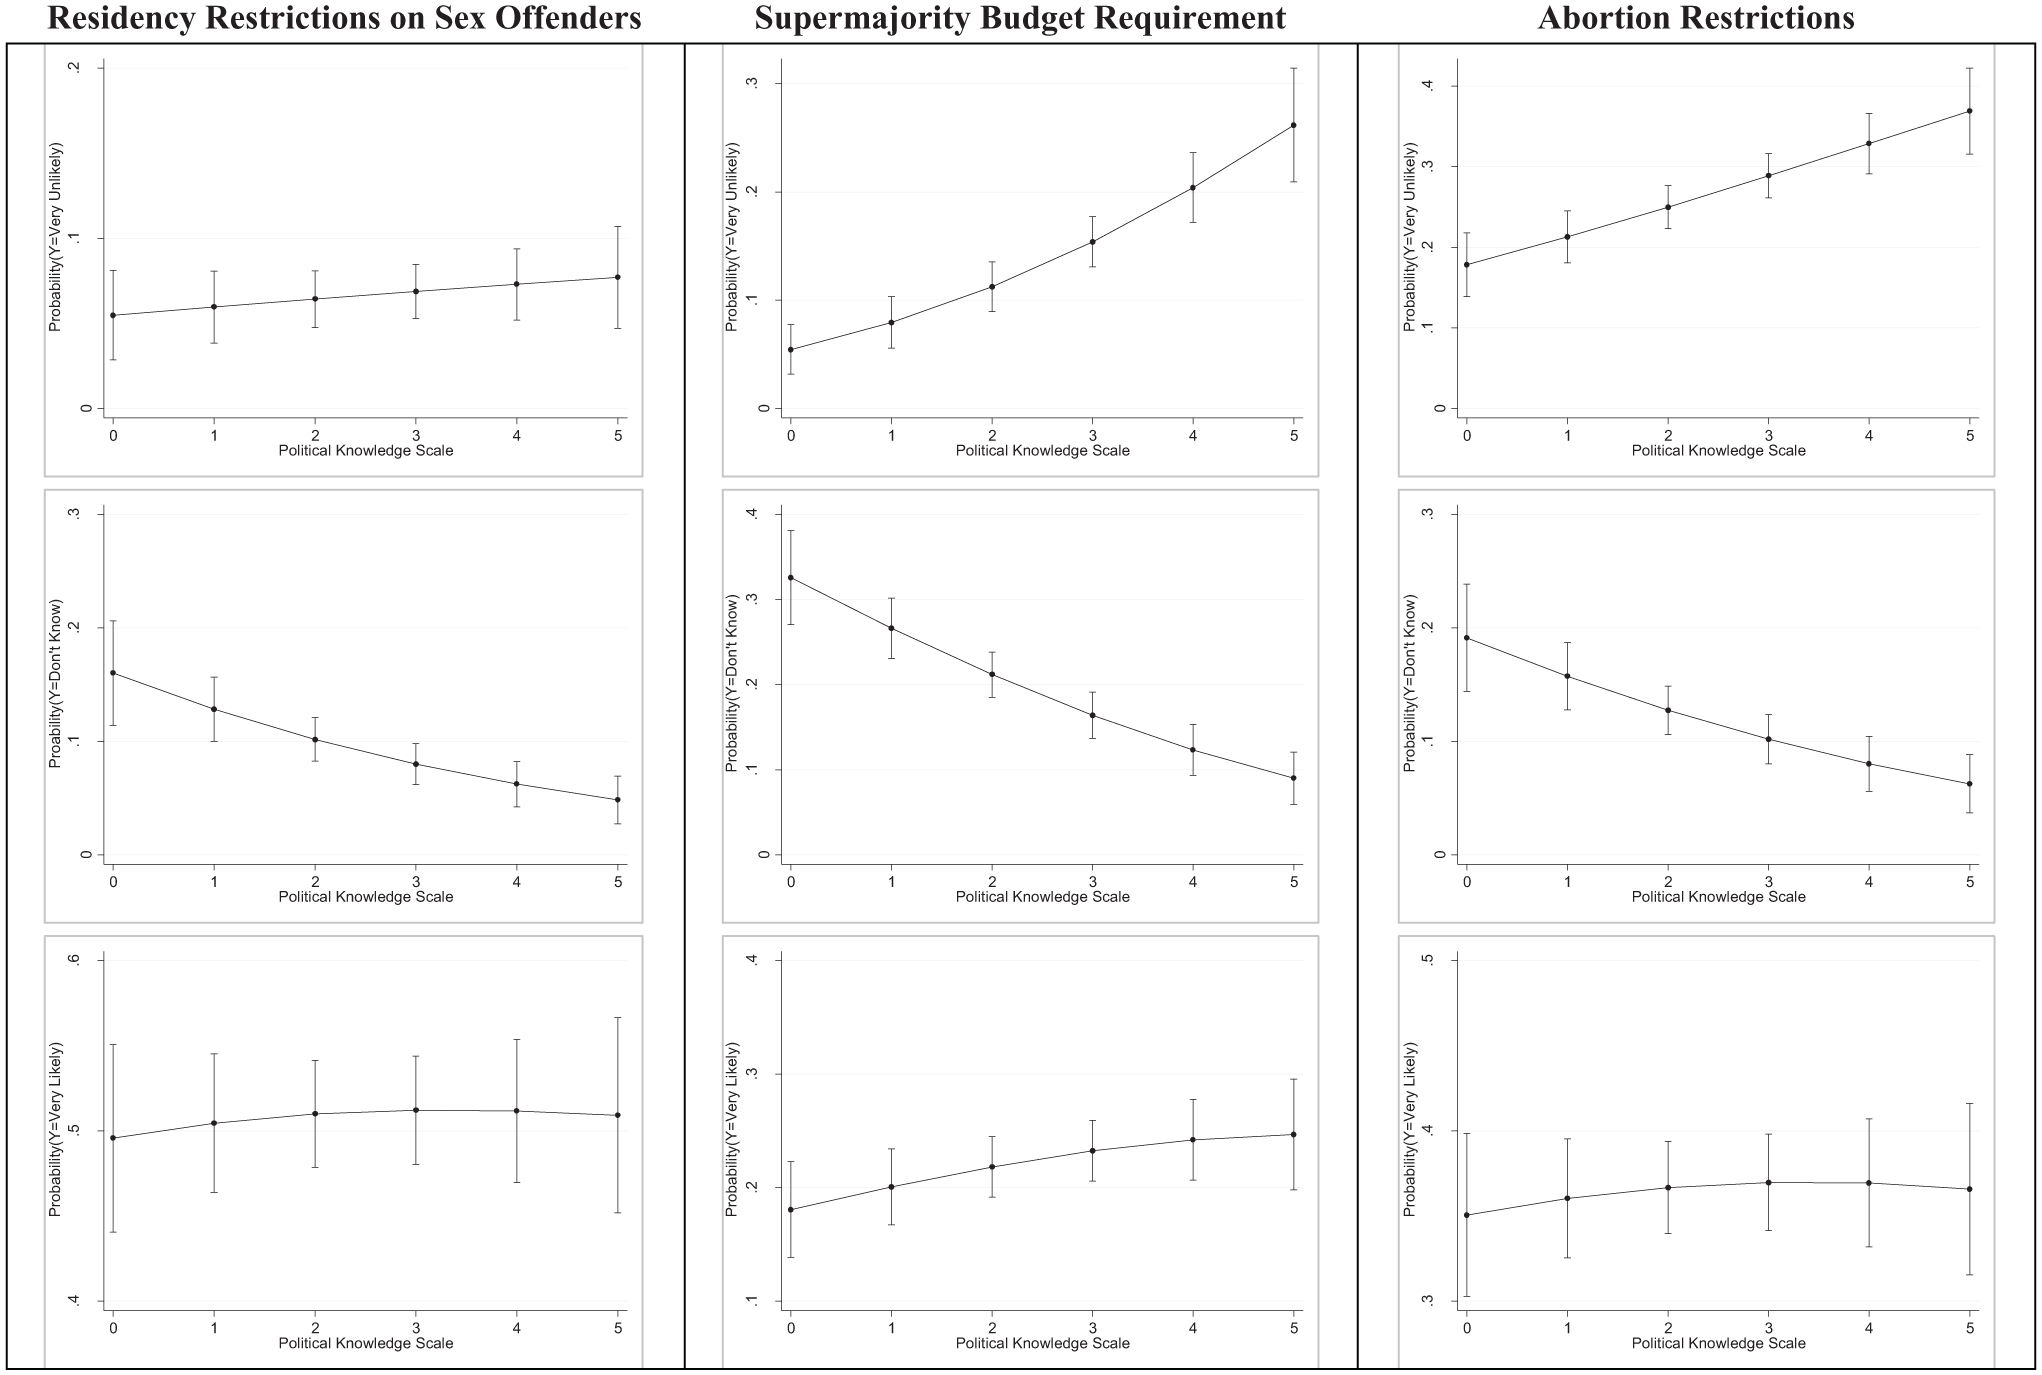
The effect of political knowledge on ballot initiative voting (test of Hypothesis 2), national data.
Figure 3 presents predicted probabilities of supporting each measure for when the dependent variable indicated support for the measure is “very unlikely,” “uncertain/don’t know,” and “very likely.” We see immediately that our suspicion is confirmed—respondents with lower levels of political knowledge are more likely to say “don’t know” across all three measures. However, there is no difference in support by measure; that is, those with low levels of awareness are just as likely to support measures as those with low levels of awareness. The difference is in opposition. While those with lower levels of political awareness do respond “don’t know” at higher rates than those with higher levels of awareness, those with high levels of awareness are more likely to oppose the measures. These results do not offer much in the way of support for Hypothesis 2. Voters who are less politically knowledgeable do not seem to have anything resembling a higher propensity to oppose ballot measures; they are simply more uncertain. While this is not a direct test of ballot roll-off, our results suggest, if anything, that lack of knowledge increases the probability that an individual might abstain from voting on ballot measures.
We are cognizant of the possibility that a general measure of general political knowledge is perhaps not the best measure of political uncertainty. If we were to consider the effects of education in lieu of political knowledge, for instance as is modeled in Table 3, we find remarkably similar results. Lower levels of knowledge, proxied as uncertainty, are never associated with higher levels of either “no” voting or a greater likelihood of saying “don’t know.”
We also can present an alternative measure of political uncertainty in the Massachusetts data used in Experiment 1. In these data, we proxy political uncertainty by voters who either said they “don’t know” or “could change my mind” on their vote choice in the 2012 U.S. Senate election between Scott Brown and Elizabeth Warren. In the supplementary appendix (Table A4), we model vote intention (yes/no) with a logit model. In all 3 models, the variable fails to reach standard levels of statistical significance. We further consider individuals who responded, “don’t know” in the survey and model the vote outcome using a multinomial logit model. These results are presented in Table 4.
Predicting Support for Massachusetts Ballot Initiatives, 2012.

Note. Coefficients and standard errors are estimated using multinomial logit; the reference category is “vote yes” (Y = 3) in all 3 models.
p < .10. *p < .05. **p < .01, two-tailed tests.
In Table 4, we present what is essentially a table of null results. Political uncertainty, proxied here as uncertainty in other political races, is not associated with a greater likelihood of voting yes or no. These null effects are presented graphically in Figure 4. Across all of these considerations, then, we find no evidence for the hypothesis that political uncertainty increases the likelihood of “no” voting in initiative elections. This finding is consistent with the theory we have presented, that status quo orientation is dynamic, in response to information, and not fixed, based on some base-level or general lack of information. Rather, no information in ballot initiative elections is experimentally shown to be more persuasive than yes information.
The effect of political knowledge on ballot initiative voting (test of Hypothesis 2), Massachusetts data.
Issue Type (Hypothesis 3)
Our third hypothesis was that we should observe differences in the substantive effects for hard vs. easy issues (Carmines and Stimson 1980). Because easy issues occupy a value-laden space where voters already figured out where they stand, we should expect cues to be less powerful in shifting individual stances. To be sure, our experiments only consider six issues, two hard issues (motor vehicle repair and the 2/3 budget rule), three easy issues (medical marijuana, assisted suicide, and abortion limitations), and one issue that has some characteristics of both (sex offender residency restrictions). To be sure, there are only six issues here to consider and we are careful not to generalize too much from these issues.
In Table 5, we present a summary of these negative effects, by issue type. In the Massachusetts data, the effect of the negative cue is nearly three times as large on the Motor Vehicle Repair initiative (24% change), then on either of the other two issues, Medical Marijuana (9% change) and Assisted Suicide (9% change). In the National data, the effect is again about twice as large for the negative cue on the 2/3 budget requirement (20% change) versus abortion restrictions (10% change) and sex offender residency restrictions (12% change). While the findings are limited to these six issues, we do find remarkable support for a hard/easy issue distinction in the effectiveness of opposition cues.
Summary of Substantive Effects Across Two Experiments (Oppose Cues Only).

Summary of Findings and Limitations
We summarize our finding as such (1) opposition cues are more effective than support cues on ballot initiatives because of the negativity bias in framing effects when the status quo position is known, (2) there is little evidence that voters who have lower levels of certainty are more status quo oriented, and (3) the negativity bias is about twice as large on “hard issues” as it is on “easy issues.” There are, to be sure, some limitations of the present study. First, it is possible that the arguments for the opposition cues were simply better/stronger arguments than for the oppose cues. This concern leads us to be most cautious about generalizing from the findings regarding Hypothesis 3, about issue type. For the central hypothesis, however, the motivation behind this argument seems unlikely. Even if we were to suppose that the support cues were weaker than the oppose cues, we would expect at least some evidence that support cues have any positive effect on influencing support for a measure. Instead, we see across all six experiments, the effects are close to zero; none of the effects even approach statistical significance and four of them have the wrong (negative) sign. This, to us, represents a built-in skepticism to accepting persuasive information to vote for ballot measures, and not any default in the wording of the experimental treatments. Furthermore, we crafted the support and oppose cues in the Massachusetts experiment from the actual arguments in the voter guide; full texts of these arguments are provided in the supplementary appendix (Table A1).
Another concern regards the timing of the Massachusetts experiment. By fielding the experiment the week before the election, it is possible that arguments for these measures were already considered by the electorate. This concern, however, overestimates the political awareness of the general election electorate, particularly in a Presidential year with a very competitive top-of-the-ticket Senate race between incumbent Scott Brown (R) and Elizabeth Warren (D). The two candidates spent just shy of $80 million on this campaign. Comparatively, the total spending on the three ballot measures was just shy of $15 million, with most of that money (about $10 million) being spent on Question 2 (Medication to End Life). In the case of Question 2, the spending was one-sided on the oppose side. 16 Therefore, if the weight of the oppose argument was already weighing on the Massachusetts electorate, we would not expect that the oppose cues, especially in the case of Question 2, would elicit a statistically significant result.
Finally, there may be some concern that the distance between the experimental conditions in Experiment 2 have a larger than desirable gap between experimental setting and reality given that just over half of our respondents in the national sample are actually from noninitiative states. That said, the consistency in results between the Massachusetts experiment (conducted right at the end of a campaign) and the national hypothetical (conducted in May of a nonelection year) certainly creates greater confidence in the generality of the results. We also tested to see if there were any differences by modeling the effect of the two treatments by interacting the support and opposition treatments with a dummy variable for those living in noninitiative states (0) versus those living in initiative states (1). None of the coefficients on the interactions or the main effects for initiative approach statistical significance. Furthermore, in running both Akaike’s Information Criterion (AIC) and the Bayesian Information Criterion (BIC), in all three models (see supplementary appendix, Table A5), both measures of fit suggest a preference for the model without the interaction.
Discussion
While we would strongly encourage more research on the effect of campaign framing on voting outcomes in ballot measure elections, we find that these two experiments, both with different features and drawbacks, have produced remarkably consistent results that suggest a strong negativity bias in campaign framing in ballot measure elections. How should we understand these results in the larger literature on ballot measures, campaigns and support versus opposition messaging? Indeed, how should professional campaigners spend their resource in ballot measure elections?
Even though recent research has suggested that spending can be effective both in support of and in opposition to ballot measures in a campaign environment, we find strong evidence that voters will psychologically prefer arguments that oppose, rather than support ballot measures. This finding clarifies two important aspects of the literature and speaks to the commonly held belief among practitioners that advertising and other persuasion spending has a meaningful effect on voters. First, we find no support for the argument that the status quo “no” is a low-information behavior; that voters default to “no” when they are confused or uncertain. Our experiments are more consistent with understanding status quo bias as a campaign effect; voters possess a built-in negativity bias and since the status quo occupies that side, negative frames will be more effective than positive frames. Accessing that bias, however, requires that a frame be put into the information environment and accessed by voters. Because ballot initiatives typically take place on an already crowded ballot, getting that information to voters is easier said than done.
While our results provide strong evidence of a built-in advantage to the opposition side in ballot initiative campaigns based on voter psychology, this does not mean that money spent in support of ballot propositions is ineffective. With recent work showing more consistent positive and negative effects of the role of money in initiative campaigns, we are struck by the fact that most of the recent literature on the effect of ballot initiatives on turnout suggest that these effects persist precisely when issues are contentious and value-laden (Biggers 2014) and when the campaigns are closely contested (Childers and Binder 2012). These turnout increases appear to occur primarily among peripheral partisan voters (Dyck and Seabrook 2010). It is also possible that direct messages are less effective than information transfer that takes place in communities among friends, family, and neighbors.
To be sure, our findings also appear to stand in opposition to some recent scholarly work that has found positive ballot initiative framing effects based on how initiatives are written and framed (Burnett and Kogan 2015) or when subtler recommendations are made in direct mail contacts (Rodgers and Middleton 2015). We do not believe, however, that the findings from our experiments and the findings in this excellent research are mutually exclusive. The fact that campaign effects have been uncovered in these contexts may reflect the growing skill and sophistication of initiative campaigns, the import of partisan-minded election administrators, and the sly effectiveness of money in these campaigns. Our research simply asserts that the opposition side starts with a bias. This bias is not due to uncertainty or lack of knowledge. It is based on the psychological bias of the way that voters process information.
Supplemental Material
Online_Supplementary_Appendix.R1 – Supplemental material for Ballot Initiatives and Status Quo Bias
Supplemental material, Online_Supplementary_Appendix.R1 for Ballot Initiatives and Status Quo Bias by Joshua J. Dyck and Shanna Pearson-Merkowitz in State Politics & Policy Quarterly
Footnotes
Acknowledgements
This research would not be possible without the support of the UMass Lowell Office of the Provost and the dedicated work of Frank Talty at the Center for Public Opinion. We also acknowledge helpful comments and suggestions made by Mike Mokrzycki and Harvey Palmer.
Authors’ Note
Previous versions of this paper were prepared for presentation at the 2015 State Politics and Policy Conference in Sacramento, CA, the 2013 American Political Science Association Annual Meeting, Chicago, IL, and the Midwest Political Science Association Conference, Chicago, 2013. Authors are in alphabetical order. Contributions are equal.
Declaration of Conflicting Interests
The author(s) declared no potential conflicts of interest with respect to the research, authorship, and/or publication of this article.
Funding
The author(s) received no financial support for the research, authorship, and/or publication of this article.
Supplemental Material
Supplemental material for this article is available online.
Notes
Author Biographies
References
Supplementary Material
Please find the following supplemental material available below.
For Open Access articles published under a Creative Commons License, all supplemental material carries the same license as the article it is associated with.
For non-Open Access articles published, all supplemental material carries a non-exclusive license, and permission requests for re-use of supplemental material or any part of supplemental material shall be sent directly to the copyright owner as specified in the copyright notice associated with the article.