
Abstract
A frequent question in discussions about democracy is whether input from the public is ever considered and to what extent by politicians. This influence of public opinion on the realm of welfare policies has not been extensively explored, and most analyses are less precise for being conducted before the passage of the national welfare reform in 1996, better known as the Personal Responsibility and Work Opportunity Reconciliation Act (PRWORA). Bringing the analysis to a period after the reform to account for contextual changes since its passage, this study uses the multilevel and poststratification (MRP) model considered superior in analysis of subnational opinion using national survey data to assess the influence of public opinion on welfare policies at the state level. Collecting data from the 2014 CCES and a new developed welfare generosity index, I find that public opinion does not have any influence on how generous welfare programs turn out in their states, unless it is interacted with state government ideology. It seems that the ideology of the state government and the state poverty rate are the major determinants on welfare policies outcomes in the states, although the latter had different effects for TANF and SNAP.
Keywords
Introduction
Political Science and Public Policy have long been interested in whether the public has any influence in government or how policies turn out. Although a few studies present some cases where public opinion exerts influence on public policy (Erikson et al., 1993; Page & Shapiro, 1983; Sharp, 1999), other works are more cautious in their analysis (Burstein, 2003, 2014; Jacob & Shapiro 2000; Shaw, 2000), often stressing that if any impact is found, it is more for very salient policy issues and during electoral years where politicians need to be more attuned to their electorate to retain their seats. Bringing such divisions to the welfare realm, little is known about the actual influence of public opinion on welfare policies. There has been reports that liberal states tend to allocate more to welfare programs, begging the question of whether this is also on par to what their citizens want. 1 However, analyses on the effect on public opinion on welfare either fault on how they gauge public opinion by focusing more on a single spectrum such as political ideology (Erikson et al., 1993), or are centered on federal policies (Page & Shapiro, 1983; Sharp, 1999), which after the passage of the Personal Responsibility and Work Opportunity Reconciliation Act (PRWORA) in 1996, might not be a reliable basis since the states have gained more power to control those policies, and therefore, public opinion at the state level may be a better indicator for any influence on such policies.
Furthermore, after states were given such power to administer the Temporary Assistance for Needy Families (TANF) and Food Stamps program also known as the Supplemental Nutrition Assistance Program (SNAP), the gap among states on the generosity of such programs has widened over the years (Bruch et al., 2018). In this manner, this study brings the analysis on the relationship between public opinion and welfare policies to a period after the passage of the PRWORA, focusing specifically on state level opinion using the multilevel regression and poststratification (MRP) research design. Due to the polarization in findings on whether public opinion affects policy and some of the main topics brought up by the literature, this paper asks whether public opinion influences welfare policies at the state level after the 1996 welfare reform. I am also interested in how strong the influence of public opinion is when compared to other variables and whether states are more responsive during electoral years than in non-electoral years.
Informed by some studies centered more on welfare policies, I hypothesize that public opinion does not have an impact on welfare policies at the state level, with the potential exception of when it occurs during electoral years. Using data from the 2014 Cooperative Congressional Election Study (CCES) and a combination of variables from the University of Kentucky Center for Policy Research (UKCPR) (2023), U.S. Census Bureau, Michigan State Correlations of State Policy, and the Center for American Women and Politics (CAWP) (2014), I conduct an OLS regression analysis using the MRP estimate for public opinion to compare with welfare policy in 2015 and 2016 using the generosity index developed by Fox et al. (2020) as the most appropriate proxy for such policies. Corroborating the main hypothesis, I find that public opinion did not show any impact on how generous welfare policies turned out at the state level in both years, and therefore, being an electoral year did not make any difference. Opinion showed significance only when interacted with state government ideology. It seems that only state government ideology and the poverty rate of the state to an extent are influential on state welfare generosity.
Theory and Expectations
In the opinion-policy connection literature, some works stress a more substantial impact of public opinion on policy (Erikson et al., 1993; Page & Shapiro, 1983; Sharp, 1999), although they posit that it may actually depend on the salience of the issue, institutional venue, fiscal costs, whether strong groups dominate the policy arena, path-dependency from previous policies, and pressure from electoral years (Jacobs & Shapiro, 2000; Manza & Cook, 2002; Burnstein, 2003). When it comes to the realm of welfare policies, such a connection becomes blurrier, where distinct factors may mediate the impact of public opinion on welfare programs. For instance, Susan Herbst (2002) states that public opinion has an influence on welfare policies at the state level, although oftentimes state policy managers gauge public opinion through media coverage and input from colleagues instead of relying more on polling data or citizen testimony. In this milieu, social services agencies may also have more influence on policy, given their expertise on the issue and lack of consistent information from the public (Shaw, 2000). Other groups also have some impact, especially on more specific policies such as the former Aid for Families with Dependent Children (AFDC) program, where political elites and interest groups had more substantial influence on the policy debates for the program than public opinion (Teles, 1996). Ideology can also be a major determinant of opinion regarding welfare programs, once both liberals and conservatives become concerned when negative information about fraud and inefficiency are conveyed, and consequently may oppose increased expansion of such policies (Qi and Haselswerdt, 2023).
In this sense, the effect of public opinion on welfare policies may be more aligned with findings that argue that opinion has little or no effect on policy in general (Jacobs & Shapiro, 2000; Burnstein 2014; Burnstein, 2020). Such works state that data is not sufficient, and the polls can be biased since they ask questions that are already salient in the first place. It follows that interest groups and government agencies may either intermediate the influence of public opinion or supersede it (Domhoff, 2002; Gilens & Page, 2014; Schneider & Jacoby, 2005a). Grumbach (2020) attests to this incongruence of state policy and public opinion, arguing that the idea of states as laboratories of democracy has not been fulfilled due to increasing party polarization on state health and welfare policy, leading to more barriers to citizen participation, especially in those controlled by the Republican party. It follows that state government ideology may also be a determinant of the impact of public opinion at the state level. Further questioning the influence of public opinion, Franko and Witko (2017) use a measure of state policy mood to demonstrate that public opinion does not impact the adoption of the earned income tax credit (EITC) by the states.
Even though other studies attribute some influence of public opinion on welfare policies, they estimate public opinion on a liberal-conservative spectrum relying too heavily on ideology and demographics (Erikson et al., 1993) or focus on programs at the federal level that have been altered after the 1996 welfare reform (Sharp, 1999). This reform is still the major overhaul of the national welfare system since the New Deal era, and among other provisions, it granted more flexibility to the states to run their own welfare programs such as TANF and SNAP. As observed by Bruch et al. (2018), this devolution has led to increasing inequality in the provision of welfare services across states in terms of generosity and inclusiveness. Such inequality in provision can also be the result of the political climate in the states, and how they react in times of economic crisis (Edwards et al., 2016). This discrepancy in state funding and access to Medicaid leads to decreased participation of low-income and minority groups, affecting the influence of their opinion on state policy (Michener, 2018). Later, Michener and Brower (2020) elaborate on these findings by showing that the states structure such inequality when they make policy decisions on how and where to invest resources. In this manner, states contribute to a racialized and gendered economic inequality.
Therefore, exploring how responsive states have been after the passage of PRWORA to the opinion of their population can shed more light not only on the opinion-policy linkage, but also on the implications for such a devolution to issues of policy responsiveness. This approach expands previous evaluations, which were conducted in the 1980s and 1990s, and used different measures to test public opinion. This essay addresses such gaps by delving more into the specific relationship between public opinion and welfare policies at the state level after the national welfare reform of 1996. Based on these factors and the elements that can strengthen the relationship between public opinion and public policy, three main questions will be proposed as follow: 1 - Does public opinion influence welfare policies at the state level after the 1996 welfare reform? 2 - How strong is the influence of public opinion when compared to other variables? 3 - Are states more responsive during electoral years than in non-electoral years?
Here, given the different factors that may mediate the influence of public opinion and inconsistency in information from the public regarding welfare programs, it is expected that welfare policies at the state level will not be responsive to public opinion, with the possible exception of electoral years. Accordingly, two main hypotheses are tested:
Public opinion has little to no influence on welfare policies at the state level.
States are more responsive to public opinion on welfare in electoral years than in non-electoral years.
The Multilevel Regression and Poststratification (MRP) Method
This study uses the multilevel regression and poststratification technique (MRP), particularly as explored in Lax and Phillips (2009) and Lopez-Martin et al. (2022). Such a method has been used in previous works focused on state-level opinion and has been argued to present more accurate results than regular disaggregation methods. In this sense, the MRP can use national-level data to make inferences about state-specific public opinion and correct for the large variances between the sample and the actual population which is common when using small and non-representative samples. Despite being a better advantage for such models, it still provides robust results and slightly more accurate ones for this study as discussed later regarding validity concerns.
This method works in two stages, which is more technically explained in the supplemental appendix. For the first stage, the variables selected were the poverty rate and state ideology. An interaction terms between race and gender and another one between age and education were also created for this individual model. The combination of categories for the five main variables yielded a total of 960 combinations for a total of 53140 cells across all 50 states. For the second stage of poststratification, I weighed the prediction from the individual model for the subgroups by their actual frequency in each state using census data from the IPUMS. The final output is the MRP estimate of the probability that a subgroup of individuals from a particular state supports an increase in welfare spending rather than not an increase.
I then compare these probabilities with how generous welfare policy turned out in each state as measured by the generosity index (Fox et al., 2020). The main independent variable, along with the state-level variables are listed in the next section. Lastly, a few considerations to assure the validity of the model were necessary. I tested the same hypotheses using an estimate compiled by obtaining the mean of responses in the CCES survey of preference for an increase in spending rather than not an increase by state as an alternative independent variable. No heteroskedasticity was found for the final models given that the p-values for the White test for all models were not significant at the 95% level, and therefore, it was not necessary to use robust standard errors.
Methods and Data
Data for the multilevel poststratification model (MRP) come from the 2014 Cooperative Congressional Election Study (CCES) datasets, the University of Kentucky Center for Poverty Research (UKCPR), the revised 1960-2016 citizen ideology series of Berry et al. (1998), and the Integrated Public Use Microdata Series (IPUMS). The CCES was used for the individual model section of the MRP, while data from the UKCPR and Berry et al. (1998) was used for the state level variables, and census data from the IPUMS were used for the poststratification part. To account for the impact of electoral years, I use the 2014 dataset to predict policy on 2015 (non-electoral year) and 2016 (electoral year).
For the MRP model, the dependent variable concerning preferences for welfare spending in the respondent’s state comes from the 2014 CCES dataset with a total sample of 48,616 for this question. It asks respondents how much they would like their state legislature to spend on welfare on a scale from greatly increase to greatly decrease. To better fit the MRP model that works better with a logistic regression, this variable was recoded into a dichotomous variable, where 1 equals increase and 0 equals not an increase in spending. The implications regarding interpretation for this recoded variable are discussed in the conclusion section. The CCES also has many demographic questions that allowed me to control for most variables that influence personal opinion on welfare for the first stage regarding individual-level opinion such as age, race, gender, income, and education. Following the MRP guidelines, all these variables were recoded into categorical variables as shown in Appendix A.
For the state variables, I use the UKCPR dataset to control for poverty rate. The UKCPR is a dataset containing state level variables concerning welfare programs from 1980 to 2021 such as total number of SNAP recipients, poverty rate, unemployment rate, gross state product, and so forth. In the MRP model, I used the poverty rate variable for 2014, which includes the percentage of the state population that is poor per each state. I also usedthe revised 1960-2016 citizen ideology series of Berry et al. (1998) of state government ideology ranging from 0 to 100, where the closest to 100, the more liberal the state government is.
Other variables are used for the last model that analyzes the impact of public opinion as estimated by the MRP on how generous the state is regarding welfare. For instance, at the state level, it is argued that the ideology of the state government (Barrileaux & Berkman, 2003; Grumbach, 2022) and the racial composition of the state (Reese et al., 2013) affect how generous the safety-net in the state will be. Since Blacks and Latinos have higher poverty rates (Iceland, 2013) and are more likely to be food insecure (Sano et al., 2011) than the national average, it is expected that states with higher proportions of racial minorities will have higher participation rates in welfare programs. Similarly, states with higher proportions of African Americans will have more restrictive conditions on the receipt of benefits (Soss et al., 2011). It is based on such expectations that some states will impose stricter requirements to bar some minority groups from receiving welfare benefits (Reese et al., 2013). It is also believed that the percentage of women in the labor force and in the legislature also impact how generous welfare policies will be (Bolzendahl & Brooks, 2007). Therefore, I control for the percentage of non-white people in the state and the percentage of people with a college degree using data from the U.S. Census Bureau, and state ideology using the ideology score by state government from 2014 provided by the revised 1960-2016 citizen ideology series of Berry et al. (1998). Using data from the National Conference of State Legislatures (NCSL), I account for party control of the state government using a dichotomous variable where 1 equals Democratic control and 0 equals either Republican control or split government. Data for the percentage of women in the labor force in each state and in the state legislatures are supplied by the U.S. Department of Labor and the Center for American Women and Politics (CAWP) respectively. The breakdown of such variables is also included in Appendix A.
A third factor that may impact how states are responsive to public opinion is their degree of professionalization since state legislatures with higher professionalization are more likely to be responsive to public opinion because they have more resources to be aware of what the public wants (Lax & Phillips, 2009). To control for such influence, I used the index developed by Squire (2017) made up of legislator compensation, legislative staff, and legislative session length to calculate the level of professionalization of the state legislature. This is an index from 0 to 1 where the closest to 1, the more professionalized the state legislature is. Even though this index contains information for 2015, it is still valid to make inferences for 2014 since no large variations in the components of the index are expected within one year. Another important aspect to include when adding economic variables such as income is the impact of inflation. When it comes to public opinion, the public has shown an irrational fear of inflation (Hibbs, 1977; Bartels, 2006), and state governments may respond by being more conservative trying to anticipate people’s opposition to further spending (Broockman & Skrovron, 2018). In this sense, using data from the Correlates of State Policy, I include the inflation rate in each state in 2015 and 2016. 2
Although it has been argued that interest groups can mediate the impact of public opinion (Domhoff, 2002; Gilens & Page, 2014), including at the state level (Gray et al., 2004; Lax & Phillips, 2009; Schneider & Jacoby, 2005b), it was not possible to control for the influence of interest groups in the model. The dearth of specific organizations related to TANF/SNAP, particularly at the state level, would make any interest group index in this study wanting and maybe a stretch of their actual scope. As an alternative, I consider union membership as a predictor of opinion, since it can lead to more identification with the working class, which will lead to more support to the Democratic party and increased spending to welfare policies (Franko & Witko, 2017). To account for union membership, I also use data from the Correlates of State Policy on the percentage of union membership in each state in 2015 and 2016. The variable is demeaned to ensure the values are comparable across states.
The final variable that needs to be included in the model is issue salience. The assumption regarding the saliency of the issue is similar to that of Page and Shapiro (1983), who posit that if an issue has been repeatedly asked over the years and very few people respond either “don’t know” or “refuse”, that implies the issue is salient. Since this paper only uses data from 2014, the best approach was to use Google Trends to analyze how many times the word “welfare” was searched in each state in 2014, 2015, and 2016. In this manner, the higher the number, the more salient the issue was in the state.
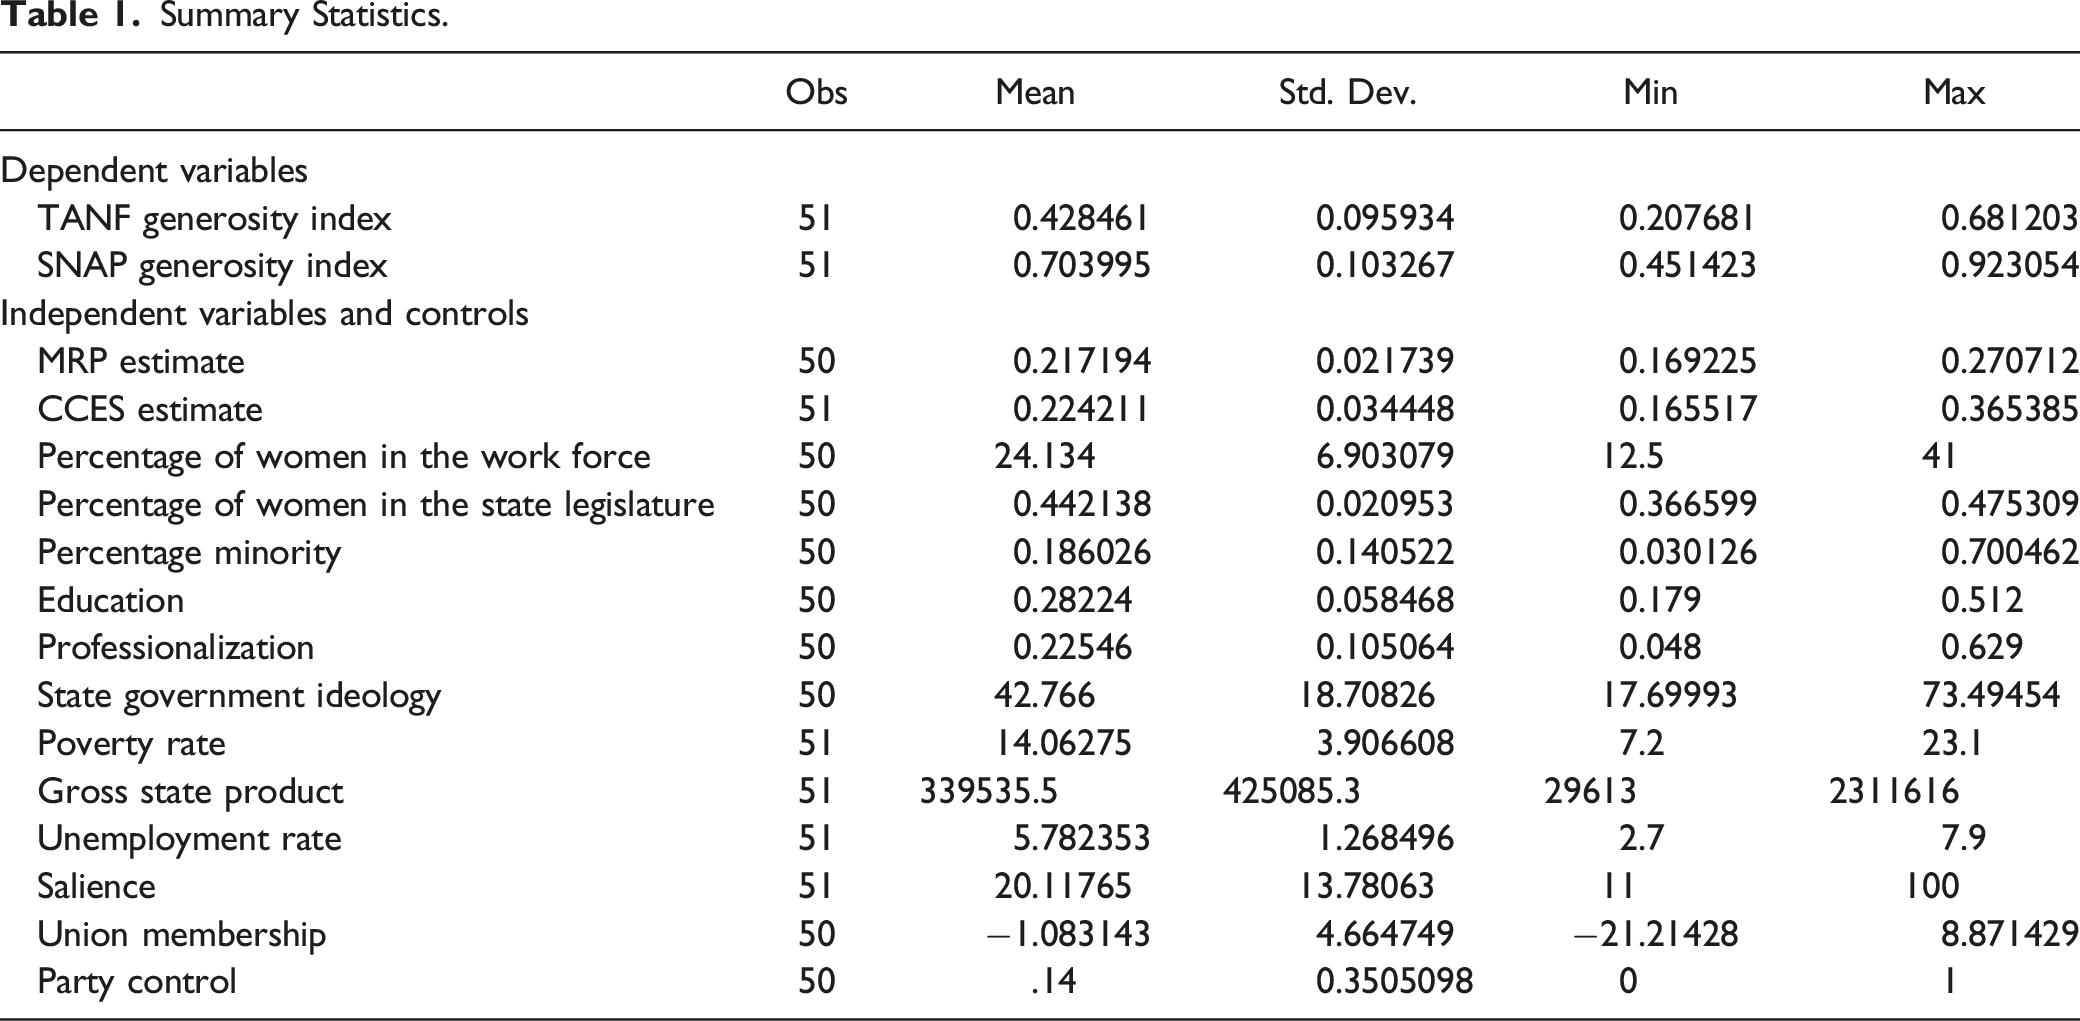
Summary Statistics.
Findings
Before delving more into the potential impact of public opinion on state-level welfare policies, we can observe the coefficients obtained through the MRP model and what they reveal in terms of overall support. The MRP model generated an overall estimated support for an increase in welfare spending than not an increase of 0.223 and standard deviation of .003, which is very similar to the support of 22.74% obtained from the 2014 CCES survey. In fact, the correlation coefficient between the two was very high at approximately .86. This compatibility is clearer in the following scatterplot exemplifying how the estimates from both the MRP model and the one by averaging the CCES responses closely match each other, further corroborating the precision of the MRP estimate as illustrated in Lopez-Martin et al. (2022). Therefore, as discussed before, the MRP in this case does not provide a substantial advantage given the large and representative sample size of this study, but we can still see its contribution in estimating accurate subnational opinion through national surveys. 4
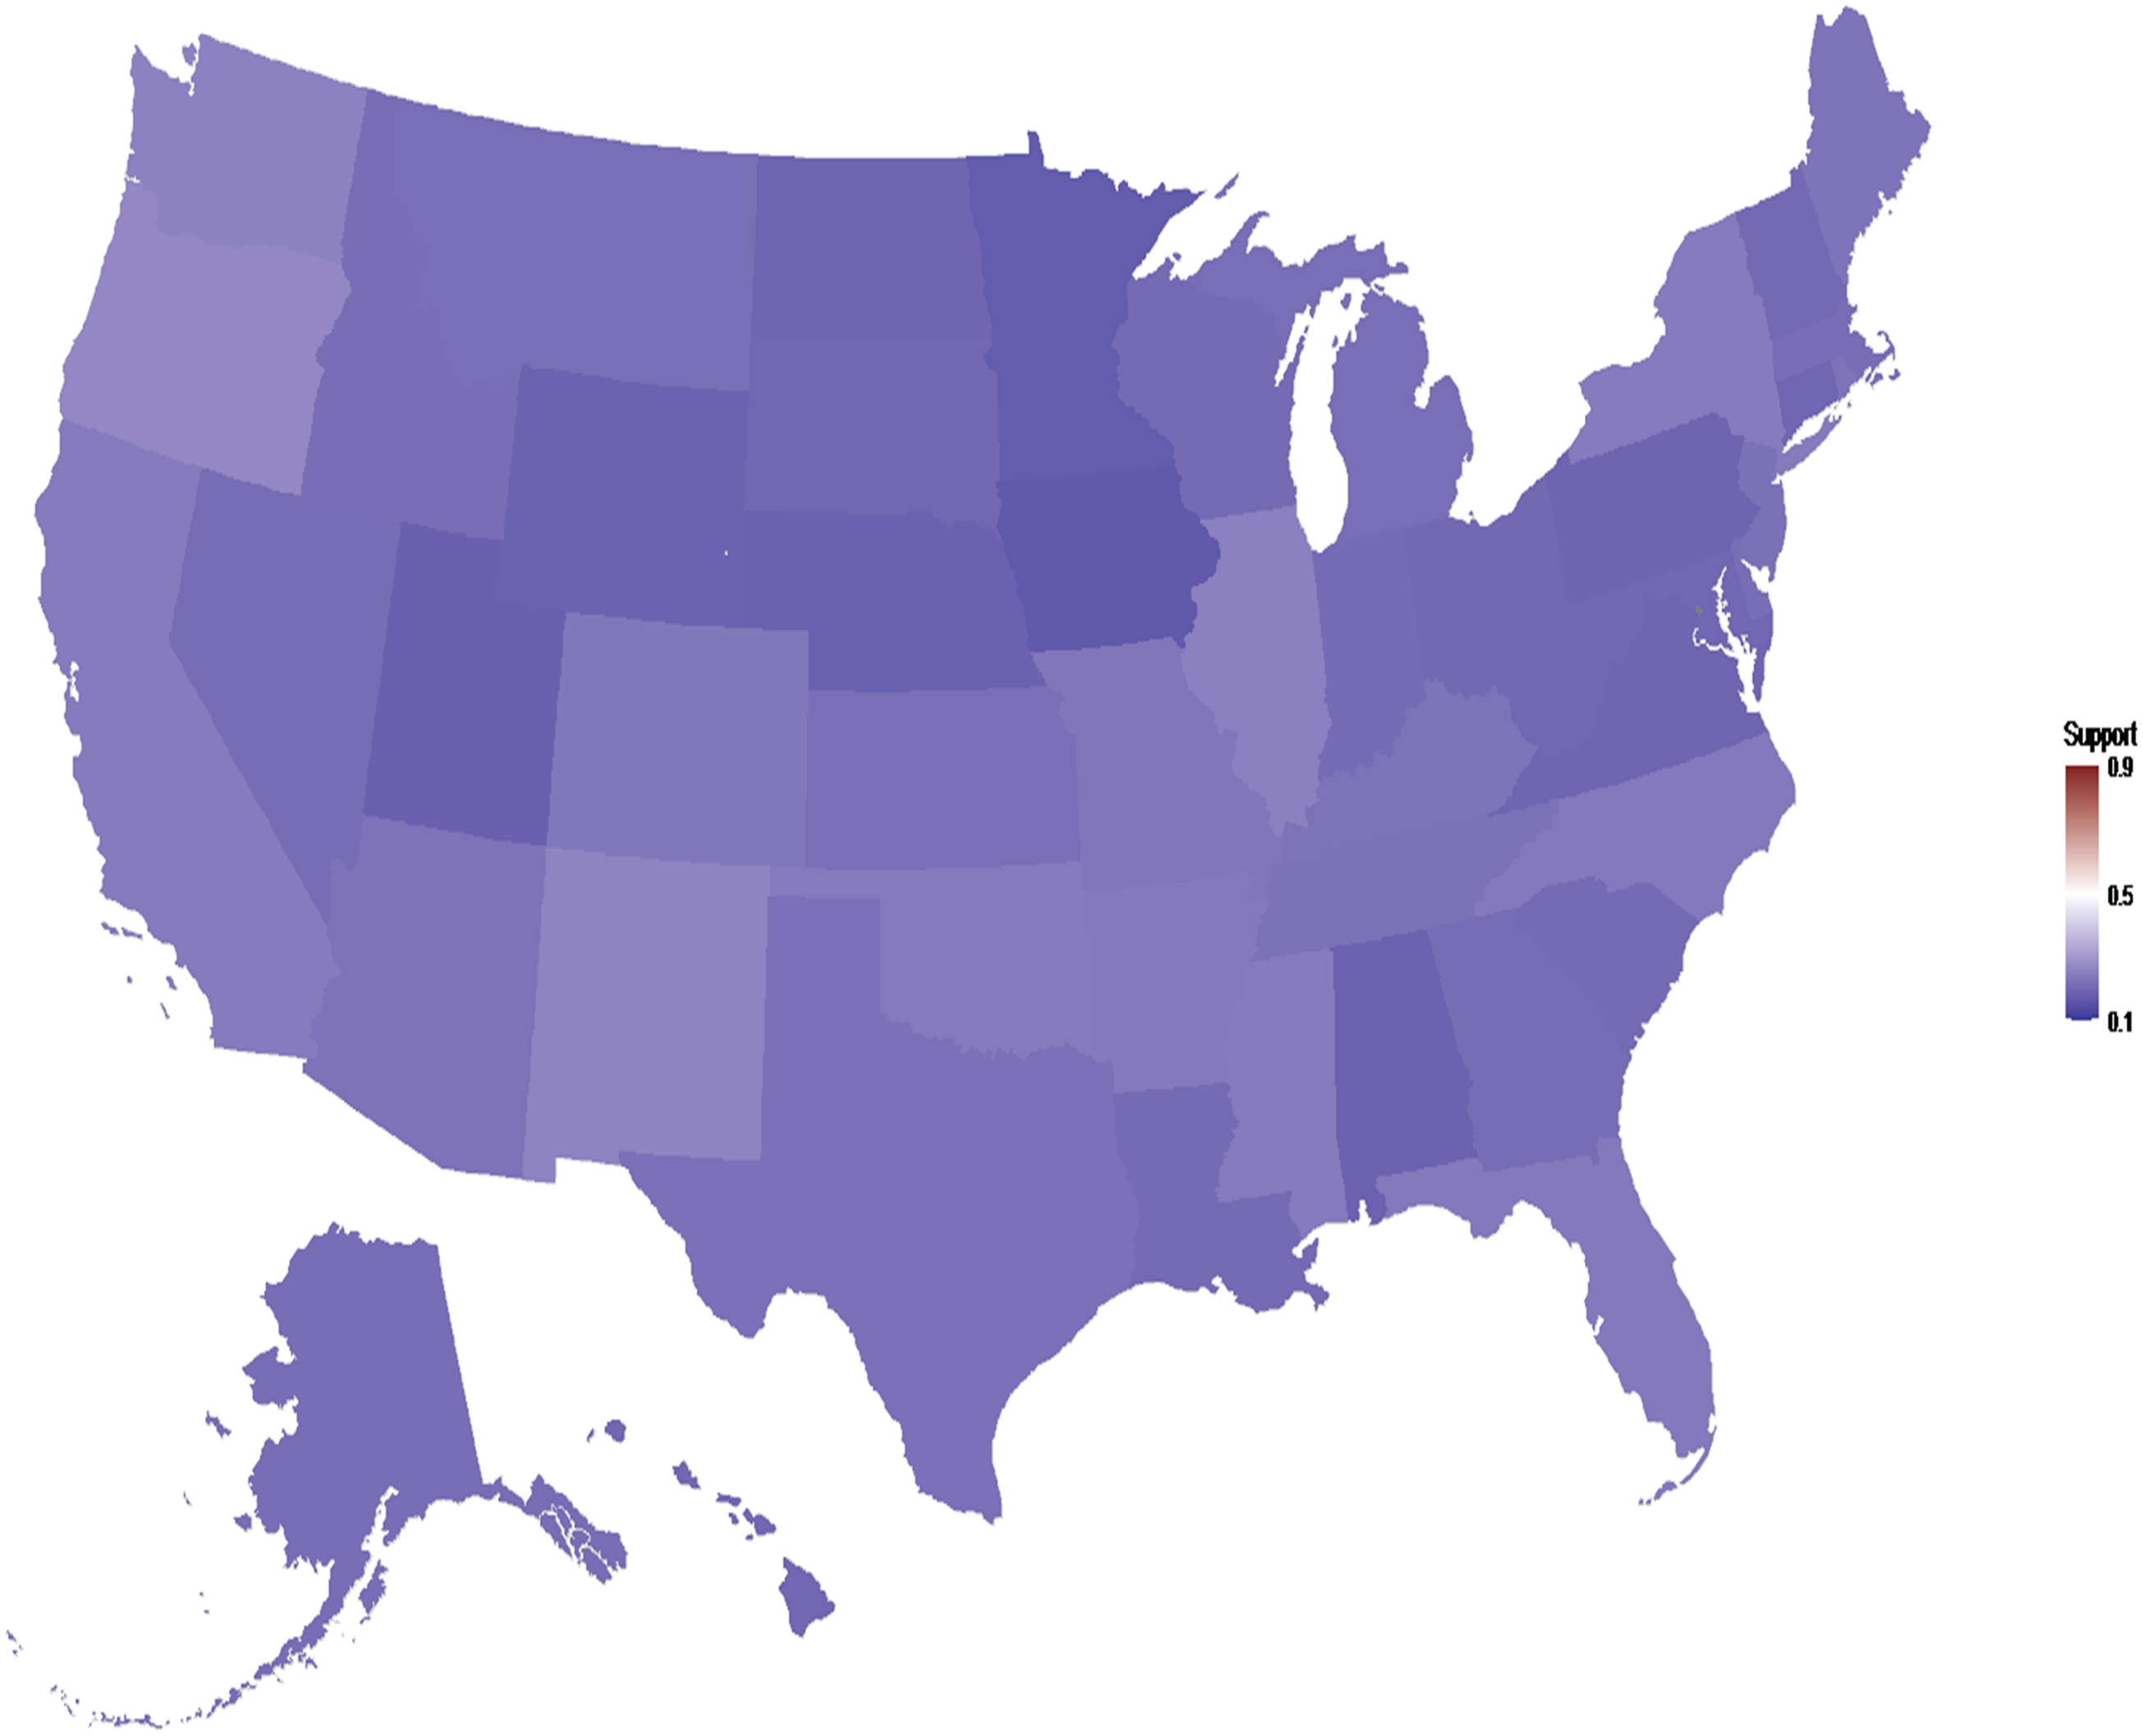
The plot also compares both estimates for each state, showing that although more conservatives states like Alabama, Utah, and Iowa have less support for an increase in welfare spending than not an increase as opposed to more liberal states like California, New York, and Oregon, the estimates are very similar, hovering around 17%–27% of support. Thus, this estimate corroborates previous assessments on how low support for an increase in welfare spending is, showing that it holds true at the state-level, even in more liberal areas. The map that follows better illustrates such estimates, where the stronger the color, the less the support for an increase in spending than not an increase. Appendix B presents the actual number for the estimates by state Figures 1 and 2. MRP Vs CCES state estimates for preference for an increase in welfare spending than not an increase. Estimates of public opinion by state regarding support for an increase in welfare spending.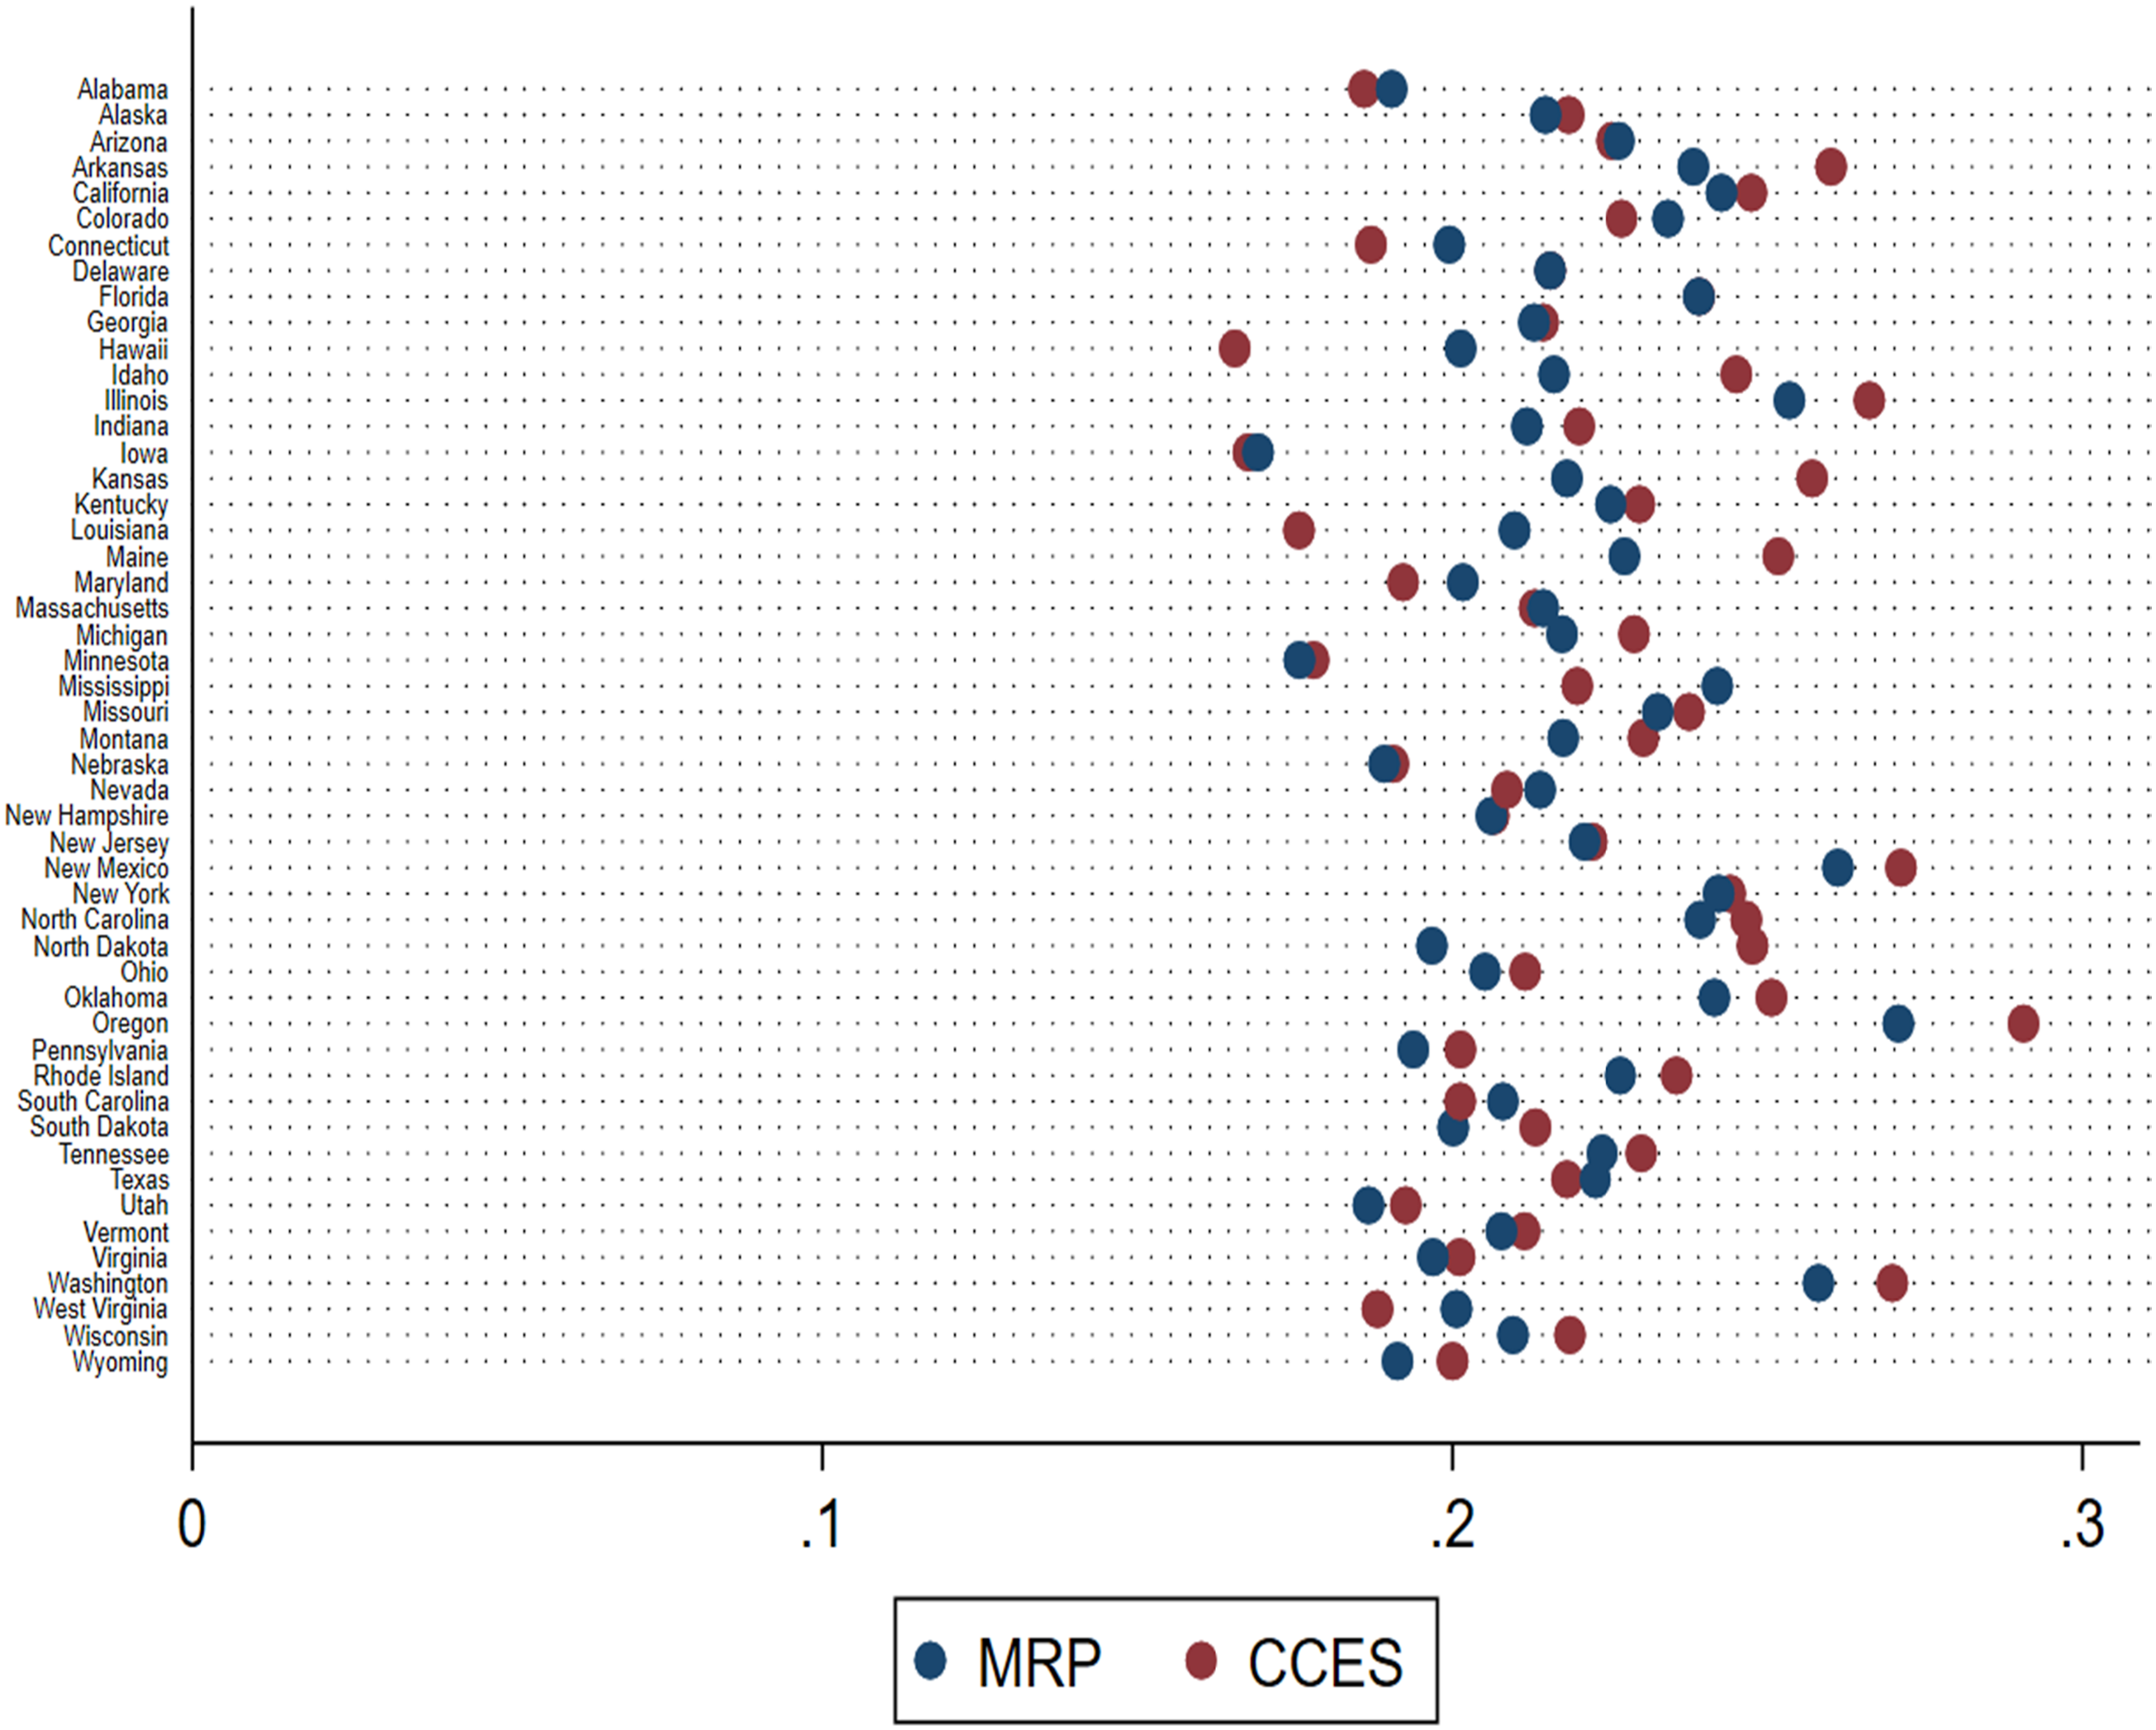
Whether such preferences are reflected or have any substantive impact on how generous their state welfare policies turned out can be better analyzed in the next table with the results for both the SNAP and the TANF generosity index.
It is possible to see that for the TANF program in 2015 using the MRP or the CCES estimate of public opinion as the independent variable, as the poverty rate increases by 1 percent, welfare generosity decreases by approximately 0.01 points. Regarding state government ideology, as state government increases by one unit, generosity increases by approximately 0.002 points. For 2016, only state government ideology showed significance at the 95% level, where a one unit increase in state government led to a generosity increase of approximately 0.003 point. As for the SNAP program, the only instance any variable showed significance at the 95% level was the poverty rate for 2015 using the CCES estimate as the independent variable. Here, as the poverty rate increases by one percentage point, generosity increases by approximately 0.01 points. None of the other variables showed significance at the 95%level for any of the models. In this manner, regarding public opinion, neither the MRP estimate nor the CCES estimate was significant at the 95% level for the TANF model or the SNAP model in any of the years. It follows that public opinion did not have any impact on how generous welfare policies turned out in the states, and it did not seem that being an election year (2016) has any stronger effects either5;6. The major implications of such results and the consequential policy recommendations are further discussed in the conclusion.
Impact of State Public Opinion on Welfare Generosity.

Standard errors in parentheses.
***p < .05.
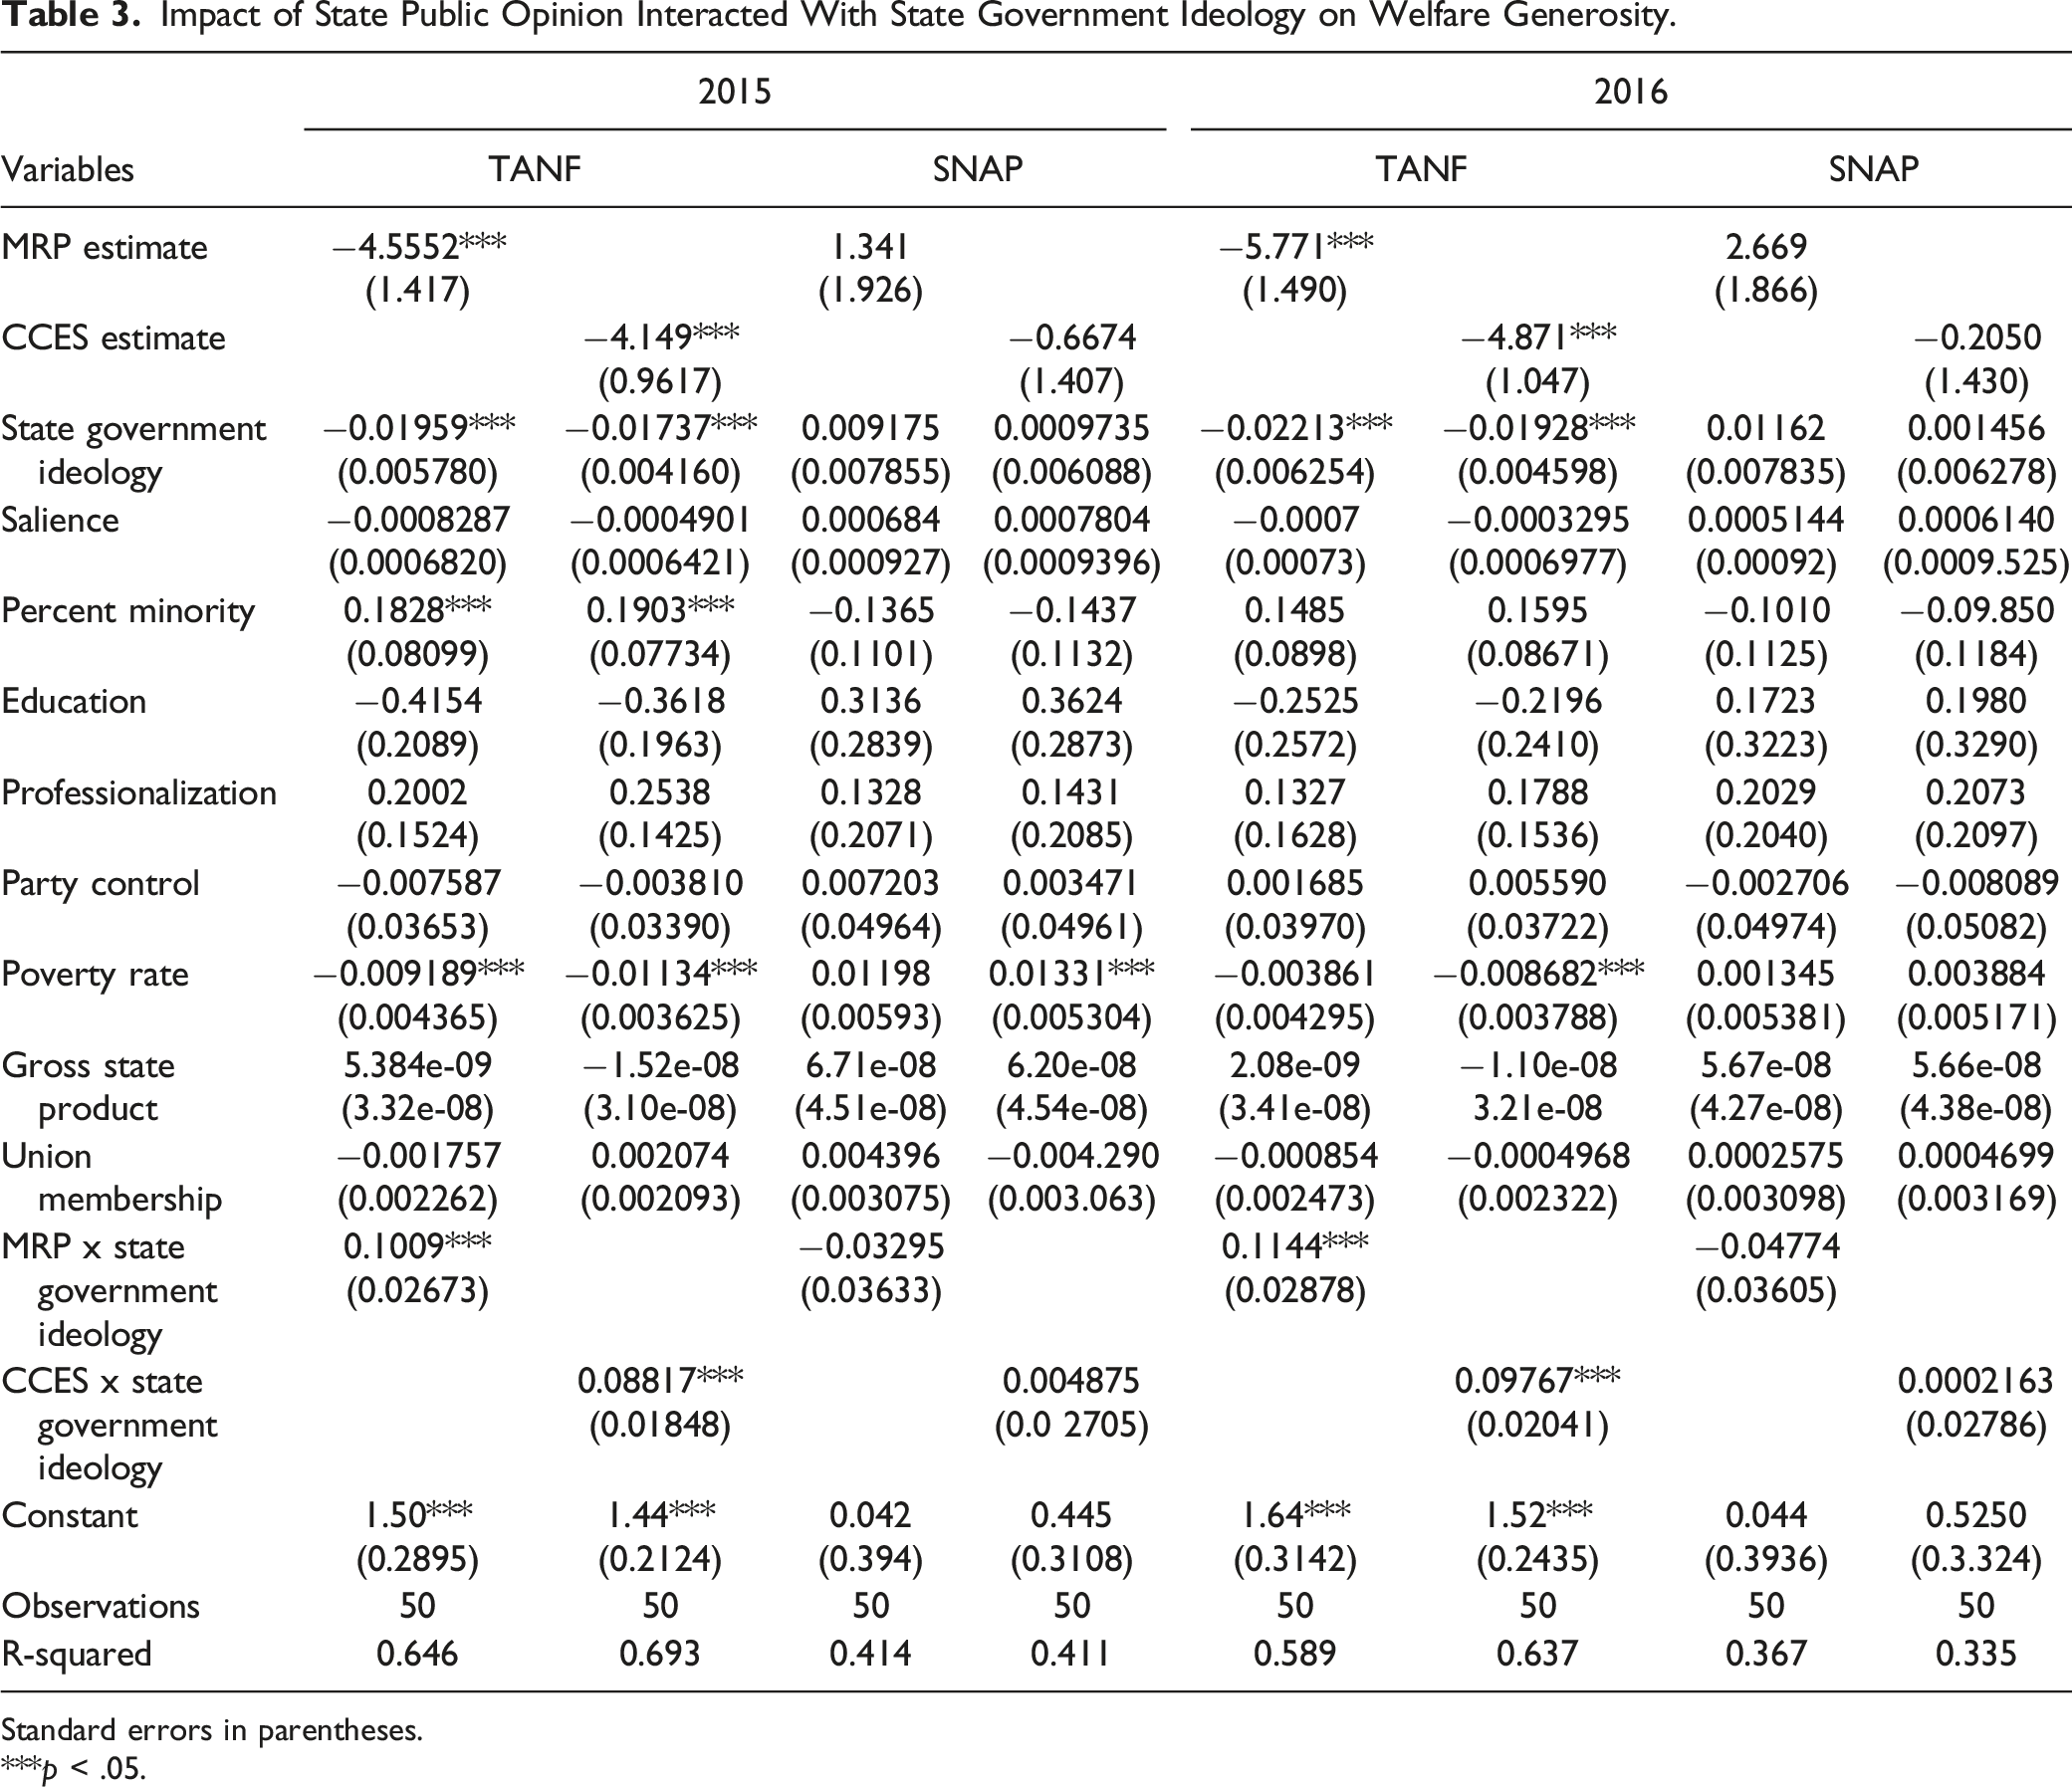
Impact of State Public Opinion Interacted With State Government Ideology on Welfare Generosity.
Standard errors in parentheses.
***p < .05.
Conclusions
The results above stressed that even though the MRP method was able to obtain valid estimates of public opinion at the state level using national survey data, the actual impact of such opinion on welfare policy was not significant. Being an electoral year did not prove to have any effect either. It then follows that the results herein are more aligned with the body of work casting doubt on any impact of public opinion on policy. To use Sharp’s (1999) terms, the relationship here seems to be of non-responsiveness and broken thermostat. Therefore, this contrasts with the few studies that argue that opinion does impact welfare programs. Possibly, a dearth of detailed data in previous analyses or not consistent methods such as either using the media as a proxy or just centering on the ideological spectrum can explain why such studies attribute more influence to public opinion at the state level. Some of these studies also centered not only on federal policies, but also on programs that have been considerably modified such as the AFDC program, further explaining the divergence in findings between this paper and such analyses. An alternative explanation is that the impact of public opinion is more on agenda setting and on a general direction of welfare programs instead on specific aspects of it as the components used in the generosity index, and therefore, more studies are needed on public opinion on specific measures for a more comprehensive analysis.
Another potential justification for the lack of public opinion influence is that people may be even less interested in welfare or tend to focus more on national-level debates. This will lead politicians to turn more to interest groups, agencies, and experts on the matter for guidance on policy action. In this vacuum of public opinion on welfare policies, politicians may also use the media or their colleagues to make inferences of public opinion, which cannot be accurate sources (Herbst, 2002) further explaining the dissonance between opinion and welfare generosity at the state level. Possible delays in the effect of public opinion may also play a role here. For example, Caughey and Warshaw (2022) find that, besides other policies, although the congruence between TANF work requirements and public opinion is weak in the short term, the correlation of opinion and policy increases over time. Therefore, more longitudinal analyses including years after this study could find greater responsiveness of state welfare generosity to public opinion.
A more empirical explanation is provided by the second model, when opinion showed significance through its interaction with state government ideology. This significance indicates that for opinion to have the desired impact on welfare policy, it must align with the ideology that controls the state government. The negative opinion estimate of when state government ideology is 0, and therefore, totally conservative (a hypothetical state, since no state fulfilled that requirement) corroborates Grumbach’s finding (2022) that Republican governments have more barriers to citizens’ input, for even if the citizens support an increase in spending than not an increase, a strong Republican government will still not provide more generous TANF benefits for being in opposition to its beliefs. In turn, the stronger the Democratic ideology, the more generous TANF becomes, showing how liberal governments may be more attuned to their citizen’s preferences, especially if it aligns with their platform.
On the other hand, an interesting finding to highlight is the opposition in direction of the effect of the state poverty rate on TANF and SNAP generosity. While the state poverty rate decreased generosity regarding TANF, it increased generosity for the SNAP program. The slight divergence in program eligibility and considering that SNAP usually receives more positive opinion than TANF may explain why states will be more generous in the former program when poverty increases, since not only more individuals are eligible for SNAP over TANF, but the work requirements are also less stringent in comparison. Moreover, SNAP deals specifically with food, which can be seen as fundamental to people's needs, leading to more positive reaction from the public. The negative support for TANF is also aligned with Erikson et al. (2002) finding that the public will be less generous toward welfare in challenging economic times, such as when the poverty rate increases. The same could be true for the reason why state government ideology was only significant for TANF, since the more polarization surrounding this program may contribute for party ideology to have a larger role in its direction. This divergence of effects according to the type of policy may further explain other contradictory findings as why state public opinion does not affect state adoption of EITC (Franko & Witko, 2017), but impacts increases in the state minimum wage laws (Simonovits & Bor, 2023). Similarly, future analyzes can focus on the differences of opinion regarding more specifically eligibiltiy requirements for TANF and SNAP once although people may think the benefits are not generous enough, they may differ in how easily they think it is to quality for such programs.
As for the MRP model, despite its methodological benefits, one of its limitations was to use a logit dependent variable to run the first stage of the model, forcing the recoding of the variable from the CCES dataset into a dichotomous variable. This way, the analysis could not be between support and opposition, but between increase and not an increase. Looking into options to incorporate categorical dependent variables in the model can provide more clear explanations of the results. Expanding the model to include variables not found in the Census data for poststratification is another avenue for future research to provide more comprehensive results.
Consequently, this study can be expanded by attempting to produce better measurements of opinion and welfare programs. For instance, the available datasets only permitted an analysis up to 2014 to have an accurate match with the welfare generosity index and make a comparison between electoral and non-electoral years. Assuring that future data can be used for more recent years, especially after the COVID-19 pandemic can be more productive for current policy recommendations and action. Trying to find a more aligned measure of opinion and policy such as opinion on specific programs and not only on spending in general can also provide more accurate results and the actual picture of the influence of public opinion on policy, particularly at the state level. Conducting a time series or panel data analysis observing the impact over the years since the passage of PRWORA in 1996 could further elucidate if any impact happened at all in a specific timeframe and under what conditions, especially by furnishing a better analysis of the influence of electoral years.
A final expansion of the model is to conceive of methods to control for the presence of interest groups specific to welfare programs more directly. As discussed before, it would be infeasible for this study to use the available methods to do so, but future analyses can take advantage of longer timeframes and collaboration with multiple researchers to develop an accurate measure of interest group regarding welfare and contrast it to public opinion to observe if any effect is found, and therefore, when it comes to welfare action at the state level, efforts should be focused on interest groups. Nonetheless, the findings presented here are valuable starting points not only to stress that the MRP is a reliable alternative to conduct analyses of state-level opinion, but also how by keep gauging more specific variables regarding welfare beyond spending such as the generosity index and including more predictors that affect state action toward welfare can show how little impact public opinion may actually have in the states, at least on its own, and when it is in opposition to the ideology of the ruling party.
Supplemental Material
Supplemental Material - Welfare at the Statehouse Democracies: Assessing the Impact of Public Opinion on Welfare Policies at the State Level
Supplemental Material for Welfare at the Statehouse Democracies: Assessing the Impact of Public Opinion on Welfare Policies at the State Level by Rafael Molina in Group & Organization Management.
Footnotes
Declaration of Conflicting Interests
The author(s) declared no potential conflicts of interest with respect to the research, authorship, and/or publication of this article.
Funding
The author(s) received no financial support for the research, authorship, and/or publication of this article.
Supplemental Material
Supplemental material for this article is available online.
Notes
Appendix A: Variables
Measurement of Variables.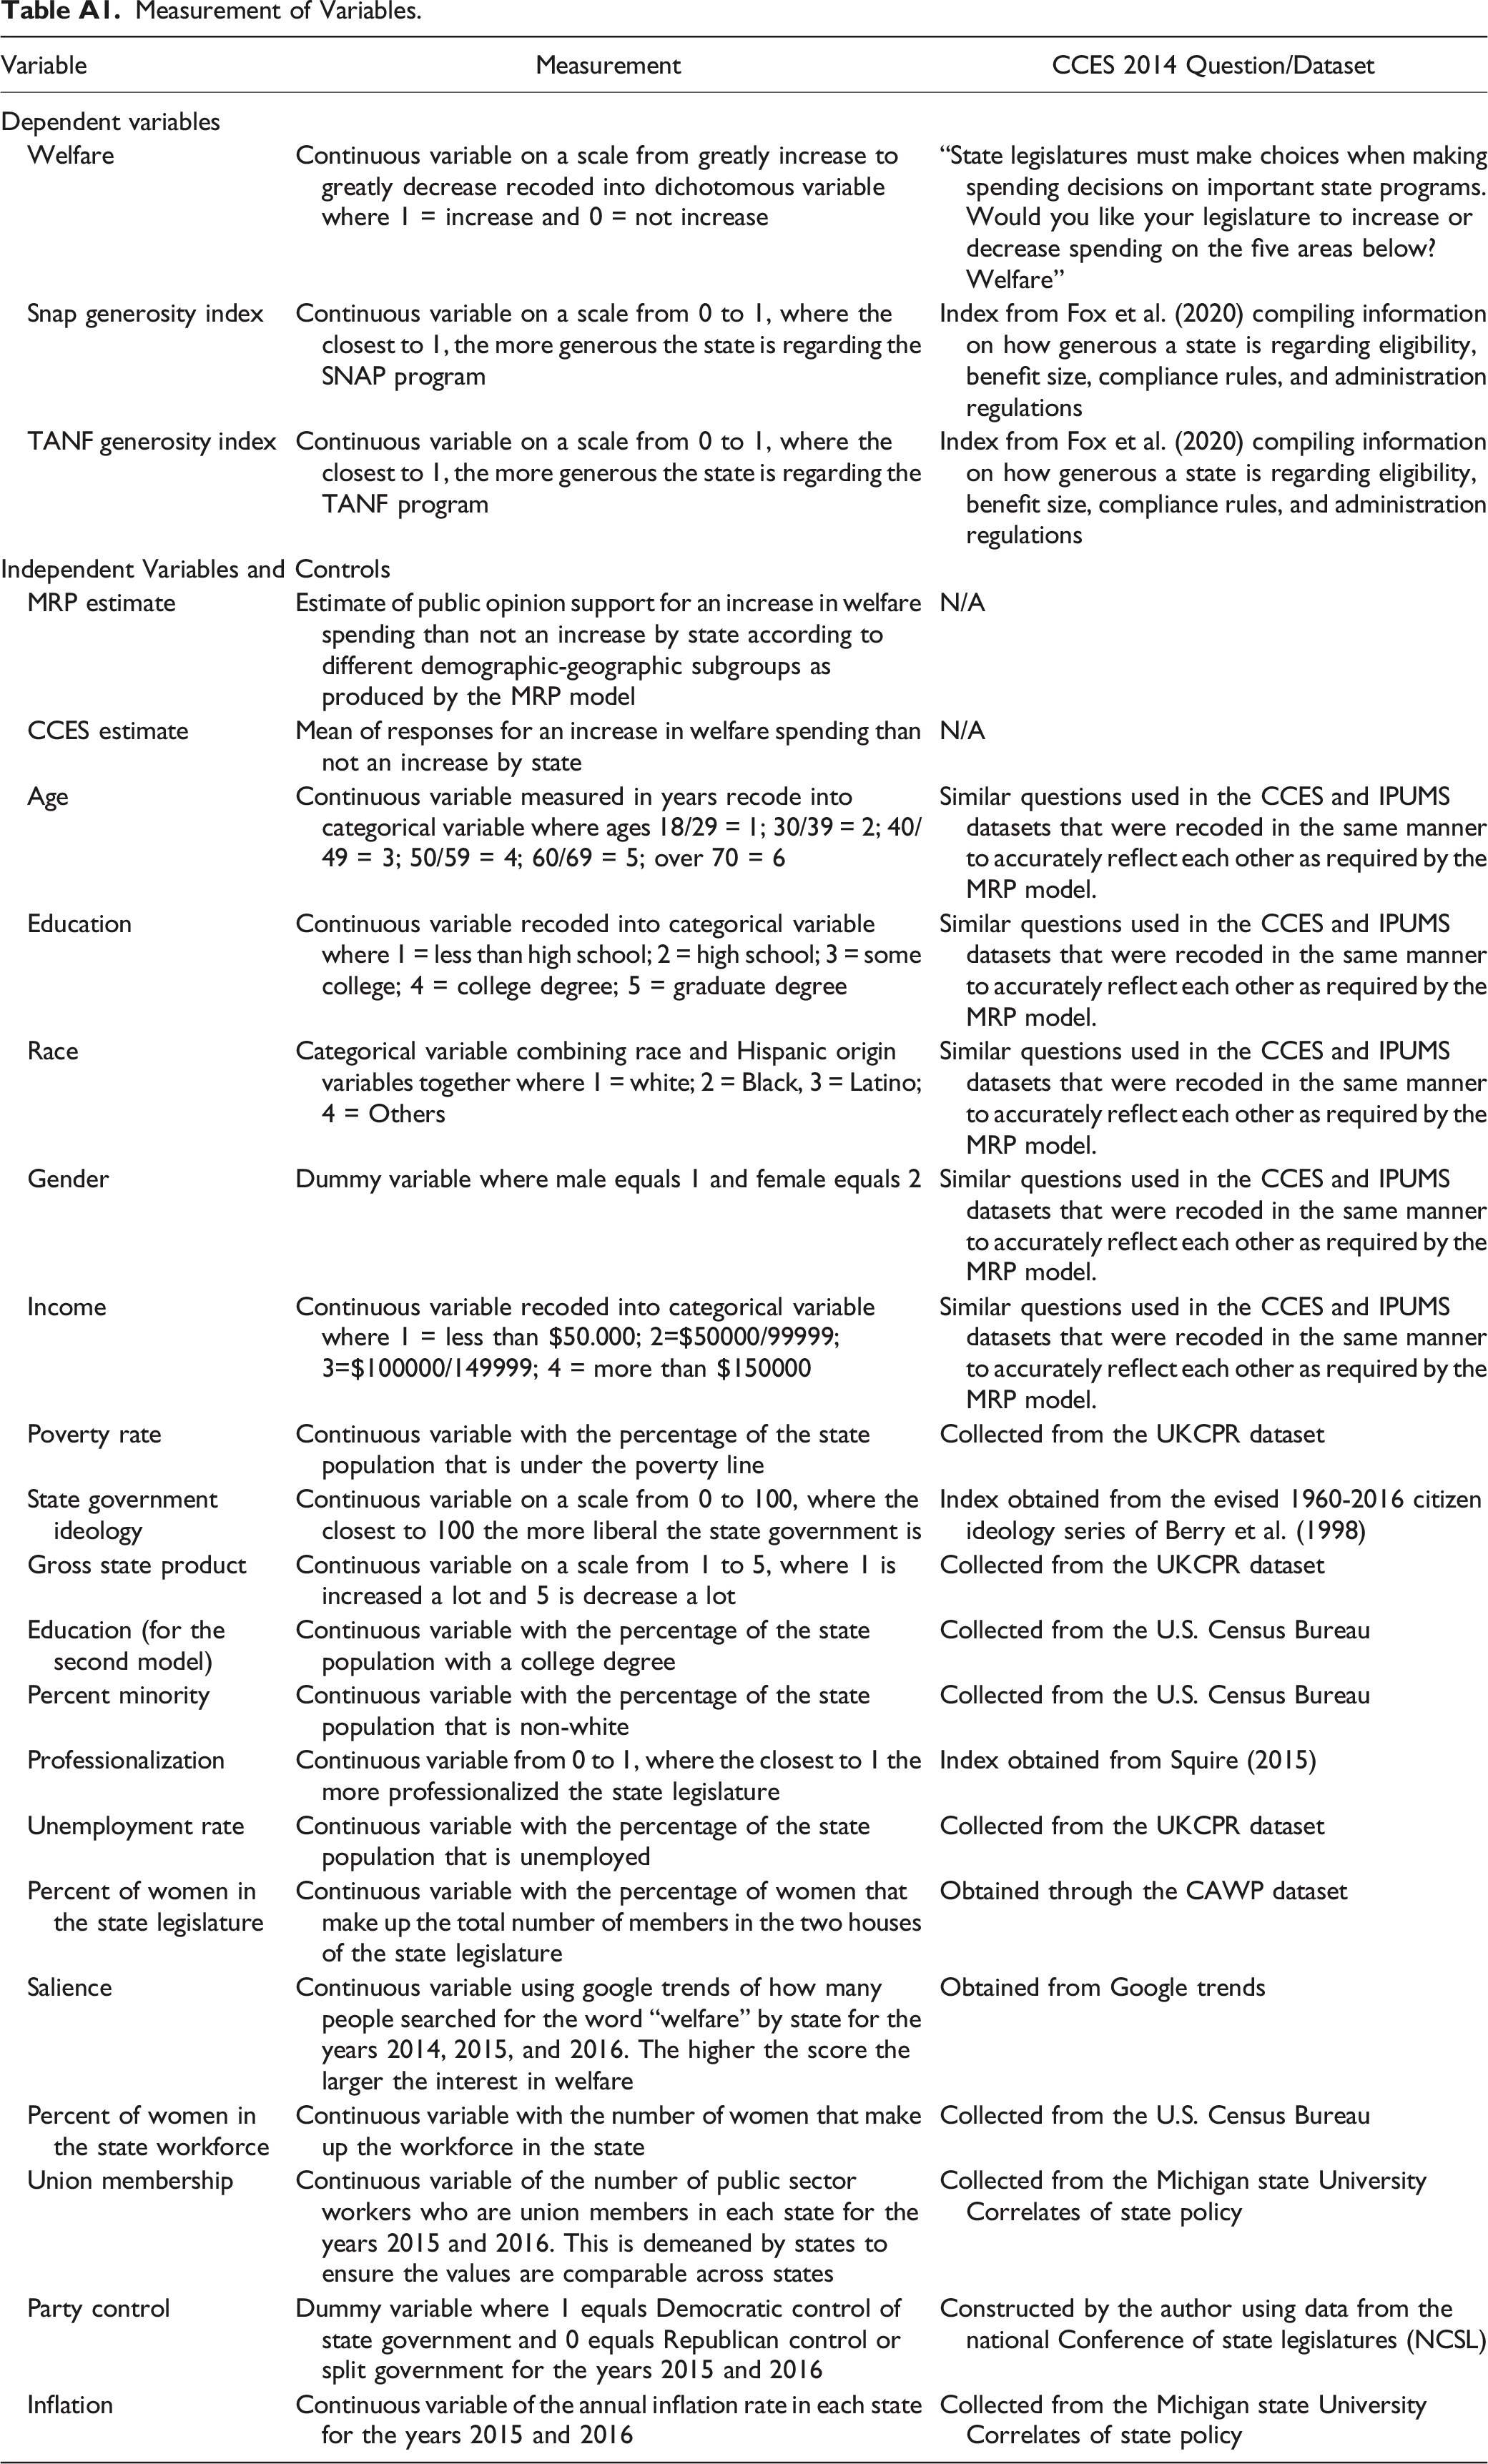
Variable
Measurement
CCES 2014 Question/Dataset
Dependent variables
Welfare
Continuous variable on a scale from greatly increase to greatly decrease recoded into dichotomous variable where 1 = increase and 0 = not increase
“State legislatures must make choices when making spending decisions on important state programs. Would you like your legislature to increase or decrease spending on the five areas below? Welfare”
Snap generosity index
Continuous variable on a scale from 0 to 1, where the closest to 1, the more generous the state is regarding the SNAP program
Index from Fox et al. (2020) compiling information on how generous a state is regarding eligibility, benefit size, compliance rules, and administration regulations
TANF generosity index
Continuous variable on a scale from 0 to 1, where the closest to 1, the more generous the state is regarding the TANF program
Index from Fox et al. (2020) compiling information on how generous a state is regarding eligibility, benefit size, compliance rules, and administration regulations
Independent Variables and Controls
MRP estimate
Estimate of public opinion support for an increase in welfare spending than not an increase by state according to different demographic-geographic subgroups as produced by the MRP model
N/A
CCES estimate
Mean of responses for an increase in welfare spending than not an increase by state
N/A
Age
Continuous variable measured in years recode into categorical variable where ages 18/29 = 1; 30/39 = 2; 40/49 = 3; 50/59 = 4; 60/69 = 5; over 70 = 6
Similar questions used in the CCES and IPUMS datasets that were recoded in the same manner to accurately reflect each other as required by the MRP model.
Education
Continuous variable recoded into categorical variable where 1 = less than high school; 2 = high school; 3 = some college; 4 = college degree; 5 = graduate degree
Similar questions used in the CCES and IPUMS datasets that were recoded in the same manner to accurately reflect each other as required by the MRP model.
Race
Categorical variable combining race and Hispanic origin variables together where 1 = white; 2 = Black, 3 = Latino; 4 = Others
Similar questions used in the CCES and IPUMS datasets that were recoded in the same manner to accurately reflect each other as required by the MRP model.
Gender
Dummy variable where male equals 1 and female equals 2
Similar questions used in the CCES and IPUMS datasets that were recoded in the same manner to accurately reflect each other as required by the MRP model.
Income
Continuous variable recoded into categorical variable where 1 = less than $50.000; 2=$50000/99999; 3=$100000/149999; 4 = more than $150000
Similar questions used in the CCES and IPUMS datasets that were recoded in the same manner to accurately reflect each other as required by the MRP model.
Poverty rate
Continuous variable with the percentage of the state population that is under the poverty line
Collected from the UKCPR dataset
State government ideology
Continuous variable on a scale from 0 to 100, where the closest to 100 the more liberal the state government is
Index obtained from the evised 1960-2016 citizen ideology series of Berry et al. (1998)
Gross state product
Continuous variable on a scale from 1 to 5, where 1 is increased a lot and 5 is decrease a lot
Collected from the UKCPR dataset
Education (for the second model)
Continuous variable with the percentage of the state population with a college degree
Collected from the U.S. Census Bureau
Percent minority
Continuous variable with the percentage of the state population that is non-white
Collected from the U.S. Census Bureau
Professionalization
Continuous variable from 0 to 1, where the closest to 1 the more professionalized the state legislature
Index obtained from Squire (2015)
Unemployment rate
Continuous variable with the percentage of the state population that is unemployed
Collected from the UKCPR dataset
Percent of women in the state legislature
Continuous variable with the percentage of women that make up the total number of members in the two houses of the state legislature
Obtained through the CAWP dataset
Salience
Continuous variable using google trends of how many people searched for the word “welfare” by state for the years 2014, 2015, and 2016. The higher the score the larger the interest in welfare
Obtained from Google trends
Percent of women in the state workforce
Continuous variable with the number of women that make up the workforce in the state
Collected from the U.S. Census Bureau
Union membership
Continuous variable of the number of public sector workers who are union members in each state for the years 2015 and 2016. This is demeaned by states to ensure the values are comparable across states
Collected from the Michigan state University Correlates of state policy
Party control
Dummy variable where 1 equals Democratic control of state government and 0 equals Republican control or split government for the years 2015 and 2016
Constructed by the author using data from the national Conference of state legislatures (NCSL)
Inflation
Continuous variable of the annual inflation rate in each state for the years 2015 and 2016
Collected from the Michigan state University Correlates of state policy
Appendix B: Comparison of MRP and CCES Estimates by State
Comparison of State Public Opinion Estimate Between MRP and CCES.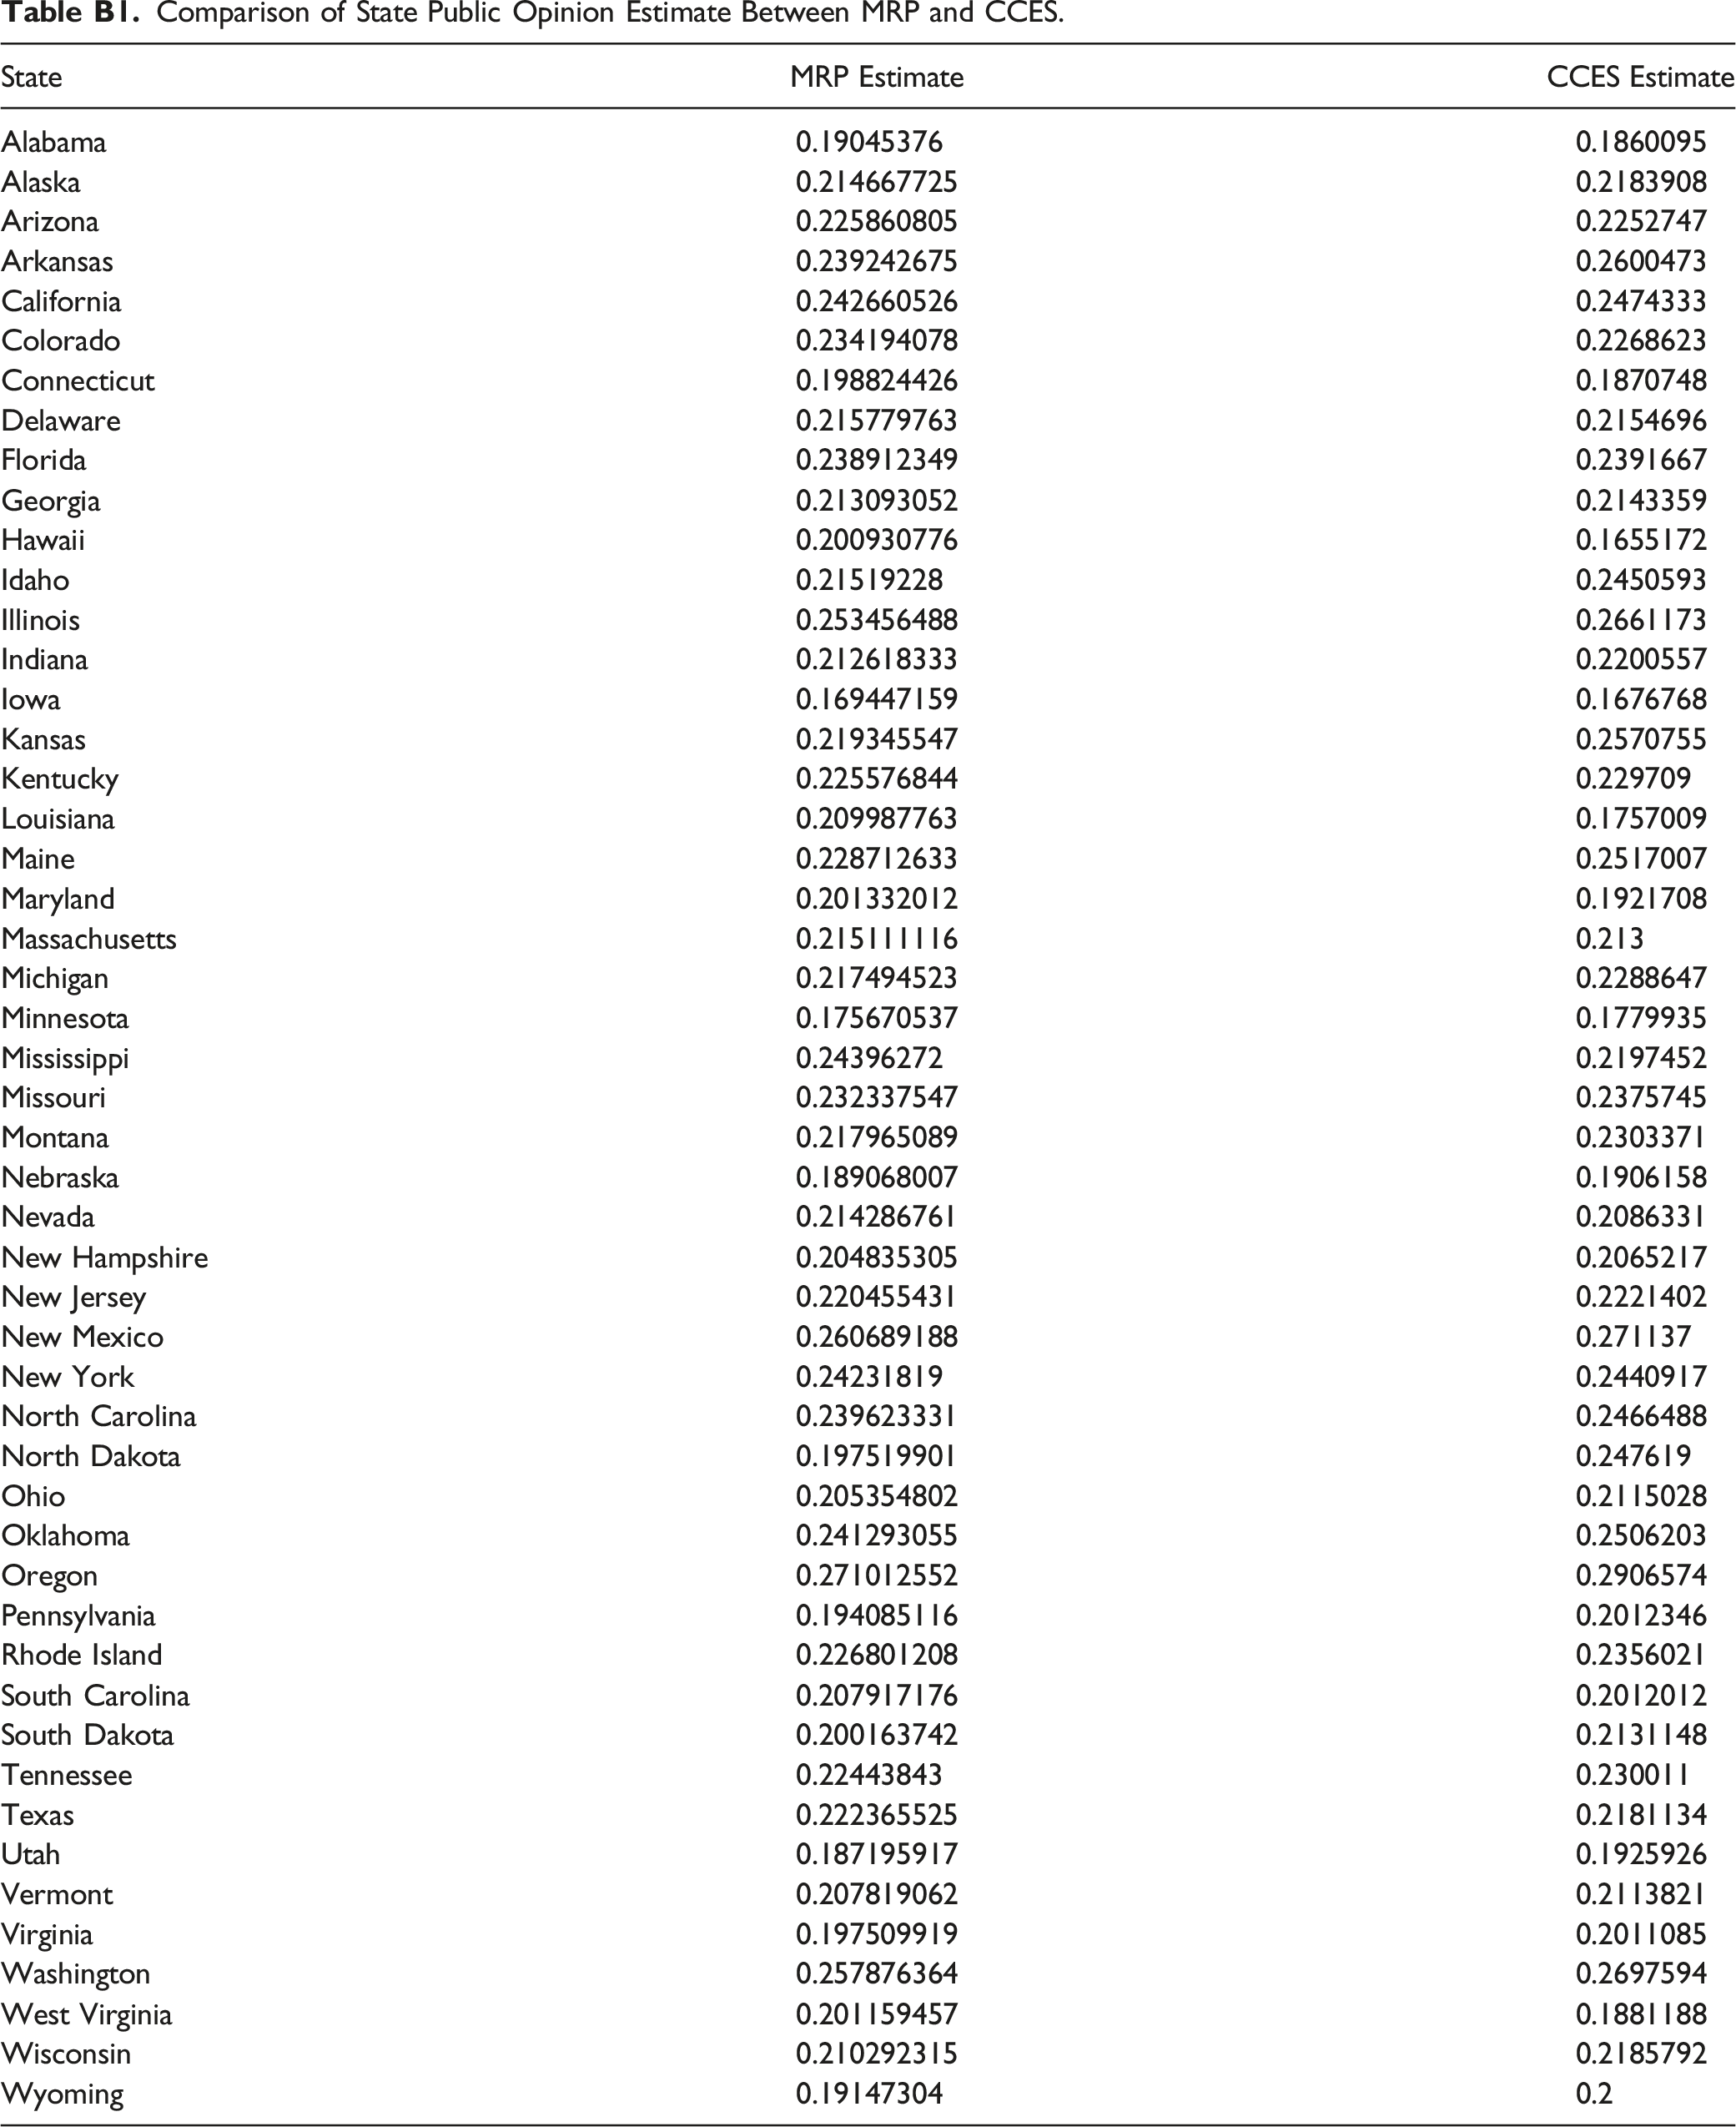
State
MRP Estimate
CCES Estimate
Alabama
0.19045376
0.1860095
Alaska
0.214667725
0.2183908
Arizona
0.225860805
0.2252747
Arkansas
0.239242675
0.2600473
California
0.242660526
0.2474333
Colorado
0.234194078
0.2268623
Connecticut
0.198824426
0.1870748
Delaware
0.215779763
0.2154696
Florida
0.238912349
0.2391667
Georgia
0.213093052
0.2143359
Hawaii
0.200930776
0.1655172
Idaho
0.21519228
0.2450593
Illinois
0.253456488
0.2661173
Indiana
0.212618333
0.2200557
Iowa
0.169447159
0.1676768
Kansas
0.219345547
0.2570755
Kentucky
0.225576844
0.229709
Louisiana
0.209987763
0.1757009
Maine
0.228712633
0.2517007
Maryland
0.201332012
0.1921708
Massachusetts
0.215111116
0.213
Michigan
0.217494523
0.2288647
Minnesota
0.175670537
0.1779935
Mississippi
0.24396272
0.2197452
Missouri
0.232337547
0.2375745
Montana
0.217965089
0.2303371
Nebraska
0.189068007
0.1906158
Nevada
0.214286761
0.2086331
New Hampshire
0.204835305
0.2065217
New Jersey
0.220455431
0.2221402
New Mexico
0.260689188
0.271137
New York
0.24231819
0.2440917
North Carolina
0.239623331
0.2466488
North Dakota
0.197519901
0.247619
Ohio
0.205354802
0.2115028
Oklahoma
0.241293055
0.2506203
Oregon
0.271012552
0.2906574
Pennsylvania
0.194085116
0.2012346
Rhode Island
0.226801208
0.2356021
South Carolina
0.207917176
0.2012012
South Dakota
0.200163742
0.2131148
Tennessee
0.22443843
0.230011
Texas
0.222365525
0.2181134
Utah
0.187195917
0.1925926
Vermont
0.207819062
0.2113821
Virginia
0.197509919
0.2011085
Washington
0.257876364
0.2697594
West Virginia
0.201159457
0.1881188
Wisconsin
0.210292315
0.2185792
Wyoming
0.19147304
0.2
References
Supplementary Material
Please find the following supplemental material available below.
For Open Access articles published under a Creative Commons License, all supplemental material carries the same license as the article it is associated with.
For non-Open Access articles published, all supplemental material carries a non-exclusive license, and permission requests for re-use of supplemental material or any part of supplemental material shall be sent directly to the copyright owner as specified in the copyright notice associated with the article.