
Abstract
Fibrous tissues play important roles in many parts of the body. Their highly organized directional structure is essential in achieving their normal biomechanical and physiological functions. Disruption of the typical fiber organization in these tissues is often linked to pathological changes and disease progression. Tractography is a specialized imaging method that can reveal the detailed fiber architecture. Here, we review recent developments in high-resolution optical tractography using Jones matrix polarization-sensitive optical coherence tomography. We also illustrate the use of this new tractography technology for visualizing depth-resolved, three-dimensional fibrous structures and quantifying tissue damages in several major fibrous tissues.
Impact statement
Organized fiber structure plays an essential role in realizing normal biological functions in fibrous tissues. A thorough understanding of the structure–function relationship in these tissues is crucial for developing effective technology to diagnose and treat diseases. Tractography imaging is an effective tool in visualizing and quantifying fiber architecture in fibrous tissues. This review describes a recently developed tractography technology that has shown great promise for fast image of 3D fiber organization with microscopic details.
Introduction
Fibrous tissues exist in many parts of the body such as heart, artery, skeletal muscles, neural fibers, skin, dental tissues, and cartilage, etc. The directional fiber organization plays an essential role for achieving normal functions in these fibrous tissues.1–6 Disruption of the normal fibrous structure is often linked to tissue dysfunction. Therefore, a detailed knowledge of the fiber architecture is not only critical for understanding the structure–function relationship in fibrous tissues, but also valuable for diagnosis and treatment evaluation in relevant diseases.
Tractography refers to a type of imaging technology specifically used for visualizing fiber organization. 7 A tractography system attains such a capability by measuring the fiber orientation at the position of each image pixel/voxel. This can be accomplished by either directly resolving individual fibers or fiber bundles from the surrounding tissues with sufficiently high imaging resolution,8–10 or indirectly deriving the directional information based on certain orientation-dependent parameters.11–13 Once fiber orientation is determined at each image pixel/voxel, computational algorithms can be applied to analyze the relationships among adjacent pixels or voxels and connect them to form fiber tracts. 14
In literature, the term “tractography” has been primarily used in association with brain imaging using water diffusion-based magnetic resonance imaging (MRI) techniques.15,16 Diffusion MRI measures the fiber orientation based on the phenomenon that water molecules diffuse easier along the fibers than perpendicular to the fibers. 11 In addition to being the primary tool in studying neural connectivity, 17 MRI-based diffusion tensor imaging (DTI) has also been successful in imaging fiber orientation in other fibrous tissues such as heart 18 and muscle. 19 The main limitation of current diffusion MRI is the sub-millimeter spatial resolution in clinical MRI systems. Such a resolution is insufficient to resolve detailed microscopic-level fiber organization in thin or small tissues. As an example, the cartilage tissue that covers the end of bones is about a couple of millimeters thick. Within the cartilage, the orientation of collagen fibers changes with depth from the synovial surface.20,21 The superficial zone thickness is about 10%–20% of the entire cartilage, or a few hundreds of micrometers in thickness. A resolution significantly better than 100 µm is needed to resolve such fine structural features when examining degeneration-induced structural changes in cartilage.
On the other hand, detailed fiber orientation can be readily resolved using high-resolution microscopic imaging methods such as histological staining, multiphoton microscopy, and scanning electron microscopy (SEM). By incorporating optical polarization components, conventional optical microscopic imaging can also be transformed into polarized light microscopy (PLM).22,23 Even when the fibers are smaller than the microscope’s spatial resolution, PLM can still derive the corresponding representative fiber orientation by measuring the optic axis associated with optical birefringence. PLM has been considered as a standard tool in orthopedics to examine collagen organization in cartilage. 24 Unfortunately, the aforementioned microscopic imaging methods require sample preprocessing (sectioning, fixation, staining, or labeling), have a small field-of-view, and can only work on thin tissue slices due to limited imaging depth. In addition, these methods obtain fiber orientation within the two-dimensional (2D) sectioning planes and cannot derive orientation information perpendicular to the section plane.
Several additional techniques have been developed for imaging fibrous structure. Over the last decade, nonlinear second-harmonic generation (SHG) imaging microscopy has achieved great success due to its strong intrinsic contrast from fibrous tissues such as collagen and myosin. 25 Because SHG signals are polarization dependent, polarization-sensitive SHG measurements have been utilized to quantify collagen organization. 26 Despite its great success in obtaining high-resolution images of fiber organization, SHG microscopy is still limited in imaging depth and field-of-view. Diffraction/scattering-based techniques using X-ray 27 or light 13 have also been explored to image large tissues. Unfortunately, these methods have poor spatial resolution and lack sectioning capability, and thus cannot obtain depth-resolved fiber orientation.
Optical coherence tomography (OCT) has shown great promise to visualize fiber organization. Invented in 1991 based on low coherence optical interferometry, 28 OCT uses light to acquire depth-resolved, high-resolution tissue structural images. It has become a powerful in vivo imaging tool in many medical fields due to its fast imaging speed and superior spatial resolution approaching that of conventional histological analysis. 29 OCT has been applied to acquire fiber orientation in brain tissue,10,30 heart tissue,31–33 and collagen tissues. 34 As an intensity contrast-based technology, OCT cannot obtain fiber orientation in tissues where the fiber or fiber bundle is smaller than or similar to OCT’s resolution. Thus, its application is limited to imaging samples with larger fiber bundles. In addition, the accuracy of deriving fiber orientation may be compromised at deeper imaging depths due to degraded signal-to-noise and spatial resolution.
Similar to the case of PLM, the capability of OCT can be extended by incorporating polarized light and polarization-sensitive detection. The resulting polarization-sensitive optical coherence tomography (PSOCT) can measure depth-resolved optical polarization changes of the backscattered incident light induced by the sample.35,36 PSOCT provides not only structure-based intensity contrast as in OCT but also optical birefringence-based phase retardation information not available in OCT. Recent developments have demonstrated the feasibility of extracting the depth-resolved local optic axis from PSOCT results using Jones matrix calculus.37–39 The obtained optic axis data can then be used to construct 3D tractography in a variety of tissues including heart, skeletal muscle, cartilage, and artery.40–46 This new tractography technology, referred to as “optical polarization tractography” (OPT) to differentiate it from conventional PSOCT, inherits the same unique capabilities of OCT. It can acquire depth-resolved 3D images of the sample, has fast imaging speed to achieve a large field-of-view, can achieve cellular-level spatial resolution depending on the spectral bandwidth of the light source, and can reach 1–2 mm imaging depth in turbid tissues.
As illustrated in Figure 1, OPT fills a gap of effective tractography imaging in tissues of millimeter thick that has not been achieved by other existing tractography technologies. An imaging depth at the millimeter level is important for applications in small animal tissues and thin tissues in large animals and humans (e.g. cartilage and vessels). In these tissues, MRI-based DTI does not have sufficient resolution to reveal detailed fiber organization, while other microscopic techniques do not have sufficient imaging depth to visualize the entire tissue thickness. Although OPT relies on imaging tissue birefringence as in PLM, OPT can obtain depth-resolved fiber orientation that is not possible in PLM. In comparison with OCT, OPT can still measure the representative orientation of a fiber bundle even when the fiber size is smaller than OCT’s spatial resolution. The capability of acquiring global tractography with microscopic details makes OPT a valuable tool for studying the structure–function relationship and disease mechanisms in fibrous tissues.
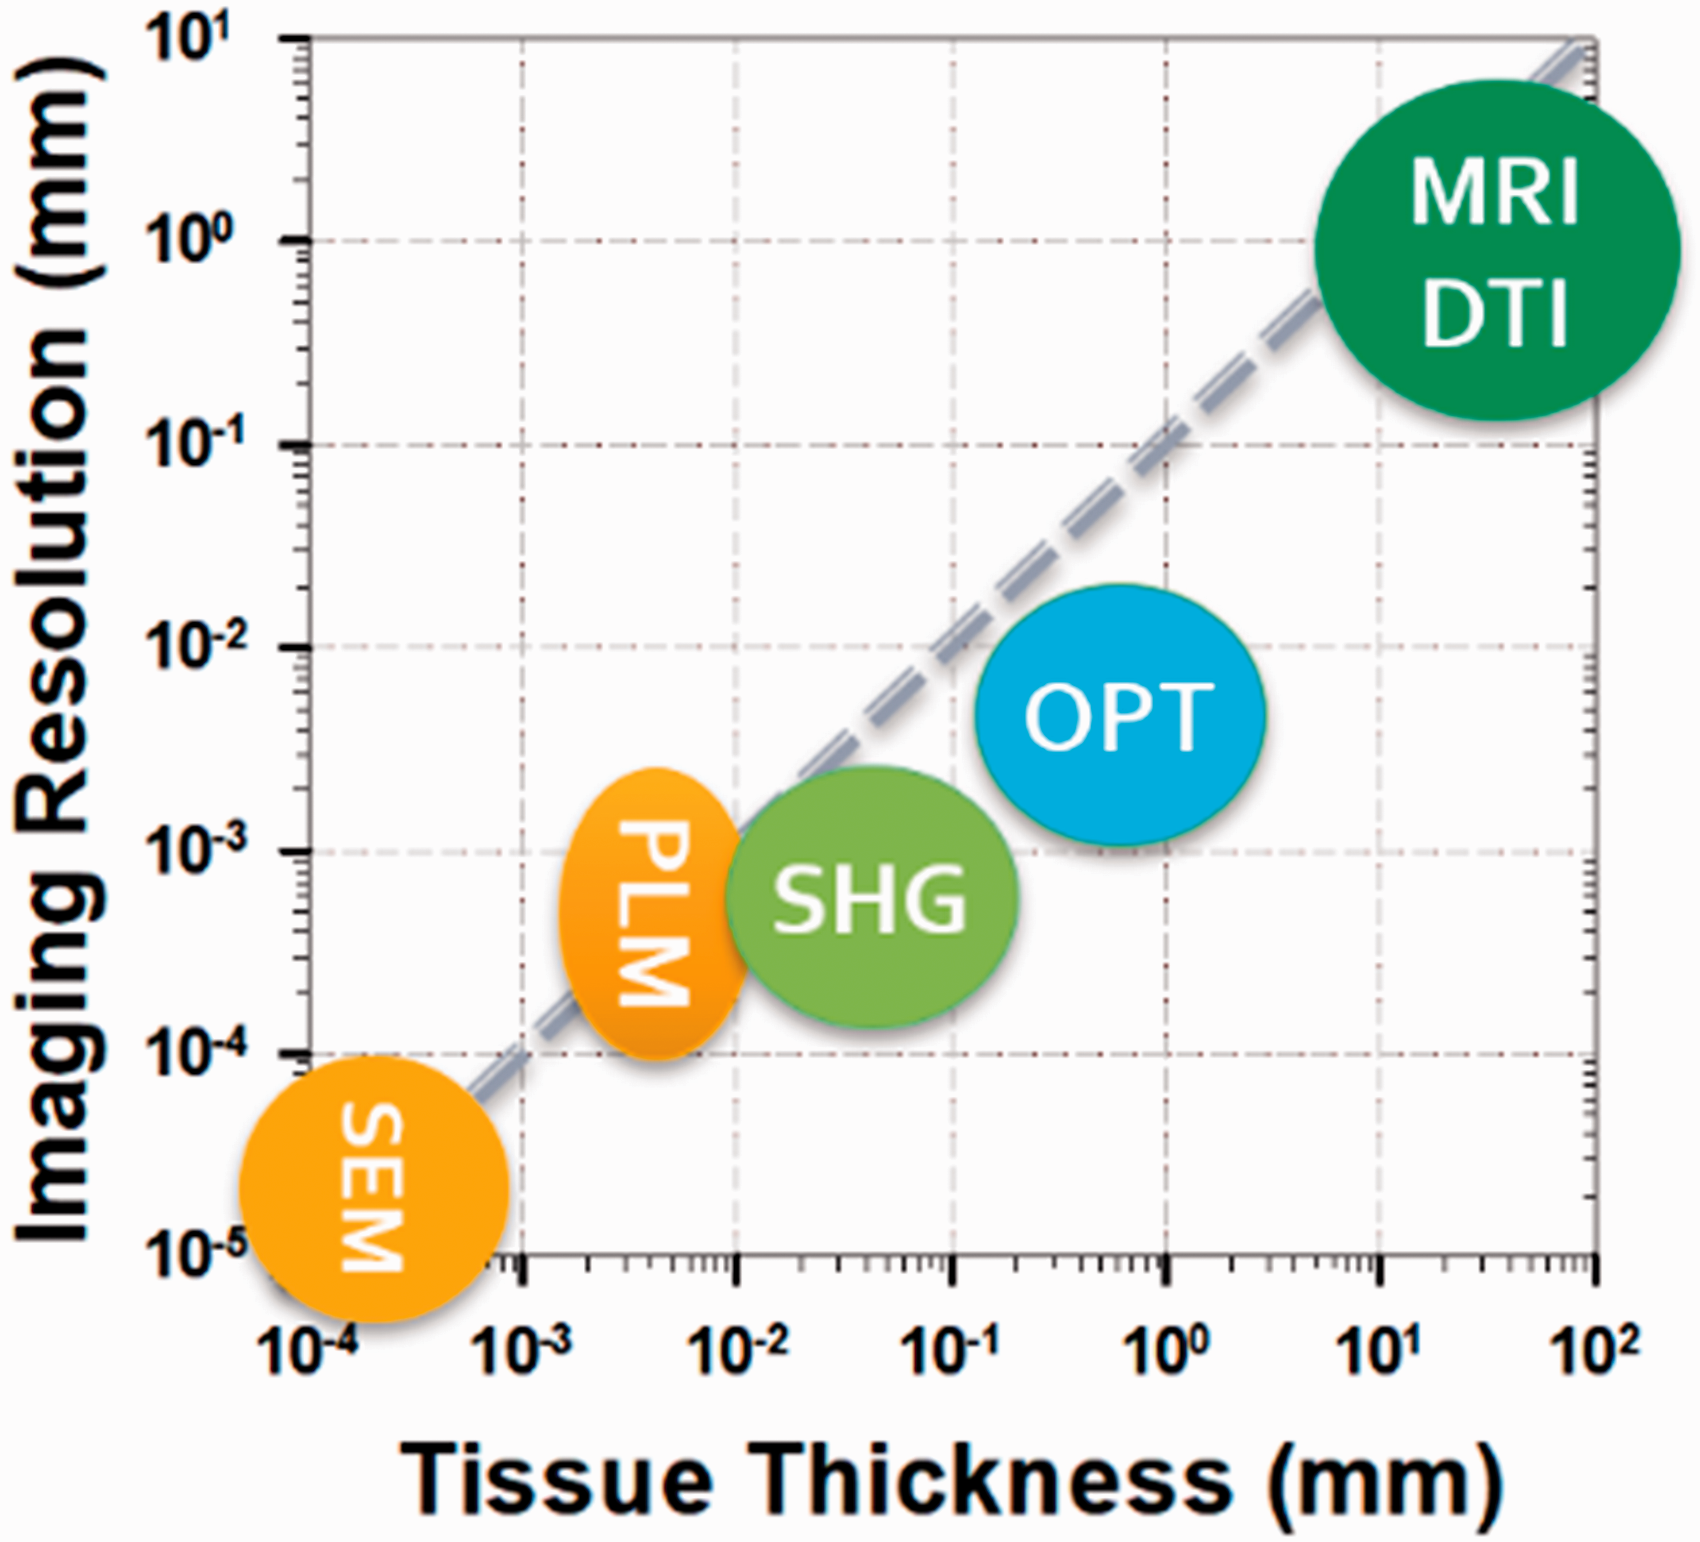
An illustration of imaging resolution and imaging depth of several typical techniques used for tractography imaging applications. The diagonal dashed line indicates the thickness/resolution ratio of 10.
Fiber orientation measurements based on optical birefringence
Quantifying fiber orientation using optical polarization relies on measuring optical birefringence properties in fibrous tissues. As an intrinsic property of the light, optical polarization describes the oscillation trajectory of the electromagnetic wave. When propagating in a fibrous tissue, a polarized light experiences different optical refractive indices depending on the relative alignment between its polarization and the fiber direction (Figure 2(a)). Specifically, the light experiences the extraordinary refractive index ne when its polarization is aligned with the fiber, and the ordinary optical refractive index no when its polarization is perpendicular to the fiber. The optical birefringence is defined as the difference in optical refractive index: Δn = ne–no.
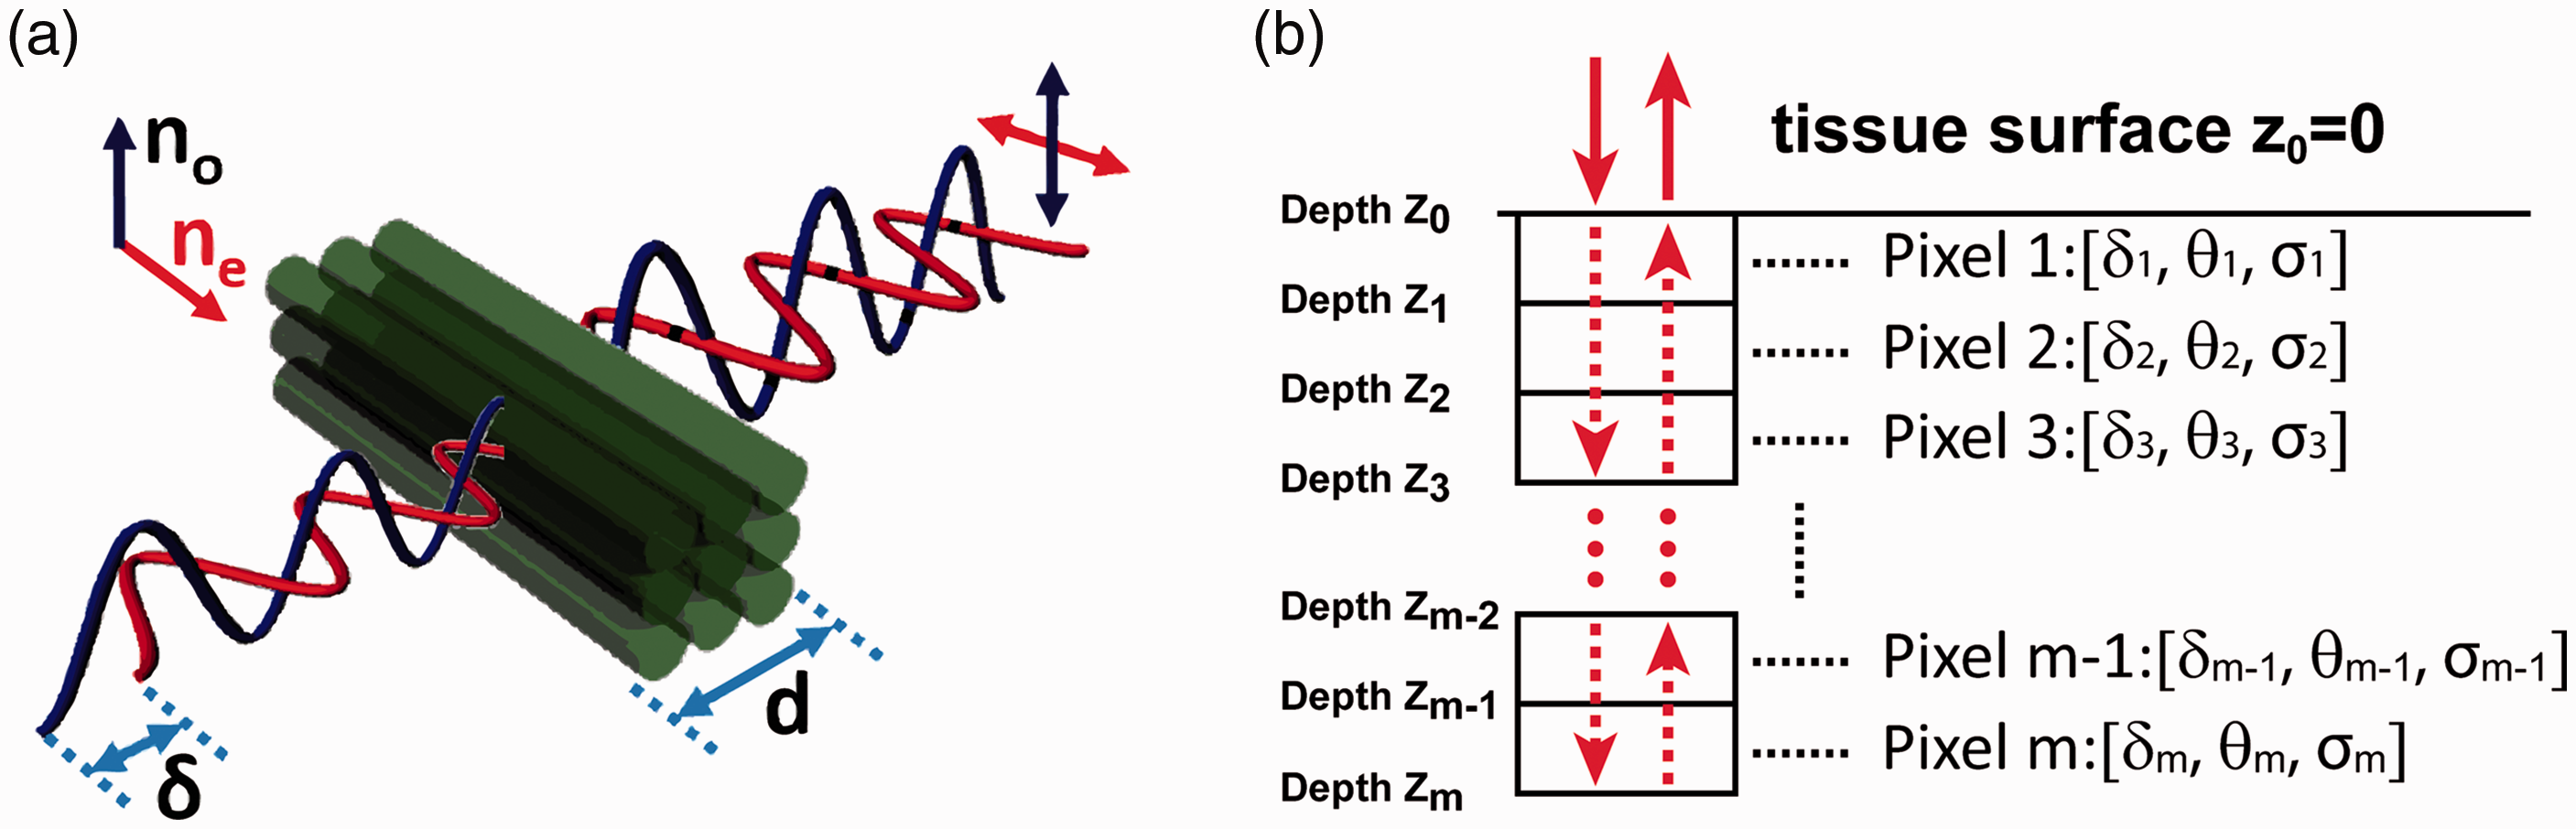
An illustration of optical birefringence measurements in PSOCT. (a) The optical birefringence (Δn = ne–no) of fibrous tissue and the phase retardation δ experienced by polarized lights after passing through a fibrous tissue with a thickness of d. (b) The round-trip cumulative polarization-sensitive measurements in PSOCT. The tissue is modeled as discrete pixels from the surface (depth z0) to depth zm. The polarization properties of each pixel are represented by phase retardation δ, optic axis θ, and diattenuation σ. (A color version of this figure is available in the online journal.)
The fiber orientation can be derived from the optic axis associated with ne. The birefringence Δn can be derived from the phase retardation δ between the two orthogonal polarization components of the incident light after passing through a homogeneous tissue segment of thickness d (Figure 2(a)): δ = (2π/λ)×d × Δn, where λ is the light wavelength. In fibrous tissues, the optical attenuation may also be direction dependent, i.e. the optical diattenuation effect. Therefore, the measured phase retardation is a complex number γ = δ + iσ. The diattenuation coefficient is defined as σ = µe–µo, where µe and µo represent optical attenuation coefficients when the light polarization is along and perpendicular to the fiber orientation, respectively.
Using optic axis to represent fiber orientation has been long utilized in optical characterization of materials. For example, PLM measures tissue birefringence by examining the changes of optical polarization after the light transmits through a thin sample. 24 The polarization calculation is well defined when the thin sample section has homogeneous optical birefringence. However, measuring optical birefringence and fiber orientation in PSOCT is more challenging because PSOCT works in the reflection mode to achieve depth-resolved imaging. As illustrated in Figure 2(b), the incident light travels from the sample surface (pixels 1) to the depth zm–1 before being backscattered at depth zm. Then the backscattered light travels back along the incident path and is detected after exiting from the surface. Therefore, the polarization property of the detected backscattered light from depth zm is affected by the cumulative “round-trip” sample properties from tissue surface to the imaging depth zm. When tissue birefringence and fiber orientation change with depth, their “cumulative” effects are entangled in the PSOCT measurements obtained from depth zm. Thus, the cumulative PSOCT results do not represent the true local birefringence and fiber orientation at the corresponding depth.
Realizing such problems in cumulative PSOCT results, several methods have been developed to extract the “local” birefringence or/and optic axis from the “cumulative” PSOCT measurements.47–51 To the best of our knowledge, Todorovic et al. reported the first attempt to extract local optic axis using a Mueller matrix implementation of PSOCT. 49 They modeled the tissue as a stack of layers in forms of birefringent retarders and diattenuators; both can be described using a standard Jones matrix. To derive the Jones matrix specific to a particular depth, the cumulative effects of the above layers were removed by “peeling off” the top layers one by one from the surface. However, the measurement inaccuracies may propagate and be amplified during the matrix computation. These earlier efforts have not resulted in a practical method to generate reliable 2D and 3D images of fiber orientation in tissue.
Fan and Yao later developed an improved methodology to derive the depth-resolved local optic axis from cumulative PSOCT measurements. 39 The tissue at an image pixel i was modeled as a linear retarder with a complex retardation γi and optic axis θi, which can be represented using a standard Jones matrix. Using cumulative PSOCT measurements, a modified round-trip cumulative Jones matrix was reconstructed at each depth pixel with the complex diattenuation term eliminated during the reconstruction. The local retardation was derived from two cumulative Jones matrix measurements obtained at two adjacent depths using the “similar matrix” transformation method developed by Makita et al. 51 The local optic axis at the sample surface was derived directly from reconstructed cumulative Jones matrix; it was used together with the local retardation to construct the local Jones matrix at the sample surface. This local Jones matrix was then used to derive the local Jones matrix of the next layer in depth. Such “peeling off” process was iterated to derive optic axis data at all depth pixels in a single depth-resolved A-scan. Once the local optic axis is obtained from all the A-scans in a 2D or 3D PSOCT image, tractography representation of the fiber organization can be easily constructed in the en face plane by using existing tractography algorithms such as the streamline functions available in Matlab. To visualize the 3D tractograms, the fiber orientation data can be conveniently rendered using the open-source 3D Slice software (www.slicer.org). 52
Because the above algorithm is based on Jones matrix calculus, a PSOCT system that is capable of measuring Jones matrix is needed. Such a system usually requires the use of two different incident polarizations and is more complicated than conventional PSOCT systems using only one input polarization. 35 If the sample diattenuation is negligible, the above Jones matrix-based algorithm may still be applied to derive local birefringence and optic axis using a PSOCT system with only one input polarization.37,38
Applications
The methodology described in the above section to obtain local fiber orientation is generic and can be implemented in any PSOCT systems that can acquire Jones matrix images. We demonstrate here its applications in three major representative fibrous tissues: heart, skeletal muscle, and cartilage, which are related to major diseases in human. The results shown in this section were acquired using a spectral domain Jones matrix PSOCT. 53 However, the same method should also work in other PSOCT implementations including swept source-based systems.
Tractography of the ventricular myofiber structure in heart
The blood pumping capability of the heart is realized by the contraction of the myocardial fibers. Myofibers in the heart are organized in an exquisite helical-like structure, 54 which enables efficient transduction of electric signals and coordinated mechanical force production.1,55 Action potential propagates 2 to 10 times faster along the heart muscle fibers than along the transverse direction. 56 Disruptions of normal myofiber architecture in the heart contribute to numerous cardiac diseases.57,58 Heart structural changes may start due to a compensatory mechanism to malfunctions caused by localized lesions such as myocardial infarction or myocarditis. 59 However, progressive remodeling is always pathogenic and reverse remodeling is linked to a better prognosis. 60 Therefore, imaging the myocardial structure can provide valuable information in clinical diagnosis and treatment monitoring. It is also a vital piece of information when studying the pathogenic mechanisms and understanding the structure–function relationship in heart using animal models.1,8
Mouse models of various heart diseases are widely used in research. The wall thickness of the mouse ventricular chamber is about a millimeter, which makes it an ideal application for PSOCT-based OPT. However, the imaging depth in PSOCT is not sufficient to penetrate the whole heart. Wang and Yao designed a rotational imaging scheme that allows the imaging of the entire ventricular chamber of a mouse heart.40,44 In their setup, the excised whole mouse heart was mounted on a rotational stage using a thin needle. The scanning light repeated the B-scans from the base to the apex of the heart while the stage rotated continuously at a constant speed for 360°. The resulting 3D image dataset was then polar transformed to form a 3D image of the heart.
Figure 3 shows the OPT images of a freshly dissected BL6 mouse heart. Figure 3(a) shows the conventional 3D OCT intensity image. Although the intensity images can delineate some structural components such as the atria and ventricles, the lateral resolution of the system (∼12 µm) was insufficient to resolve myofibers.40,44 However, using the optic axis obtained in PSOCT, OPT can successfully visualize the global myofiber architecture of the ventricular wall (Figure 3(b)). The optical sectioning capability allows OPT to reveal detailed myofiber structure going through the left and right ventricular walls. As shown in Figure 3(c), myofibers in the left ventricle form the well-known cross-helical structure, where the fibers are negatively oriented at the epicardium and gradually transits to positive orientation toward the endocardium.
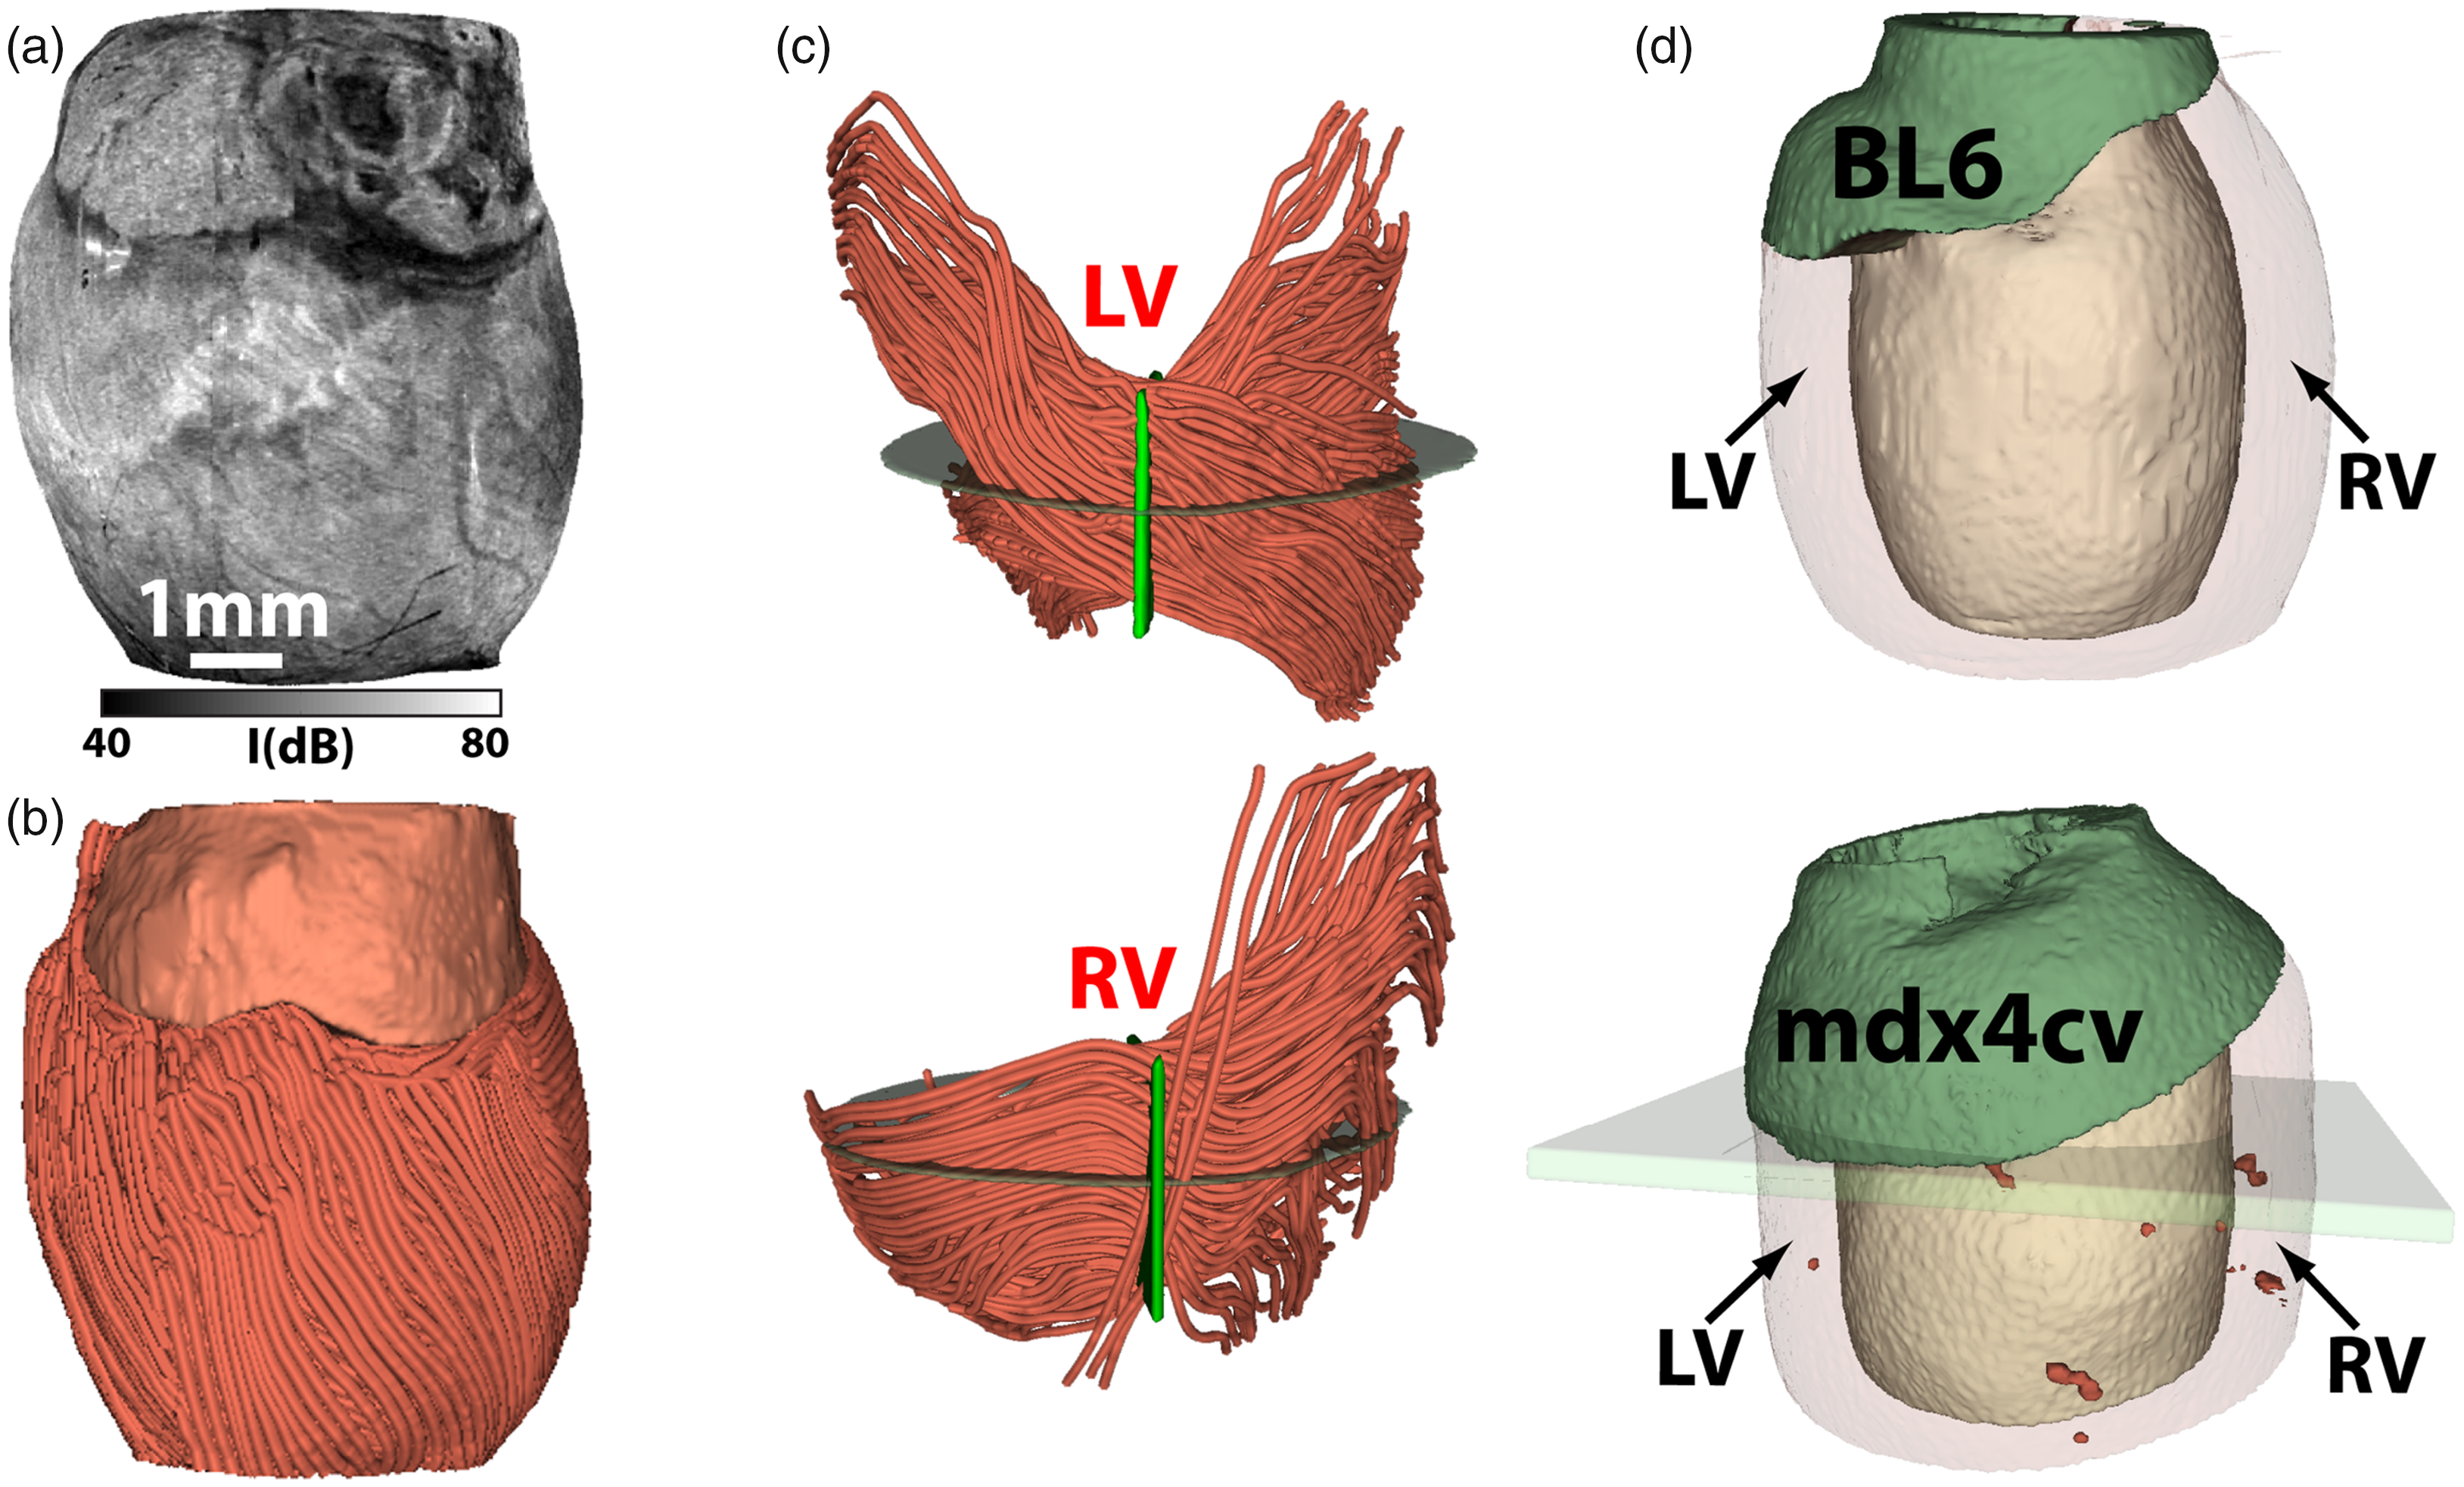
OPT imaging of the ventricular myofiber organization in mouse hearts. (a) 3D OCT intensity image and (b) OPT visualization of the global myofiber architecture in a freshly dissected heart from a seven-month-old C57BL/6 (BL6) mouse. (c) Depth-dependent myofiber orientation through the left (LV) and right (RV) ventricular walls. (d) A comparison of ventricular tissue damages in a BL6 mouse (normal) and an mdx4cv mouse, a model for Duchenne cardiomyopathy, where the dark red regions indicate focal tissue damages. The images in (a) to (c) are adapted from Wang et al. 44 ; the images in (d) are adapted from Wang et al. 62 (A color version of this figure is available in the online journal.)
Owing to its high spatial resolution, the orientation measured in OPT can be compared directly with histology results, which has been used to validate OPT’s accuracy in mapping depth-resolved fiber orientation in tissue. 61 In addition to visualizing the myofiber organization, the obtained 3D tractograms can be further quantified to study disease-related structural remodeling in the ventricular wall. For example, Wang et al. found that structural remodeling was more severe in the right ventricle in a mouse model of Duchenne cardiomyopathy. 44 Furthermore, by analyzing the disperse of fiber orientation using circular data statistics, it is possible to identify regions with disorganized myofibers. 62 These identified regions can then be used to visualize and quantify the small focal myocardial damages in the entire ventricular wall (Figure 3(d)). 62 Such quantification capabilities provide a valuable tool to determine precisely the scale and extent of disease progression and treatment outcome in small animal models of heart diseases, which is hard to obtain using standard histology techniques.
Tractography of skeletal muscle
Muscle fibers are highly organized in skeletal muscles. This allows efficient force production by coordinated contraction. Skeletal muscle diseases are generally referred to as myopathy, which covers a wide range of inherited (e.g. muscular dystrophies) and acquired (e.g. inflammatory myopathies) disorders leading to muscle dysfunction and weakness. Although a multitude tools are available for clinical evaluation of myopathy including physical movement evaluation, electromyography (EMG), ultrasound, and MRI, muscle biopsy is still considered as a standard method for a definite etiological diagnosis in both clinic practice and laboratory research. 63 The small biopsied muscle samples are commonly analyzed using immunohistochemical and histochemical methods. However, muscle damage or structural disorganization is often focal and inhomogeneous. It is challenging to assess the entire biopsied sample using labor-intensive histology methods. In addition, conventional histology cannot evaluate 3D organizational features such as fiber branching that are valuable pathological indicators in muscle diseases such as dystrophinopathies.64,65
Wang et al. demonstrated that the OPT can be a promising tool to screen for microscopic damages in a mouse muscle. 41 Figure 4(a) shows the tractography of a whole tibialis anterior (TA) muscle excised from an mdx4cv mouse. The muscle fibers were highly organized in most of the TA sample. However, there are small regions (highlighted in a different color in Figure 4(a)) where the muscle fibers had significantly large variations in orientation. The extent of such disorganization or disarray was further illustrated in a cross-sectional image (Figure 4(c)) that was constructed using the variation of the fiber orientation. Such abnormal structural feature was not clearly visible in the OCT intensity image (Figure 4(b)). A direct comparison with histology results confirmed that these were damaged regions with inflammation and muscle cell necrosis (Figure 4(d)). The size and shape of the muscle damage identified in OPT agreed well with histology. Wang et al. later extended their imaging method by imaging mouse TA muscles from two different directions. 43 Such dual-angle method enabled the determination of the absolute 3D fiber orientation in space. Once the 3D OPT was obtained (Figure 4(e)), image processing method can be applied to examine the detailed internal fiber organization by selectively visualizing individual fiber bundles (Figure 4(f)).
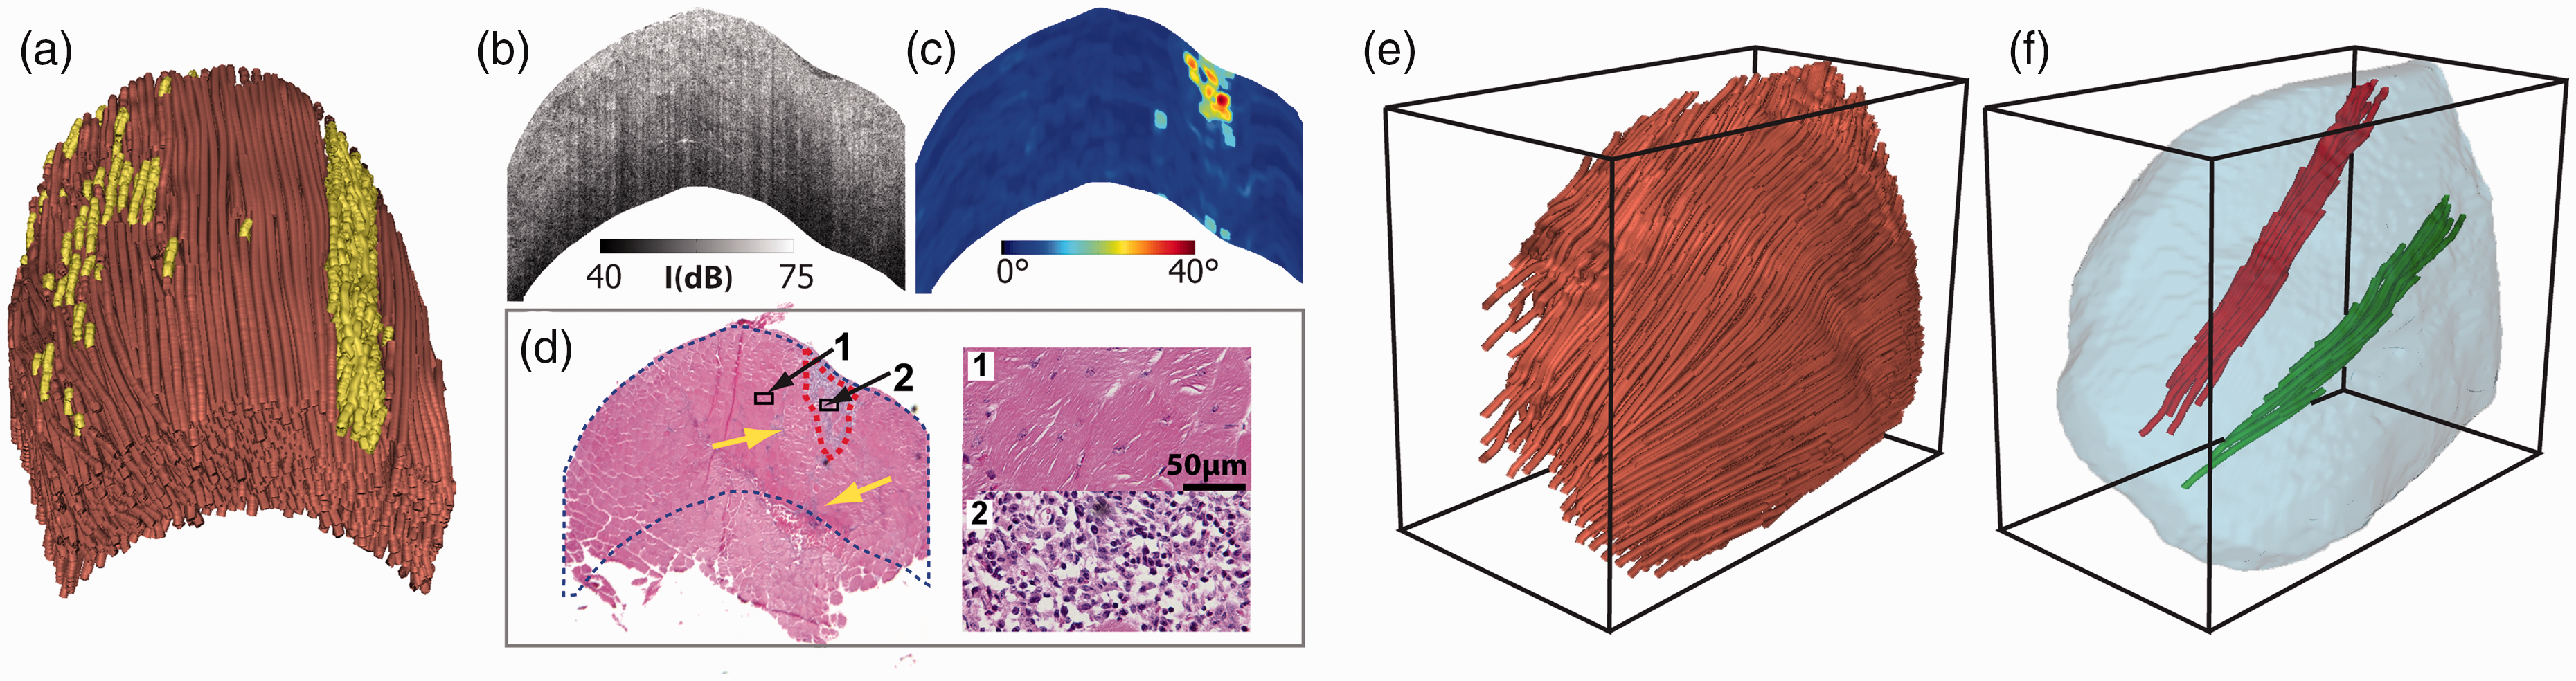
OPT imaging of freshly excised whole mouse tibialis anterior (TA) muscle. (a) 3D OPT image of the TA muscle, where the highlighted regions had significant fiber disorganization. Cross-sectional images of (b) OCT intensity and (c) variation of fiber orientation in the same TA muscle. (d) Hematoxylin and eosin (H&E)-stained histology from the same sample. (e) The absolute 3D fiber orientation acquired in a TA muscle using dual-angle OPT. (f) Examples of individual bundles of muscle fibers extracted from inside the TA muscle. The images in (a) to (d) are adapted from Wang et al. 41 ; the images in (e) and (f) are adapted from Wang et al. 43 (A color version of this figure is available in the online journal.)
Because OPT can identify small, focal muscle damages with histology-level accuracy, the results can be used to accurately quantify the amount of damage in the entire TA muscle. This capability offers a more consistent and holistic assessment of the extent of the muscle damage. In addition, due to its non-destructive nature and fast imaging speed, the same muscle sample can still be used for other standard assays such as histology and biochemical analysis. The damage map (Figure 4(a)) provides a visual guidance for researchers or clinicians to better allocate the proper tissue segments for further detailed and targeted analysis.
Tractography of the articular cartilage
Articular cartilage plays a crucial role in facilitating locomotion by covering the ends of the bones inside the joint. The exceptional mechanical properties in cartilage benefits from a specialized zonal extracellular matrix architecture. The collagen fibers in the cartilage are organized in a unique 3D “arcade” like formation. 9 The fibers are oriented perpendicularly to the interface between the calcified and non-calcified cartilage in “radial zone,” then bent in the “transitional zone” to be eventually parallel to the surface in the “superficial zone.” The collagen fibers in the thin superficial zone play a critical role in protecting the inner cartilage and maintaining proper mechanical responses for cartilage to function normally. The disorganization of the collagen network in the superficial zone is associated with early-stage osteoarthritis.66–68
Despite the importance of 3D fiber orientation in characterizing cartilage, no effective methods are currently available to obtain such information. Due to its unique depth-dependent zonal architecture, an imaging technique capable of acquiring depth-resolved fiber orientation is needed. However, the thin thickness in cartilage makes it not practical for clinical imaging modalities such as CT and MRI to reveal the detailed fiber structure at microscopic level. PLM has been recognized as the primary tool to detect fiber orientation in cartilage.24,69 Unfortunately, it can only be used to image prepared thin cartilage sections from the cross-sectional side perpendicular to the synovial surface. Moreover, PLM cannot image 3D collagen fiber orientation in the intact cartilage from the cartilage surface.
The “split-line” method, developed over half of a century ago, has been used to obtain the collagen fibers in the superficial cartilage.12,70 Split-lines are the cracks created on the articular cartilage surface when pricking the cartilage using a fine needle. These cracks are caused by collagen fibers splitting along the lines of tensile stress that are aligned with the collagen fibers in the superficial zone. Although the split line method is effective in obtaining fiber orientation in superficial cartilage, it is labor intensive and destructive, impractical for diagnostic purpose, and cannot obtain orientation beyond the superficial zone.
Due to the fine fibers in cartilage, the intensity-based OCT images do not have sufficient resolution to identify any fibers from the cartilage surface. Yao et al. recently demonstrated that OPT can successfully obtain fiber orientation in the cartilage from the synovial surface. 42 Figure 5(a) shows a direct comparison between split-line results and OPT results. Stained using India ink, the split lines appeared as dark short lines in the intensity images of the cartilage surface. Overall, the orientation obtained in OPT matched well with those measured using split lines (Figure 5(b)). However, OPT is superior over the conventional split-line method not only because it is nondestructive but also because it can map the entire cartilage instead of only selected locations using split lines.
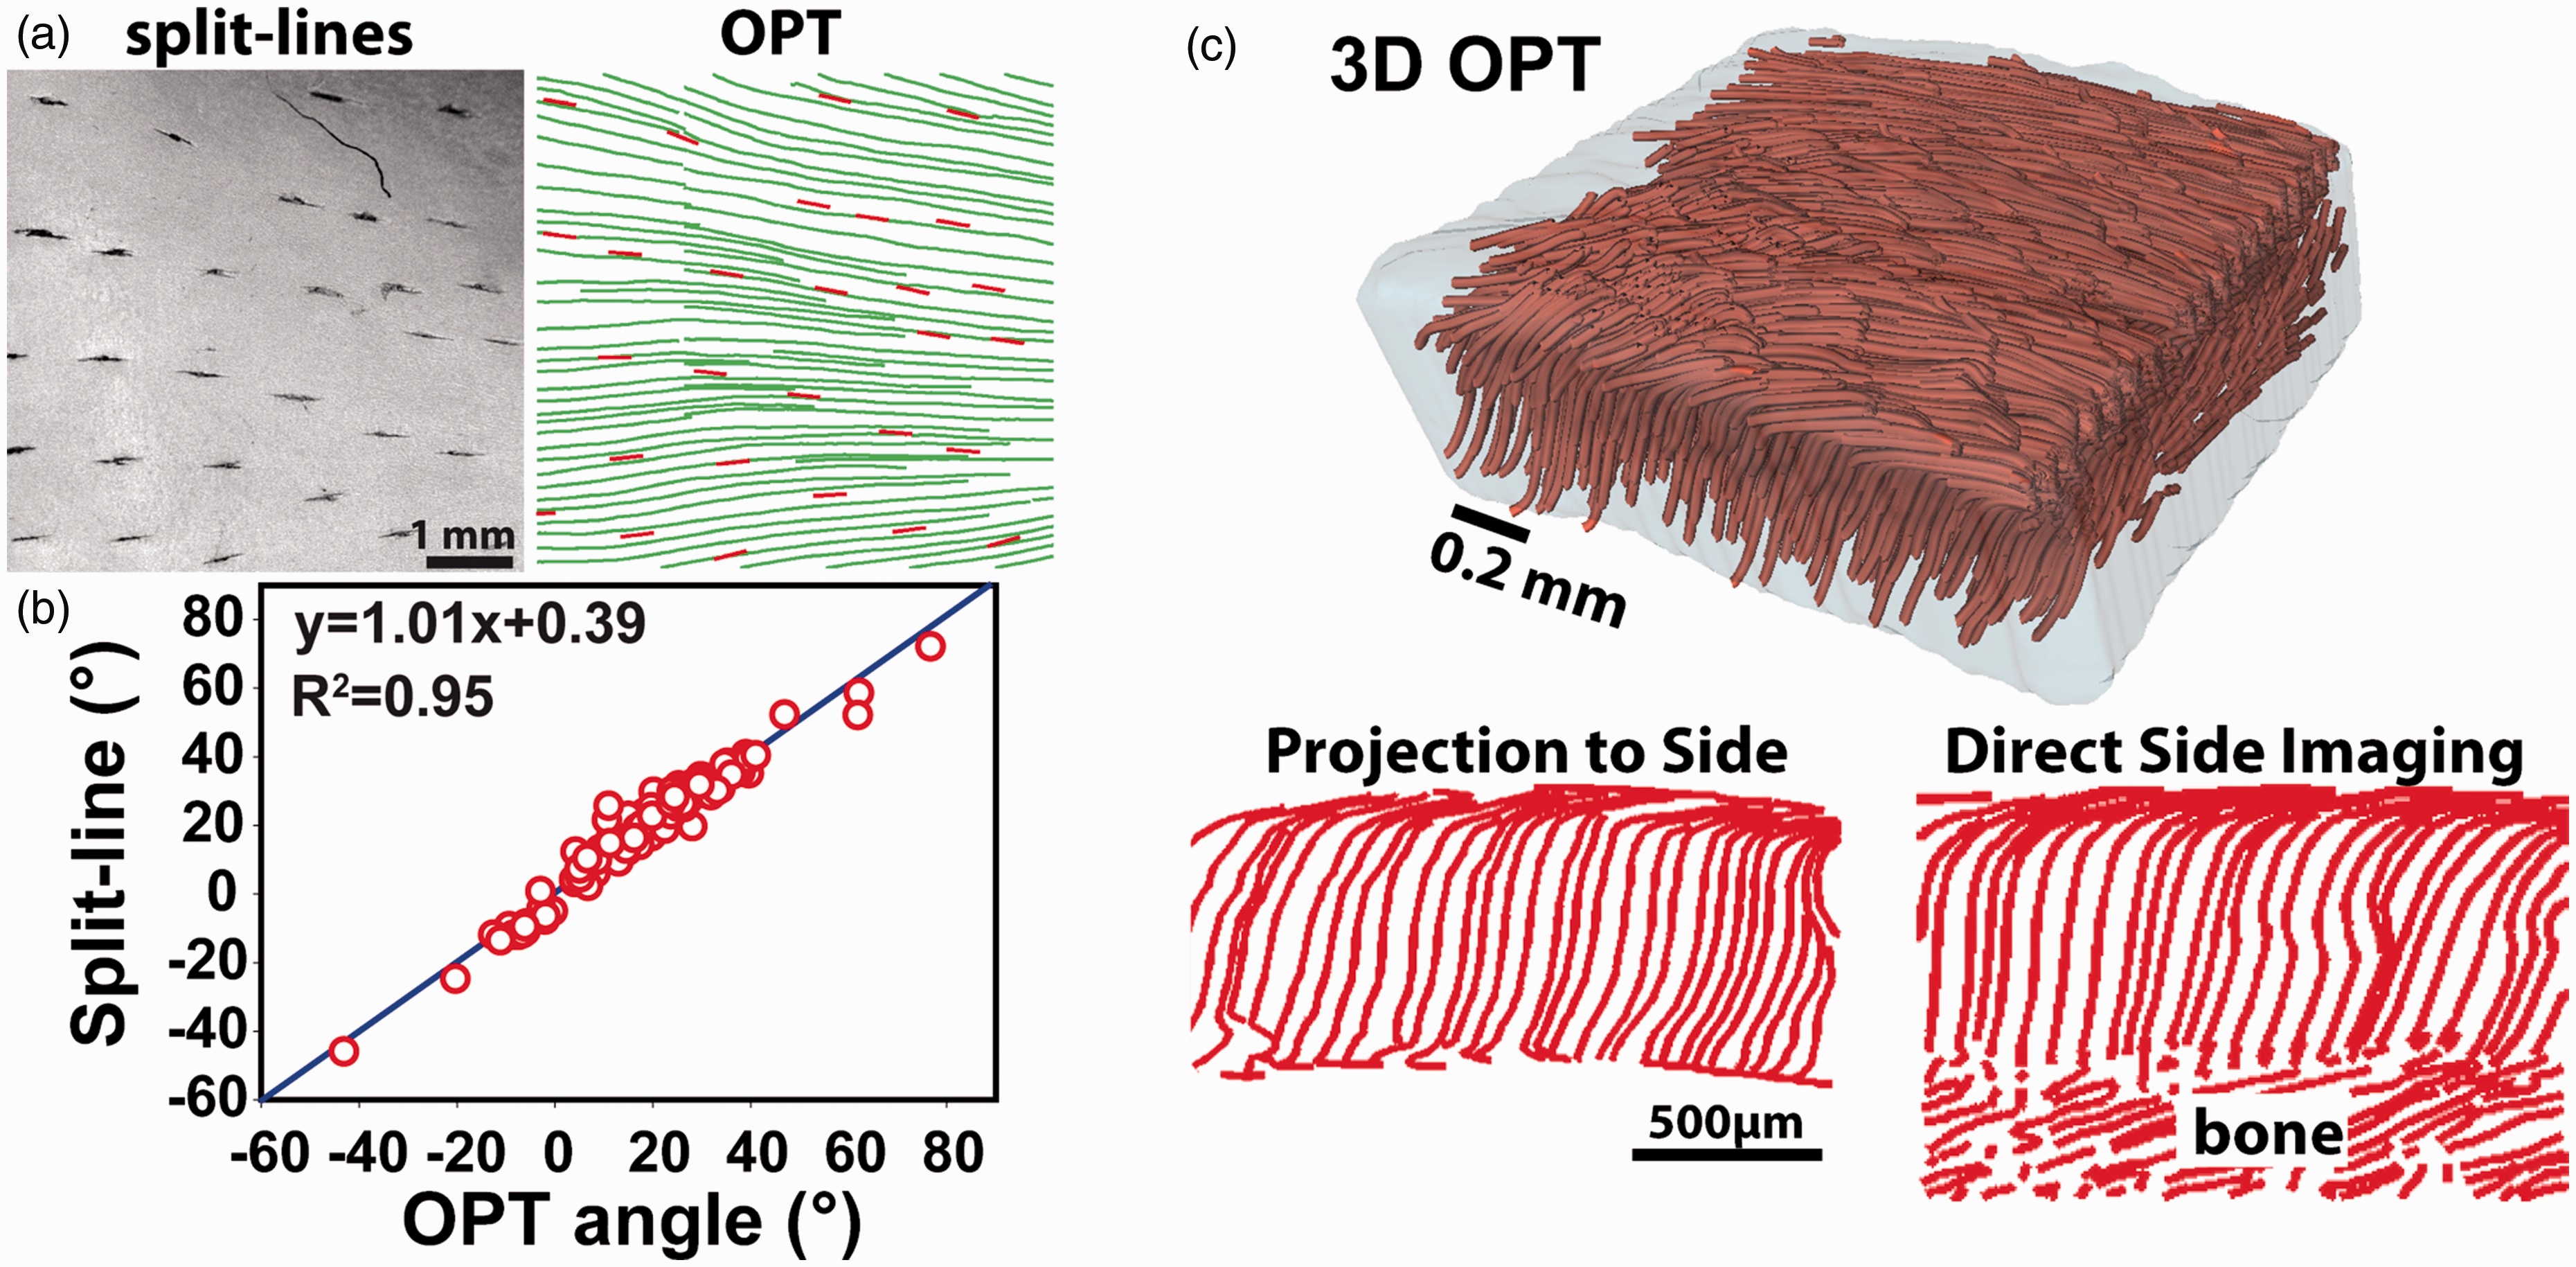
OPT imaging of collagen fiber organization in articular cartilage. (a) A direct comparison of the fiber orientations obtained using the split-line method and OPT. The short split lines indicate the cracks produced using a fine needle. (b) The correlation between split lines and OPT results measured in five cartilage samples. (c) The 3D tractography of a piece of cartilage and a comparison of the fiber orientation at the side of the sample obtained by computationally projecting the 3D tractography to the side with the results directly imaged from the side. The images in (a) and (b) are adapted from Yao et al. 42 ; the images in (c) are adapted from Wang et al. 43 (A color version of this figure is available in the online journal.)
In addition to mapping the fiber orientation in the superficial layer of the cartilage, OPT can also obtain true 3D orientation throughout the entire cartilage using the aforementioned dual-angle imaging scheme. 43 As shown in Figure 5(c), the resulting 3D OPT tractography clearly revealed the “arcade” like zonal structure in a piece of cartilage sample. The 3D tractography can be computationally projected to any 2D planes to further study the detailed fiber organization. As shown in Figure 5(c), when projecting the 3D tractography to one side of the sample, the resulting 2D tractography agreed well with that obtained by direct imaging from the side. It is worth noting that no other existing technologies has demonstrated a similar capability of visualizing the 3D collagen structure in the whole cartilage with microscopic details as shown in Figure 5.
Outlook and conclusion
Due to the prevalence of fibrous tissues in the body and their critical functional roles, PSOCT-based OPT can find applications extending beyond imaging of heart, muscle, and cartilage as described above. As some examples, SHG studies have shown that the collagen structure and disorganization are important biomarkers in multiple types of cancers. 26 By imaging and quantifying the fiber organization in tumors, OPT can be potentially useful in cancer diagnosis and staging. In cardiovascular research, the smooth muscle organization is important for maintaining the blood vessel’s mechanical strength. A recent OPT study revealed that the muscle fiber orientation varied throughout the carotid artery wall, which could be used to better delineate the layered structure in artery and examine potential disease-induced remodeling in the vessel wall. 45 Most recently, a PSOCT study showed that the collagen fiber orientation changed with location in human cervix, which may be implicated in pre-birth cervical remodeling. 71
In addition to its high resolution, fast speed, and depth-resolved imaging, OPT is essentially a multi-contrast imaging modality and can readily achieve multi-functional imaging.47,72 It can produce three different images: backscattering intensity, local optic axis, and tissue birefringence. The intensity signals can be quantified to derive the tissue attenuation coefficient that can distinguish tissues of strong backscattering such as calcification and necrotic core. 73 The optic axis is best for visualizing the fiber organization in the form of tractography. It can be used to separate tissue components of different orientations. 74 By analyzing the distribution of the orientation, it is possible to separate the strongly organized fibrous tissues from unorganized, damaged fibrous tissue.41,62 Such information can also be helpful in identifying fibrous tissue layers, for example the intima in the artery 45 and the nerve fiber layer in the retina. 75 The quantity of optical birefringence can be affected by the density and amount of fibrous tissues. It provides a strong contrast to visualize the organization of fibrous tissue components, for example the stromal collagen organization in human oral mucosa 75 and cerebral amyloid angiopathy. 76 The local diattenuation may also be obtained from the PSOCT data. Although it is understudied, the diattenuation may also provide useful information in characterizing certain structural and morphological tissue properties. 77 As shown in a recent study in cartilage, the different imaging parameters obtained in OPT may have different pathological originations. 46 If fully understood, such multi-parametric imaging capability can provide a powerful tool for tissue characterization and classification.
Perhaps the main limitation of any OCT-derived techniques is the millimeter scale imaging depth, which limits OPT’s applications to imaging thin tissues or top layers of thick tissues. Such a disadvantage may be circumvented by integrating PSOCT with fine needle biopsy for deep tissue imaging as demonstrated previously. 78 As an optical-based imaging technology, OCT-based methods are compatible with implementations using optical fibers, which has been used widely in basic and clinical applications.79–81 A major obstacle in implementing an optical fiber-based PSOCT system is the high sensitivity of light polarization to subtle disturbance in the optical fibers. However, some promising progresses have been made recently to compensate and correct artifacts induced by the fiber optical system.82,83 Although sophisticated matrix computation was needed, these recent studies demonstrated the feasibility of obtaining reliable local optic axis measurements using optical fiber-based PSOCT system. These encouraging developments will open many new application directions in the fields of endoscopic and intravascular imaging.
In conclusion, as an emerging tool to visualize tissue fiber organization, the PSOCT-based tractography has many unique advantages and potentials. It provides an effective way to quantify disease-induced fiber structure changes in studies using small animals. A capability to non-destructively visualize and quantify 3D fiber organization will create new avenues to improve our understanding of the important structure–function relationships in fibrous tissues. With the new development in optical fiber-based PSOCT technology, this new tractography technology has a great potential to contribute to the disease detection and treatment monitoring in many clinical areas.
Footnotes
Authors’ contributions
Both authors contributed to the writing of the article.
ACKNOWLEDGEMENTS
The authors thank their students and colleagues for their contributions to the relevant research presented in this review.
DECLARATION OF CONFLICTING INTERESTS
The authors hold a US patent (US15/223,624) related to the technology described in this article.
FUNDING
This work was supported in part by a grant from Department of Defense (MD150133).