
Abstract
The present study uses longitudinal data from the Pathways to Desistance project to investigate the extent to which trajectories of violent youth offending are affected by exposure to community violence. Latent class growth analysis was used to identify groups that followed distinctive patterns of self-reported violent offending and exposure to violence over time. Multinominal regression was used to identify factors that distinguished membership in the trajectory subgroups. The results indicate that youth who had more chronic and direct exposure to community violence were more likely to remain mired in violent criminal behavior, independent of other known risk factors.
For the past 30 years, research on the impact of “neighborhood effects” has focused on the relationship between structural aspects of disadvantaged neighborhoods (e.g., concentrated poverty, residential instability, population density, immigrant concentration, among other factors) and a wide variety of social and individual problems. This is certainly true with regard to youth development. In general, results from these studies coalesce around a few key points: worse outcomes for youth are associated with greater concentration of disadvantage, particularly when combined with social apartheid; these outcomes tend to cluster, such that youth are at a greater risk of experiencing multiple adverse consequences when living in disadvantaged communities; and African Americans are more likely to be segregated in these neighborhoods than any other race or ethnic group (Sampson, Morenoff, & Gannon-Rowley, 2002).
Similarly, a body of research has emerged, both in tandem with studies of concentrated disadvantage and independently, that considers how neighborhood effects are transmitted. These studies attempt to uncover experiences that connect structural characteristics of particular communities to the behavior of its residents (Anderson, 1999; Baskin & Sommers, 1998; Crane, 1991; Jencks & Mayer, 1990; Steinberg, 1987; Wilson, 1987). Thus, we know, for instance, that in neighborhoods characterized by structural advantage, youth development is positively influenced by the availability of economic, educational, and social resources (Brooks-Gunn, Duncan, Glebanov, & Sealand, 1993). On the other hand, research has demonstrated that youth exposed to community violence are negatively affected and that exposure is an outgrowth of the structural characteristics of disadvantaged neighborhoods. For that matter, exposure to community violence is highest for urban, poor, and minority youth (Aisenberg & Herrenkohl, 2008; Gorman-Smith & Tolan, 1998; Lynch, 2003; Selner-O'Hagan, Kindlon, Buka, Raudenbush, & Earls, 1998), with rates of exposure ranging from 75% to 90% (Farrell & Bruce, 1997; Selner-O'Hagan et al., 1998).
The importance of determining the effects of chronic exposure to community violence on adolescents has been established in prior research (Farrell & Bruce, 1997; Flannery, Singer, & Wester, 2001; Halliday-Boykins & Graham, 2001; McCart et al., 2007). By and large, studies reveal a wide range of adverse consequences, including mental health symptomatology (Amstadter et al., 2011; Martinez & Richters, 1993; Saunders, 2003), substance abuse (Fehon, Grilo, & Lipschitz, 2001; Kilpatrick, Acierno, Saudners, Resnick, Best, 2000), physical health problems (Kendall-Tackett, 2003), academic difficulties (Delaney-Black et al., 2002; Schwartz & Gorman, 2003), and juvenile offending (Haynie, Petts, Maimon, & Piquero, 2009; Patchin, Huebner, McCluskey, Varano, & Bynum, 2006). Additionally, research demonstrates that negative outcomes are significantly more likely and more intense among youth who have both direct and chronic exposure as opposed to only witnessing violence (Lynch & Cicchetti, 1998; Terr, 1991). And, research also shows that the effects of chronic victimization are far-reaching and long lasting (Fowler, Tompsett, Braciszewski, Jacques-Tura, & Baltes, 2009; Haynie et al., 2009; MacMillan, 2001; Martinez & Richters, 1993; Saunders, 2003).
Among those adolescents most likely to suffer from chronic exposure to community violence are serious juvenile offenders (Cuevas, Finkelhor, Turner, & Omrod, 2007; Lauritsen, Laub, & Sampson, 1992; Odgers, Moretti, Burnette, Chauhan, Waite, & Repucci, 2007). However, even within this group there is substantial variation in terms of the quantity and quality of exposure (i.e., witnessing, direct victimization), the role of risk and protective factors in producing adverse consequences, and the prospects for desistance. Yet, research on differentiating among types of serious adolescent offenders remains in its infancy. Although research indicates that most youth offenders will desist from their antisocial behavior (Monahan, Cauffman, Steinberg, & Mulvey, 2009), we do not know to whom this general “rule” applies, especially in terms of serious adolescent offenders. Nor do we know whether the commonly identified risk and moderating factors also apply to the more extreme groups of youth offenders or even subgroups of those at the “deep end” (Mulvey et al., 2004). Relevant to the current study, we do not know whether chronic and direct exposure to community violence presents a unique effect relative to other factors and whether changes in exposure relate to changes in offending. These are all areas of critical concern as trajectories of serious offending are the most intractable in terms of prevention and intervention.
The present study explores the extent to which trajectories of serious youth offending are affected by exposure to community violence and whether commonly identified moderating and risk factors influence such trajectories. We include key risk and moderating factors that are identified in the literature in order to assess their weights relative to exposure. For instance, research shows that differences in psychosocial maturity (Bushway, Piquero, Broidy, Cauffman, & Mazzerolle, 2001; Monahan et al., 2009; Mulvey et al., 2004), neighborhood disadvantage (Leventhal & Brooks-Gunn 2000; Sampson, 2012), parental deviance (Farrington, 1995; Farrington, Joliffe, & Loeber, 2001; Wilson, 1987), involvement with antisocial peers (Patterson, Reid, & Dishion, 1992; Wiesner, Capaldi, & Kim, 2012), problems in self-regulation (Farrington, 1996), substance use (Dembo et al., 1991; Moffitt, Caspi, Dickson, Silva, & Stanton, 1996), and, especially in the case of those youth with chronic victimization, posttraumatic stress symptomatology (McCart et al., 2007; Steiner, Garcia, & Matthews, 1997; Ulzen & Hamilton, 1998) affect participation in youth offending, in general. However, we do not know whether chronic exposure to community violence carries a special liability within this particular population of adolescents.
The use of a sample of serious juvenile offenders has a few advantages. First, in general, juvenile offenders are more likely to be exposed to community violence than their nonjustice involved counterparts (Cuevas et al., 2007; Lauritsen et al., 1992; Odgers et al., 2007). Second, they share more risk factors (Halliday-Boykin & Graham, 2001), thus making it easier to parse out the role that exposure to community violence may play in their offending careers, net other, commonly identified risk factors. Third, using a longitudinal sample of serious adolescent offenders increases the ability to observe whether changes in offending trajectories are influenced by fluctuations in exposure to community violence as compared to other risk and moderating factors.
Methods
The present article is a secondary analysis of data from the Pathways to Desistance project, a multisite, longitudinal study of serious juvenile offenders. Beginning in 2000, project staff recruited 1,354 adolescents aged 14 through 17 who were adjudicated delinquent or found guilty of a serious (overwhelmingly felony level) offense at their current court appearance in Philadelphia, PA (N = 654) and Phoenix, AZ (N = 700). The number of males adjudicated for a drug offense was capped at 15% of the sample so as to avoid overrepresentation of drug offenders. All females and all youth transferred to the adult system who met the enrollment criteria were also recruited to participate.
Immediately after enrollment, researchers conducted a structured 4-hr baseline interview with each adolescent. The interview included a thorough assessment of the youth’s social background, developmental history, psychological functioning, psychosocial maturity, attitudes about illegal behavior, intelligence, school achievement and engagement, work experience, mental health, current and previous substance use and abuse, family and peer relationships, use of social services, and antisocial behavior.
After the baseline interview, researchers interviewed participants every 6 months for the first 3 years and annually thereafter. At each follow-up interview, researchers gathered information on the adolescent’s self-reported behavior and experiences during the prior 6 months, including any illegal activity, drug or alcohol use, and involvement with treatment or other services. In addition, the follow-up interviews collected data on changes in life situations (e.g., living arrangements and employment), developmental factors (e.g., likelihood of thinking about and planning for the future and relationships with parents), and functional capacities (e.g., mental health symptoms). Sample retention for the Pathways project was high at each follow-up, ranging from 84% to 94% (mean = 90%) of the full sample. Additional details regarding the study can be found in Mulvey et al. (2004).
We restricted our current analyses to male adolescent offenders (N = 1,170), as the data set had only a marginally sufficient number of females in the sample (N = 184) to obtain a stable trajectory model for this group alone (Nagin, 2005). Rather than imposing statistical controls for this variable in an overall model, we opted to consider only males. The ethnicity of the selected sample is 19.2% White, 42.1% African American, 34.0% Hispanic, and 4.6% other. The participants’ average age was 16.0 years (standard deviation [SD] = 1.2 years) at the time of the initial interview. Table 1 displays the complete list of variables used in the regression analyses.
Descriptive Statistics.

Note. BSI = Brief Symptom Inventory; EASI = Emotionality, Activity, Sociability, and Impulsivity; CIDI = Composite International Diagnostic Interview; PTSD = Posttraumatic Stress Disorder; RCMAS = Revised Children's Manifest Anxiety scale.
Measures
Self-Reported Violent Offending
A modified version of the Self-Report of Offending (SRO; Elliott, 1990; Huizinga, Esbensen, & Weihar, 1991) scale was used at each interview to measure the adolescent’s account of his/her involvement in eight different violent crimes (fights, fights as part of gang activity, assault, carjack, robbery with weapon, robbery without weapon, shooting at someone, carrying a gun). The youth indicated whether he had done any of these activities over the “last 12 months.” A sum of the number of items endorsed (a “general variety” score ranging from 0 to 8) was calculated for each subject at each interview.
Exposure to Violence
The Exposure to Violence Inventory (ETV; Selner-O'Hagan et al., 1998) was modified for this study to assess the frequency of exposure to violent events. Items document the types of violence the adolescent both experienced (i.e., Victim—6 items, e.g., “Have you ever been chased where you thought you might be seriously hurt?”) and observed (i.e., Witnessed—7 items, e.g., “Have you ever seen someone else being raped, an attempt made to rape someone or any other type of sexual attack?”). Higher scores indicate greater exposure to violence.
Risk Factor Covariates (Baseline Measures)
Research links child dispositional traits, including early temperamental attributes and later personality traits, to an array of negative outcomes, including antisocial behavior and violence. For example, evidence connects impulsivity, negative emotionality, anger/hostility to a variety of externalizing behaviors, including violence (Simons, Olivera, Gahera, & Ebel, 2005; Sommers & Baskin, 2004; Stretsky, 2008). Evidence also indicates an association between anxiety, or features thereof, and anger and aggression (Muris, Luermans, Merckelbach, & Mayer, 2000; Muris, Merckelbach, & Walczak, 2002). Furthermore, several researchers theorize that early contextual and child-level risks contribute to behavioral outcomes partly through their effects on emotion regulation (Blair, 2002; Raver, 2004). High levels of negative emotionality (sadness, anger, irritation, and anxiety) and low emotion regulation are presumably associated with high levels of behavior problems (Calkins, 1994; Eisenberg, Fabes, Guthrie, & Reiser, 2000). Given empirical support for the role of temperament, personality, and emotion regulation in the development and maintenance of violent offending, constructs related to these factors, as well as additional individual, family, peer, and neighborhood risk factors, are included as covariates in the regression models.
Individual Characteristics
Negative Emotionality
A modified version of the Emotionality, Activity, Sociability, and Impulsivity (EASI) scale was used to assess adolescents’ internal emotionality (Buss & Plomin, 1984). Examples of items are “I am almost always calm—nothing ever bothers me” and “I tend to be nervous in new situations.” The scale contains 14 items to which participants responded on a 5-point Likert-type scale ranging from strongly disagree to strongly agree. Higher scores indicate greater emotionality.
Emotion Regulation
An adapted version of the Children's Emotion Regulation scale served as a self-report measure of the adolescents’ ability to regulate emotions (Walden, Harris, Weiss, & Catron, 1995). Of the 33 original items contained in this scale, 12 were included in the Pathway's version. Examples of items are “I know things to do to make myself more happy” and “I can change my feelings by thinking of something else.” Participants responded on a 4-point Likerttype scale ranging from not at all like me to really like me. Higher scores indicate a better ability to regulate emotion.
Anxiety
A total anxiety score was derived from the Revised Children's Manifest Anxiety scale (RCMAS; Reynolds & Richmond, 1985) and was based on 28 items that comprised three anxiety subscales: physiological anxiety (10 items about somatic manifestations of anxiety such as sleep difficulties, nausea, and fatigue), worry/oversensitivity (11 items measuring obsessive concerns about a variety of things, most of which are typically vague and ill-defined as well as fears about being hurt or emotionally isolated), and social concerns/concentration (7 items measuring distracting thoughts and fears that have a social or interpersonal nature). Higher scores indicate greater anxiety.
Psychological Distress
The Brief Symptom Inventory (BSI; Derogatis & Melisara, 1983) is a 53-item self-report inventory in which participants rate the extent to which they have been bothered (0 = not at all to 4 = extremely) in the past week by various symptoms. Alternative regression models were run using different measures of symptomatology: the Global Severity Index (GSI) score is the mean of all of the nine subscale scores; three subscale scores—interpersonal sensitivity (e.g., “Feeling inferior to others”), hostility (e.g., “Having urges to break or smash things”), and psychoticism (e.g., “The idea that something is wrong with your mind”)—were included as covariates in separate analyses.
Posttraumatic Stress Disorder (PTSD) Symptoms
The Composite International Diagnostic Interview (CIDI; World Health Organization, 1990) was used to assess the past year presence of PTSD symptoms. The CIDI is a highly structured interview designed for use by nonclinicians, which renders both lifetime and current psychiatric diagnoses according to criteria of the Diagnostic and Statistical Manual of Mental Disorders, Fourth Edition (DSM-IV). PTSD was measured as the number of symptoms each respondent experienced in the year prior to the baseline interview.
Family Characteristics
Peers
Peer deviance was measured as the proportion of four closest friends ever arrested.
Neighborhood
Neighborhood conditions were measured using items adapted from other large-scale studies of neighborhood functioning (Sampson & Raudenbush, 1999). Adolescents were asked about 21 examples of physical and social disorder in the blocks surrounding their homes (e.g., abandoned buildings, gang activity). They responded using a four-point scale ranging from 1 (never) to 4 (often). Scores were averaged across all items to determine levels of neighborhood disorder.
Time-Averaged Covariates
The present study follows the work of others (Labouvie, Pandina, & Johnson, 1991; Wiesner & Silbereisen, 2003) who argue that time-averaged covariates better distinguish among groups than using initial covariates. Wiesner and Silbereisen (2003), for instance, find that risks that remain high throughout the entire study period are more salient characteristics of distinctive adolescent groups compared to those that are only high at a single point of time. Therefore, in the present study, substance use and psychosocial maturity were modeled as cumulative averages across the 72 months of the study.
Substance Use
The Substance Use/Abuse Inventory is a modified version of a measure developed by Chassin, Rogosch, and Barrera (1991) for a study on children of alcoholics. This measure considers the adolescent’s use of illegal drugs and alcohol over the course of his lifetime and in the past 6 months. Two measures were used in the current study: the total number of drugs used in each recall period and the total number of substance dependency symptoms in each recall period.
Analytical Strategy
Latent class growth analysis was used to identify groups that followed distinctive patterns or pathways of self-reported violent offending and exposure to violence over time. Trajectories were estimated using the Latent Gold 4.5 program. Specifically, the procedure identifies distinct groups of participants demonstrating within-group homogeneity in terms of patterns of violent offending (or exposure to violence) throughout time and then models a separate developmental trajectory for each group. Because analyses were based on count data (number of different violent crimes endorsed or the number of exposures to community violence), we used zero-inflated Poisson modeling to account for the clustering at zero (Lambert, 1992). We estimated the probability that each individual belonged to a given group on the basis of the data and simultaneously derived maximum-likelihood parameter estimates associated with membership in each of the defined trajectories (i.e., posterior probabilities of group membership). On the basis of posterior probabilities, individuals were assigned to their most likely group trajectory.
Violent offending and exposure to violence were examined across 6 measurement points. Data were tested for various numbers of latent classes, and the fit of different models was compared with the Bayesian information criterion (BIC; Jones, Nagin, & Roeder, 2001). Mixtures of up to 6 latent classes were considered for both variables. The best trajectory solution was determined by three criteria: the lowest BIC value across models, a conceptually clear model, and a model in which each group included at least 5% of the sample. We decided on the number of classes and then determined the form of the polynomial (e.g., linear, quadratic, cubic) used to capture the shape of each trajectory.
Based on these criteria, the four-group trajectory solution was chosen as the overall best fitting model for violent offending. The five- and six-group trajectory solutions did not add substantially to the understanding of different group patterns. Specifically, the additional subgroups identified in these solutions were small (<3% of the sample) and did not indicate trajectories that were distinct in shape from the ones appearing in the four-group solution. A three-group model was selected as the best fit for exposure to violence. Parameter estimates and posterior probabilities for both models are available upon request.
The analysis examining the sample for trajectory groups took into account the effect of institutional confinement on the youth’s level of offending and exposure to community violence (Piquero et al., 2001). Exposure time or the amount of time the subject was free to engage in criminal acts (or exposure to violence) in the community was used as a time-varying covariate in the analyses. This value was a proportion indicating the total days during the 6-month recall period that the individual was reported to be in the community. This information was not available for the baseline observation, so these values were set uniformly to 1 for this starting period (Nagin, 2005).
The second part of the analyses investigated differences among the estimated trajectory groups. Multinomial regression was used to identify factors that distinguished membership in the trajectory subgroups identified above.
Results
Descriptive Statistics
Table 1 displays descriptive statistics for all variables used in the analyses. Across the 6-year study period, the respondents committed an average of 3.73 types of violent crimes. The mean number of types of violent offenses committed at baseline was 2.00. Exposure to violence was commonplace for this sample of serious adolescent offenders. Virtually all (98.6%) of the respondents were exposed to violence over the 7-year study period. However, 20.7% of the sample had only witnessed violence. Overall, the average number of exposures (direct victimization + witness) was 12.15 and the mean number of direct victimizations was 2.78.
Trajectories of Violent Offending
Figure 1 shows the final, four-group trajectory solution using exposure time as a time-varying covariate. Group 1 (34.4% of the sample) had a low level of offending at baseline that remained stable in the follow-up periods. Group 2 (28.1% of the sample) had a moderate level of offending at baseline that steadily decreased across the 72-month period. Group 3 (20.2% of the sample) had a low level of offending at the start and steadily increased across time. Group 4 (7.7% of the sample) started and remained high in offending across the 72-month period.

Violent offending trajectories.
Trajectories of Exposure to Violence
The trajectories of exposure to violence (Figure 2) reveal a variety of patterns among the youth. Approximately one half of the sample is on a “stable low” trajectory (50.5%), which has consistently low levels of exposure throughout the time period of the study. In Group 2, the “low-increasing” (17.3%) trajectory begins with low levels of exposure but then shows a rather consistent increase throughout time. The third group, 15.9% of the sample, has high levels of exposure to violence at baseline, but there is a steep decrease in their exposure over the 6-year follow-up period. The trajectories of exposure to violence reveal patterns similar to those identified by Spano, Rivera, Vazsonyi, and Bolland (2008). Approximately one third of their sample was on a stable low trajectory (34%). There were two declining groups, one that exhibited moderate declines (33%) and then those with a steep decline (8%). And there were two additional groups, one that showed moderate increases (18%) and another with a sharp increasing trajectory (7%).

Exposure to community violence trajectories.
Differentiating Violent Offending Trajectory Group Membership
We next conducted a series of analyses to identify factors that distinguished membership in the violent offending trajectory subgroups identified above. We first examined the variables that differentiated the 4identified subgroups. A multinomial logistic regression, entering all variables simultaneously, was performed to assess the relative associations of the covariates with trajectory group membership. Table 2 presents the overall results of this analysis. The findings indicate that several variables consistently distinguished among certain trajectory groups. Age was significantly different among Groups 1, 2, 3, and 4. Group 1 was somewhat older than the other groups (mean ages in years: Group 1 = 16.09, Group 2 = 15. 90, Group 3
Multinominal Regression Results: Odds Ratios for Violent Offending Trajectory Groups.
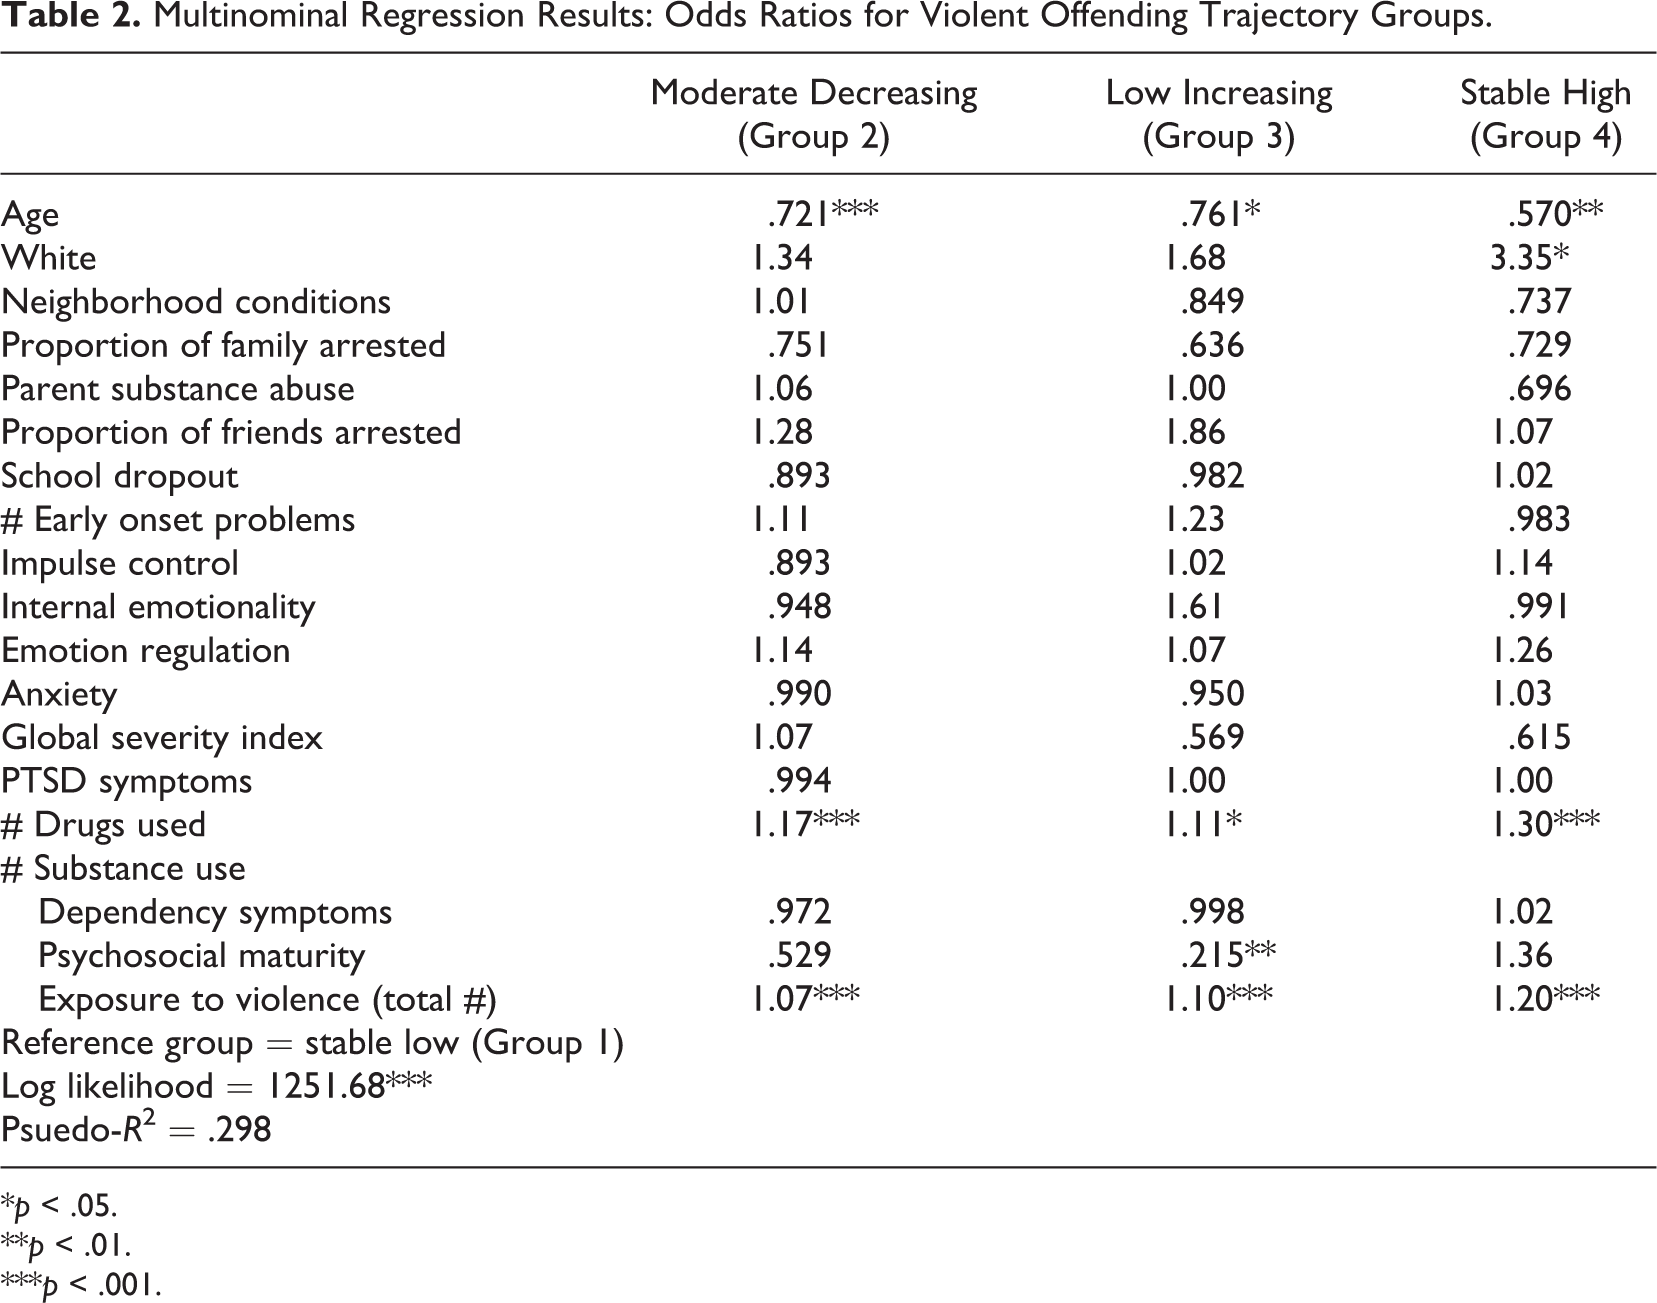
*p < .05. **p < .01. ***p < .001.
Most notably, two variables distinguished almost all of the groups from each other. The total substance use score was significantly different in all the group comparisons except the ones between Group 2 and Group 3. The stable high-violent offending group had the highest mean substance use score (6.63) and the stable low offending group had the lowest average use score (2.01). Most importantly, there were significant differences in the level of exposure to violence between every pair of groups except Groups 2 and 3. The stable high-violent offending group had the highest mean exposure (20.39) and the stable low group, the lowest (9.51). The mean level of exposure for Groups 2 and 3 were 13.29 and 13.92, respectively. Additionally, only 2% of the stable high offending group included “witness only exposure” compared to 28% for the stable low group.
Are Exposure to Violence and Violent Offending Interrelated Throughout Time?
Table 3 contains the odds ratios from multinomial regressions that examined the impact of trajectories of exposure to violence on the trajectories of violent offending. The findings support the robust effect of exposure to violence on violent offending. Both the high decreasing and low increasing exposure groups were significantly associated with the stable high and low increasing violent offending trajectories. Additional multivariate models were estimated that included all trajectory group comparisons for violent offending. The results (not shown) indicated that high levels of exposure, either high at baseline but decreasing or low at baseline and increasing over time, were related to stable high levels of violent offending. The number of drugs used over the 72-month period also differentiated significantly among the violent offending groups. It is important to state that the effects of exposure to community violence and drug use on violent offending trajectories occurred even when controlling for a number of risk factors, including individual differences related to personality traits and psychological symptoms. In fact, none of the personality or symptom measures (i.e., global symptom severity score, impulsivity, hostility, interpersonal sensitivity, and psychoticism) differentiated trajectory group membership.
Odds Ratios for the Impact of Exposure Trajectories on Violent Offending Trajectories
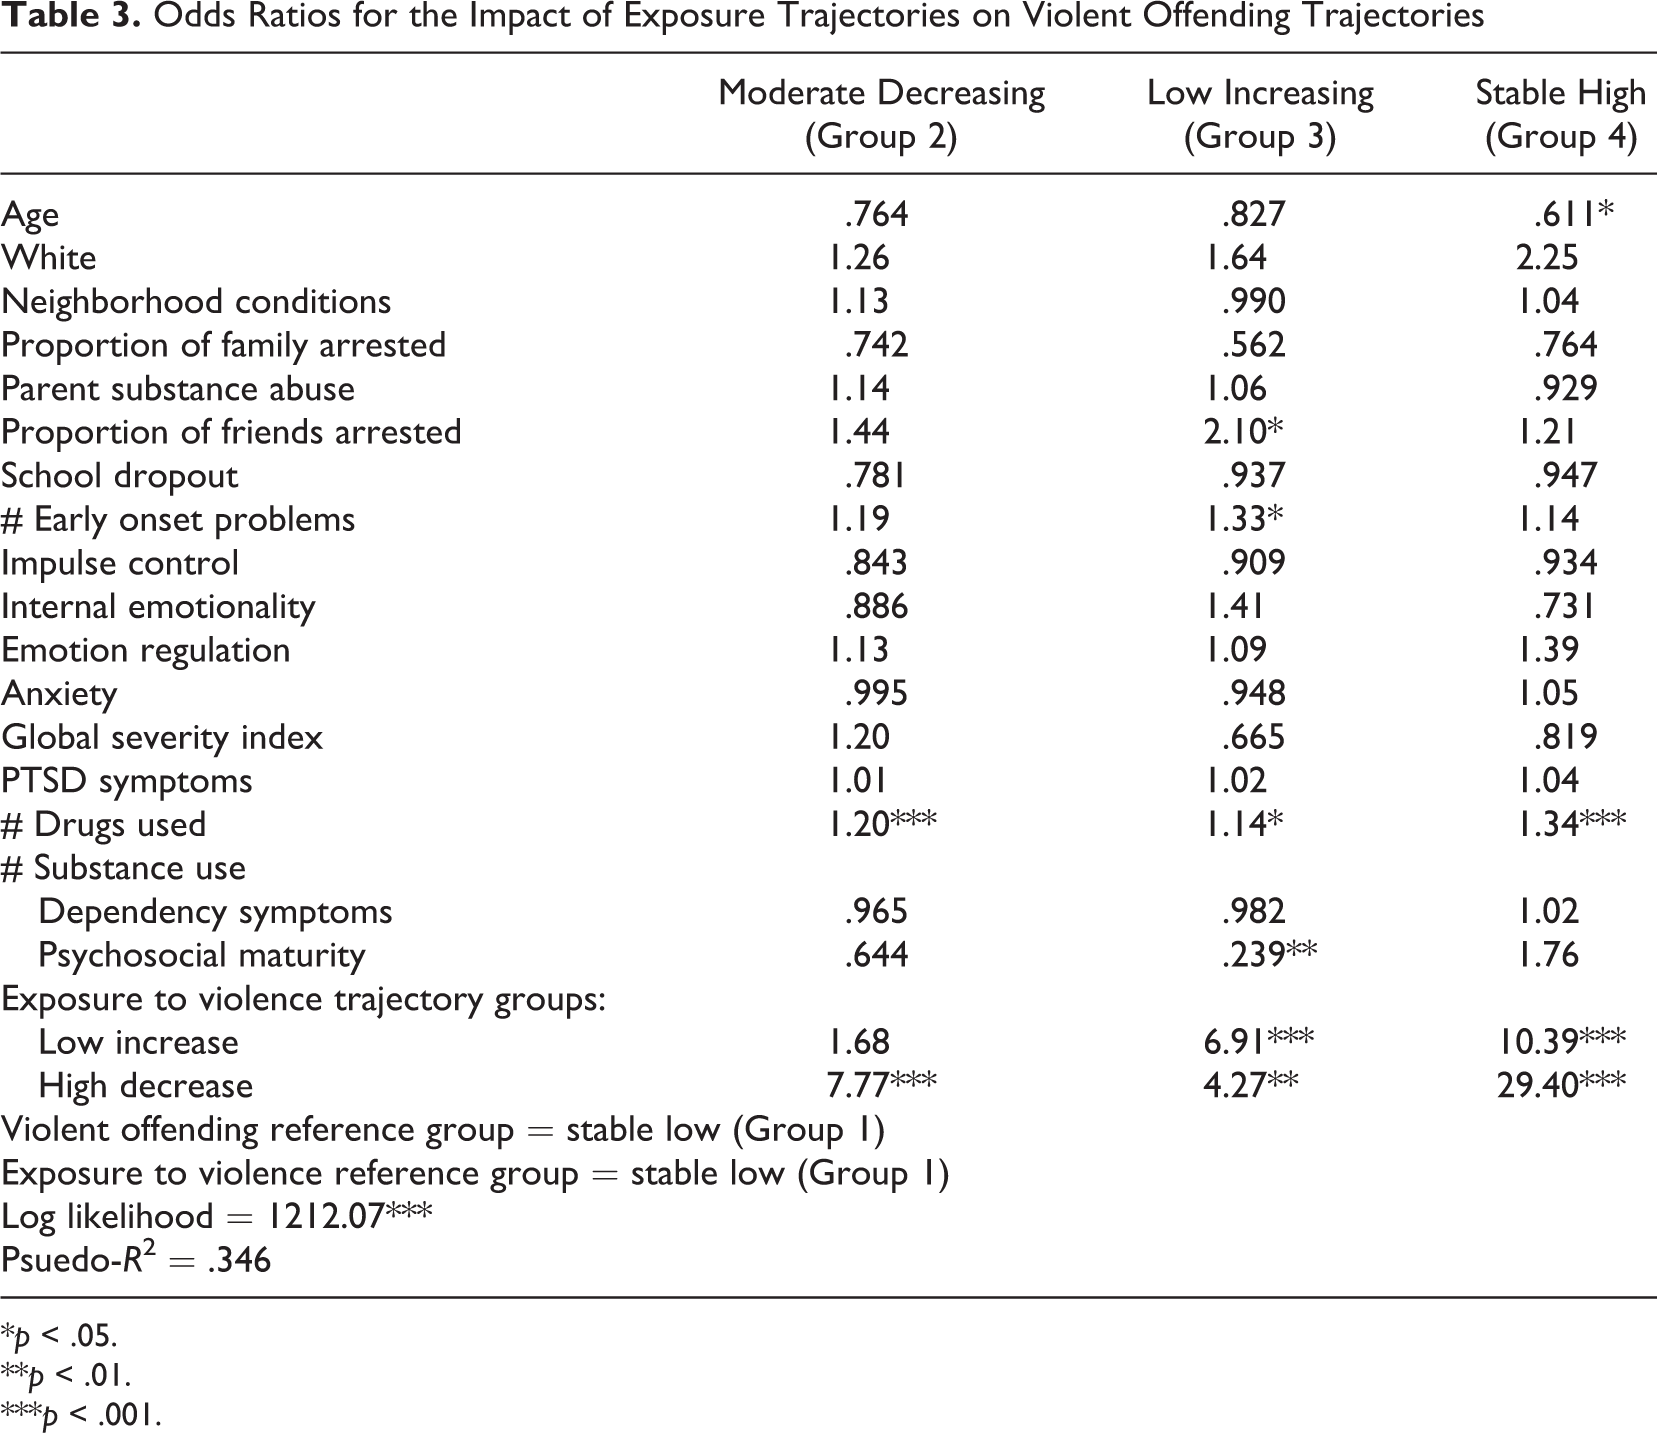
*p < .05. **p < .01. ***p < .001.
An additional multinomial regression (not shown) was conducted to assess the two-way interactions between exposure to violence trajectory groups and drug use. This approach provides an examination of how much additional explanatory power might be derived from constructing more complicated interactive models to differentiate the subgroups as well as the possibility of finding theoretically relevant information. Inclusion of the two-way interactions increased the explanatory power of the model somewhat; the Nagelkerke pseudo-R 2 increased to .330. Importantly, the interaction model did not alter the significant main effects reported in Table 3. The exposure to violence and drug use main effects were statistically significant in this model (full model statistics available from the authors). There were two significant two-way interactions. Respondents in the stable low exposure and low drug use group were more likely to be in the stable low-violent offending group. Alternatively, youths in the moderate/high exposure and high drug use group were significantly more likely to be in the stable high-violent offending group. Notably, respondents in either the low exposure/high substance use or the high exposure/low substance use groups were significantly more likely to be in the stable high-violent offending trajectory compared to the stable low offending trajectory.
In addition, similar to the results reported in Table 2, proportion of friends arrested and number of early onset problems increased the odds (2.10 and 1.33, respectively) of being in trajectory Group 3 as compared to the low stable violent offender group. Finally, although the measure of neighborhood physical and social problems did not differentiate violent offending trajectory groups, it is important to note that exposure to violence, particularly direct victimization, varied significantly across levels of neighborhood disorder. Over the 6year follow-up period, the average exposure to violence in high disorder communities was 16.57 compared to 12.84 and 10.34 in moderate and low disorder neighborhoods.
Discussion
The current study identified different trajectories of violent offending among serious adolescent offenders. Our finding of 4 trajectories of violent adolescent offending is consistent with recent research in the area (Piquero, 2008; Reingle, Jennings, Lynne-Landsman, Cottler, & Maldonado-Molina, 2013; for a literature review see Jennings & Reingle, 2012). Results also indicate that a small group within our sample, 7.7%, comprises the most serious violent offending trajectory. This finding is similar to other studies that demonstrate the presence of a “severe class” (Vaughn et al., 2011) of juvenile offenders who are disproportionately involved in serious offending (see also Wolfgang, Figlio, & Sellin, 1972). Also consistent with prior research (Baskin & Sommers, 1998; Reingle et al., 2013; Zara & Farrington, 2009), our analyses distinguished a later onset serious violent offending trajectory, which resembled the chronic group in terms of risk factors.
It is worth pointing out, here, that the results from the present study also lend support to a long history of research documenting the strength of the victimization–offending overlap (for a review of the literature, see Jennings, Piquero, & Reingle, 2012). Althoughe we did not explore what factors might explain this connection, prior research suggests that in certain neighborhood contexts a confluence of antisocial and aggressive subcultural norms and experiences elevates the likelihood that victims and offenders may, to a great extent, be one and the same (Anderson, 1999; Baskin & Sommers, 1998; Singer, 1981; Spano, Rivera, & Boland, 2006).
Importantly, the present study isolated two specific influences that significantly determined trajectory membership and may help to explain the victimization–offending overlap: exposure to community violence and substance use. Those youth who had more chronic and direct exposure to violence and/or were involved in higher levels of substance use were more likely to remain mired in violent criminal behavior, independent of other known risk factors such as peer and family deviance, impulsivity, neighborhood disadvantage, early onset of antisocial behavior, and PTSD symptomatology. Specific to substance use, our findings are similar to previous work (Hussong, Curran, Moffitt, Caspi, & Carrig 2004; Morizot & Le Blanc, 2007; Schroeder, Giordano, & Cernkovich, 2007) and suggest that substance use exerts both a short- and long-term effect on serious offending. High levels of substance use may interfere with the normative tasks of young adult development by entrenching young adults within antisocial patterns of behavior (Hussong et al., 2004), by increasing their likelihood of encountering other potential snares (e.g., educational problems or incarceration), and by reducing their likelihood of gaining access to protective factors along the way (e.g., good jobs, marriages). Developmental trajectories with narrow opportunities for change can delay psychosocial maturity that may then forestall the normative decline in antisocial behavior that typifies adulthood. Notably, those youth who were either on a stable trajectory of violent offending or increased their involvement were also more likely to have delayed psychosocial maturity.
Delayed psychosocial maturity was found to be an important factor in several studies done by the Pathways to Desistance investigators. It was associated with more substance use and substance use problems (Chassin et al., 2010); more prevalent in households characterized by parental neglect (Steinberg, Blatt-Eisengart, & Cauffman, 2006) and among youth incarcerated in secure settings (Dmietrieva, Monahan, Cauffman, & Steinberg, 2012). It was also found to affect both resistance to negative peer influence (Steinberg & Monahan, 2007) and decision making with regard to desistance from offending (Fagan & Piquero, 2007). Here, in the present study, it was an important factor for serious violent offenders but not nearly as important as was exposure to community violence.
Similarly, while substance use had an independent effect on violent offending trajectories, its strength as a predictor was second to that of exposure. Significantly, the combination of exposure and substance use was doubly damning for youth in the present sample as it sets them on a particularly pernicious trajectory of violent offending. Although this result may appear to contradict Mulvey, Schubert, and Chassin’s (2010) finding that both substance use and offending declined for this population as the youth entered young adulthood, parsing out offending trajectories allowed us to explore whether the substance use offending nexus differed based on the type (e.g. violent) and level of offending. While substance use was an important predictor of the most serious violent offending trajectory, exposure to violence was even more robust.
Although social and physical disorder, two key characteristics of neighborhood disadvantage, did not differentiate among violent offending trajectories, we did find that those youth who reported the most exposure to community violence, particularly direct victimization, came from the most socially and physically disordered neighborhoods. Thus, it might be said that community exposure to violence is one mechanism through which structural elements of neighborhood disadvantage are filtered and neighborhood effects are transmitted. This point should be underscored as it points to the possibility that neighborhood disadvantage, in and of itself, may be a necessary but not a sufficient condition leading to violent offending among youth and that simply using structural measures may hide the pathways through which neighborhood effects impact youth development.
The findings from the present study also underscore the importance of taking a longitudinal perspective. Here, we can clearly see the long-term effects of high exposure to community violence. Those youth who had high exposure at baseline remained on a violent offending trajectory over the entire course of the study. However, they were joined, later, by those youth whose exposure to community violence increased over subsequent waves of interviews. These two groups of serious adolescent offenders, conjoined by their victimization experiences, comprised the most violent of the serious offending trajectories.
Exposure to community violence, then, appears to have a unique influence on violent offending. The strength of its effect is so strong as to undermine known moderating and surpass known risk factors. Its strength is further evidenced by its staying power and suggests great risk for adversity in later life. This is especially true for serious adolescent offenders. Childhood and adolescence are critical stages in the life cycle when individuals attain the psychological, cultural, and social resources needed for a successful transition to adulthood. Justice-involved youth exposed to chronic community violence are left beyond the pale, unable to accumulate the socially prescribed “capitals” accessible to their peers in the wider community. Thus, they are and remain at a significant disadvantage when it comes to later stages of life.
These findings on the development and maintenance of violent offending can be useful for juvenile justice and child welfare agencies. First, the results help target those children most at risk for violent criminal careers and for continuing the most serious forms of offending. Thus, children who are chronically and directly exposed to community violence and/or are early onset drug users, even absent trauma symptomatology, may benefit from prompt intervention so as to reduce their initiation into violent criminal careers. Second, the findings provide some direction for professionals who are working with youth already caught up in the juvenile and adult justice systems. For this population of serious adolescent offenders, efforts should be made to address substance use issues, reduce exposure to community violence, and facilitate the development of psychosocial maturity. Third, these results provide empirically derived information that can be useful for the efficacious classification and treatment of serious adolescent offenders and for the design of more rational juvenile justice policies.
Limitations
Despite providing robust support for the influence of exposure to community violence on trajectories of violent offending, a key limitation is the lack of more detailed measures of exposure to violence. The Pathways’ data set did not include measures of abuse and neglect within the home or specify individual types of community violence (e.g. assault, robbery). Thus, we were unable to assess whether domestic violence during childhood was a precursor to adolescent exposure to violence in the community. Additionally, we were unable to explore whether particular exposures combine or accumulate in specific ways so as to lead to more adverse consequences. Furthermore, the study did not include measures of age of onset of exposure to community violence. As a result, we could not establish the timing of exposure and its relationship to the onset of violent offending.
A further limitation is the exclusion of females from the study. Although research on sex differences generally points to significant variation between sex subgroups, other studies demonstrate more similarity among males and females at the extreme end of antisocial and criminal behaviors (Baskin-Sommers, Baskin, Sommers, & Newman, 2013; Baskin & Sommers, 1998; Moffitt & Caspi, 2001; Nicholls, Odgers, & Cooke, 2007). Thus, by ignoring the sex subgroup distinction, the present study may be obscuring important differences in patterns and etiological understandings of youth violent offending.
Footnotes
Declaration of Conflicting Interests
The author(s) declared no potential conflicts of interest with respect to the research, authorship, and/or publication of this article.
Funding
The author(s) received no financial support for the research, authorship, and/or publication of this article.