
Abstract
In our study, we propose seven methods of detecting outliers in the set of one-dimensional observations. Instead of considering only one-dimensional input data, we use their two-dimensional vector representations, where each representation consists of an original observation and a score obtained through the application of the Isolation Forest (IF) and Extended Isolation Forest (EIF) algorithms. For the corresponding pairs of values, we first implement the
Keywords
Introduction
Outlier (or anomaly) detection is a vital and long-studied problem in statistics, data mining and machine learning. Its importance comes from the fact that existence of outliers can have a very significant impact on the results of scientific analyses from the mentioned fields of knowledge, and also because outlier detection algorithms have many practical applications, ranging from the fraud detection in financial transactions, the intrusion detection in computer networks, through tracking faults in industrial and commercial systems, conducting a quality control in manufacturing, to the identification of rare but critical events in medical analysis. The main goal of the research devoted to the issue of anomaly detection is to distinguish between inliers - observations consistent with the cumulative distribution function (cdf) of the input data, and outliers - data points that significantly deviate from that pattern. From a probabilistic point of view, this problem is often formalized as distinguishing whether the given observations originate from a reference cdf
A range of methods have been introduced to address the problem of outlier detection. Many of them often rely on distributional assumptions and parametric modeling, but some approaches develop non-parametric concepts. For example, an interesting method of outlier detection introduced in Bates et al. (2023) is a non-parametric approach. It is based on testing individual observations using conformal inference and consists in constructing conformal p-values in order to identify outliers by employing multiple-testing procedures. Continuing our review of articles on anomaly detection, we wish to mention the papers by Li et al. (2020) and Li et al. (2022), where the so-called ECOD (Empirical-Cumulative-distribution-based Outlier Detection) and COPOD (Copula-Based Outlier Detection) methods are proposed, respectively. The first of these methods (ECOD) assumes that outliers are often rare events that come from the tails of underlying distribution. This is also a parameter-free approach; in its first step, the empirical cumulative distribution function (ecdf) of the (usually multivariate) input data is computed and then - based on the obtained ecdf - tail probabilities, per dimension for each example from data, are determined. Finally, by aggregating the estimated tail probabilities across all dimensions of the observed data, outlier scores for the input observations are obtained. In turn, the COPOD approach is also a parameter-free design which involves the idea of copulas for modeling multidimensional distributions. It is also a multi-step concept; at first, an empirical copula is created, then the constructed empirical copula is used in order to predict tail probabilities for each point from the given data, which enables calculating the corresponding anomaly measures and entails separating the available instances into the inlier/outlier parts.
In addition to the earlier presented methods of outlier identification, some other contemporary procedures aimed at outlier detection are particularly worthwhile to notice. They include, e.g., the Isolation Forest (IF) approach, which is an unsupervised algorithm where multiple isolation trees are built. Each node in such a tree randomly selects a feature and a random split value and splits are continued until every data point is isolated (placed in its own leaf). In this setting outliers consist of observations that are easier to isolate than potential inliers, i.e., anomalies are separated relatively quickly from the rest of available data, whereas normal points (inliers) need more splits to be isolated. In order to determine isolation measures (isolation scores) of observations, the isolation path of each point has to be calculated (where by the isolation path we mean the number of splits (tree depth) required to isolate a point). Consequently, outliers should have short paths (as they are easy to isolate) and inliers should be indicated as the points with long paths (as they require many splits to be separated from the rest of data). The final anomaly score is the average path length across many trees (if short - the considered point is a potential anomaly, if long - the given observation is likely typical (normal)). For further details regarding an application of the Isolation Forest concept, we refer to Liu et al. (2008).
Apart from the standard Isolation Forest (IF) algorithm, we also consider its generalized version called the Extended Isolation Forest (EIF). The EIF algorithm was introduced in order to fix a fundamental bias that arises in the standard IF setting. This bias is created as a result of the fact that all splits in standard IF are axis-parallel. Consequently, the data set is always sliced vertically or horizontally (or along coordinate axes in higher dimensions) in this case. Such a constraint systematically produces biases as the trees grow, which results in inconsistent anomaly scores and therefore leads to unclear interpretation and evaluation of anomalous events and simultaneously affects the form of score maps and reduces robustness in anomaly scoring. In order to avoid these drawbacks, the EIF method was proposed by Hariri et al. (2021). The EIF algorithm does not significantly differ from the original philosophy of the IF approach and it is a natural completion of it. The core idea behind it is that it allows the splitting hyperplanes to take arbitrary orientations, since each tree “cuts” the data space in random directions. As a result, we obtain the method that preserves the spirit of random isolation, but which additionally removes the IF’s axis alignment bias, and – as a result – it provides the setting that creates more consistent and robust anomaly scores, can be naturally adapted to data shape and works better for complex data structures.
Both IF and EIF are now the standard baselines, serving as the foundation for subsequent methods, such as DeepIForest (DeepIF) and Generalized Isolation Forest (GIF). Deep variants of the IF and EIF algorithms have been proposed to improve and strengthen representation learning prior to isolation. They integrate deep neural networks with isolation-based detectors, typically relying on EIF-style splits in the learned feature space. With relation to the DeepIF and GIF, we refer to the papers by Xu et al. (2022) and Zhou and Paffenroth (2017).
EIF and its later developments have become widely applied in multivariate settings due to their improved flexibility, although in the univariate case the hyperplane generalization reduces to standard threshold splits and the two formulations coincide. Another direction in contemporary research regarding the extension of the Isolation Forest (IF)-related concepts explores the hybrid models combining IF with clustering techniques. Several clustering–Isolation-Forest hybrid models have already been proposed and should be noted here. For example, Karczmarek et al. (2020) introduced the k-means-based IF with multi-fork tree structures, achieving improved separability in heterogeneous datasets. In turn, the Cluster-Based Improved Isolation Forest (CIIF) framework by Shao et al. (2022) used the k-means clustering as a pre-selection step prior to isolation, whereas (Ayoub et al., 2023) showed that fuzzy C-Means clustering can outperform classical k-means when combined with isolation-based scoring. The hybrid approaches aim to improve anomaly detection in heterogeneous or multi-modal distributions by incorporating structural information prior to or during the isolation process. A complementary line of work concerns the use of conformal p-values for outlier detection. Its theoretical frameworks have been developed by Bates et al. (2023), who established rigorous constructions of marginal conformal p-values and stated how the False Discovery Rate (FDR) control via Benjamini–Hochberg procedure should be performed in this context. This approach determines the finite-sample assumptions and the formal validity conditions for computing conformal anomaly scores. Conformal methods have recently been applied to several anomaly-detection scenarios, providing the settings that enable to quantify uncertainty and to control error rates. The latest research confirms that the hybrid algorithms, combining isolation-based scores with clustering or conformal inference, have become an important and an active research area and that integrating IF or EIF with clustering or conformal inference is a natural direction of further research in the modern anomaly-detection analysis. Our contribution here is complementary, as the methods analyzed in our study contribute to the understanding of how such the hybrid techniques behave specifically in the one-dimensional setting, which has received comparatively less systematic attention or – in other words – it explains how such the hybridization behaves in the univariate setting under the simulation environment where existing clustering–IF or EIF hybrids have not been extensively evaluated.
In addition to that, it is worth noting that the already mentioned paper by Liu et al. (2008) has strongly encouraged and inspired the researchers to develop a family of hybrid methods where isolation-based scores are further processed by machine learning tools, such as clustering or classification approaches, which has resulted in significant improvement of the detection accuracy. In particular, the One-Class Support Vector Machine (OC-SVM) method has been proposed. It is an unsupervised (or semi-supervised) machine learning concept. The core idea behind it is that the OC-SVM algorithm tries to fit (learn) a boundary (hyperplane) around the typical (normal) observations (instances) of feature space, which is achieved by defining a specified kernel function and setting a nuanced parameter
Quite a large number of methods applied for anomaly detection setting involve using conformal inference (sometimes known as conformal prediction) and related statistical learning methods. The work by Vovk et al. (2005) is fundamental for understanding this concept, as its theoretical background is a result of collaboration between the authors of this publication. It contains the mathematical and algorithmic theory of conformal predictors, including definitions of nonconformity scores, calibration sets, and explanations how to produce prediction sets. The cited book also discusses hybrid ways of combining conformal predictors with classical machine-learning methods (such as - IF, SVM, k-nearest neighbours (kNN), etc.). The already mentioned paper by Bates et al. (2023) also uses conformal analysis for the task of outlier detection. More precisely, in Bates et al. (2023) - conformal inference (for constructing the conformal p-values) and multiple hypothesis testing (for controlling the False Discovery Rate (FDR)) are combined. In other words, it is a hybrid design in the sense that conformal p-values are defined and the Benjamini-Hochberg (BH) procedure (see Benjamini & Hochberg, 1995) is applied to them for controlling the FDR when performing multiple hypothesis tests. It is worth noting that hybrid approaches, integrating conformal inference with deep learning, isolation forests or kernel methods, have attracted a growing interest in recent studies, regarding not only outlier identification procedures.
In parallel, a present-day research devoted to the issue of anomaly detection has increasingly focused on combining classical machine learning with deep architectures and graph-based methods. Deep anomaly detection approaches use autoencoders, variational inference or adversarial training to learn compact representations of normality and identify deviations (see Chalapathy & Chawla, 2019). In turn, graph-based methods exploit relational information to capture anomalies in structured data, such as social networks (see Ding et al., 2019). For the survey study on anomaly detection methods in deep learning, we refer to the mentioned paper by Chalapathy and Chawla (2019) and to the work by Li et al. (2023).
With regard to the earlier study on partitioning observations in heterogeneous data sets and in the context of our present research objective, the papers of Belisle (1992) and Vecchi and Kirkpatrick (1983) are also worth mentioning. In the work of Vecchi and Kirkpatrick (1983), an algorithm suitable for separating data or fitting mixture models is introduced, while in Belisle (1992) the authors extend ideas proposed in the previous article. Together, these papers justify simulated annealing as a stochastic optimization method for globally consistent data set splitting and mixture distribution estimation, as they estimate Gaussian mixture models by the EM algorithm and their non-parametric extensions, which provide a flexible way to capture heterogeneity in the data. Further incorporated enhancements involving the robust estimation and clustering approaches have offered several alternative perspectives on anomaly identification and concurrently prompted the development of more versatile algorithms.
We also use three simple robust approaches in order to either analytically compare or theoretically discuss whether they fail our succeed against the proposed outlier detection methods. Namely, we consider: MAD (Median Absolute Deviation) with high breakdown point, IQR (Interquartile Range) with

In our research, we also examine the results obtained by application of the classic and simple Interquartile Range (IQR) with
The lately introduced Interpretable Single-dimension Outlier Detection (ISOD) method (see Huang et al., 2024) is also worth mentioning. This is an unsupervised algorithm that treats each single feature independently and therefore, it is especially useful for interpretable 1-dimensional outlier detection. The general idea of the ISOD setting is that at first, for each dimension (feature) the empirical cumulative distribution function from the data is obtained and then, the quantiles and skewness coefficients are computed for these dimensions - the mentioned statistics characterize how “typical” or “atypical” a given data point is in the considered dimension. Subsequently, based on the computed quantiles and skewness coefficients, the vector of outlier scores comprised of the corresponding scores througheach dimension is calculated for each observation – the higher scores indicate stronger deviation (stronger anomality) from the “ordinary” (“normal”) observations. ISOD method is similar with regard to its main concept to the earlier proposed Empirical-Cumulative-distribution-based Outlier Detection (ECOD) algorithm (see Li et al., 2022). The difference between them is that ISOD is a highly interpretable, single-dimension outlier detection approach, which is recommended for cases when we want to analyze each variable (dimension) separately, whereas ECOD is a multivariate outlier detection scheme, which is suitable for the case when we work with high-dimensional data and need a scalable, parameter-free method that aggregates signals across many features.
We have not considered the ISOD method in our numerical experiments and comparisons in particular due to its limitation. This limitation can be explained directly, without the need for simulations or comparisons, because if ISOD is a method based on cutting off a fixed proportion of extreme score values, for example
The k-nearest neighbors (k-NN) and Local Outlier Factor (LOF) algorithms are also related to the clustering and anomaly detection tasks. K-NN (see, e.g., Cover & Hart, 1967) is a commonly known method that works by looking at the
To make our reference list relatively complete, we also would like to mentioned four more papers. The first of them - the paper by Ostrovsky et al. (2012) studies theoretical foundations of the Lloyd-type heuristics for the k-means clustering problem and introduces a separation (clusterability) condition under which variants of Lloyd’s algorithm (such, e.g., the k-means method) converge quickly to near-optimal solutions and work very well in practice. The second one - an article by Pollard (1981) - establishes strong consistency results for the k-means clustering procedure, namely it proves that, under suitable regularity and uniqueness assumptions, the empirical k-means cluster centers converge almost surely to the population-optimal centers as the sample size grows. The results provide a rigorous statistical justification for k-means as a clustering method. In turn, the paper by Dasgupta (1999) provides an algorithm for learning Gaussian mixtures by using random projection techniques and imposing on mild separation (clustering) conditions. This algorithm - while remaining computationally efficient – guaranties strong and convincing theoretical foundations, which is effective even in high dimensions and for mixtures with arbitrary covariance structures. The other important theoretical contribution regarding the relationship between clustering and mixture models is provided by Chaudhuri et al. (2009), who analyzed the ability of the k-means algorithm to learn mixtures of Gaussian distributions under suitable separation conditions. Their results demonstrate that k-means can successfully recover the structure of Gaussian mixtures and provide additional theoretical motivation for combining clustering-based approaches with anomaly detection methods.
In our work, we present seven new outlier detection methods based on a two-dimensional representation of the sample, composed of the original observation values and the scores computed by using the Isolation Forest (IF) or Extended Isolation Forest (EIF) algorithms with 100 trees. We named these methods as: M.I-M.III, M.III+BH (M.IIIb), M.V-M.VI. These seven approaches are later compared with four classic anomaly detection procedures, which are denoted as M.IV, M.VIII, M.IX and M.X in our paper. All of our numerical experiments have been performed using the R environment (see R Core Team, 2021). In particular, its libraries: distr, isotree, mixtools, e1071, have been used. A detailed information on the introduced methods and motivation for the use of these approaches are given in Section 2.
The remainder of this paper is organized as follows. Namely, in Section 2 - we describe the proposed methods of outlier detection, as well as we justify and motivate their use, in Section 3 - we present our numerical experiments, in particular we describe six scenarios for which our computations are carried out and concurrently, we depict the results of our simulations for the selected scenarios and proposed methods, which allows to evaluate and discuss the introduced concepts later in Section 4. Moreover, in Section 5 we test the introduced methods on the benchmark real-world data: Wine, Thyroid_Disease_Dataset, Heart_Disease_Dataset, Credit_Card_Fraud_Detection, from the UCI Machine Learning Repository and the Kaggle data science community platform, while Section 6 summarizes our research. Due to the fact that our simulation study encompasses quite a large number of cases - except for one case, all of the tables and figures concerning the obtained empirical results are collected in Supplement. 1
Outlier Detection Methods and Motivations
In this section, we describe outlier detection methods, which we aim to apply, study and validate in our work.
Basic Setup
In our work, we propose seven methods of outlier detection for one-dimensional features. Our approach relies on construction of a two-dimensional representation of each observation, consisting of the raw data point and its anomaly score derived from the Isolation Forest (IF) and Extended Isolation Forest (EIF) algorithms, and on subsequent application of the machine learning techniques and statistical procedures to the obtained representation. More specifically, we introduce the following procedures: the concept based on combing the IF or EIF methods (scores) with the 2-means algorithm, the framework consisting in building the conformal prediction intervals, the design using conformal p-values (with and without multiple testing correction), the setting based on the OC-SVM approach, and the model of logistic regression for label refinement. We compare these procedures with classical mixture-based methods estimated via the EM algorithm, both in Gaussian and non-parametric mixtures settings, as well as with simple methods based on: (a) the MAD measure, (b) the Interquartile Range (IQR) with the
In our study, we adopt the definition of inliers and outliers from Bates et al. (2023). Namely, assume that we have a sample of one-dimensional observations, which are the realizations of a sequence of independent random variables with a distribution being the mixture of two one-dimensional probability distributions. Suppose that
This is a special case of the generally accepted and earlier mentioned definition (see Bates et al., 2023), where an observation
Originally, in conformal inference we consider an outlier detection problem where the input data set
Detailed Description of the Proposed Methods
Below, we present our outlier detection settings in more detail.
Method M.I
The first method - M.I - is based on using the 2-means algorithm for clustering one-dimensional observations, which are transformed at the beginning to their two-dimensional representation vectors. The first coordinates of these vectors are the original one-dimensional input data, whereas the second coordinates consist of the scores received by implementing the Isolation Forest (IF) or Extended Isolation Forest (EIF) algorithms. For the corresponding pairs of values, we apply the
Method M.II
M.II is based on the idea of naive conformal method. Its first step is the same as in the M.I method - namely, by using the
More formally, let


The naive conformal set for


Method M.III
M.III is based on the Bates-like conformal p-value method, as it applies the idea of conformal p-values, introduced in Bates et al. (2023) and the previous version of this paper (available from https://arxiv.org/abs/2104.08279). As in the methods M.I-M.II, we identify two clusters in its first step. Then, the majority cluster is treated as a calibration sample and each observation in the minority cluster is tested in order to determine whether it comes from the same distribution as the calibration set (and - as a result - the corresponding observation is identified as an inlier) or not (and - it is treated as an outlier then). No multiple-testing correction is applied, and the significance level is set to
Method M.III+BH (or M.IIIb)
In this method, we proceed analogously as in M.III; the difference is that in M.III+BH, we incorporate the Benjamini-Hochberg (BH) correction for multiple testing at
Method M.V
For the two-dimensional representation of the considered one-dimensional data (where - for recollection - this two-dimensional representation consists of the original observations and its corresponding scores), the One-Class Support Vector Machine (OC-SVM) algorithm with a radial kernel is used.
Method M.VI
Method M.VI is similar to M.V. The only difference is that - while using M.VI - after an application of the 2-means clustering, the OC-SVM is fitted to the obtained two-dimensional representation of observations from the minority class. Thus, the OC-SVM is used to extract outliers from the group of instances initially classified as potential outliers by the 2-means algorithm.
Method M.VII
M.VII is a label-cleaning approach, which applies the logistic regression model. It is a two-step outlier detection method that can be treated as a classification problem with uncertain labels. Firstly - the clustering procedure assigns uncertain labels, and secondly - the logistic regression is used to fit a model to these uncertain labels; consequently - for each observation, the probability of being an outlier is estimated, and - as a result - the instances with estimated probabilities exceeding
Classic Methods for Comparison Study (M.IV, M.VIII, M.IX, M.X)
The above described (proposed) methods are compared not only between each other, but more importantly also with an approach M.IV, which consist in fitting the EM (Expectation-Maximization) algorithm to a two-component Gaussian mixture model, with the procedure M.VIII, where the EM algorithm is fitted to a two-component non-parametric mixture model, as well as with two simple methods based on the MAD (see M.IX) and IQR measures (see M.X). For the corresponding comparison study, we applied the mixtools library (in order to use the ’normalmixEM’ function for Gaussian mixture models and the ’npEM’ function for non-parametric mixtures - see Benaglia et al. (2009) and the e1071 library. Both libraries come from the free software environment R (R Core Team, 2021).
Motivations
The proposed methods are based on a two-dimensional anomaly map. An observation that is an outlier in one dimension will typically also be an outlier according to the IF and EIF scores, but not always, since EIF is a randomized method and often produces asymmetric decision boundaries. Our approach aims to combine geometric information (the value of given observation) with model-based information (the corresponding anomaly score). In this way, we integrate signals from two complementary sources. The proposed methods rely on a natural application of the 2-means clustering to improve the IF and EIF-based, conformal prediction–based, and one-class SVM–based anomaly detection methods. Among these, only conformal prediction has a theoretical justification; however, not in the context considered here, since it is applied after clustering. Depending on whether the groups of outliers and inliers are sufficiently well separable, the proposed clustering-based methods may perform well and, as the sample size increases, may exhibit an improved ability to recover the two classes. Due to the lack of a strict theoretical characterization of IF and EIF and their theoretical properties, deriving rigorous theoretical results is difficult, if not impossible. Therefore, our evaluation is primarily based on computer simulations. Intuitively, if the anomaly scores produced by IF or EIF, conformal prediction, or OC-SVM provide better separation between outliers and inliers, improved performance can be expected, which is also confirmed by our simulation results. Overlap between outlier and inlier populations in the feature space is reflected in overlap between these groups in the two-dimensional representation defined by the observation and its anomaly score. The proposed methods can improve detection performance when the scores exhibit some separation ability between outliers and inliers, even if perfect separability is not achieved. Limitation of the conducted research is that this research lacks the rigorous theoretical analysis due to the inherent nature of the considered methods.
Application of the Wilcoxon Test and Heatmaps for Paired Comparisons
In order to compare
Simulation Study
Mixture Scenarios
We aim to implement the presented outline detection methods for the six following mixture distributions, labeled as A1–A3 and B1–B3 (additionally,
inliers from inliers from inliers from inliers from inliers from inliers from
A1-A2 are easy-to-separate settings with regard to the outlier detection problem and partitioning difficulty, while this issue becomes much more complicated in the A3, B1-B3 scenarios, which encompass moderately difficult to difficult-to-separate cases, since the distributions of inliers and outliers overlap significantly then.
Each scenario is considered in two variants - with outlier proportions
In Table 1 and Figure 1 - contained in the current section, as well as in Tables 1
and the following classification quality measures are computed:
For the corresponding definitions of the classification measures, we refer to Hastie et al. (2009).
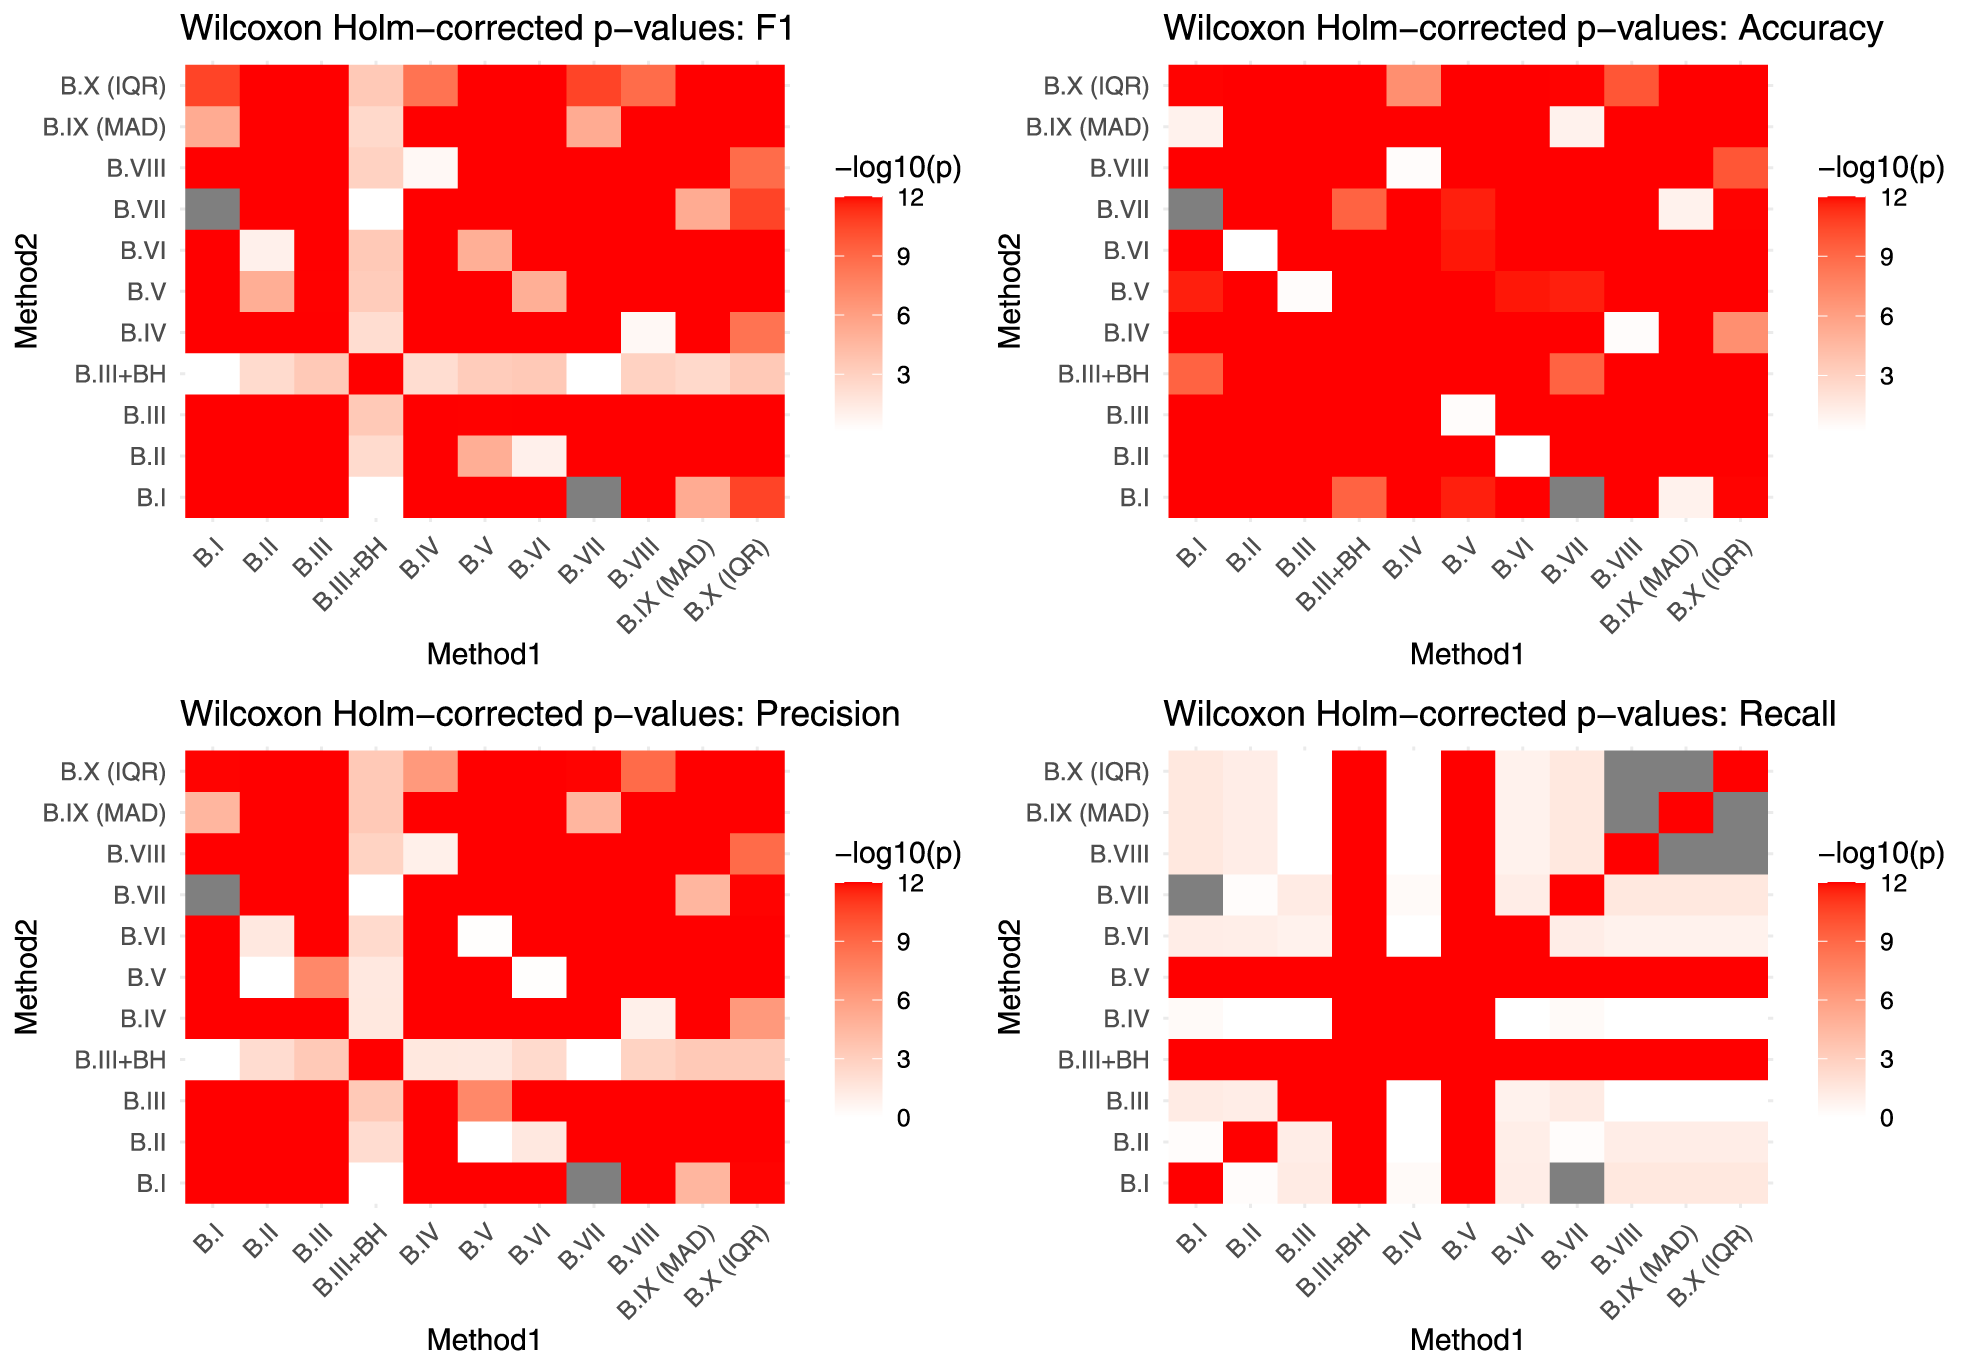
Adjusted p-values for Wilcoxon-Holm for A1,
Average Values of TP/FP/FN/TN and Classification Quality Measures for the A1 Scenario (
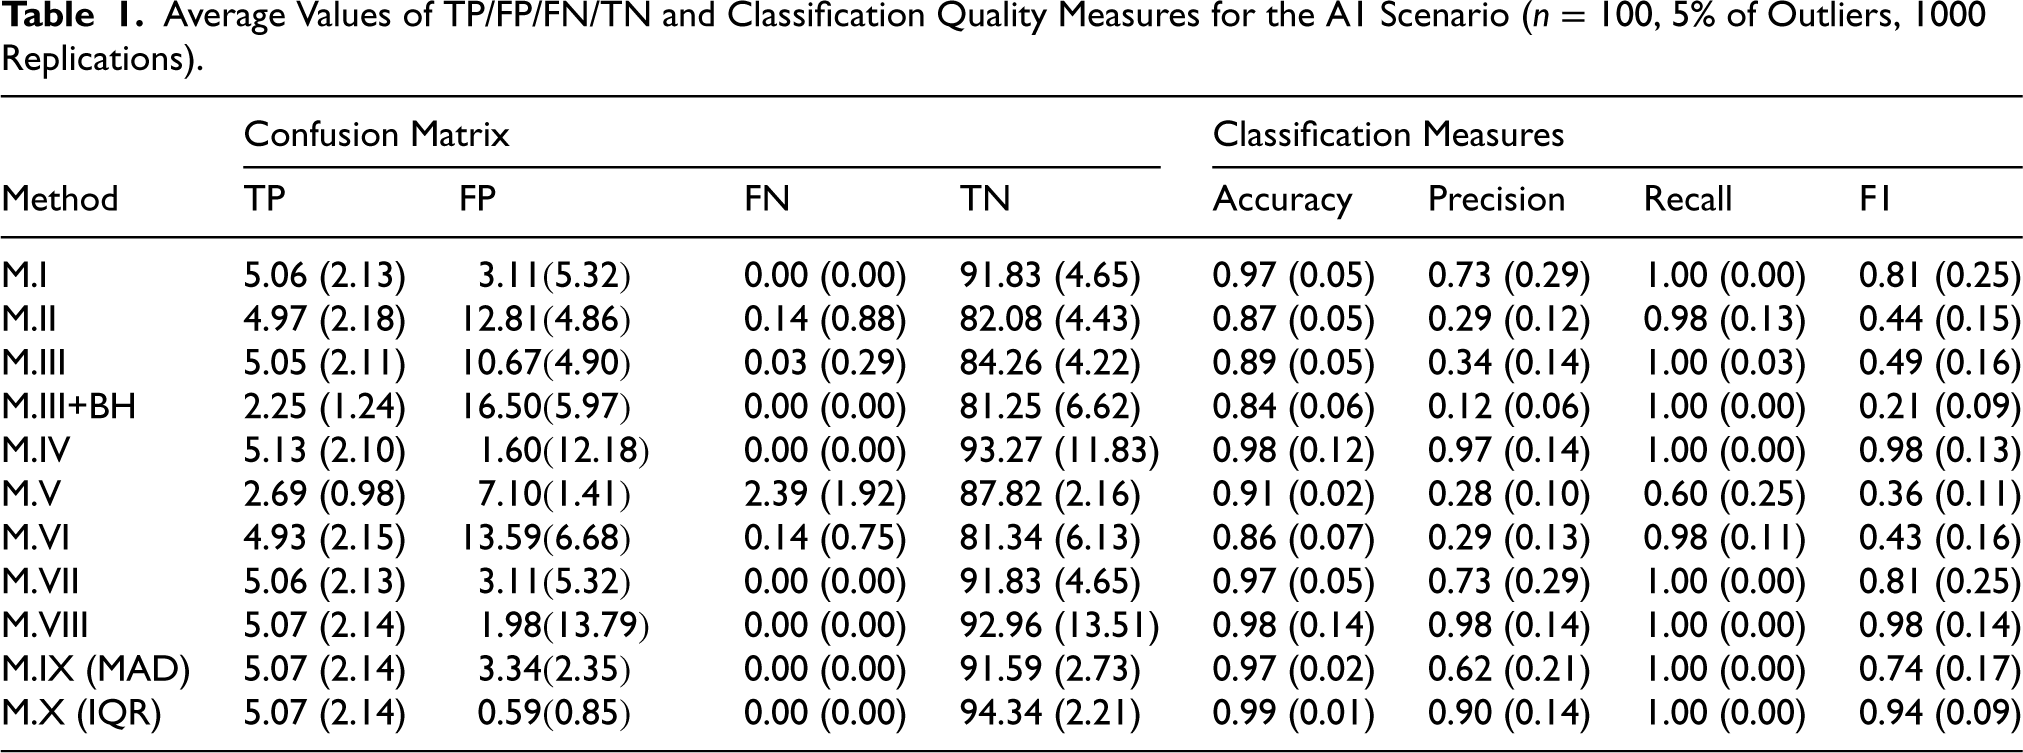
All of our simulations and analyses have been conducted in the R environment (see R Core Team, 2021); the assumed number of trees equals
Before presenting the conclusions, we clarify that in the heatmaps included in the supplementary material, the symbols B.I–B.X correspond to the considered methods M.I–M.X.
Comparison of the IF- and EIF-Based Methods
When comparing the methods based on IF and EIF, only minor differences were observed between the M.I and M.II approaches for a sample size of
Conclusions for Scenario A1 (Very Good Class Separation)
For
The highest Accuracy was achieved by the M.X method, however this method exhibited lower Precision than M.VIII and M.IV. In turn, the M.IV and M.VIII methods achieved the best F1-scores.
Increasing the sample size to
For
Conclusions for Scenario A2 (Good Class Separation)
For
For
For
Conclusions for Scenario A3 (Gaussian Distributions With Strong Overlap)
In scenario A3, where Gaussian distributions strongly overlap, all methods performed worse than in scenarios A1 and A2.
For
For
For
For
General Comment on the A1-A3 Scenarios
The simulation results for the Gaussian models considered in the A1–A3 scenarios indicate that, as expected, method M.IV (EM for Gaussian mixtures) is the best-performing method overall.
Conclusions for Scenario B1 (Exponential Outliers, Normal Inliers)
For
For
For
For
Conclusions for Scenario B2 (Student’s
Outliers, Normal Inliers)
For
For
For
For
Conclusions for Scenario B3 (Student’s
Outliers, Exponential Inliers)
For
For
For
For
Conclusions Regarding the Impact of Contamination Rate and Separation’s Degree
Based on the conclusions above, clear differences can be observed in the behavior of individual outlier detection methods depending on both the proportion of outliers and the degree of separation between the distributions considered in the presented methods. They can be summarized as follows.
For a low level of data contamination (5% outliers), the best performance for easily separable scenarios (A1, A2) is achieved by the M.IV (GMM) and M.X (IQR) methods. These approaches are characterized by nearly perfect Accuracy, very high Precision, and full or almost full recovery of outliers (
The M.I–M.VII methods, except for M.V, exhibit very high sensitivity but at the cost of increased numbers of false positives, resulting in moderate Precision values and suboptimal F1-scores.
Classical robust methods, namely MAD (M.IX) and IQR (M.X), perform very well in simple scenarios. However, in more difficult cases they lose the ability to detect a portion of the outliers. In the most challenging scenarios (A3, B1–B3), all methods experience a substantial decrease in performance, particularly in terms of Precision and F1-score.
Increasing the proportion of outliers to 10% leads to a clear deterioration in the performance of most methods due to a substantial increase in false positives. The mixture-based method M.IV remains relatively the most stable approach, although a decrease in Recall is observed for difficult scenarios, especially when
The MAD and IQR methods maintain high Accuracy, but they exhibit a substantial decrease in Recall as
As the sample size increases, a larger number of statistically significant differences emerge between Accuracy, Precision, Recall, and F1-score, particularly in scenarios A2, A3, B1, B2, and B3. The least significant differences between methods are observed for scenario A1.
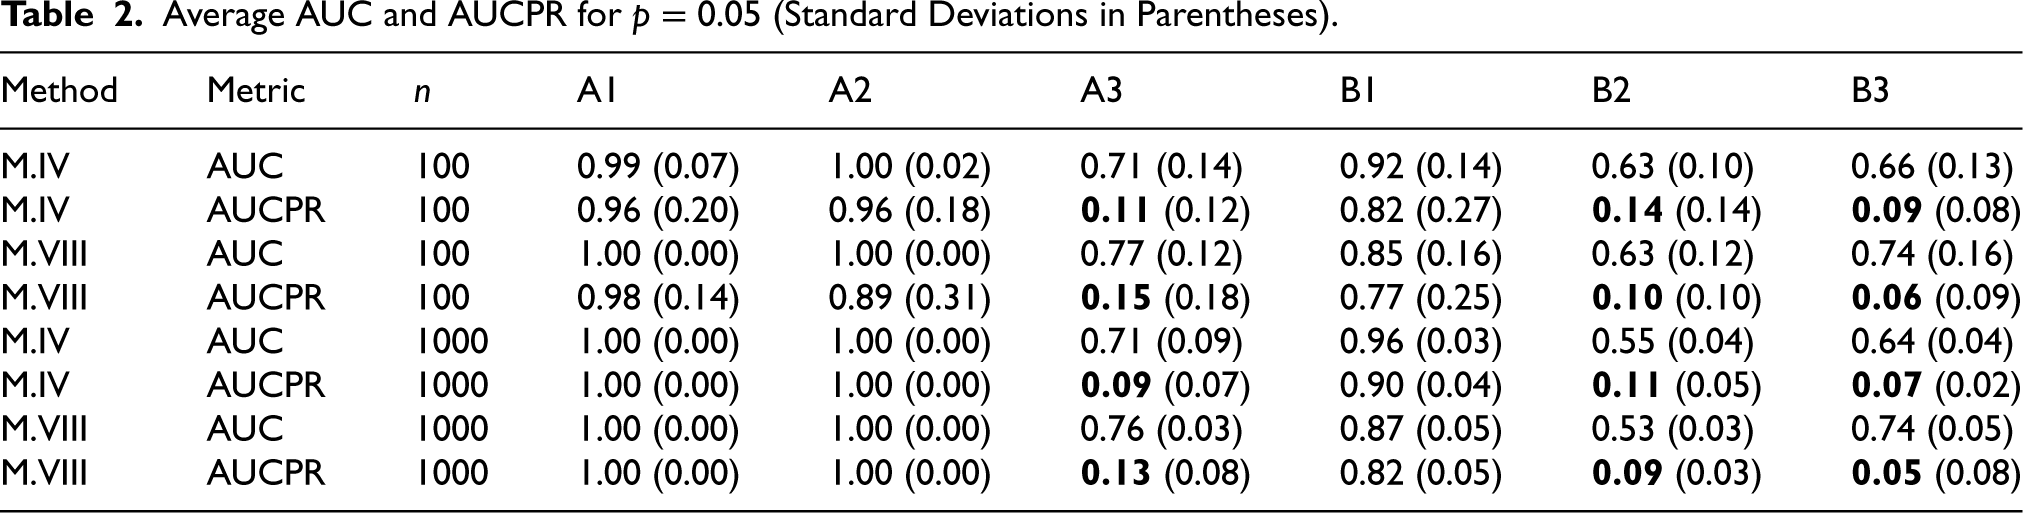
Since the M.IV and M.VIII methods were often placed among the best-performing approaches, we additionally evaluated their classification performances. Namely, for the mentioned methods, the AUC and AUCPR values were computed based on 1000 Monte Carlo replications, and the posterior probabilities were used as the score measures. Such the score measures (or scores) are not available for the other methods considered in our paper. The corresponding evaluation was conducted for the simulation models A1–A3 and B1–B3 with sample sizes
Average AUC and AUCPR for
(Standard Deviations in Parentheses).
Average AUC and AUCPR for
The purpose of this section is to evaluate the presented methods using four selected real-world data sets, available from the UCI Machine Learning Repository or from the Kaggle data science community platform. All of them constitute classical benchmark data sets for classification and statistical learning tasks.
The first data set, Wine, is based on the results of a chemical analysis of wines produced in the same region of Italy but originating from three different grape cultivars, denoted as classes 1–3. This data set contains 178 observations, each characterized by 13 continuous features (explanatory variables, also referred to as predictors or regressors), including alcohol content, malic acid, magnesium, total phenols, flavonoids, and color intensity, among others. The target variable, representing the grape variety, is moderately imbalanced, with 59, 71, and 48 observations for classes 1–3, respectively.
The second data set used in our numerical experiments is the Thyroid_Disease_Dataset, which contains 3,771 observations and 26 variables related to thyroid diagnostics. It is a cleaned version of an original medical data set, in which various clinical, demographic, and laboratory features are used to determine thyroid status. Among the 26 variables, the data set includes 25 predictors and one binary target variable indicating either normal thyroid function or thyroid disorder (hypothyroid or hyperthyroid). All features are numeric, taking either integer or floating-point values.
We also applied the Heart_Disease_Dataset in our study. This data set consists of 1,025 observations and 14 variables related to a group of disorders of the heart and blood vessels, referred to as cardiovascular disease. It comprises 13 predictors and one binary target variable. The primary goal of this data set is to predict the presence or absence of heart disease based on clinical and demographic features, where the target variable indicates either the absence or presence of cardiovascular disease.
Finally, we examined the
We restricted our simulations to analyses performed on reduced versions of the original data sets containing only the most statistically significant continuous explanatory variables (features). For that purpose, each data set was transformed to include only these variables together with the response (target) variable.
The final sets of explanatory variables were selected by jointly considering univariate statistical significance tests and mutual information criteria with respect to the response variable. For each feature, ranks obtained from hypothesis testing and mutual information were aggregated, and the most significant explanatory variables of the continuous type with the best combined ranks were retained for further analysis.
Using such a combined feature selection principles, the most significant explanatory variables of continuous type have been selected for each data set. For the Wine data set, these variables are: flavanoids, OD280/OD315 of diluted wines, hue, color intensity, and total phenols. In turn, for the Heart_Disease_Dataset, the selected variable includes only one feature, namely maximum heart rate achieved (thalach). In addition, the Thyroid_Disease_Datasetis limited to the following features: thyroid-stimulating hormone (TSH), free thyroxine index (FTI), total thyroxine (TT4). Finally, for the Credit_Card_Fraud_Detection_Dataset, the final feature set consists of the following five most significant explanatory variables: V4, V14, V11, V16, and V12.
It is worthwhile to mention that except for the above considered data, there is quite a large number of other anomaly detection benchmark data sets available on the Internet Global Network. The work by Han et al. (2022) presents
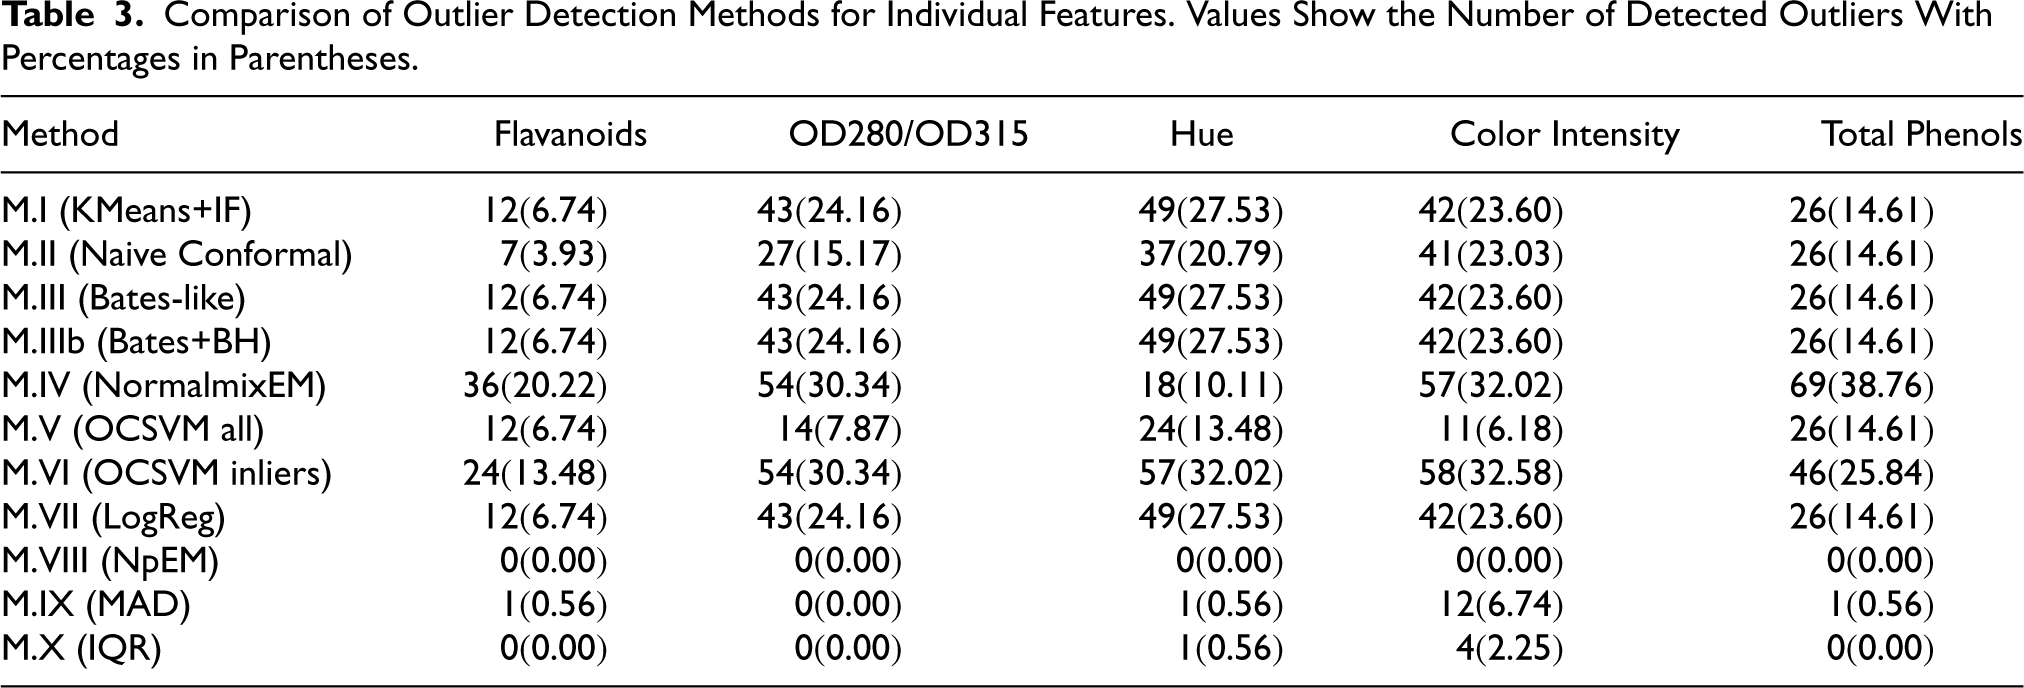
In Table 3, we collected numbers and percentage of points identified as outliers, obtained after using the considered methods M.I-M.X, provided that our input observations include - separately - data from each of the columns containing sample values of continuous explanatory variables selected from the Wine data set. For the other three among our data sets tables with the corresponding results are given in Supplement.
Comparison of Outlier Detection Methods for Individual Features. Values Show the Number of Detected Outliers With Percentages in Parentheses.
Comparison of Outlier Detection Methods for Individual Features. Values Show the Number of Detected Outliers With Percentages in Parentheses.
The results in Table 3 show that similar numbers of outliers are detected by the methods: M.I (KMeans+IF), M.III (Bates-like), M.IIIb (Bates+BH), and M.VII (LogReg). In turn, the method M.II (Naive Conformal) produces more conservative results, whereas the methods M.IV (EM algorithm to a two-component Gaussian mixture model) and M.VI (OCSVM (inliers)) often detect the highest numbers of outliers. In addition, the results from the corresponding table concerning the Heart_Disease_Dataset from our supplementary material indicate that similar numbers of outliers are detected by the methods: M.I, M.IV, and M.VII. From the results in this table concerning the Thyroid_Disease_Dataset, it can be seen that the largest numbers of outlier detection are obtained for either the M.VII or M.IX methods. Moreover, the results from the above mentioned table concerning the Credit_Card_Fraud_Detection_Dataset show that similar numbers of outliers are detected by the methods: M.I, M.III, M.IIIb, and M.VII.
The simulation study reveals substantial differences in the behavior of the considered outlier detection methods, which strongly depend on both the proportion of outliers and the degree of separation between the underlying distributions.
For the Gaussian scenarios A1–A3, the mixture-based method M.IV, based on the EM algorithm for Gaussian mixture models, consistently exhibits the strongest overall performance. In scenarios characterized by good or very good class separation (A1 and A2), this method achieves nearly perfect Accuracy, high Precision and excellent Recall. Moreover, its performance remains stable as the sample size increases, confirming its robustness in the well-structured settings.
As the overlap between the inlier and outlier distributions increases (scenario A3), the performance of all methods deteriorates significantly. This is particularly evident in Precision and F1-score values, which confirm the basic difficulty of distinguishing outliers from inliers under strong distributional overlap. Classical robust methods such as MAD (M.IX) and IQR (M.X) maintain relatively high Accuracy in these scenarios, however this is achieved at the cost of very low Recall, indicating a conservative behavior that favors limiting false positives over detecting outliers.
The proportion of outliers has a significant impact on our methods’ performances. For a low contamination level (
When the proportion of outliers increases to
In the most challenging scenarios involving heavy-tailed outlier distributions (B2 and B3), mixture-based and clustering-based methods show a relative advantage in terms of Recall, suggesting an improved ability to identify extreme observations. Nevertheless, this improvement is frequently accompanied by reduced Precision, highlighting the fundamental trade-off between sensitivity and specificity.
Finally, an analysis of the obtained heatmaps indicates that increasing the sample size leads to a greater number of statistically significant differences between methods, especially in scenarios: A2, A3, B1, B2, and B3. In contrast, scenario A1 exhibits only minor differences, reflecting its relative simplicity.
The presented results show that no single outlier detection method universally prevails over the other methods across the considered scenarios and that the choice of an appropriate approach should be guided by prior knowledge of the data structure, including the degree of distributional overlap and the proportion of outliers.
For data sets with well-separated clusters and approximately Gaussian distributions, mixture-based methods such as M.IV are recommended due to their high Accuracy, Precision, and Recall. In such settings, classical robust methods like IQR may also perform well, offering a simple and computationally efficient alternative.
In contrast, for more complex or heavy-tailed distributions, practitioners should be aware of the trade-offs associated with conservative methods such as MAD and IQR, which tend to achieve high Accuracy at the cost of low Recall. In applications where identifying as many outliers as possible is crucial, clustering-based or mixture-based approaches may be preferable, even if it involves a higher false positive rate. The proposed seven new methods, based on clustering, perform relatively well across all of the considered scenarios, but in the difficult scenarios B1-B3, some of them, namely M.I, M.III and M.III+BH outperform other methods in terms of certain classification metrics.
The results of our study show some possible directions for future research.
Instead of using the two-dimensional vector representations, in our further study we can consider a natural extension of the proposed methods, consisting in in analysis the pairs comprised of the vector of multidimensional observations and a score obtained by using the Extended Isolation Forest algorithm and clustering techniques in order to detect outliers in multidimensional data.
The other reasonable idea is to investigate the proposed hybrid outlier detection methods in higher-dimensional settings, where interactions between anomaly scores clustering and conformal procedures may lead to new interesting challenges.
Furthermore, important direction could be the development of theoretical foundations for isolation-based and hybrid methods. In addition, deeper integration of the isolation-based techniques with modern machine learning approaches could provide further enhancements in the anomaly detection performance.
A limitation of the clustering-based methods considered in our study is their inability to produce continuous anomaly scores. As a result, they provide only hard decisions, which reduce flexibility for practitioners who may need to adjust sensitivity thresholds depending on their different application contexts.
Footnotes
Funding
The authors received no financial support for the research, authorship and/or publication of this article.
Declaration of Conflicting Interests
The authors declared no potential conflicts of interest with respect to the research, authorship, and/or publication of this article.