
Abstract
Motor Imagery (MI) based processes are most commonly used in Brain-Computer Interfaces (BCIs) and these systems are commonly applied in the military, medicine, rehabilitation, and so on. A large number of works have been provided in the past using Electroencephalograms (EEG), however, the presence of artifacts and correlation among the signals limits their performance. This work aims to design an effective brain activity detection model using a hybrid Deep Learning (DL)-based model called Quantum Fusion Maxout Network (QFMNet) for accurately detecting the brain activity of individuals using MI based on EEG signals. Here, initially, the input EEG signal obtained from the dataset is given to the preprocessing stage, where noise is removed from the input signal using a Gaussian filter. Then, the preprocessed signal is subjected to a feature extraction process, and subsequently, data augmentation is done. Finally, brain activity detection is performed using the proposed QFMNet, where the proposed QFMNet is developed using Deep Quantum Neural Network (DQNN) and Deep Maxout Network (DMN). The QFMNet is observed to have higher values of specificity of 93.8%, accuracy of 93.0%, and sensitivity of 94.8%, by considering the k-group as 9.
Keywords
Introduction
BCI can also be termed Brain Machine Interface (BMI), which creates a non-muscle channel that allows the human body to communicate directly with external devices.1,2 The BCI system can serve as a tool in predicting cognitive or mental states, human control intention, and neurological disease states through a series of processes, such as signal processing, feature extraction, and pattern recognition. 3 Some people endure physical disabilities yet they have normal cognitive thinking. The BCI system is designed to help these people to communicate effectively with the outside environment. In recent years, the further development of BCI technology greatly helped people with disability who cannot take care of themselves. 4 Even though the BCI system was initially designed to aid people with cognitive impairments or physical disabilities, nowadays BCIs are widely used in a variety of applications ranging from medical and neuroeconomics to entertainment, intelligent environments, and even security and authentication.5,6 The three types of BCI paradigms are invasive, partially invasive, and non-invasive. 2 Out of which, partially invasive and invasive BCI resulted in high-spatial-resolution signals, and high Signal-to-Noise Ratio (SNR) compared to non-invasive BCI. Since electrodes are implanted into the cortex area of the cerebrum for collecting brain signals, these neurosurgical BCI systems pose certain problems and infection risks to the patients. 7
On the other hand, non-invasive BCI collects electrical signals from the brain through a wearable device that is attached to the scalp of the patients. 7 At present, the most widely used non-invasive BCI is EEG, which is an inexpensive technique for acquiring neurological signals for brain-machine communication. 8 EEG is an effective tool for studying human brain dynamics with high temporal resolution. 9 The effects of EEG-based BCI have been studied on various paradigms by considering the exogenous and endogenous characteristics of the paradigms. 2 Some of the commonly used BCI paradigms include Steady-State Visual Evoked Potentials (SSVEP), P300, and MI-BCI. 3 One of the most common modes is MI.2,10 MI refers to subjects who imagine themselves moving a specific part of their body (such as the left or right hands, left or right feet) instead of moving it. 11 Assistive robot technology powered by the brain is utilized in performing BCI-based MI tasks and their use is seen in a wide range of applications.12–14 Even though EEG signal is most commonly employed in MI task recognition for brain-machine communication because of its non-invasive nature and it causes no injury to the brain cortex compared to invasive and partially-invasive techniques, it suffers from high artifacts.8,15 EEG signals also suffer from external noise very often. A subject's mood and posture also affect EEG signal acquisition. For instance, an upright posture will result in high quality and high concentration of EEG signals. This is because when the subjects are in an upright position, they exhibit a stronger high-frequency content than when they are lying down or resting. 16
Machine Learning (ML) technology is widely used to classify and identify MI tasks. 2 The traditional ML methods work by following two basic assumptions i.e.,; the data required for training and testing should follow the same statistical distribution and sufficient samples are required to train the feature extraction or classification model. 4 Many feature extraction methods and classification models were adopted for the successful categorization of MI tasks. Some of the feature extraction methods employed are wavelet transforms, autoregressive models, Fourier transforms, Common Spatial Patterns (CSP), Riemannian approaches, and their variants. The different classification algorithms utilized include Linear Discriminant Analysis (LDA), Support Vector Machine (SVM), Multilayer Perceptron (MLP), 17 and K-Nearest Neighbors (KNN).6,18 To extract features from EEG signal data using ML algorithms, some experience and prior knowledge are needed. It leads to limited accuracy in EEG decoding and is expensive and even time-consuming.7,19 Recently, DL classifiers have been used as they can effectively process unprocessed data and are also effective in automatically learning data features and capturing the characteristics of a huge dataset without using any hand-crafted feature as they are a promising substitute to address the EEG data signals complexity in MI tasks. DL models are capable of managing complicated and non-linear data with high dimensions because they can utilize low-level features to generate high-level features. This can be achieved with the help of identifying distributed patterns in the acquired data. 20 Convolutional Neural Network (CNN) architecture is emerging as a promising tool in BCIs that has been broadly adopted nowadays. These CNN classifiers are designed in such a way that they automatically capture the temporal-spatial frequency features of brain signals in end-to-end learning without human intervention. 21
Over the past decade, various deep learning-based motor imagery brain-computer interfaces (MI-BCI) have been developed to detect brain activity signals. However, these approaches have often fallen short of achieving optimal performance due to several key limitations. Primarily, the restricted number of signals used in existing classification methods leads to the identification of brain activity detection. Additionally, the challenge of developing a generalized model that applies effectively to all individuals is exacerbated by subject variability, which introduces differences in brain activity patterns among individuals.
The resilience and accuracy of many current models are compromised by the limited number of signals they rely on. Shallow networks frequently struggle to extract the most significant features from EEG data, which is further complicated by noise and artifacts such as motion interference. The high dimensionality of EEG data adds another layer of complexity, making model construction and performance optimization difficult. Correlations between EEG channels further obscure data interpretation. Moreover, real-time applications demand both rapid response times and substantial computational resources, presenting additional challenges for achieving high classification accuracy.
To address these issues, we have developed the QFMNet model, a novel framework for brain activity detection using EEG signals. The QFMNet model integrates hybrid deep learning systems, specifically DMN and DQNN, to enhance detection capabilities. The process begins with the pre-processing of EEG signals using a Gaussian filter. In the feature extraction phase, various metrics are extracted, including Power Spectral Density (PSD), logarithmic band power, spectral centroid, spectral flux, spectral spread, tonal power ratio, and statistical features such as kurtosis, skewness, and entropy. Hjorth parameters—activity, mobility, and complexity—are also included. These extracted features are then augmented to expand the dataset before being processed through the QFMNet model for brain activity detection.
The structure of this research is organized as follows: Section 2 provides a literature review of existing BCI techniques; Section 3 details the proposed QFMNet model developed in this work; Section 4 presents the results and discussion of the QFMNet model; and Section 5 concludes with a summary of the findings and implications of the QFMNet model.
Literature survey
Altuwaijri, G.A. and Muhammad, G. 16 developed the Multi-Branch EEGNet (MBEEGNet) and Multi-Branch ShallowConvNet (MBShallowConvNet) for motor imagery (MI) classification based on EEG signals. This approach had reduced model complexity due to fewer parameters, it falls short in several aspects. Notably, the MBEEGNet + MBShallowConvNet model does not emphasize improving the overall accuracy of BCI-MI systems. Consequently, the model lacks the accuracy and robustness required for effective practical applications.
Salami, A., et al. 6 proposed the EEG-Inception Temporal Convolutional Network (EEG-ITNet) for MI classification, which provided greater interpretability and robustness. However, the model did not explore the effects of network depth on its performance. This means that the impact of network architecture changes on the model's efficiency was not fully assessed, potentially limiting the optimization and overall effectiveness of the EEG-ITNet approach. Nakra, A. and Duhan, M., 8 devised a Deep Long Short-Term Memory (LSTM) network to classify MI. Here, the negative effect of the artifact was reduced and a tradeoff between complexity and precision was maintained. However, a more appropriate channel selection method was not utilized in the model to increase the system's robustness. Tang, X., et al. 3 introduced Multi-Scale Hybrid CNN (MSHCNN) to improve the classification performance of MI. The technique was adaptive and stable and it was applied to the online artificial limb control system. However, this model was not utilized in athletic rehabilitation by increasing the categories of MI to offer more control commands. Although it is more adaptable and achieves high classification accuracy in real-time applications. This limitation hinders the model's potential to further enhance accuracy and fully leverage the spatial information present in EEG data.
Hwaidi, J.F. and Chen, T.M., 2 devised Deep Autoencoder (DAE) + CNN (DAE-CNN) for EEG MI signal classification. The method's generalization was improved in the MI classification. Nevertheless, this model did not investigate reducing the number of electrodes to attain higher classification accuracy. Wang, X., et al. 4 developed Euclidean space data Alignment (EA) + Common Spatial Pattern (CSP) + CNN (EA-CSP-CNN) for MI EEG classification. The model achieved reliability and was more resource-efficient. However, this technique failed to improve the transfer learning algorithm by reforming the data alignment approach. Ju, C. and Guan, C., 21 established Tensor-Common Spatial Pattern Network (Tensor-CSPNet) for MI classification. This model performed well in nonstationary scenarios. Nevertheless, this model was not executed in real-time scenarios. Gao, S., et al. 7 introduced Gated Recurrent Unit (GRU) – CNN (GRU-CNN) for MI EEG decoding. This model overcame the overfitting problem by expanding the data scale of EEG. However, this model was not applied to online BCI systems to verify its robustness and effectiveness.
Xiao, X. and Fang, Y., 22 established Improved CNN for the recognition of MI EEG signal. Here, this model demonstrated excellent convergence speed of the recognition process. However, the sensitivity of the network model was reduced due to the continuous learning and training of the deep network. Velasco, I., et al. 23 introduced a Multivariate time series approach for the classification of MI EEG signal. Here, this method produced good classification accuracy with a reduced number of features, facilitating its interpretability and improving overfitting. Nevertheless, the method was limited by the need to perform an empirical pre-test to determine which combination of parameters yields satisfactory results for each specific task. Xie, Y. and Oniga, S., 24 developed Hybrid CNN for MI EEG signal classification. The approach produced a high classification accuracy and reduced the consumption of computational resources. However, this method was futile in finding innovative solutions that effectively utilized the available resources while ensuring optimal performance. Sharma, N., 25 devised Transformer-based MI EEG signal recognition for the recognition of EEG-based MI. This technique had a reduced computational complexity and achieved high accuracy and efficiency, thus, can be utilized in real-time applications. Nevertheless, the classification accuracy was less for the multi-class problem because of the high correlation among the different classes.
Major challenges
Although existing works account for individual variability, they still fall short of achieving the high accuracy and robustness necessary for practical applications. Additionally, these models do not explore the impact of network depth on efficiency, which could hinder performance optimization. Furthermore, the current models are unable to extract EEG signal features in three-dimensional space, which limits their ability to enhance accuracy and fully leverage the spatial information inherent in EEG data. Despite advancements in deep learning across various fields, its application to EEG-based motor imagery (MI) classification has yet to deliver satisfactory results. Challenges such as noise, channel correlation, the high dimensionality of EEG data, and artifacts like motion interference complicate the development of effective EEG-based MI classification techniques.
To address these challenges, this research introduces the QFMNet model, a hybrid deep learning system integrating DMN and DQNN frameworks. This model aims to overcome the limitations of previous approaches and is discussed in the following section.
Proposed QFMNet for brain activity detection
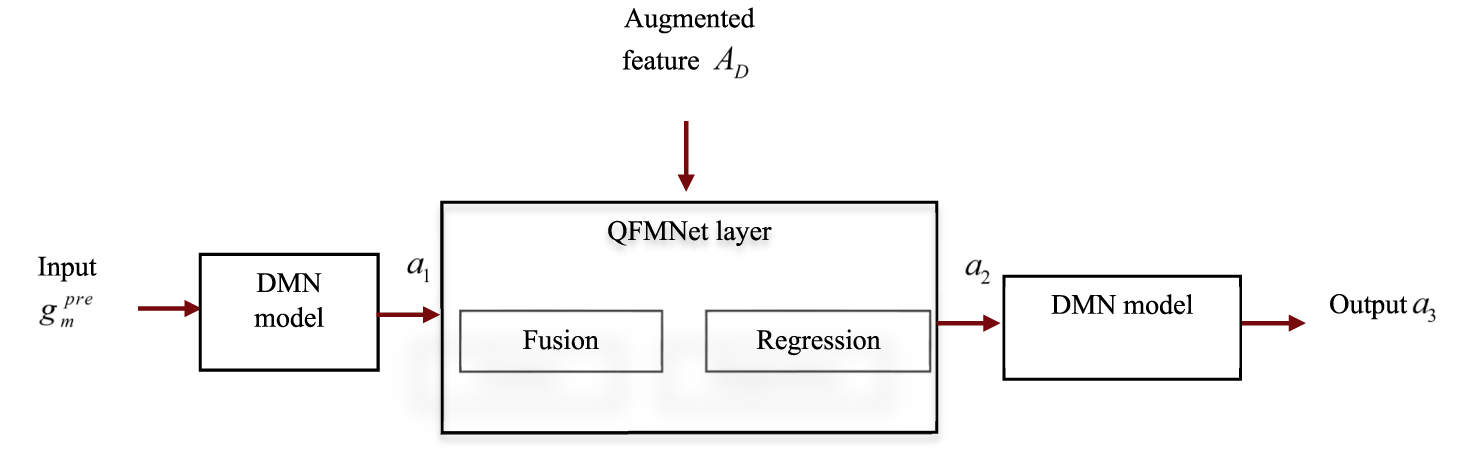
This work aims to design an effective brain activity detection model using a hybrid DL-based model called QFMNet for accurately detecting the brain activity of individuals using MI. In the proposed QFMNet, initially, an input EEG signal is obtained from the database and is then given to the pre-processing phase, where noise is removed from the signal using a Gaussian filter. 26 Then, pre-processed signal is subjected to a feature extraction process, where features of the signal, such as logarithmic band power, 27 Hjorth parameters, 28 spectral flux, 29 PSD, 27 spectral centroid, 30 spectral spread, 30 common spatial patterns, tonal power ratio 29 and statistical features of the signal like kurtosis, skewness, 31 and entropy 32 is extracted to reduce the amount of redundant data. Subsequently, data augmentation is done, where the extracted features are augmented to increase the number of features. Finally, brain activity detection is performed using the proposed QFMNet, where the proposed QFMNet is developed using DQNN 33 and DMN. 34 Figure 1 represents a schematic diagram of QFMNet for effective brain activity detection employing EEG signals.
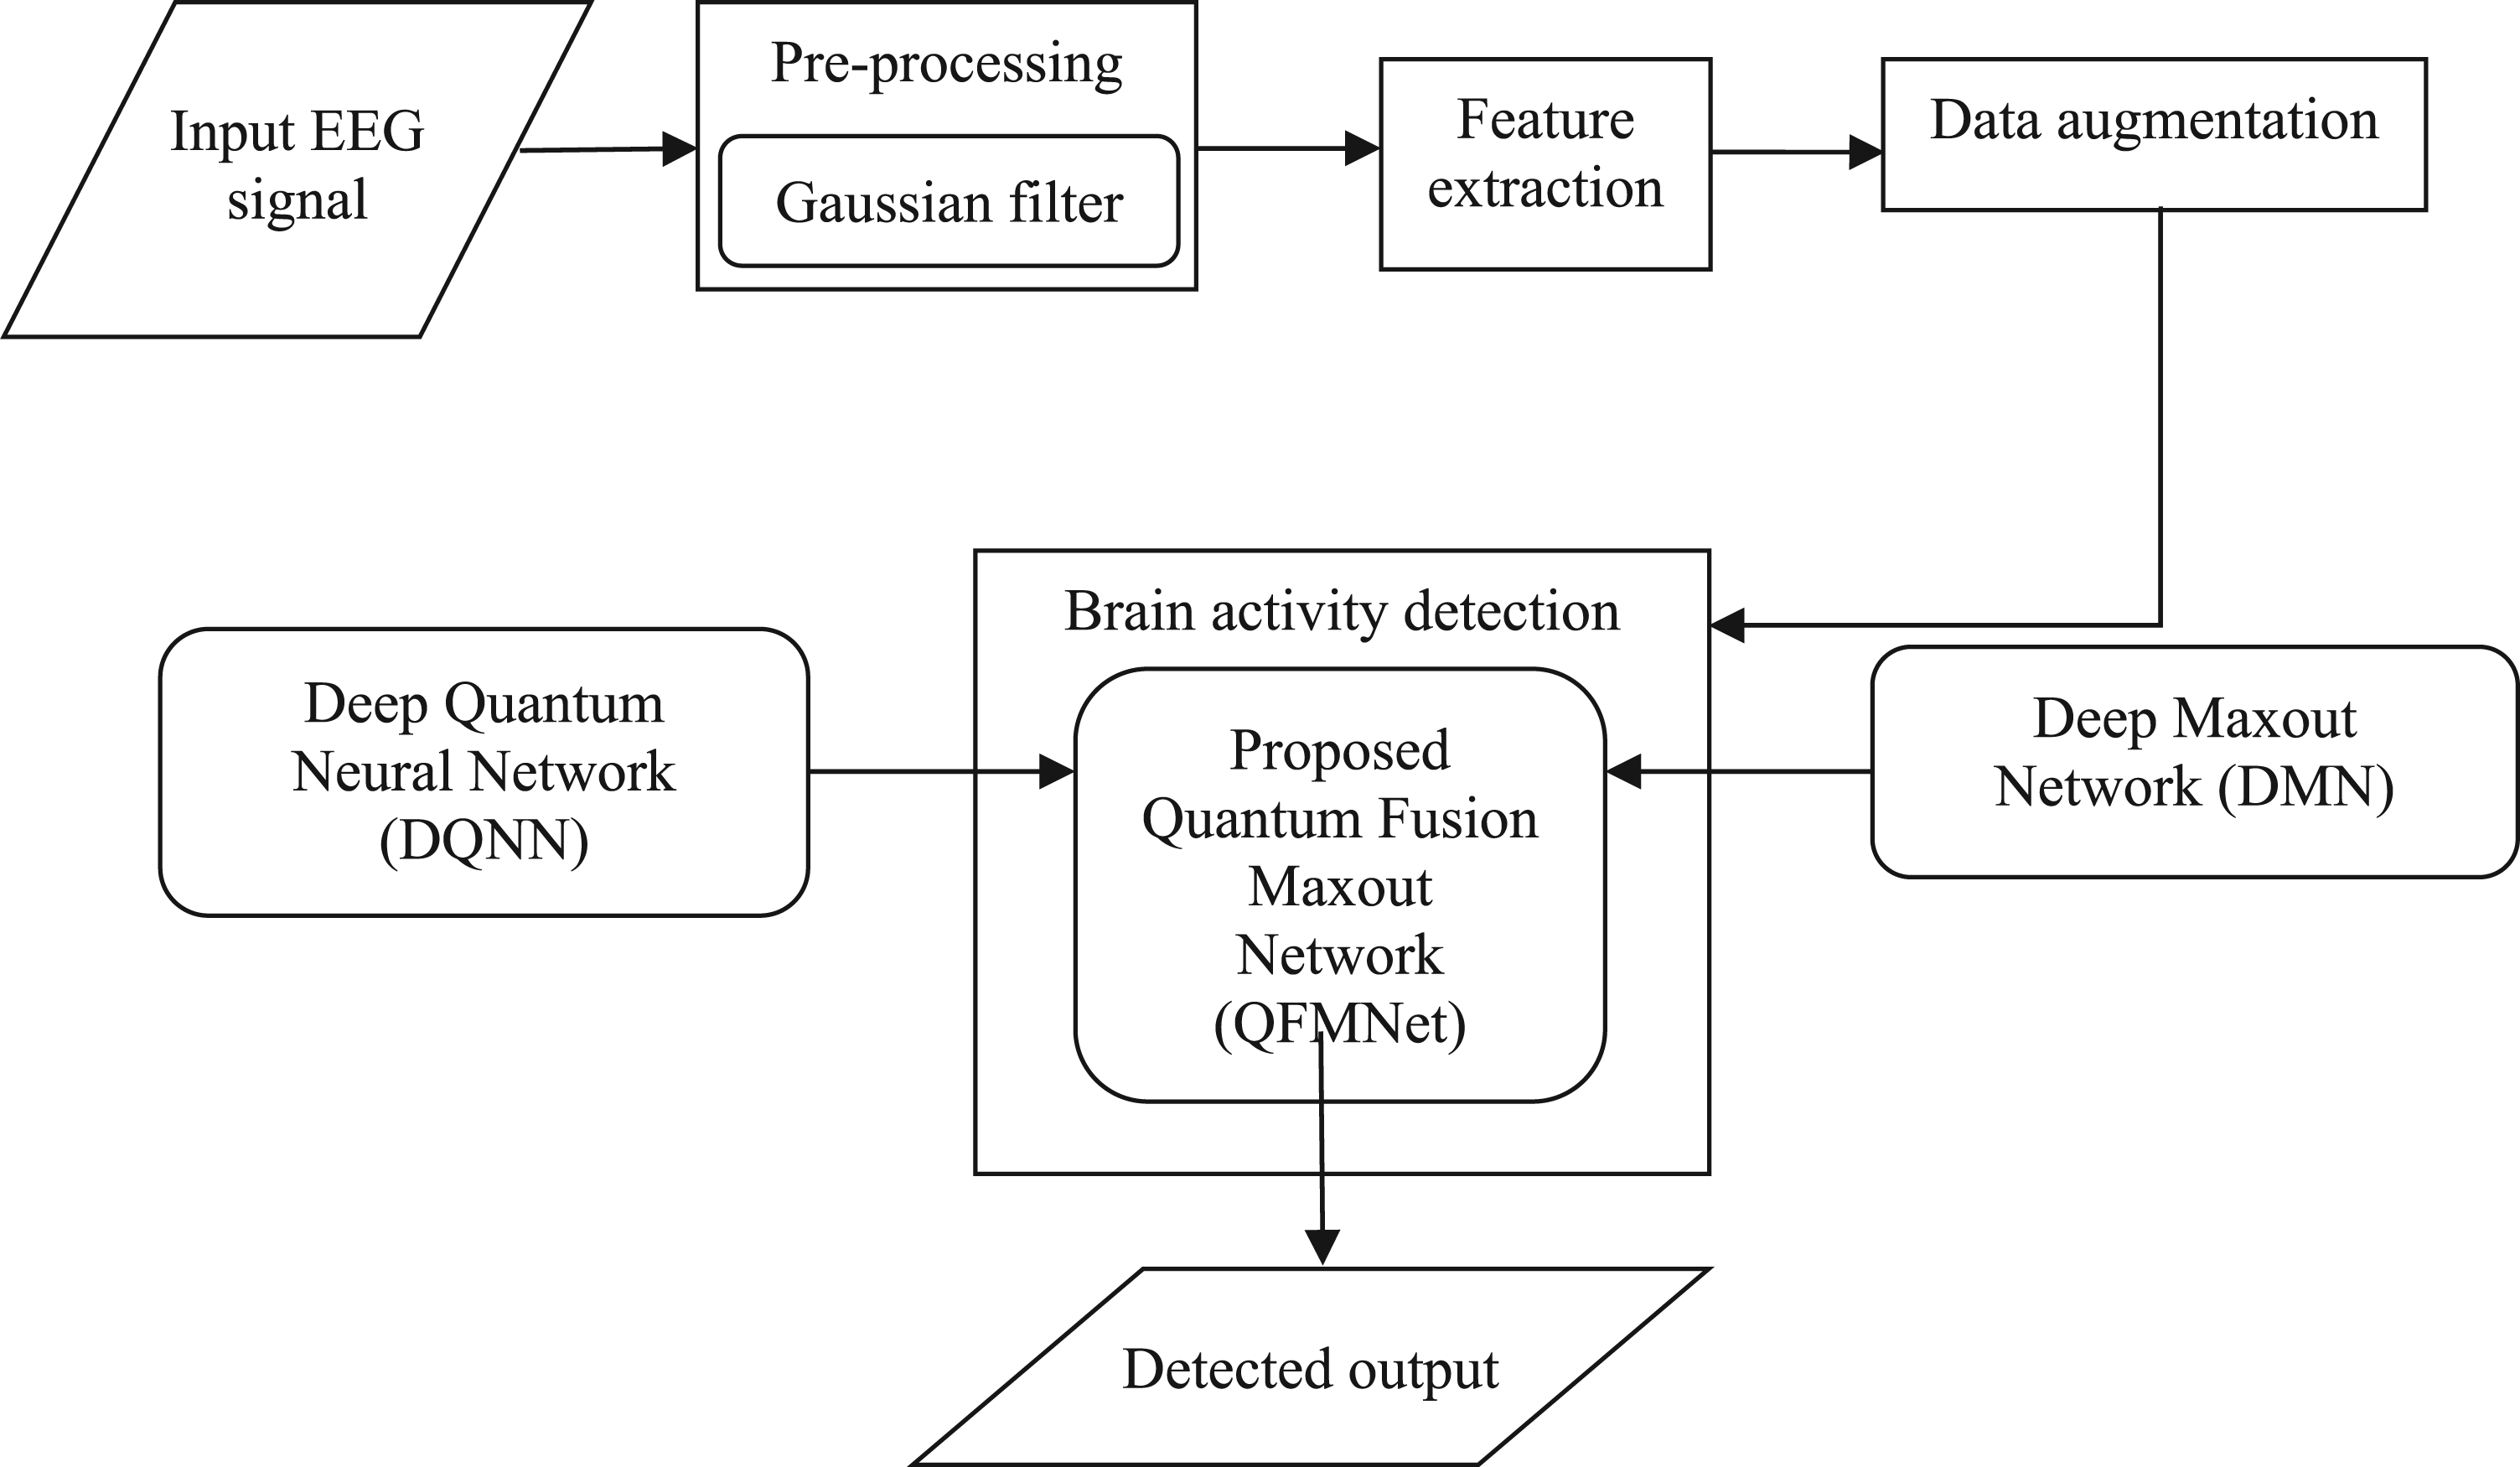
Structural diagram of proposed QFMNet framework for effective brain activity detection using an EEG signal.
The EEG signal considered as input is acquired from the BCI Competition III dataset IIIa and Iva35,36 for brain activity detection and the database is articulated by,

Preprocessing of the signal smoothens the signal and eliminates noises and artifacts from the EEG signal. Additionally, the dataset's quality can be effectively enhanced. The obtained EEG signal
Gaussian filter
The Gaussian filter
26
is used to smooth signals more successfully. This linear smooth filter incorporates both frequency domain and time domain filtering. When Gaussian noise is exposed to a Gaussian distribution, it has a good suppressing effect. Equation (2) represents the probability density function

The pre-processed EEG signal
Power spectral density
The signal strength as a function of frequency is described by PSD.
27
The autocorrelation sequence for a specific set of data is first valued for non-parametric approaches. After that, PSD is computed by applying the Fourier transform to the assessed autocorrelation sequence. Moreover, PSD is expressed as follows.

The logarithms of the power of the various bands of EEG data are used to calculate this feature.
27
Initially, the power value of every frequency band is computed and the highest value in the band is assessed by using the logarithm of signal power to evaluate this feature:

There are three categories of measures in the Hjorth parameter,
28
which include activity, mobility, and complexity. Hjorth parameters are one method of describing the statistical property of a signal in the time domain. The Hjorth parameters are elaborated as follows,
a) Activity: The surface of the power spectrum in the frequency domain can be recognized by analyzing activity measures and variance of the time function. In other words, if there are several or few high-frequency elements in the signal, the value of Activity returns a higher or lower value, respectively. The activity parameter expression is given below,
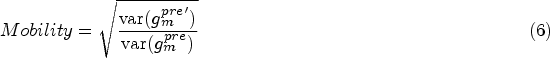
b) Mobility: Mobility is the square root of the ratio between the signal's first derivative's variance and itself. The standard deviation of the power spectrum is represented by this parameter. The expression for mobility is articulated as follows,
c) Complexity: The degree to which a signal's shape matches a pure sine wave is indicated by the complexity parameter. The more closely the signal matches a pure sine wave, the closer the complexity value converges to 1. The notation for the complexity parameter is stated as follows,
The parameters of activity, mobility and complexity are combined together to generate the Hjorth parameter


The spectral flux is utilized to extract the signal's spectral components.
29
The spectral components are significant because a change in the signal's spectral content over time will decrease recognition performance. The spectral flux can be obtained by calculating the squared difference between the normalized magnitudes of the following spectral distributions, which correspond to the successive signal frames. The spectral flux

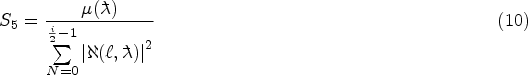
The ratio of the entire power to the tonal power of the spectrum elements is known as the tonal power ratio.
29
The tonal spectrum is defined by the high value of tonal power ratio, which ranges from 0 to 1. The low value of the tonal power ratio represents the noise pattern. Further, the tonal power ratio is articulated in Equation (10),
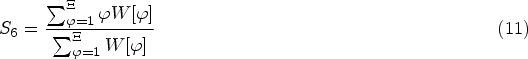
This parameter
30
is derived by evaluating the “center of gravity” using the magnitude and frequency information obtained from the Fourier transform. It describes the center of the spectral mass. The frequency-weighted amplitude value divided by overall amplitude provides the spectral centroid, which can be stated as,
The term “second central moment” or “spectral spread”
30
refers to the variation of the spectrum from the spectral centroid and it is stated below,
Additionally, statistical features
31
are extracted and it is performed by contemplating several features including kurtosis, skewness, and entropy.
Kurtosis Skewness Entropy
Kurtosis is a statistical measure that enumerates the degree of tailedness of a preprocessed signal concerning its normal distribution,
This measure is used to identify the symmetry of the preprocessed signal according to its mean value, and it can be found utilizing the below equation,
The preprocessed signal's non-linearity is characterized by this feature,
32
which is quantified as follows,

The features namely kurtosis, skewness, and entropy are combined to produce a statistical feature vector


The feature vector G is applied with a data augmentation procedure to expand the sample size. In data analysis, “data augmentation” refers to adding slightly altered copies of previously existing data or creating entirely new synthetic data from existing information in order to increase the number of training samples. In the training stage of a machine learning system, it acts as a regularizer and lessens overfitting. The oversampling model is used to augment the data here, which enhances detection performance. For instance: assume
Brain activity detection using the proposed QFMNet model
The detection of brain activity is generally required in order to identify the neurophysiological activities occurring in the brain and convert these signals into commands, which can be used to control various systems. Here, brain activity is detected using the QFMNet model based on the EEG signals produced while a person imagines hand, foot or tongue movement. Following the feature extraction process, brain activity is detected using the QFMNet model, which is created by combining the DQNN technique 33 and the DMN framework. 34
Here, brain activity is efficiently detected from the augmented features
The systematic framework of the QFMNet model for brain activity detection.
Initially, the DMN model is applied with the preprocessed EEG signal
Here, feature maps are obtained by moving the convolutional filters along the local patch and transmitting them to higher layers. The maxout unit, which is the hidden unit of the DMN improves the capability for generating various latent concept distributions. The activated hidden units are articulated as follows,


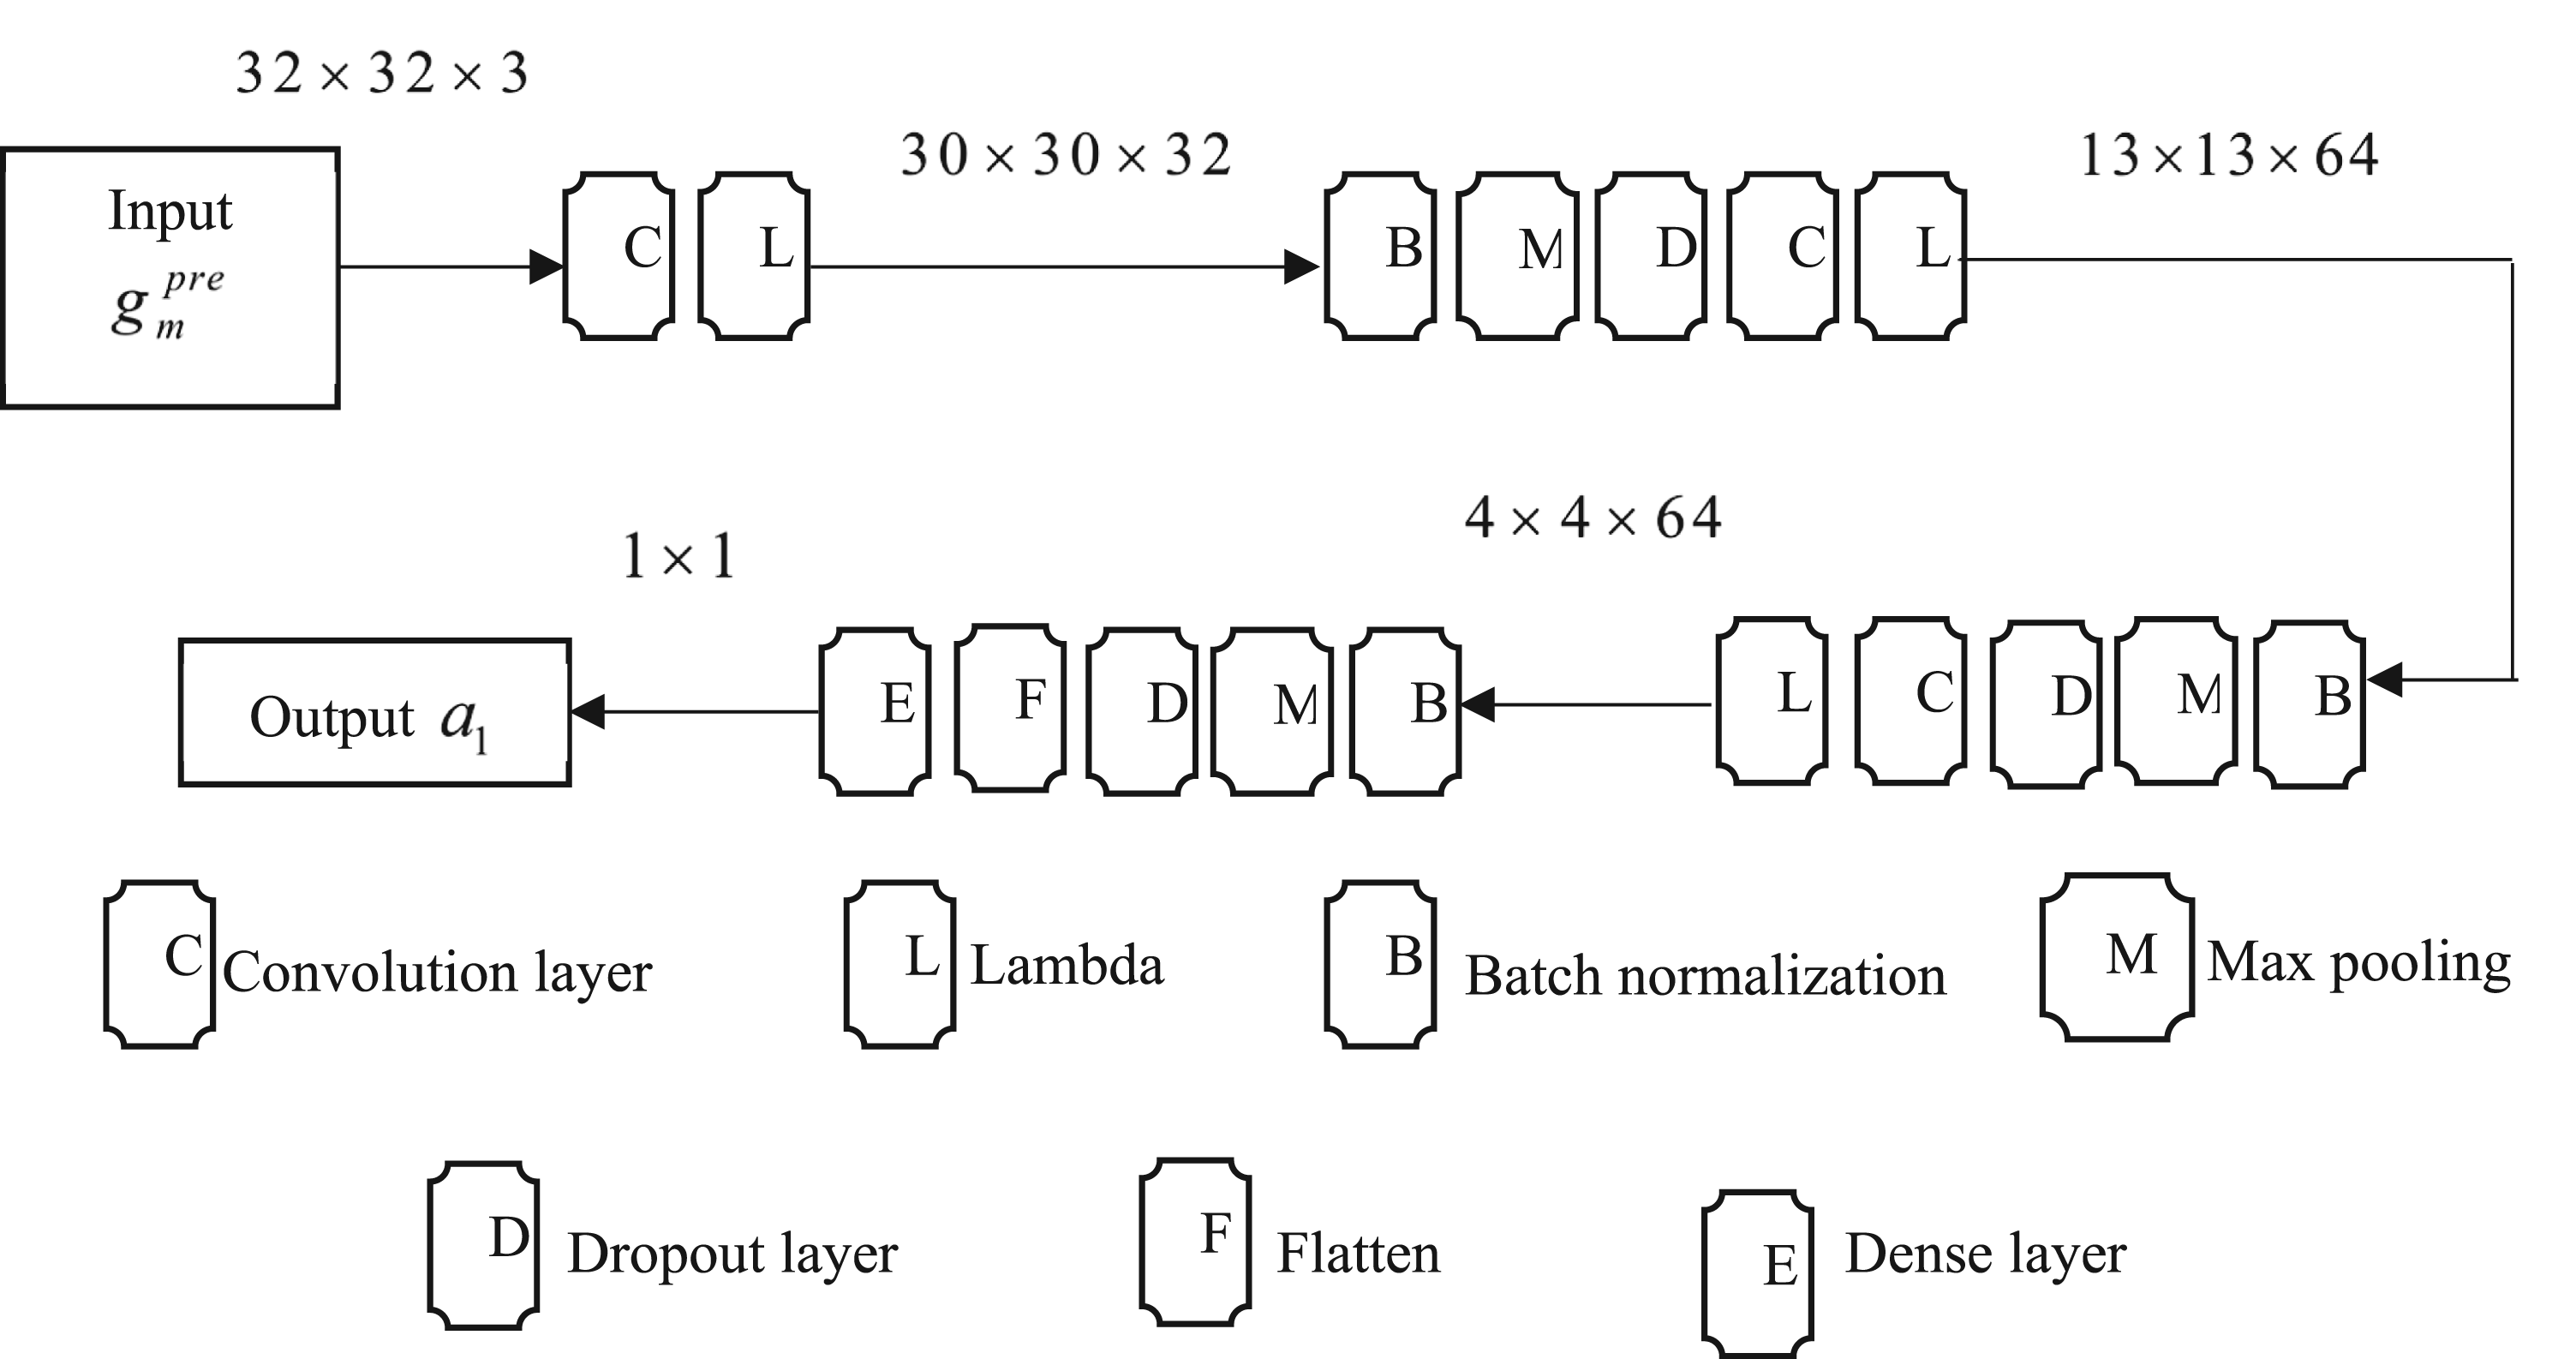
The network structure of the DMN approach.
Once the output
By considering augmented features

Thus, the outcome of the QFMNet layer is articulated as follows,


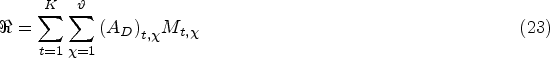
Using complete positive layer transition maps, DQNN
33
enables a quantum analogue of traditional back-propagation techniques. The resultant output of the QFMNet layer
DQNN architecture is represented by the quantum circuit of quantum perceptrons which are arranged into


The network architecture of the DQNN model.
The results and discussions followed to determine the superiority of QFMNet employed for brain activity detection are briefly demonstrated in this section.
Dataset description
The EEG signal used for the assessment of the QFMNet for brain activity detection is taken from the BCI Competition III dataset IIIa,
35
and BCI Competition III dataset IVa.
36
BCI Competition III dataset IIIa: This dataset
35
includes EEG signals recorded at 60 channels with a 250 Hz sampling rate from three subjects. In the experiment, a series of cue-based trial repetitions were required of each participant. The subject was instructed to imagine a left-hand, right-hand, foot, or tongue movement with the help of an arrow cue in each trial. A total of 60 trials were performed for each class. BCI Competition III dataset IVa: The dataset
36
consists of motor imagery EEG signals for left hand, right hand and left foot recorded from five healthy subjects using 118 channels and 140 trials were provided per class. The cues were presented at an intermittent period of random duration varying from 1.75 s to 2.25 s. The candidates were visually simulated by presenting the target using two techniques, such as (a) a randomly moving object and letters behind a fixation cross.
To identify the detection performance of QFMNet, several evaluation metrics are employed which are explicated beneath,
Specificity: The accurate detection of negative samples from the overall input of negative samples is known as specificity, and it is provided by,
Accuracy: This metric is the ratio of the amount of samples accurately identified to the overall count of samples and it is calculated using the following expression.
Sensitivity: Sensitivity is accurately identifying positive samples from the overall number of positive samples considered as input and it is articulated below,
Here, true negative is signified by
In this case, sensitivity is specified by


The QFMNet model proposed in this research for brain activity detection is evaluated against several existing BCI approaches, including MBEEGNet + MBShallowConvNet,
16
EEG-ITNet,
6
DLSTM,
8
and MSHCNN.
3
The comparison is conducted using EEG signals from the BCI Competition III dataset IIIa
35
and BCI Competition III dataset IVa.
36
The analysis considers different k-groups and learning set percentages to assess various performance metrics.
Analysis Using BCI Competition III Dataset III a with learning Sets Analysis based on BCI Competition III dataset IIIa using k-group
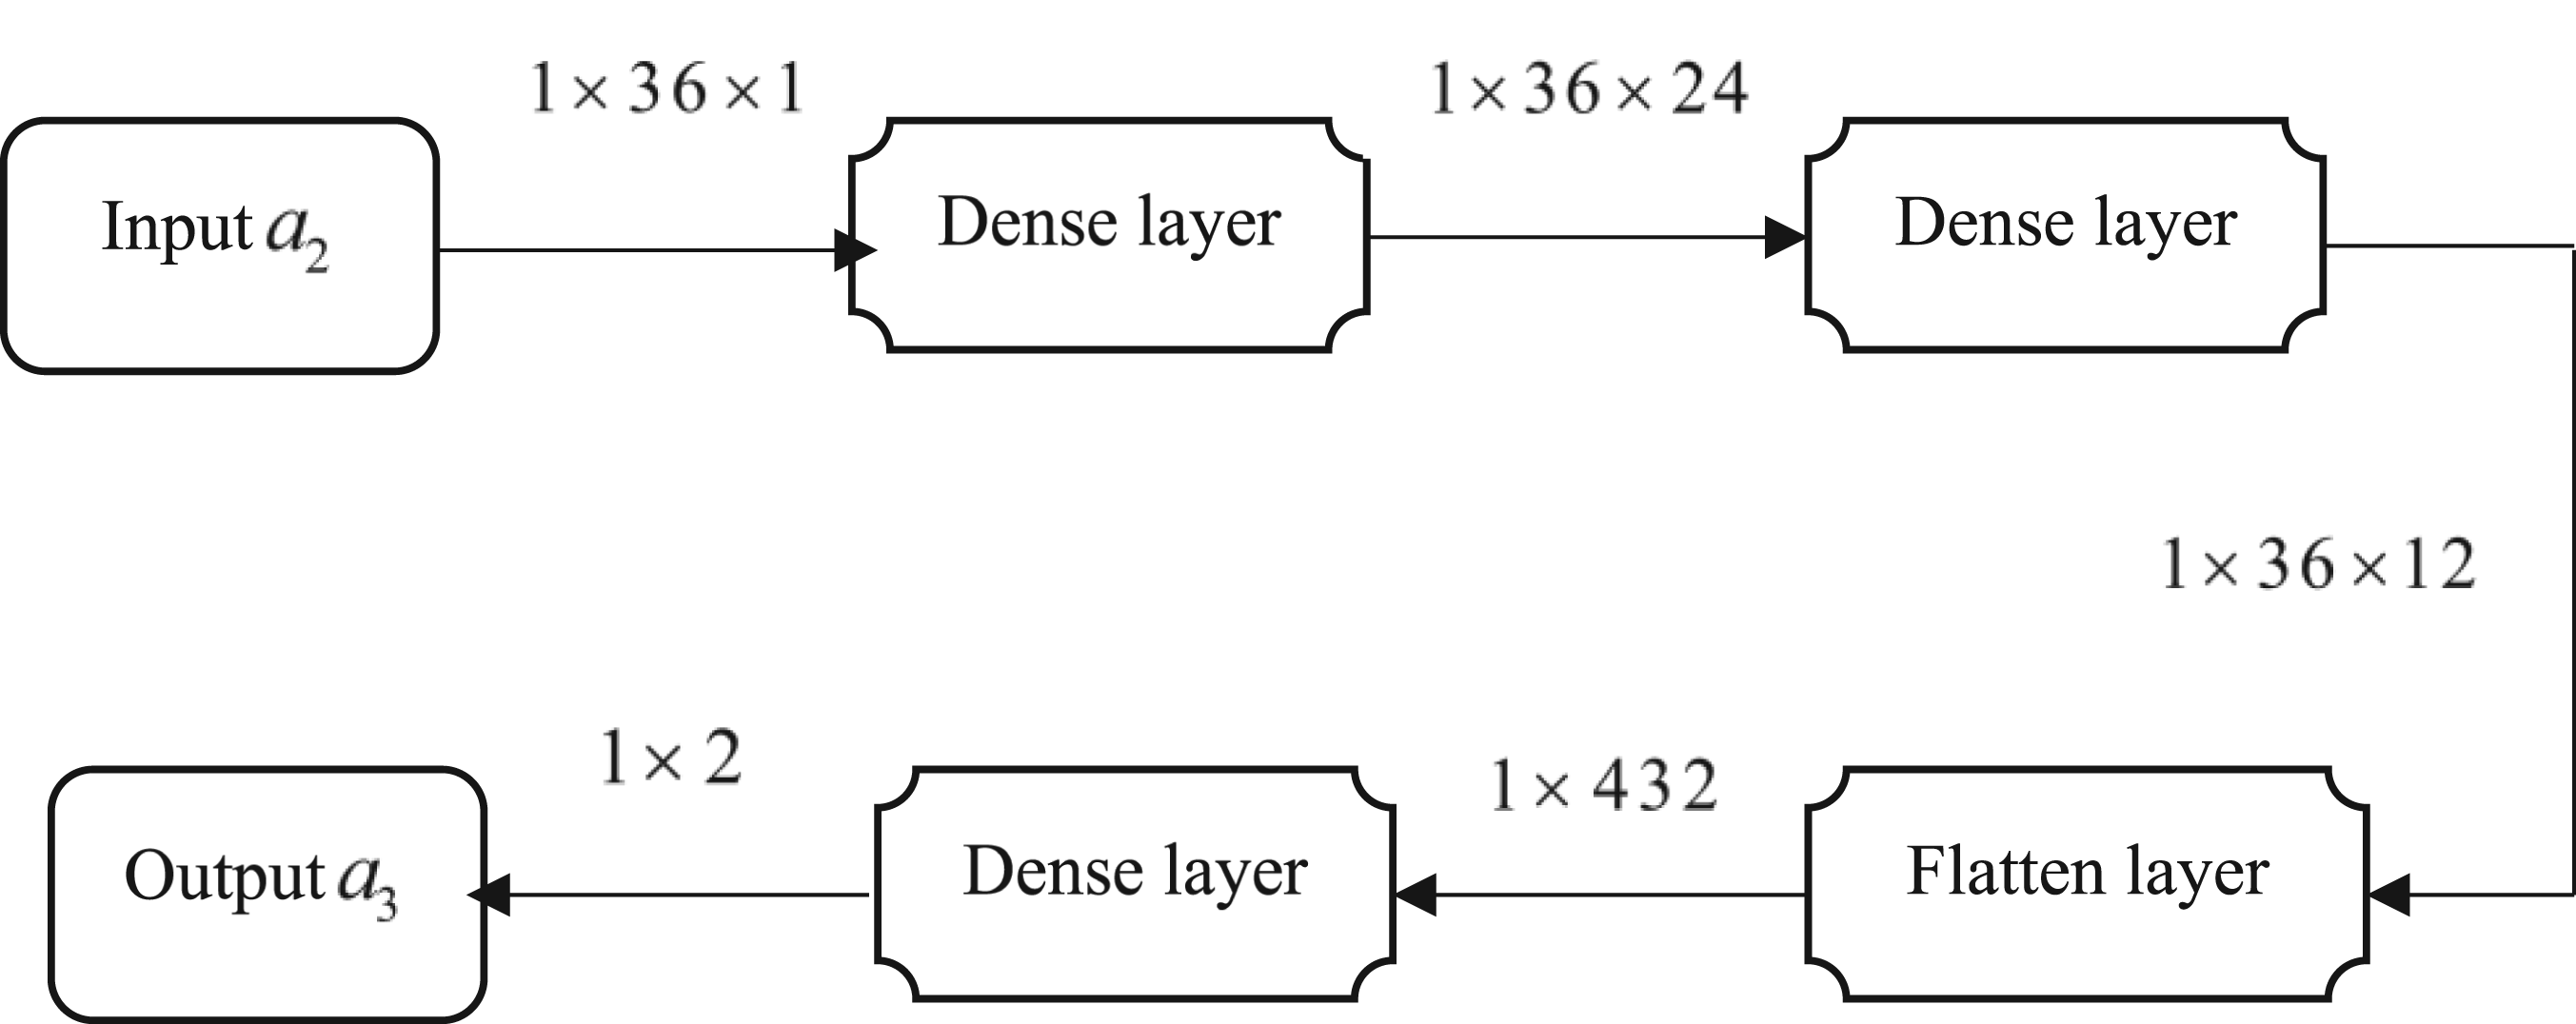
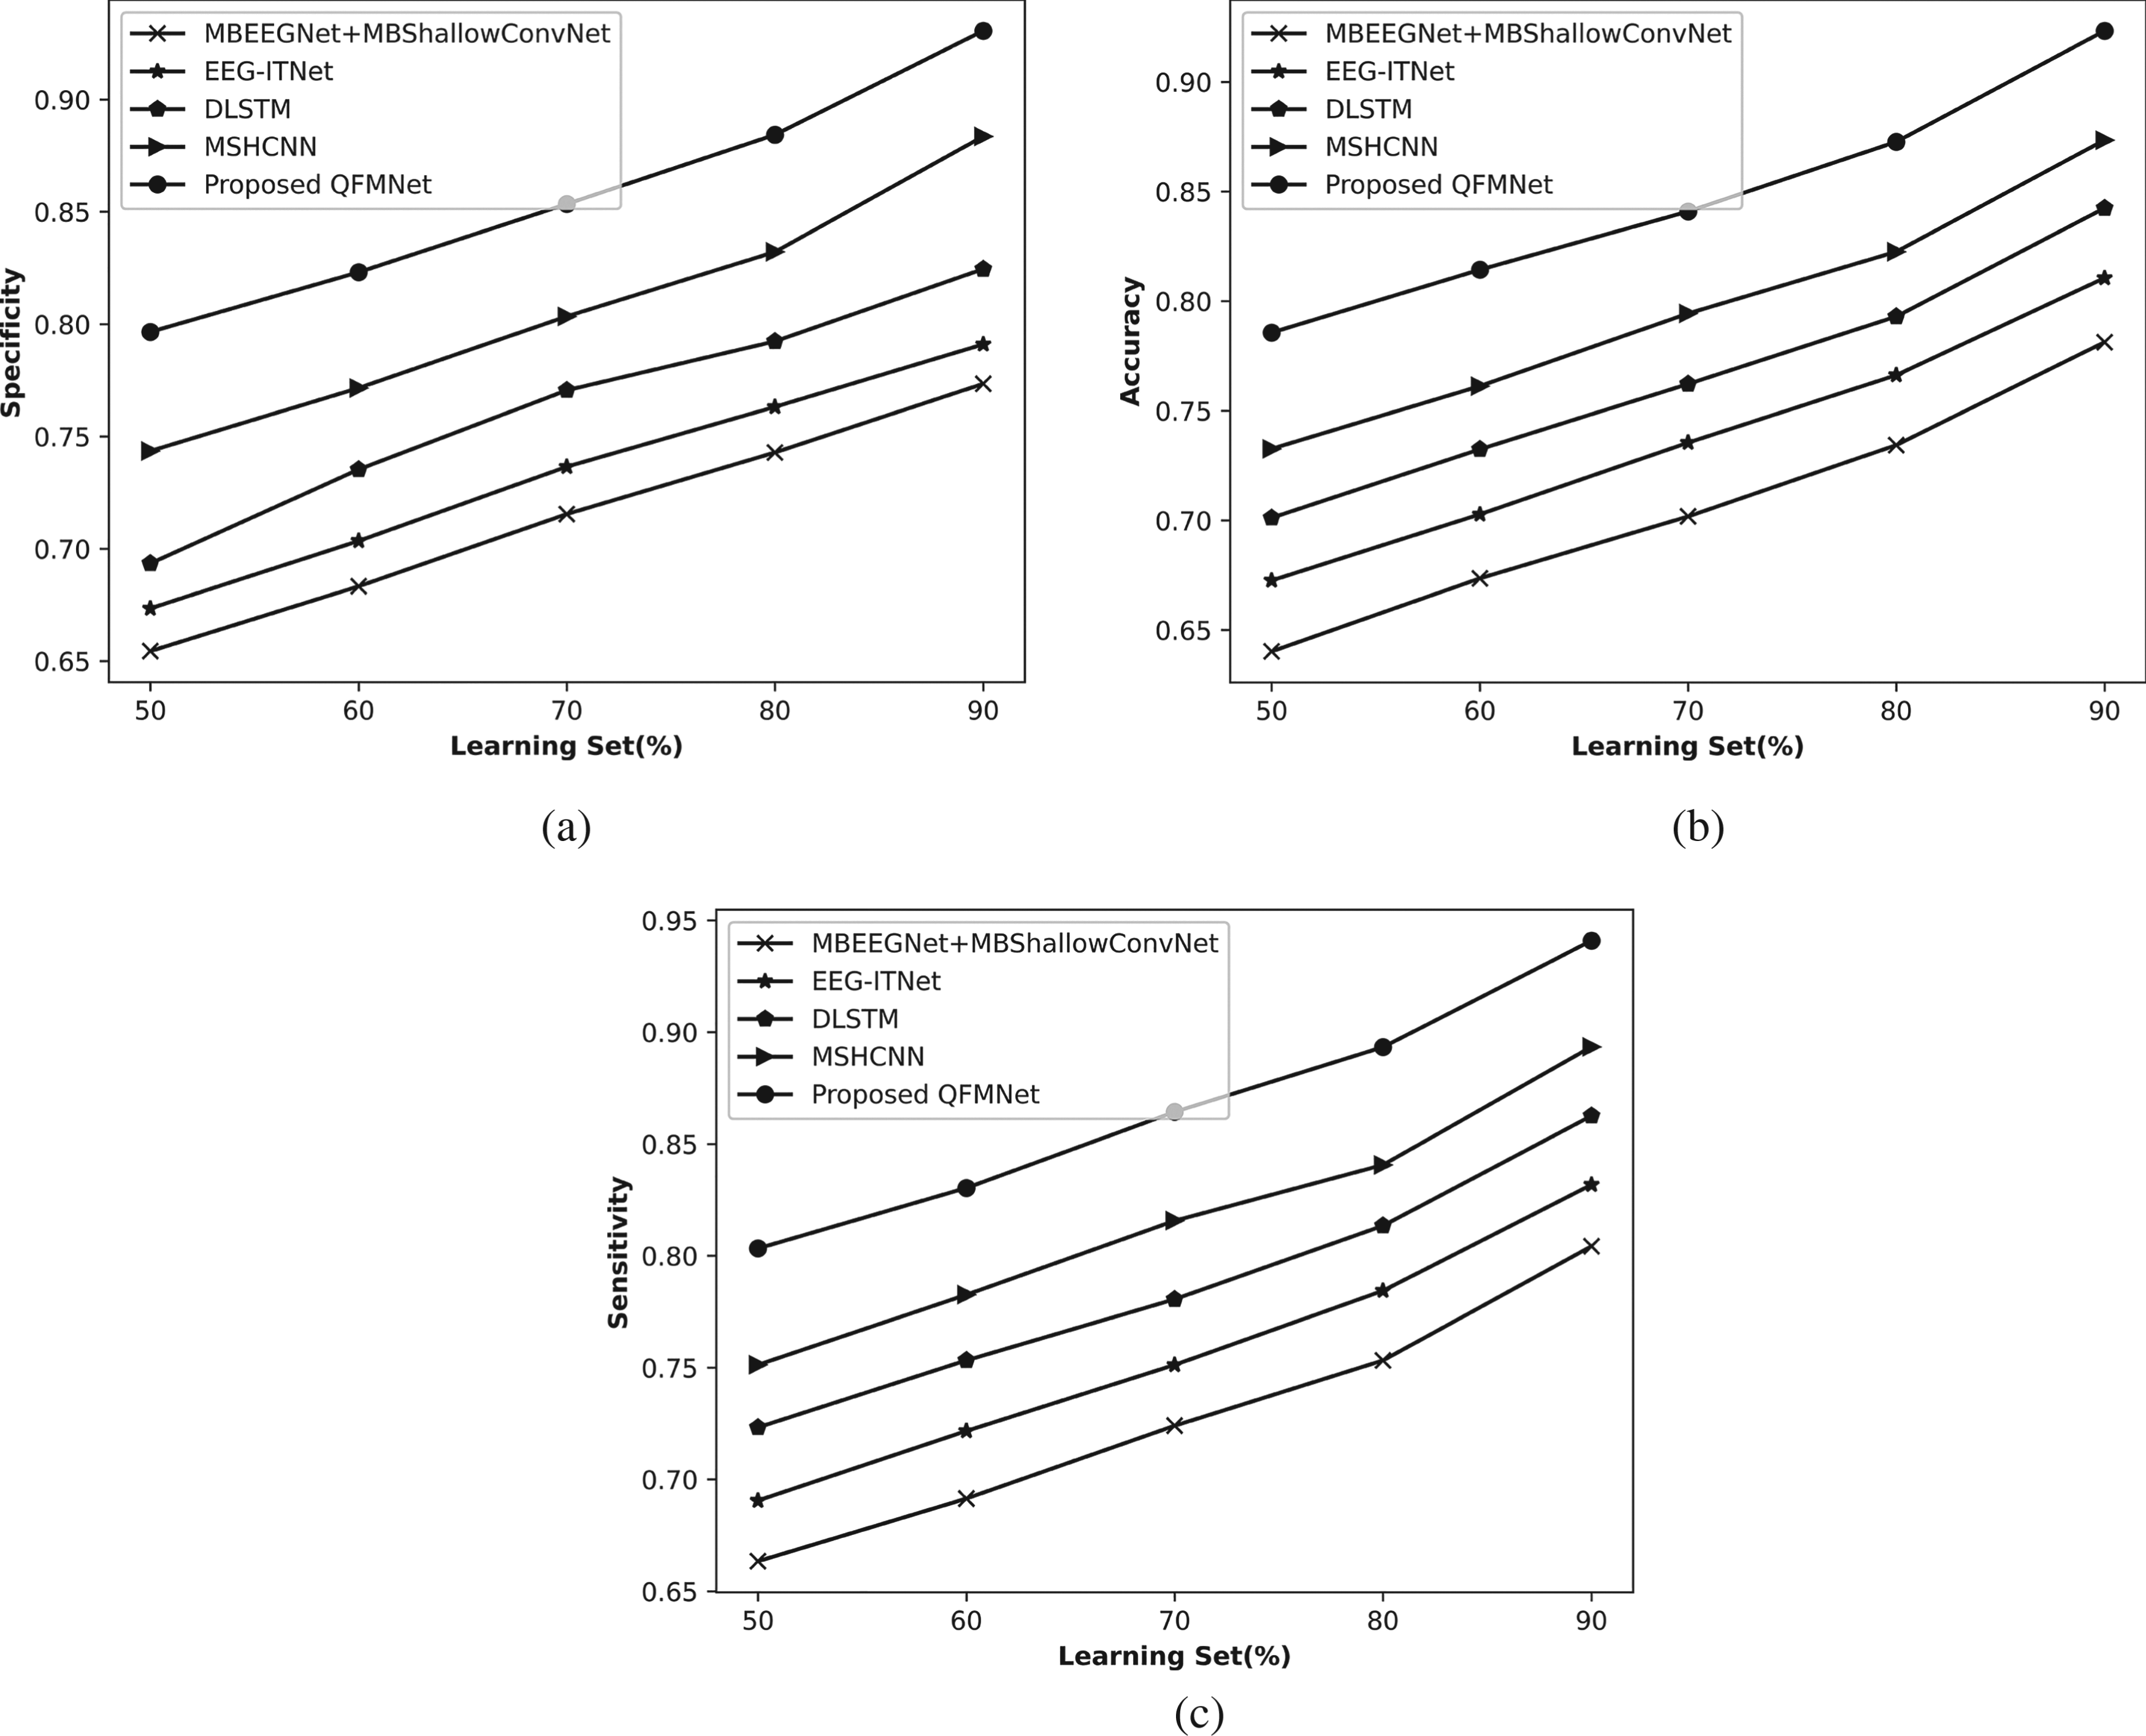
Figure 5 explicates the analysis of the QFMNet for brain activity detection using the EEG signals accumulated from the BCI Competition III dataset IIIa using a learning set. In Figure 5(a)), the evaluation of the QFMNet concerning specificity is portrayed. The QFMNet attained a specificity value of 92.2%, with 90% learning set, while the value attained by MBEEGNet + MBShallowConvNet is 78.2%, EEG-ITNet is 80.3%, DLSTM is 83.3%, and MSHCNN is 87.3%, which is lower than the specificity of QFMNet by 15.16%, 12.82%, 9.62%, and 5.28%. The evaluation of QFMNet relating to the accuracy measure is depicted in Figure 5(b)). The value of accuracy measured by MBEEGNet + MBShallowConvNet is 77.2%, EEG-ITNet is 80.3%, DLSTM is 83.1%, and MSHCNN is 86.0%, with 90% learning set and proposed QFMNet recorded accuracy of 91.2%, which is higher than the accuracy of other methods by 15.29%, 11.91%, 8.86%, and 5.63%. Figure 5(c)) shows the analysis of QFMNet contemplating sensitivity metric. With a 90% learning set, the BCI techniques, such as MBEEGNet + MBShallowConvNet, EEG-ITNet, DLSTM, MSHCNN, and QFMNet figured sensitivity of 79.1%, 82.1%, 85.2%, 88.2%, and 93.1%, which shows that QFMNet shows a superior sensitivity by 14.98%, 11.82%, 8.41%, and 5.25%.
Comparative assessment of QFMNet with BCI competition III dataset IIIa, (a) specificity, (b) accuracy, and (c) sensitivity employing learning set.
The evaluation of the QFMNet based on the EEG signals accumulated from the BCI Competition III dataset IIIa using k-group is depicted in Figure 6. In Figure 6(a), the analysis of QFMNet concerning specificity is illustrated. The specificity computed by MBEEGNet + MBShallowConvNet, EEG-ITNet, DLSTM, MSHCNN, and proposed QFMNet is 79.3%, 81.8%, 84.4%, 88.6%, and 92.9%, correspondingly, with k-group is 9. This reveals that the QFMNet attained a performance enhancement by 14.69%, 12.00%, 9.13%, and 4.69%. The valuation of the QFMNet regarding accuracy is depicted in Figure 6(b). The QFMNet recorded an accuracy of 91.8%, which is better by 14.54%, 11.35%, 8.23%, and 4.91% than the accuracy figured by MBEEGNet + MBShallowConvNet at 78.4%, EEG-ITNet at 81.3%, DLSTM at 84.2%, and MSHCNN at 87.3%, with 9 k-group. Further, in Figure 6(c), the valuation of the QFMNet concerning sensitivity is demonstrated. The sensitivity quantified by MBEEGNet + MBShallowConvNet, EEG-ITNet, DLSTM, MSHCNN, and QFMNet is 80.2%, 83.2%, 86.1%, 88.6%, and 93.8%, correspondingly. It can be observed that QFMNet gained a performance enhancement of 14.43%, 11.30%, 8.18%, and 4.59%, with a k-group 9.
Analysis based on BCI Competition III dataset IVa using learning set
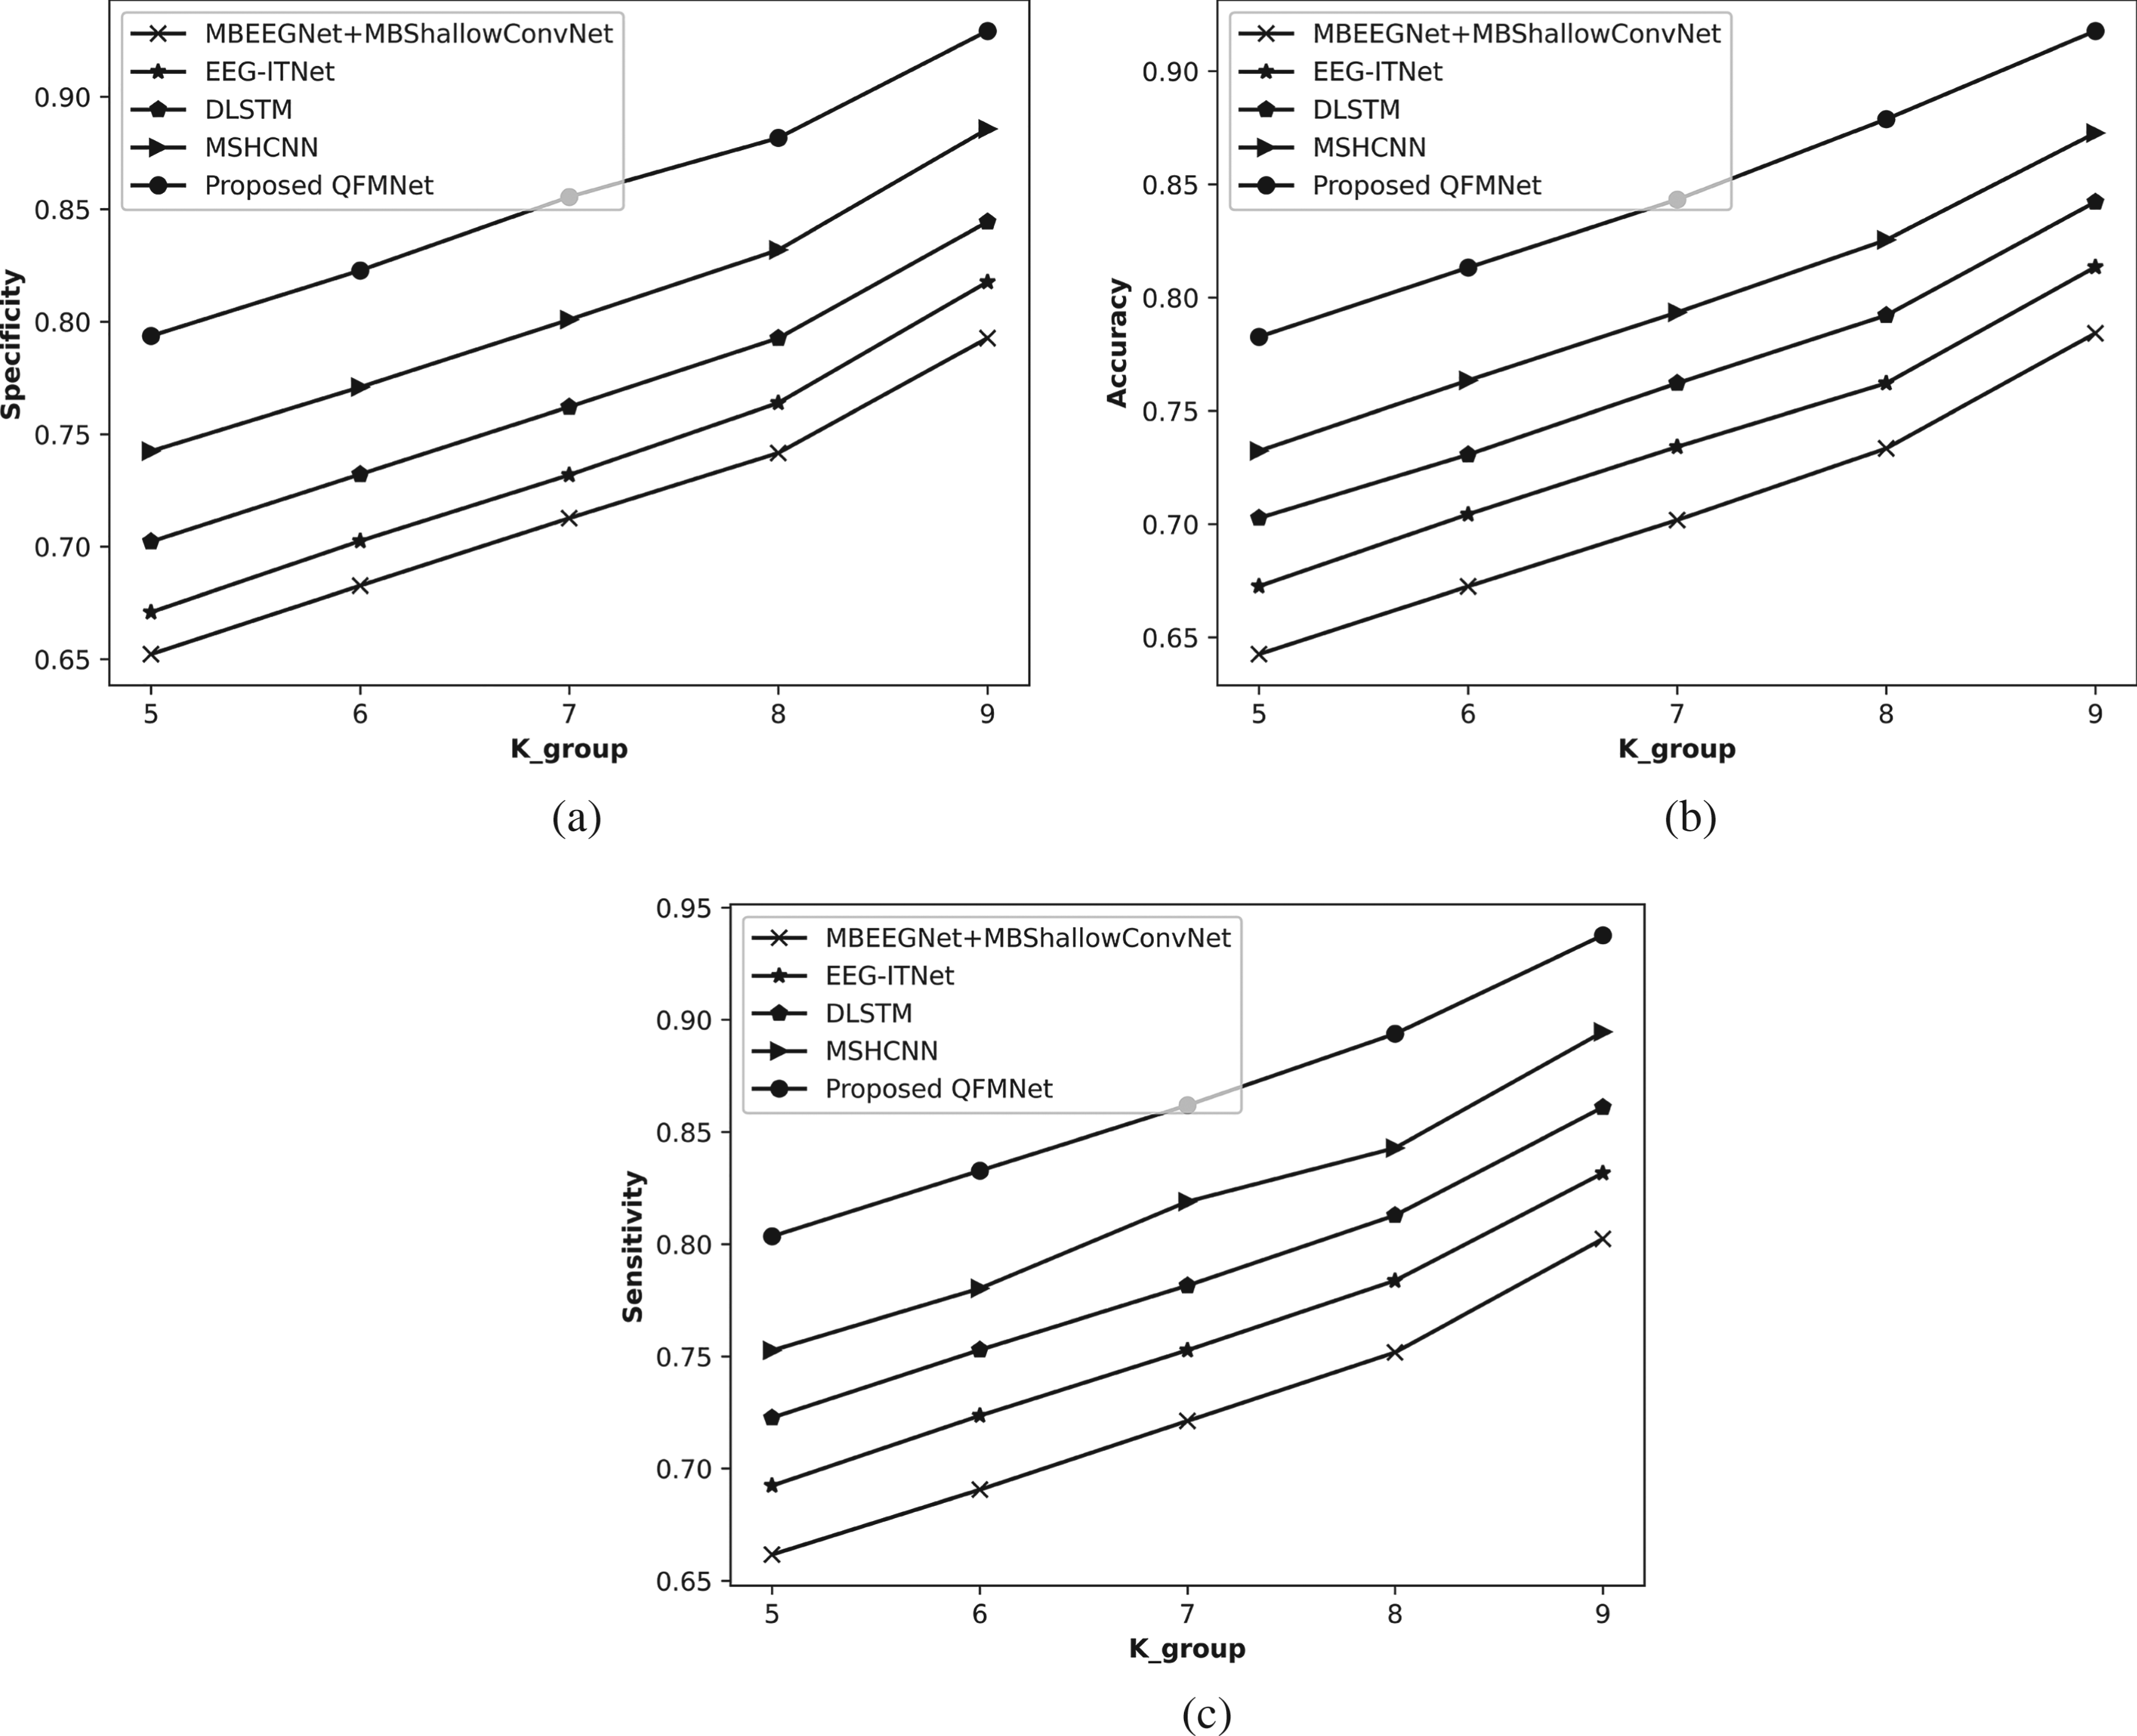
Comparative analysis of QFMNet with BCI competition III dataset IIIa, (a) specificity, (b) accuracy, and (c) sensitivity using k-group.
Figure 7 explicates the valuation of the QFMNet for brain activity detection utilizing EEG signals collected from BCI Competition III dataset IVa using a learning set. In Figure 7(a), the valuation of the QFMNet with respect to specificity is displayed. The QFMNet gained a specificity value of 93.1%, with 90% learning set, while value achieved by MBEEGNet + MBShallowConvNet is 77.3%, EEG-ITNet is 79.1%, DLSTM is 82.5%, and MSHCNN is 88.4%, which is lower than the specificity of QFMNet by 16.89%, 15.00%, 11.39%, and 5.05%. The assessment of QFMNet relating to the accuracy metric is shown in Figure 7(b). The value of accuracy measured by the MBEEGNet + MBShallowConvNet is 78.1%, EEG-ITNet is 81.1%, DLSTM is 84.2%, MSHCNN is 87.3% and proposed QFMNet is 92.3%, with 90% learning set. The QFMNet attained an improved performance by 15.38%, 12.21%, 8.76%, and 5.40%. Figure 7(c) portrays evaluation of QFMNet contemplating sensitivity measure. With 90% learning set, the BCI approaches, such as MBEEGNet + MBShallowConvNet, EEG-ITNet, DLSTM, MSHCNN, and QFMNet figured sensitivity of 80.4%, 83.2%, 86.3%, 89.3%, and 94.1%, which shows that QFMNet produced a higher sensitivity by 14.52%, 11.60%, 8.32%, and 5.04%.
Analysis based on BCI Competition III dataset IVa using k-group
Comparative investigation of QFMNet with BCI competition III dataset IVa, (a) specificity, (b) accuracy, and (c) sensitivity employing learning set.
The assessment of QFMNet based on EEG signals accumulated from BCI Competition III dataset IVa using the k-group is illustrated in Figure 8. In Figure 8(a), an assessment of QFMNet with regard to specificity is depicted. The specificity calculated by MBEEGNet + MBShallowConvNet, EEG-ITNet, DLSTM, MSHCNN, and proposed QFMNet is 80.6%, 82.1%, 86.4%, 89.2%, and 93.8%, correspondingly, with k-group is 9. This reveals that the QFMNet conquered a performance enhancement by 14.10%, 12.46%, 7.84%, and 4.92%. The valuation of the QFMNet on the basis of accuracy is portrayed in Figure 8(b). The QFMNet quantified an accuracy of 93.0%, which is better by 14.76%, 11.64%, 10.43%, and 4.98% than the accuracy figured by MBEEGNet + MBShallowConvNet at 79.3%, EEG-ITNet at 82.2%, DLSTM at 83.3%, and MSHCNN at 88.3%, with 9 k-group. Further, in Figure 8(c), the valuation of the QFMNet concerning sensitivity is demonstrated. The sensitivity quantified by MBEEGNet + MBShallowConvNet, EEG-ITNet, DLSTM, MSHCNN, and QFMNet is 81.3%, 84.1%, 86.3%, 89.3%, and 94.8%, correspondingly with a k-group 9. It can be observed that QFMNet achieved a performance enhancement of 14.22%, 11.34%, 8.97%, and 3.00%.
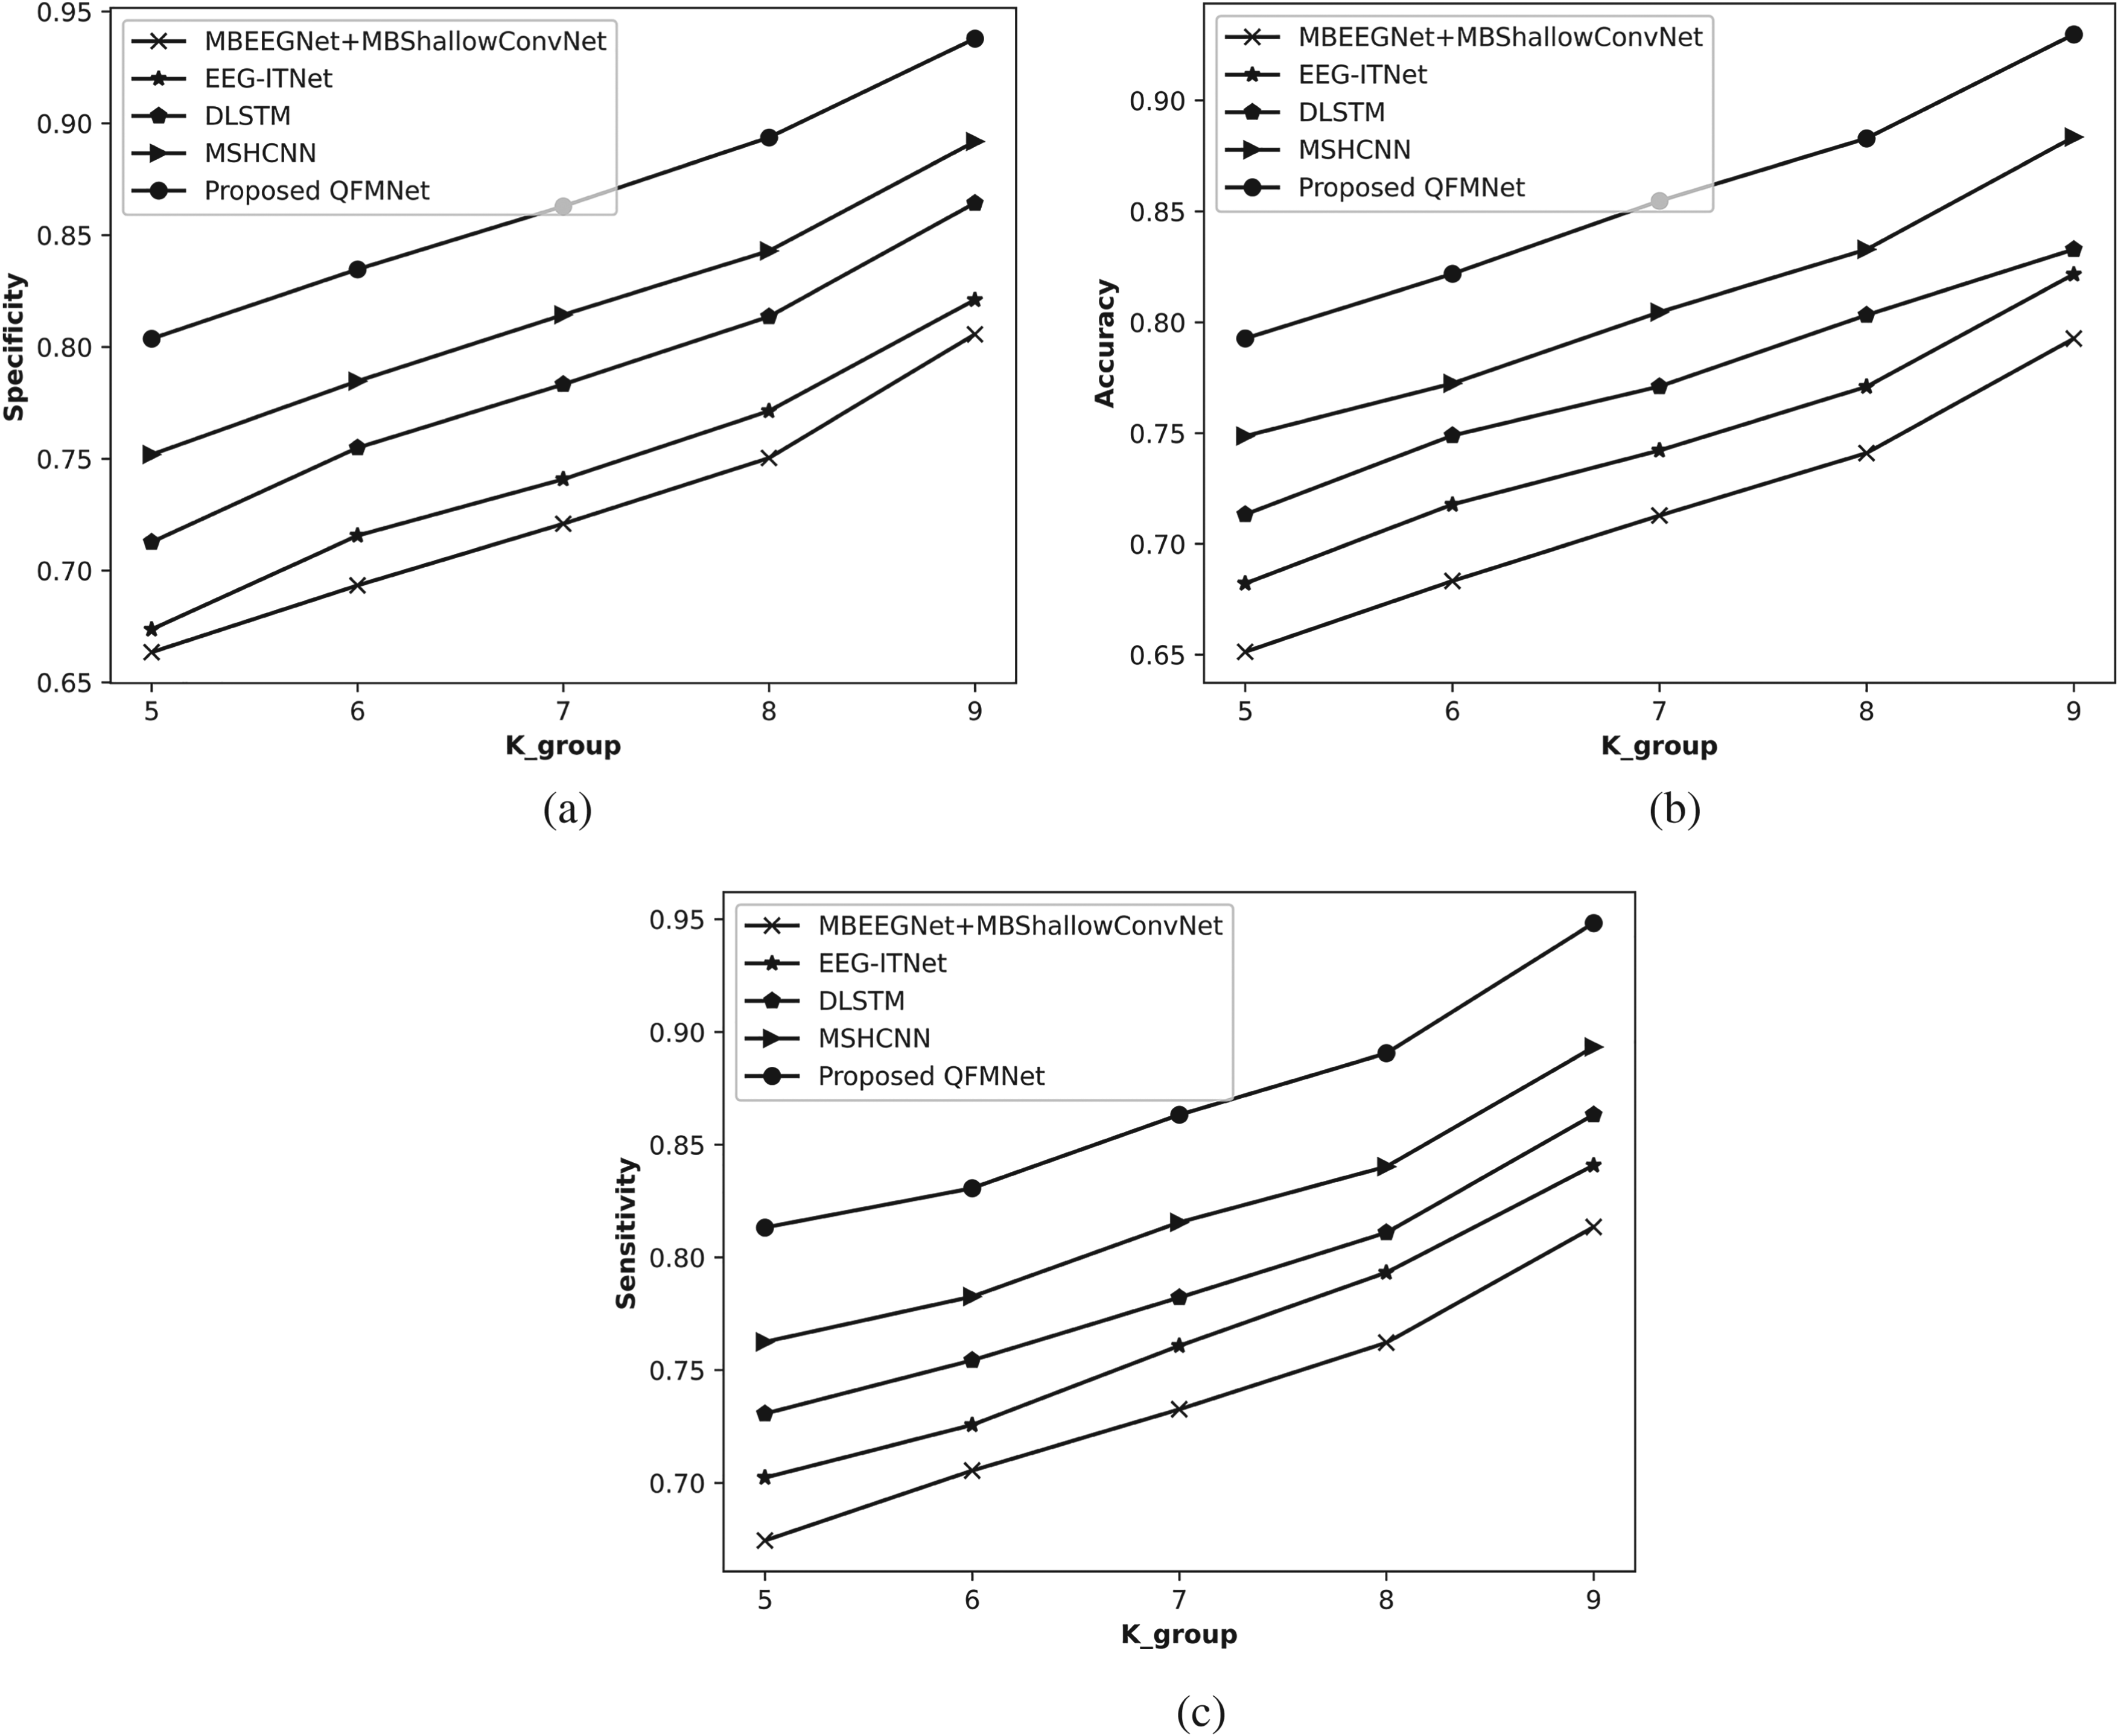
Comparative valuation of QFMNet with BCI competition III dataset IVa, (a) specificity, (b) accuracy, and (c) sensitivity using k-group.
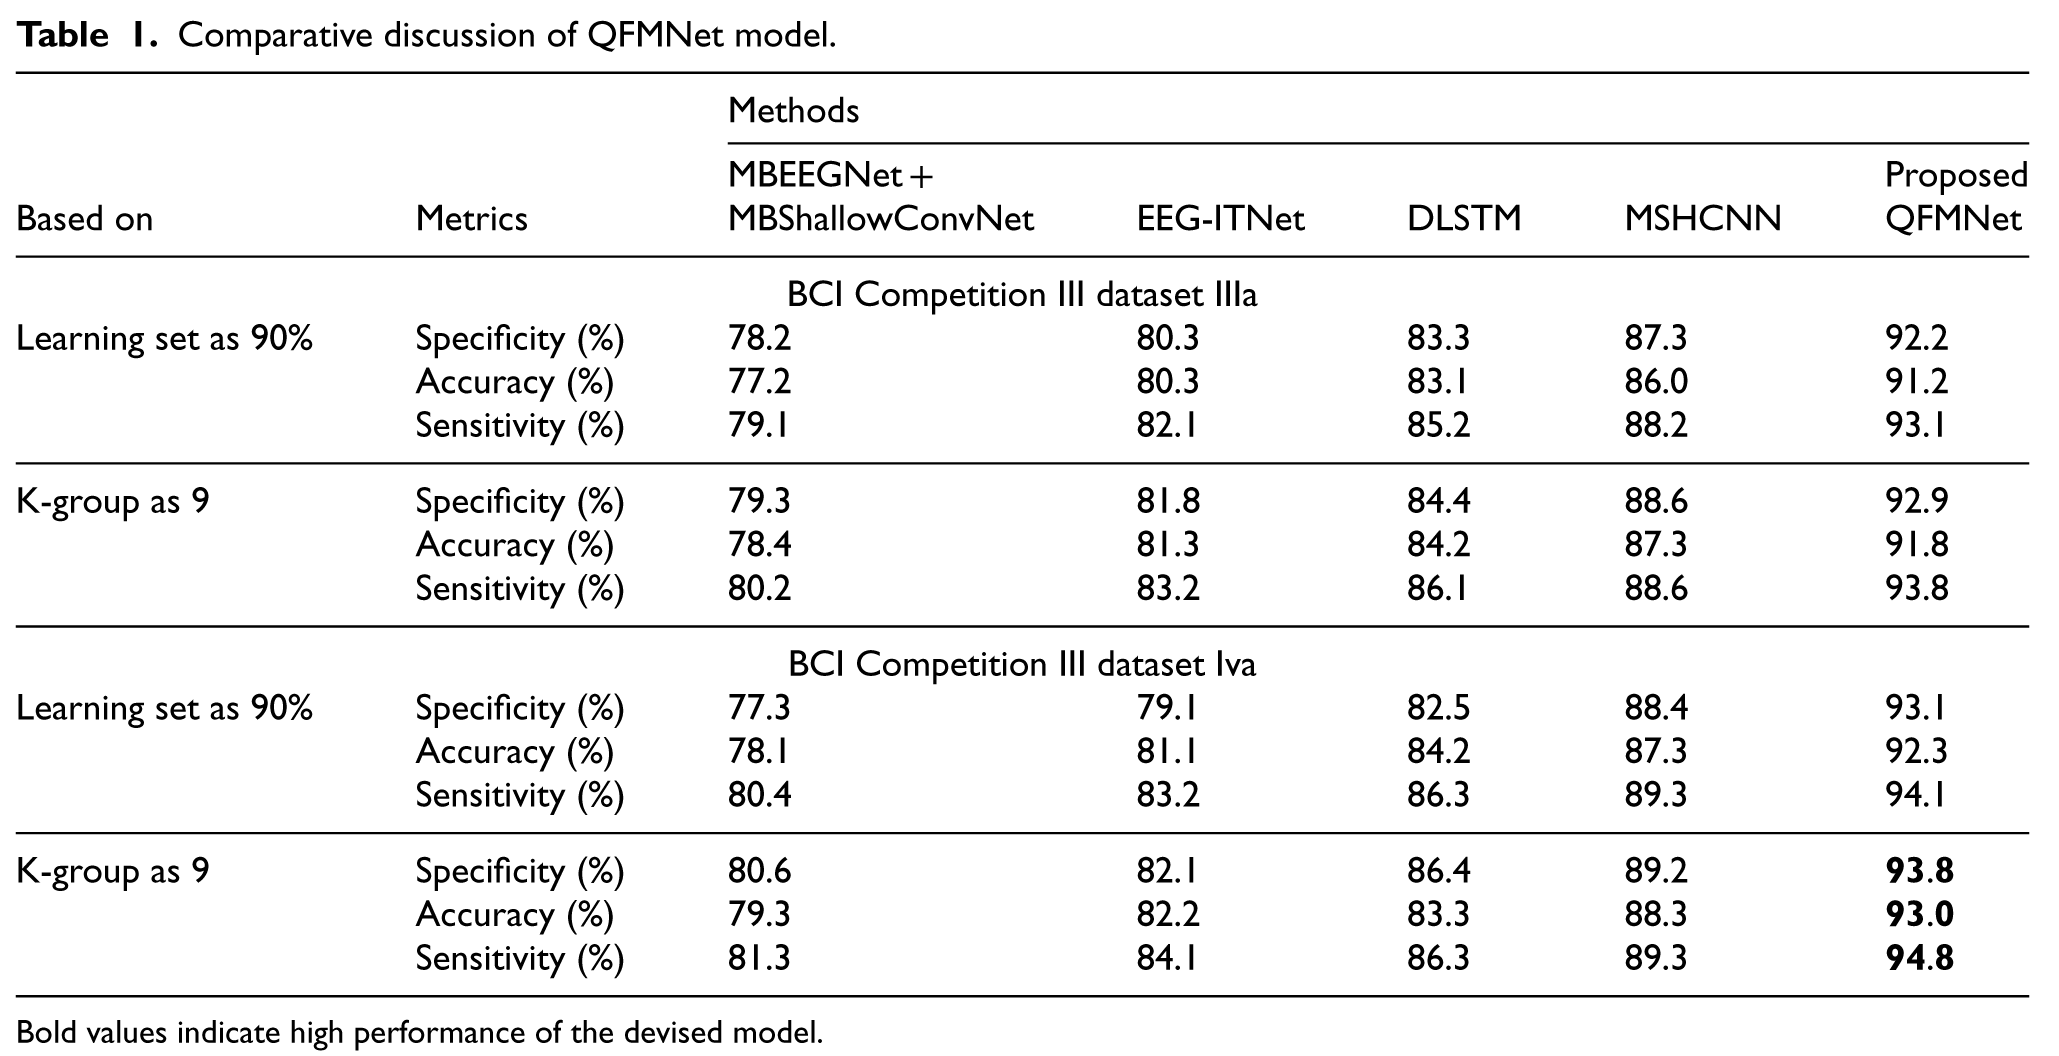
The performance of the QFMNet technique for the detection of brain activity is assessed by comparing it with prevailing BCI techniques using BCI Competition III dataset IIIa and BCI Competition III dataset IVa, and the values of evaluation metrics attained with 90% learning set and k-group as 9 are exemplified in Table 1. Furthermore, the QFMNet approach has gained specificity, accuracy, and sensitivity quantified 93.8%, 93.0%, and 94.8%, when contemplating the k-group is 9 for BCI Competition III dataset IVa. Furthermore, traditional approaches namely MBEEGNet + MBShallowConvNet, EEG-ITNet, DLSTM, and MSHCNN measured specificity of 80.6%, 82.1%, 86.4%, and 89.2%. Also, the accuracy achieved by prevailing techniques is 79.3% for MBEEGNet + MBShallowConvNet, 82.2% for EEG-ITNet, 83.3% for DLSTM, and 88.3% for MSHCNN. Similarly, sensitivity values recorded by existing techniques such as MBEEGNet + MBShallowConvNet is 81.3%, EEG-ITNet is 84.1%, DLSTM is 86.3%, and MSHCNN is 89.3%. The overall brain activity detection method is boosted by utilizing QFMNet, which is formed by the incorporation of DMN and DQNN methods. High robustness is demonstrated by the DMN technique, whereas higher-dimensional feature spaces are handled more effectively by DQNNs. By combining these two models, the QFMNet method acquired the properties of both models and attained the optimum performance and detected brain activity more precisely.
Comparative discussion of QFMNet model.
Comparative discussion of QFMNet model.
Bold values indicate high performance of the devised model.
In this manuscript, a novel approach is devised for detecting brain activity utilizing EEG signals. This method uses EEG signals because they provide a clear image of the neural activities taking place in the brain and can be used to determine an individual's thoughts. Initially, a Gaussian filter is utilized to eradicate the artifacts present in EEG signals. Later, PSD, logarithmic band power, spectral flux, spectral spread, spectral centroid, tonal power ratio, statistical features such as kurtosis, skewness and entropy, Hjorth parameters including activity, mobility, and complexity are mined from the preprocessed signal and these are fed to the data augmentation for increasing the number of training sample. Then, the resultant outcome is subjected to the brain activity detection phase by employing the proposed QFMNet, where the QFMNet technique is developed by the combination of DMN and DQNN techniques. The QFMNet is observed to have generated higher values of specificity of 93.8%, accuracy of 93.0%, and sensitivity of 94.8%, by considering the k-group as 9. Future works will target employing a hybrid optimization technique for increasing the detection accuracy.
Footnotes
Funding
The authors received no financial support for the research, authorship, and/or publication of this article.
Declaration of conflicting interests
The authors declared no potential conflicts of interest with respect to the research, authorship, and/or publication of this article.