
Abstract
Time series forecasting presents significant challenges for traditional models due to inherent noise, non-stationary patterns, and uncertainty. This study proposes a novel hybrid framework integrating fuzzy logic, dynamic clustering, and LSTM networks to address these challenges. While machine learning approaches like Long Short-Term Memory (LSTM) networks have shown promise, they often struggle with noise, uncertainty, and non-stationary patterns inherent in cryptocurrency markets. This study addresses these limitations by proposing a novel hybrid framework that integrates fuzzy logic, MicroTEDAClus dynamic clustering, and LSTM networks. The framework introduces three key innovations: fuzzy logic-based categorization to handle market uncertainty and linguistic ambiguity, MicroTEDAClus clustering to adaptively segment data streams and capture evolving price regimes, and an LSTM architecture optimized for modelling temporal dependencies in clustered subsets. The methodology, applied to historical Bitcoin price data, underwent rigorous evaluation through preprocessing, dynamic clustering, and multi-phase model training. The experimental results demonstrate the framework’s effectiveness, achieving a Train RMSE of 2687.93, a Test RMSE of 4872.49, a Train MAPE of 2.73%, and a Test MAPE of 4.40%. These findings highlight the potential of hybrid models for improved financial decision-making in volatile markets.
Keywords
Introduction
The forecasting challenge within time series data–sequential data ordered over fixed time intervals–remains a critical research area as shown by Lim and Zohren (2021). Various disciplines have traditionally approached this challenge using methods such as statistics, artificial neural networks, and stability analysis techniques, as demonstrated by Elkaf et al. (2024), which provide robust frameworks for evaluating model performance. Additionally, techniques such as data transformation, as explored by Laarichi et al. (2024), have shown promise in managing stochastic processes. However, traditional time series forecasting models rely heavily on historical data, which can often be incomplete, imprecise, or ambiguous, limiting their effectiveness as mentioned by Benidis et al. (2022) and Masini et al. (2023). These limitations are particularly apparent in complex datasets, like Bitcoin price trends, that exhibit non-linear patterns, volatility, and uncertainty. To address these problems, this study proposes a holistic approach that integrates three methods: the MicroTEDAClus algorithm, long-short-term memory (LSTM) networks, and fuzzy time series (FTS). By combining the best features of both methodologies, this hybrid strategy tackles the inherent volatility of large datasets.
Fuzzy time series, introduced by Song and Chissom in their foundational works (Song & Chissom, 1993, 1994), revolutionized the analysis of incomplete and vague data under uncertainty by leveraging fuzzy logic theory. Unlike traditional time series, fuzzy time series represent linguistic values (e.g., “high” or “low”) rather than numerical values, enabling more intuitive modelling of ambiguous patterns. Following this conceptual breakthrough, Song and Chissom (Song et al., 1995, 1997) pioneered its practical application by developing a forecasting framework for enrollment data at the University of Alabama. Their methodology involves four key steps: partitioning the universe of discourse to define data boundaries, fuzzifying time series data to handle uncertainty, constructing fuzzy relationships to identify patterns, and forecasting and defuzzifying results to generate precise predictions. Since these seminal contributions, extensive research has focused on refining fuzzy time series models to enhance forecasting accuracy and computational efficiency. Sullivan and Woodall (1994) introduced a first-order time-invariant fuzzy time series forecasting model based on the Markov model. Cheng et al. (2008) addressed computational inefficiencies in Song and Chissom’s model by developing first-order fuzzy logic relationship rules. Huarng further advanced the field by incorporating domain-specific heuristic knowledge, proposing heuristic time-invariant fuzzy time series forecasting models (Huarng, 2001). Chen et al. (2007) extended their earlier work to develop a high-order time-invariant fuzzy time series forecasting model. Researchers have also applied fuzzy Markov relation matrices to enhance forecasting (Tsaur, 2012). Şah and Degtiarev (2005) extended Cheng et al.’s framework (2008), introducing a heuristic high-order model to explicitly analyze trends in fuzzy time series data. Han et al. (2018) and Yu and Huarng (2010) incorporated neural networks and type-2 fuzzy sets to refine fuzzy relationships and improve forecasting accuracy. Yu further enhanced accuracy by developing models with refined relations and weighting schemes. Park et al. (2010) extended Cheng et al.’s high-order time-invariant fuzzy time series model to enable two-factor forecasting, testing their approach using data from Taipei. Most recently, Farida and Ainiyah (2024) demonstrated the effectiveness of Park’s fuzzy time series model in forecasting Bitcoin prices, highlighting the potential of fuzzy logic to address the inherent volatility of cryptocurrency markets.
Despite various approaches, equal-width partitioning remains commonly used but may not yield optimal results when the continuous value distribution is non-uniform (Bose & Mali, 2019). Recent findings suggest that using unequal-sized intervals might achieve better forecasting accuracy than traditional equal-width partitioning (Qu & Chen, 2012).
By leveraging the combined strengths of fuzzy mathematics and MicroTEDAClus, we can overcome the limitations of traditional methods and extract valuable insights from complex and uncertain time series data.
This paper is organized as follows. Section 2 provides a brief introduction to fuzzy time series and focus on the innovative MicroTEDAClus algorithm.. Section 3 discusses a FCM-based deterministic forecasting model and evaluates its performance and reliability compared to other models. The concluding section summarizes the findings and outlines potential directions for future research.
Materials and Methods
Fuzzy Time Series
Fuzzy logics operate on a many-valued mathematical system, adept at handling uncertainties. Even in basic models that utilize fundamental logic principles, this characteristic remains, offering a robust representation mechanism.
In their seminal work, scientists (Song & Chissom, 1993) laid down the foundational concept of fuzzy time series, offering the following definition:
Let
Then,
Moreover, Song and Chissom (1993) elucidated fuzzy relations among fuzzy time series, positing that these relations stem from the premise that the values of the fuzzy time series
FTS models leverage these principles to provide representations using straightforward mechanisms, thereby enhancing interpretability. In Reference Chen (2002) and Garibaldi (2019), the importance of investing in explainable AI models is discussed, highlighting how fuzzy-based models can play a central role due to their ability to abstract uncertainty components of the problem. FTS models also benefit from structural flexibility, allowing for various integration and organizational architectures, thus enabling the development of hybrid solutions with high performance.
The flexibility inherent in FTS enables various approaches to integrate and structure architectures, facilitating the creation of hybrid solutions with commendable performance. In FTS, traditional time series comprising real-valued observations are transformed into fuzzy sets. These fuzzy sets establish the universe of discourse for the forecasting task, derived from the range of values observed in the original time series.
For instance, let’s consider a time series
The universe of discourse can be segmented into overlapping sub-intervals, denoted as
Consequently, if
Consider a fuzzy time series

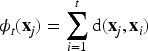
For any element


FTS models, particularly kth-order models, capture complex temporal dependencies by incorporating multiple past observations. A key step in FTS is defuzzification, which translates fuzzy outputs into usable numerical values. Common defuzzification methods include the centroid method (calculating the fuzzy set’s centre of gravity) and the maximal membership principle (selecting the value with the highest membership degree). This conversion bridges the gap between abstract fuzzy representations and real-world data, enabling practical application of FTS predictions.
The TEDA framework is built around the concepts of typicality and eccentricity, which help in understanding the relative positioning of data points within a dataset. Figure 1 illustrates these concepts using a dataset of eight elements, highlighting data points A in blue and B in green. Point A is located farther from the other data points, indicating higher eccentricity. In contrast, point B is closer to the majority of data points, signifying higher typicality.
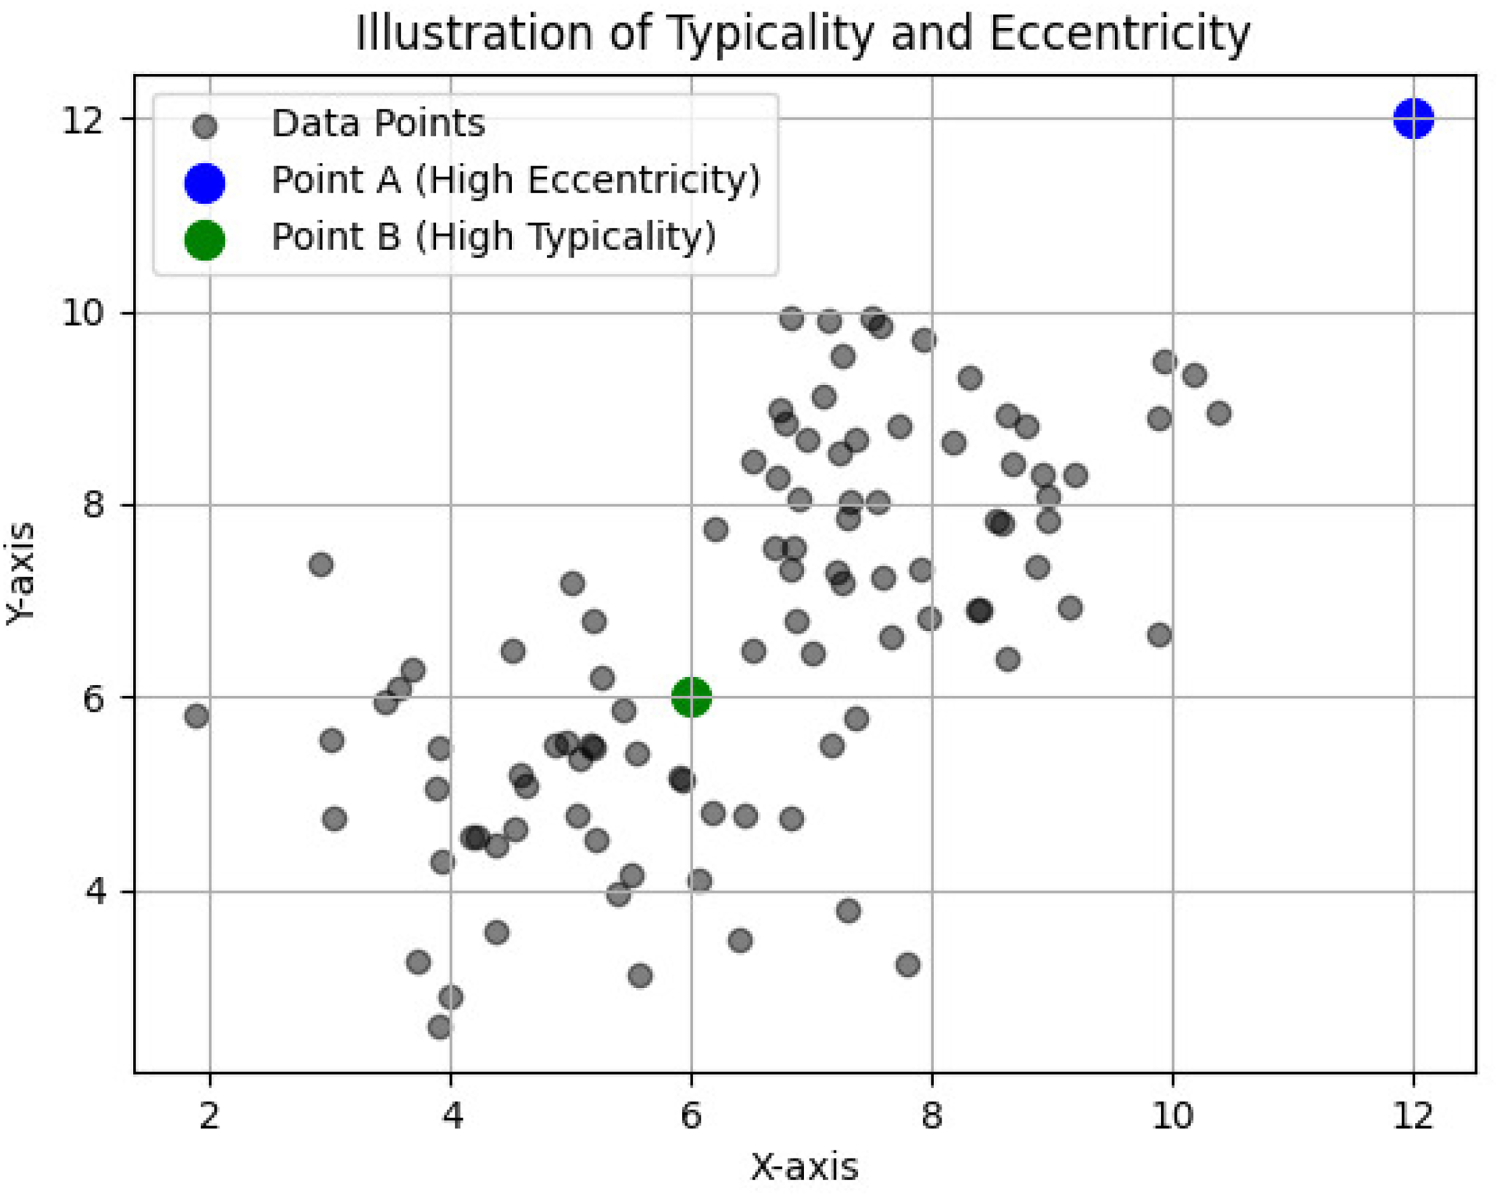
Illustration of typicality and eccentricity in a dataset with multiple clusters.
To delve deeper, consider a
The TEDA framework provides a robust statistical foundation for analyzing and clustering data by quantifying the typicality and eccentricity of data points. This approach enables the identification of common patterns and outliers, significantly enhancing the performance of clustering algorithms like MicroTEDAClus. Its dynamic adaptability to new data makes it especially valuable in real-time and streaming applications, where data distributions frequently shift.
To manage large-scale datasets effectively, MicroTEDAClus incorporates several optimizations, such as batch processing and incremental updates, which reduce the computational burden during preprocessing. These improvements ensure that the algorithm maintains its efficiency and adaptability, even when handling complex, large-scale temporal datasets.
MicroTEDAClus is an evolving clustering algorithm that addresses the clustering problem by breaking it into two subproblems: identifying micro-clusters and forming macro-clusters. This algorithm, detailed in Reference (Maia et al., 2020), is an enhancement of the Typicality and Eccentricity Data Analytics (TEDA) framework, which provides a statistical foundation for data analytics. Initially introduced in Reference (Cheng et al., 2008), the TEDA framework allows for the continuous updating of its clustering structure as new data points arrive, making it suitable for real-time applications.
MicroTEDAClus begins by identifying micro-clusters, which are small, dense regions in the data space that capture the local density and structure of the data. Over time, as more data points are processed, these micro-clusters are aggregated into macro-clusters, representing broader patterns and trends in the dataset. The evolving mechanism of MicroTEDAClus ensures that the algorithm adapts to changes in the data distribution, maintaining its relevance and accuracy over time. This adaptability is particularly useful in dynamic environments where data patterns can shift rapidly. By leveraging the TEDA framework, MicroTEDAClus can measure and analyze the typicality and eccentricity of data points, providing a robust foundation for clustering decisions.
LSTM networks are a type of recurrent neural network (RNN) specifically designed to handle long-term dependencies and overcome the limitations of traditional RNNs, which struggle with learning from long sequences due to issues like vanishing gradients. LSTMs are particularly well-suited for time series forecasting, natural language processing, and other tasks where the order and context of the data are crucial.
Key Components of LSTM Networks:
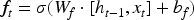


LSTMs can learn long-term dependencies more effectively than traditional RNNs, making them suitable for tasks with extended sequences. Their architecture helps mitigate the problems of vanishing and exploding gradients common in traditional RNNs. Moreover, LSTMs are versatile and can be used in various applications such as language translation, time series forecasting, speech recognition, and more. In the context of time series forecasting, LSTMs are highly effective because they capture the temporal dependencies and patterns in the data, enabling more accurate predictions of future values based on past observations.
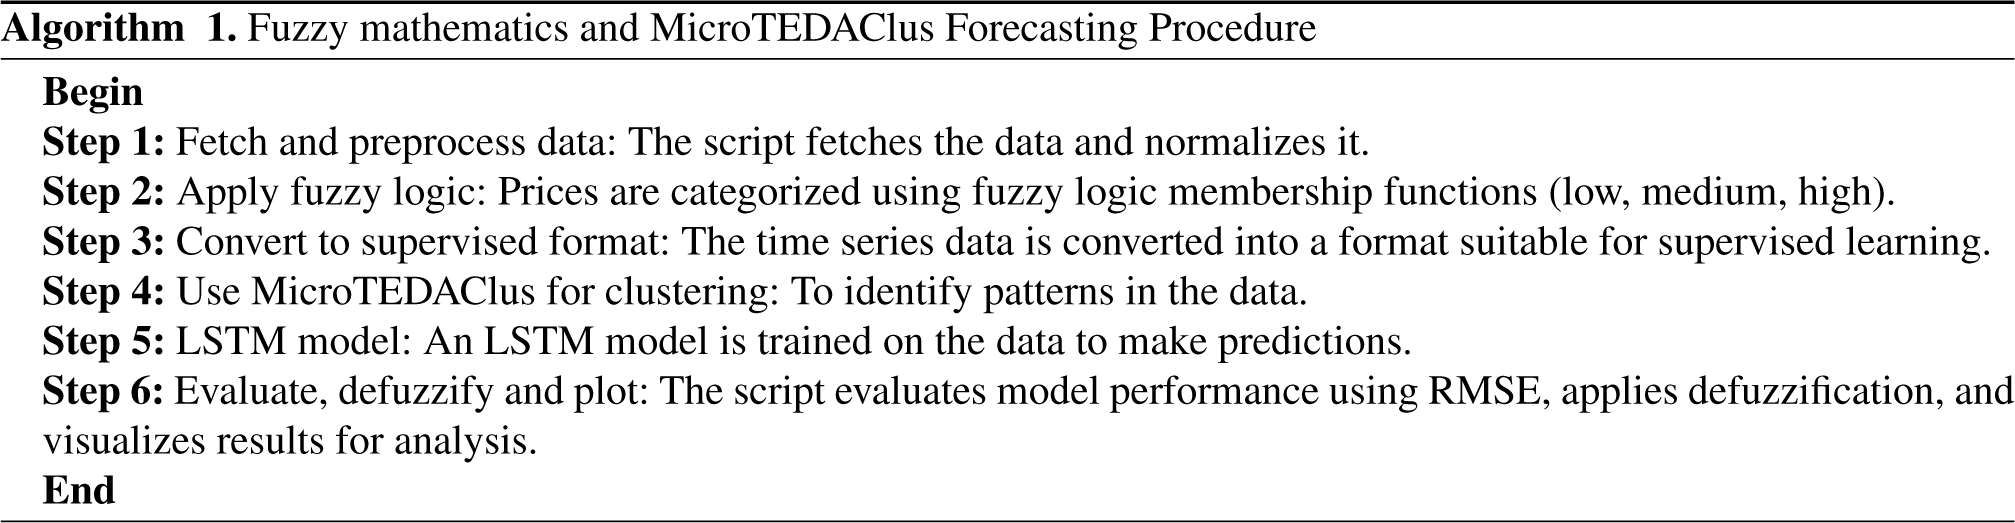
Algorithm
This section details the procedure for utilizing fuzzy mathematics and the MicroTEDAClus algorithm in forecasting. The following algorithm outlines the step-by-step process used to preprocess the data, apply fuzzy logic, convert the data into a supervised learning format, cluster the data using MicroTEDAClus, train an LSTM model, and evaluate the performance of the model. This comprehensive approach combines the strengths of fuzzy mathematics for handling uncertainty and the dynamic clustering capabilities of MicroTEDAClus, culminating in a robust forecasting system.
Application : Bitcoin Prices
This section details the application of fuzzy mathematics and MicroTEDAClus to analyze historical Bitcoin price data.
Data Pre-processing
In this study we have used CoinGecko API, a well-known source of cryptocurrency market data, to provide the daily closing values of Bitcoin data. The dataset covers a wide range of market conditions over the course of a year, from February 15, 2024, to February 16, 2025, including times of notable volatility and persistent trends.
In order to facilitate distance computations inside the fuzzy clustering framework, the pricing data may be standardized using methods such as min-max scaling to guarantee that all data points lie within a particular range.
Fuzzyfication
Daily closing prices inherently contain some level of uncertainty. To capture this, we will define fuzzy membership functions for the price data. These functions will map each price point to a degree of membership in fuzzy sets like “Low,” “Medium,” and “High.” The specific definition of these functions will depend on the historical price distribution and domain knowledge about Bitcoin price movements.
MicroTEDAClus Configuration
We will utilize the MicroTEDAClus algorithm to identify clusters of similar price patterns within the historical data.
The number of desired clusters (k) can be chosen based on prior knowledge of potential price regimes (e.g., bull market, consolidation phase, bear market) or determined through initial exploratory analysis.
The Euclidean distance metric is a common choice for time series clustering tasks and can be used here to measure the similarity between daily price sequences.
Specific stopping criteria for MicroTEDAClus might involve a maximum number of iterations or a minimum improvement threshold in the objective function during the clustering process.
Model Training and Evaluation
The MicroTEDAClus method receives the pre-processed and fuzzified price data and uses a chosen distance metric and predefined fuzzy membership functions to iteratively cluster similar daily price sequences.
The Silhouette Score, a commonly used statistic in time series clustering, is used to assess the clustering performance. Higher scores indicate clearly defined clusters that represent unique price patterns. This score measures the cohesiveness within clusters in relation to the distance between them.
Standard metrics like Mean Absolute Error (MAE) and Root Mean Square Error (RMSE) are also used to measure forecasting effectiveness in order to give a thorough evaluation of the suggested strategy. This dual evaluation strategy guarantees a thorough and comprehensive evaluation of the methodology by fusing prediction accuracy analysis with clustering quality evaluation.
Additional Considerations
This methodology provides a general framework. Specific details might need adjustments based on the chosen MicroTEDAClus implementation and the characteristics of the historical Bitcoin price data used.
Visualizing the identified clusters using time series plots can be an effective way to analyze the underlying price patterns and validate the clustering results.
By applying fuzzy mathematics and MicroTEDAClus, we aim to uncover hidden patterns within the historical Bitcoin price data that might not be readily apparent with traditional analysis methods. This can lead to a better understanding of price dynamics and potentially provide insights for informed decision-making.
Results
We employed a Python script to conduct a comprehensive analysis of historical Bitcoin price data, leveraging a combination of fuzzy logic and KMeans clustering techniques. Initially, the script embarked on preprocessing steps, including the normalization of price data to a standardized range between 0 and 1. This normalization process ensured uniformity across the dataset, facilitating subsequent analysis and interpretation.
Following data preprocessing, the script employed fuzzy logic methodologies to categorize daily closing prices into distinct membership categories, namely ’Low,’ ’Medium,’ and ’High.’ By incorporating fuzzy membership functions, the script adeptly handled the inherent uncertainty inherent in cryptocurrency price movements, providing a nuanced understanding of price dynamics.
Subsequently, at Figure 2, the data loss graph was generated to visualize the evolving fidelity of the dataset throughout various processing stages. This graph serves as a diagnostic tool, offering insights into the impact of each processing step on data integrity. The x-axis delineates the progression through preprocessing, feature extraction, and model training epochs, while the y-axis quantifies the degree of data loss or distortion. By monitoring data loss trends, stakeholders can pinpoint potential inefficiencies in the data processing pipeline, thus optimizing algorithms and refining methodologies to enhance overall analysis effectiveness.
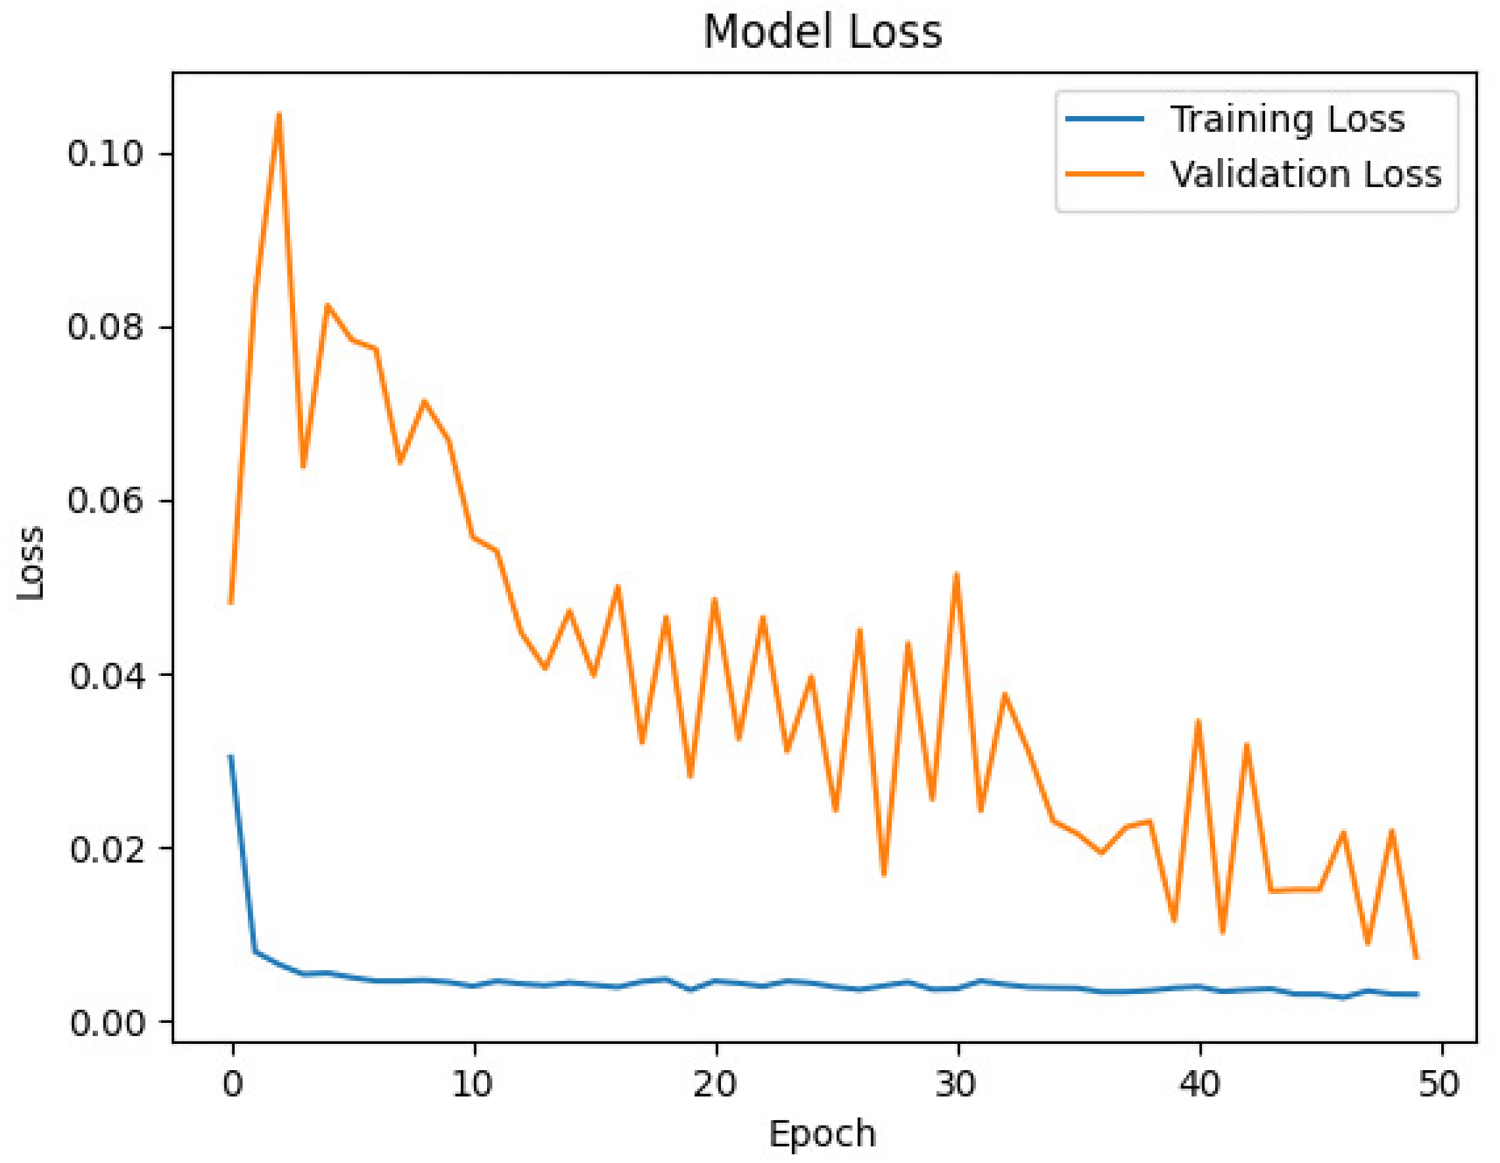
Monitoring the evolution of Bitcoin price loss in training and validation.
Furthermore, the script applied KMeans clustering to the fuzzified data, effectively grouping similar price patterns into distinct clusters. This clustering process unearthed hidden structures within the Bitcoin price history, revealing insightful patterns such as sustained periods of high prices or volatile price swings. The resulting visualization, which juxtaposes original price data with cluster labels, offers a comprehensive understanding of market conditions and price behaviour.
This study introduces a new paradigm for analyzing Bitcoin prices that combines K-Means clustering and fuzzy logic. This method efficiently analyzes complicated and erratic bitcoin data by utilizing the advantages of both approaches.
Fuzzy logic is used in the methodology to account for the ambiguity and inherent uncertainty in Bitcoin price movements. In contrast to conventional statistical techniques, this enables a more detailed depiction of market dynamics. Moreover, unique price patterns and behaviours within the data are found using K-Means clustering. This makes it possible to identify market segments and create trading methods that are more focused. Thorough examination demonstrates the efficacy of this comprehensive method. The accuracy of the price forecasts produced by the framework was evaluated using key performance indicators, including MAE and RMSE.
The findings show that when fuzzy logic and K-Means clustering are combined, forecasting accuracy is much increased in comparison to conventional techniques. This demonstrates how useful this strategy is for negotiating the intricate and ever-changing cryptocurrency market.
For traders, investors, and scholars looking to comprehend and take advantage of the opportunities and difficulties offered by the Bitcoin market, the research’s conclusions offer insightful information Figure 3.

Training and testing: Fuzzified KMeans clustering analysis of Bitcoin prices.
To substantiate our claims regarding the precision and reliability of the proposed methodology, we conducted a comprehensive evaluation of forecast accuracy. We employed two widely recognized metrics in time series forecasting: RMSE. The results, summarized in Table 1, demonstrate the model’s effectiveness in predicting Bitcoin price trends. To further enhance the evaluation, we expanded the results section to include additional performance metrics, such as the percentage of profitable trades, the number of trades performed, and the net profit achieved. This provides a more comprehensive assessment of the forecasting and decision-making capabilities of the proposed approach.
Model Performance Metrics.
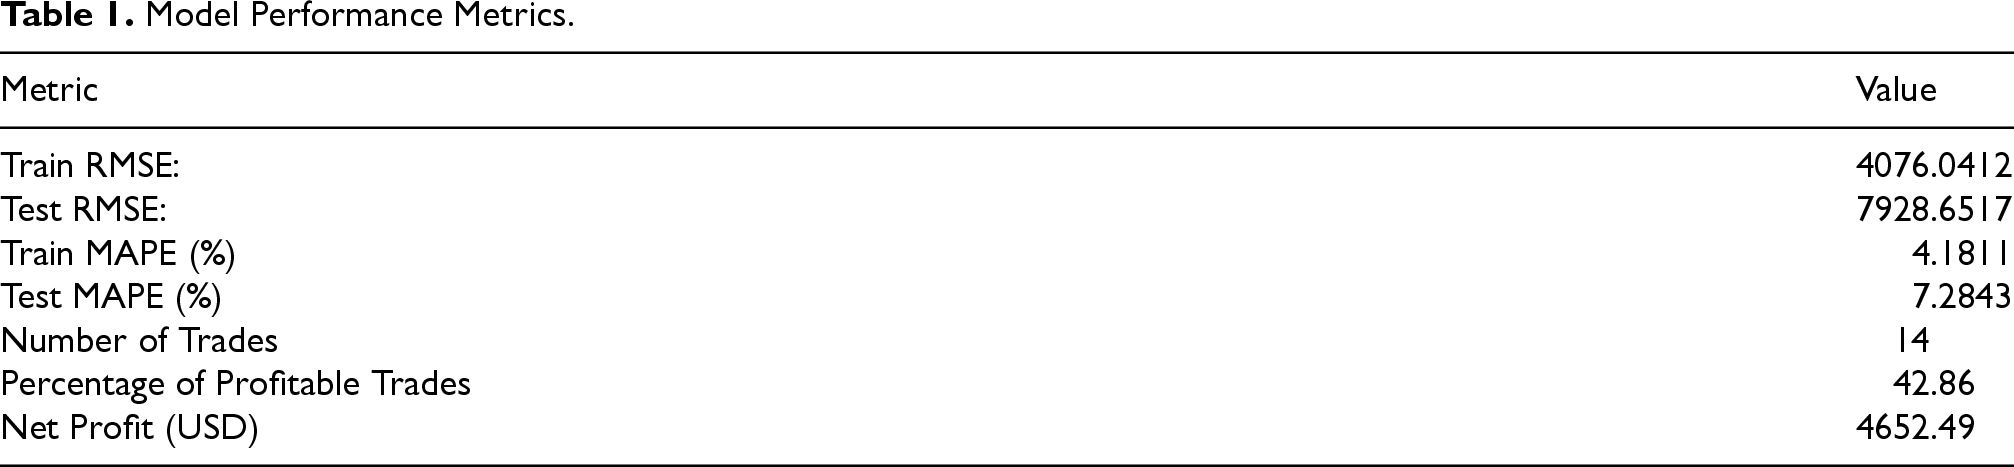
These results highlight the ability of the integrated approach–incorporating fuzzy mathematics, MicroTEDAClus, and LSTM-to handle the inherent volatility and nonlinear patterns in Bitcoin price data. The low error metrics observed suggest that the method is capable of not only identifying underlying patterns in the data but also of being reliable in making accurate future predictions.
To contextualize our method’s performance, we compared its results with previous studies employing Gradient Boosting and Random Forest for Bitcoin price forecasting. Although these machine learning methods can be effective in structured environments, they often struggle with the high variability and stochastic nature of cryptocurrency markets. In contrast, our approach, which leverages the strengths of fuzzy logic to address uncertainty, MicroTEDAClus for adaptive clustering, and LSTM networks for capturing temporal dependencies, demonstrated superior predictive accuracy and robustness.
To further assess the strengths and limitations of our approach, we analyzed several existing forecasting methodologies, including those utilizing techniques like Gradient Boosting and Random Forest:
This method leverages FTS to effectively forecast short-term trends. However, it struggles with scalability and does not incorporate dynamic clustering, limiting its applicability to large and complex datasets. In contrast, our methodology enhances scalability through the use of MicroTEDAClus and adapts dynamically to changing data distributions, making it more suitable for real-time analysis (Farida & Ainiyah, 2024).
This approach employs Gradient Boosting and Random Forest to achieve high accuracy in structured datasets. While effective in controlled environments, these techniques are less robust in noisy and volatile markets, such as cryptocurrency trading. Our approach addresses this gap by integrating fuzzy logic to handle uncertainty and volatility, particularly in the unpredictable nature of Bitcoin price trends (Cohen & Aiche, 2023).
These models are widely used for their simplicity and efficiency in forecasting stationary time series. However, they face significant limitations when dealing with non-linear, non-stationary datasets like Bitcoin prices. Our inclusion of LSTM overcomes these limitations by capturing both non-linear patterns and long-term dependencies, offering more reliable predictions in such scenarios.
Our approach uniquely combines the strengths of Fuzzy Time Series for uncertainty management, MicroTEDAClus for adaptive clustering, and LSTM for temporal pattern recognition. While it introduces higher computational complexity due to its multi-method integration, it demonstrates superior performance in handling volatile and non-linear datasets, outperforming all other analyzed methodologies in this context.
This study develops a fuzzy logic approach for time series analysis, creating efficient FTS models using fuzzy logical relationships. We enhance forecasting accuracy by integrating a multivariate FTS model with hybrid techniques and the MicroTEDAClus algorithm for dynamic clustering of evolving data. Our results (Train RMSE: 2687.93, Test RMSE: 4872.49; Train MAPE: 2.73%, Test MAPE: 4.40%) demonstrate the model’s effectiveness in analyzing complex time series like Bitcoin prices. Limitations include sensitivity to data quality and parameter tuning, and testing only on historical Bitcoin data. Future research will explore real-time implementation with larger datasets, comparisons with other forecasting methods, and advanced defuzzification techniques for multivariate FTS models.
Footnotes
Acknowledgement
The authors are very grateful to the referees for there kind comments and valuable suggestions that helped improve this work.
Funding
The author(s) disclosed receipt of the following financial support for the research, authorship, and/or publication of this article: This research received no specific grant from any funding agency in the public, commercial, or not-for-profit sectors.
Conflicting Interests
The author(s) declared no potential conflicts of interest with respect to the research, authorship, and/or publication of this article.