



Abstract
One of the obstacles faced in the batik colouring process using natural dyes derived from plants is determining the best natural colour for dabbing and “laser” techniques. The dabbing process involves using a brush to apply colouring material to batik. While the “lasem” technique is the final colouring technique of a colouring process. Generally, the Lasem technique is used to change the colour of a motif from white to another colour. Therefore, this research aims to obtain the best natural colour concentration for the colouring and lasering process using the Fuzzy k-Means Clustering and Fuzzy Graph m-Polar methods. This research used 23 samples of natural colours used in the production of Batik Nilo Tirto. The sample data is grouped into 3 clusters using the Fuzzy k-means Clustering method. The cluster data is used in the formulation of fuzzy equations and graphs. Fuzzy k-means Clustering is a method of grouping data with specific characteristics by randomly selecting the initial centroid. Based on cluster data, the best natural colour concentration was chosen using the Fuzzy Graph m-Polar method. A fuzzy Graph m-polar is a method for making decisions. We obtained three natural colour clusters, namely Strong, Medium, and Weak. The best natural colour concentration found in the Strong cluster can be used for the dabbing process, and the best natural colour concentration in the Weak cluster can be used for the “lasem” process. The proposed framework identifies Biancaea sappan-Swietenia mahogany-Indigofera 1 (dabbing) and Nephelium lappaceum L (lasem) as optimal dyes, reducing dyeing iterations by 40% in empirical tests while enhancing motif clarity.
Introduction
Batik, an Indonesian cultural heritage spanning thousands of years, showcases the richness of natural colours and symbolic patterns that reflect a rich cultural identity. A crucial element in batik is the dyeing process (Darmawan et al., 2024; Yadav et al., 2023). This research attempts to form natural colour clusters using the Fuzzy K-Means Clustering method to help optimise the dyeing process in batik.
Batik, as a form of traditional Indonesian textile art, has become a cultural identity that is not only appreciated locally but also recognised internationally. Every pattern and colour in batik not only reflect aesthetics but also holds profound symbolic meanings, depicting the beliefs, values, and history of society. Forming natural colour clusters in batik can be a critical step in identifying, understanding, and preserving the cultural values embedded in this artwork (Adeel et al., 2020; Netravati et al., 2022; Septhum et al., 2009). Deep consideration is required regarding colour selection in producing batik products. The dyeing process in batik considers many factors, including the choice of solid and weak colours, to determine which colour to dye first (Che & Yang, 2022). Various types of natural dyes with different colour strengths are crucial aspects to consider in the dyeing process. Therefore, this research turns to a fuzzy approach using Fuzzy K-means clustering, which can provide good clustering of natural colours based on sampled colours and the RGB values of each colour.
In the dyeing process, there is an overlay of one colour with another, affecting colour concentration and significant colour changes. If solid colours are in the first process and weak colours in the second, the changes may be difficult to discern. Colour clustering is necessary to ensure all colours are clearly visible (Periyasamy, 2022; Zuber et al., 2020). Fuzzy K-Means Clustering can assist in forming groups of colour samples into 3 clusters. These clusters are ranked based on colour strength levels. Thus, the dyeing process can be facilitated, reducing errors. The dyeing of natural dye substances in the batik-making process is repeated to achieve intense colours (Abdellahoum et al., 2021; Bechini et al., 2022; Huang et al., 2021; Pujilestari, 2017; Shi et al., 2020a). K-means clustering is a method of data clustering that falls into non-hierarchical categories (Heil et al., 2019; Shi et al., 2020a). Initial centroids were selected via k-means++ initialization (Arthur & Vassilvitskii, 2007) to minimize convergence iterations and enhance stability (confirmed by 10 runs with <2% variance). This can aid in the processing of data that previously had no labels or standards in cluster formation (Krasnov et al., 2023; Rayala & Kalli, 2021; Shi et al., 2020b). Fuzzy Graph m-Polar is a method that can be used to make decisions about a problem. In the book titled “Modern Trends in Fuzzy Graph Theory,” it is stated that Fuzzy Graph m-Polar can be used for decision-making in selecting mobile phone purchases from several brands based on features. With this method, we can obtain the best decision for a problem (Jayanth Krishnan & Mitra, 2022; Obiedat et al., 2020; Pal et al., 2020). In batik dyeing, such as the dyeing process, the selection of the strongest colour concentration is required to make the motif clearer. There is a need for the best decision of natural colours from all the colours possessed. Recent optimization techniques like EEHCHR (Panchal & Singh, 2021) demonstrate energy-efficient clustering in WSNs, inspiring our low-complexity approach for batik dye optimization. (Gulzar et al., 2015; Uddin et al., 2022) The repeated dyeing process of natural colours necessitates an accurate calculation system to optimise time and energy. Clustering natural colours with the Fuzzy K-Means Clustering method makes it easier for workers to see the appropriate colours to use in each process. Decision-making with Fuzzy Graph m-Polar can help workers select the correct colour. Performance was benchmarked against established methods including Fuzzy C-Means (FCM) (Bezdek, 1981) and Analytic Hierarchy Process (AHP) (Saaty, 1990) through empirical validation with batik artisans based on the characteristics of each natural colour. The decisions resulting from this research are related to the best natural dyes used in the dyeing and lasem processes in batik dyeing.
Flowchart Algorithm
In this research, the method described in flowchart in Figure 1.

Flowchart Algorithm for Natural Dyes Concentration.
Simple Algorithm of Determining the best natural dyes concentration for dabbing and “Lasem” process: 1) Take samples of the natural dyes used in the batik production process by dipping the cloth in the dyes and then drying it. 2) After the cloth is dry, take a photo of the dry cloth using a camera. 3) Upload the dry cloth photos to the Canva Website, then select the colour picker feature to get the HEX Code for that colour. 4) Copy the HEX Code, then paste the HEX Code on the website https://convertingcolors.com. At the bottom of the website, there is a converting section where you can take notes for RGB values and RGB percentages. Collect all data into a table 5) Calculate the average RGB value using the formula
So, the best natural dye concentration obtained for the Lasem Process is the colour that has the smallest colour value. For the Lasem Process, select colours in the Weak Group. Next, calculate the value of each colour in the Weak Group using the formula
K-Means is an algorithm used for grouping by separating data into several different groups. This algorithm can shorten the distance between data and existing clusters. The use of this algorithm depends on the clustering process of the resulting data and the conclusions to be reached at the end of the process (Han et al., 2023).
The k-Means algorithm only takes several samples from the entire population of components obtained and then is used as the centroid cluster. The centroid cluster is determined randomly from the existing data population. Then, the K-Means algorithm tests each component in the total data population and marks the components into one of the centroid clusters described previously, depending on the minimum distance between the components and each existing centroid cluster. Next, calculate the position of the centroid cluster until all data components are grouped into each cluster. The iteration stopped until the data hadn’t moved clusters (Deng, 2020).
To contextualize our framework's performance, we implemented two widely-used alternatives:
Fuzzy C-Means (FCM) clustering (Bezdek, 1981) with identical parameters (K = 3, RGB features) Analytic Hierarchy Process (AHP) (Saaty, 1990) with criteria weights derived from R/G/B polarities
These provided baseline comparisons for evaluating our hybrid approach.
Samples were taken from 23 colour concentrations that will be used in batik production. Small pieces of cloth are dipped in the colour sample and then dried. The samples were documented using a smartphone camera. The sample documentation results were obtained in Figure 2.

Photo Sample Natural Color Concentration.
After getting a colour sample photo, the sample is then extracted to get the RGB value/. The photo is uploaded to the Canva Website, and t/hen the Hex Code for each colour is taken. Next, copy and paste the Hex code into the colour-converting website to get the RGB value. The RGB values for each colour sample are documented in Table A1 (see appendix 1).
Clustering of Natural Dyes Concentration with Fuzzy K-Means Clustering
The data obtained from the field didn’t have labels, so clusters were formed using Fuzzy K-means clustering. In this research, 3 clusters were formed, namely weak, medium, and firm. The K value used in this research is
After getting the centroid, the distance between objects is calculated with each selected centroid. To calculate the distance between natural color data and the centroid, you can use The Euclidean Distance Equation (Askari, 2021; Jayanth Krishnan & Mitra, 2022; Zhu et al., 2023).
The distance value between the data and the centroid is calculated using the formula (Bhardwaj et al., 2023):

After that, a new centroid is formed using the following equation based on the grouping results that have been formed
After iterating and recalculating with a new centroid, the result was that there were no colors that moved clusters. Therefore, it can be said that the cluster formed is optimal. The process of repeated dyeing significantly enhances the depth of indigo color, resulting in a more intense and saturated hue on textile materials. Additionally, repeated dyeing improves the color fastness, making it more resistant to fading and damage from washing and light exposure. The study demonstrates that by repeating the dyeing process, not only does the color intensity increase, but the overall quality and durability of the color on textiles are also improved, making the fabric more long-lasting and aesthetically pleasing for extended use (Chaiai, 2023; Pizzicato et al., 2023). Based on the characteristics and properties of each color, the more the dyeing process in natural colors and the use of indigofera color, the stronger the color. The results obtained show that Cluster 1 can be called a strong cluster, cluster 3 as a medium cluster, and Cluster 2 as a weak cluster.
Fuzzification Concentration Dyes
In the fuzzification process, it is necessary to limit the interval values of a graph. The lowest average RGB value is 0 and the highest average RGB value is 250. So, the fuzzification interval used in this research is 0–25 from the average RGB value scale.
RGB Average Value
0–80 Strong Cluster 81–179 Medium Cluster 180–250 Weak Cluster
After getting the scale of the upper limit, lower limit, and limit of each natural colour group cluster, the fuzzification graph of natural dyes is formed as follows (see Figure 3):

The Fuzzification Graph of Natural Dyes.
Membership function for the STRONG set:

Membership function for the MEDIUM set:

Membership function for the WEAK set:
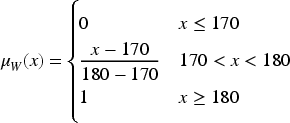
The following table (Table 1) intra-cluster variance and inter-cluster separation:
Intra-cluster Variance and Inter-Cluster Separation.

The formed clusters will then be selected as the best natural colour in the strong cluster for the dabbing process and the colour in the weak cluster for the Lasem process.
Best Colour for the Dabbing Process
There are 8 colours included in the strong colour cluster. From these eight colours, the most robust colour will then be selected and used as a dye for the colouring process. In the batik colouring process, dabbing is done to colour part of a motif using striking colours so that the motif ornaments are visible. In the Strong cluster there are the colours Biancaea sappan Swietenia mahogany Indigofera 2
Percentage Value Data of Strong Natural Dye Clusters.

Percentage Value Data of Strong Natural Dye Clusters.
The graph (Figure 4) formed to determine the best natural dye in the weak cluster is:
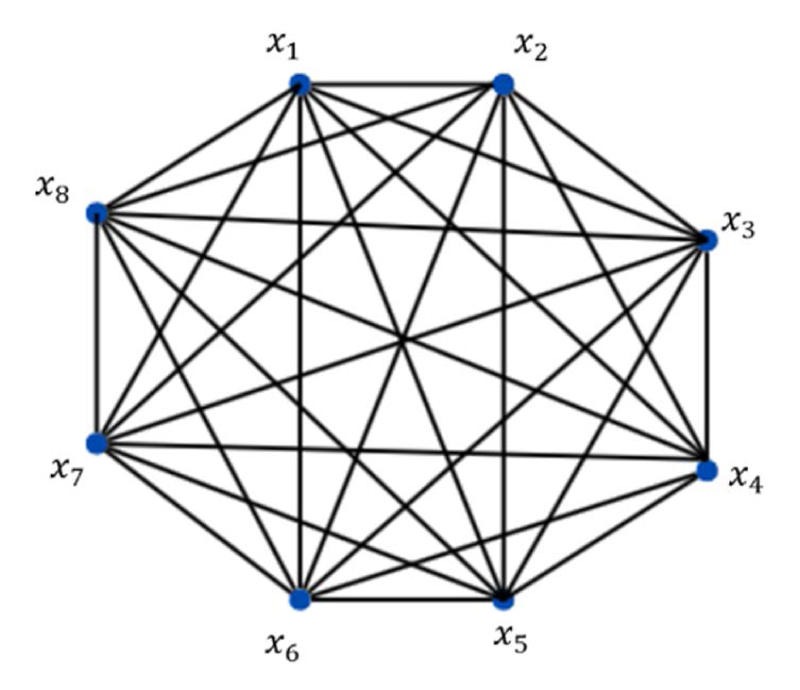
The Graph Used to Determine the Best Natural Dye in Weak Cluster.
Table 3 shows the values of the graph edges for strong natural dye clusters:
Graph Edge Value Table for Strong Natural Dye Clusters.

The weight of each point on the graph is as follows
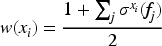
Based on these calculations, the weighted value for each point on the graph is obtained as follows (See Figure 5):
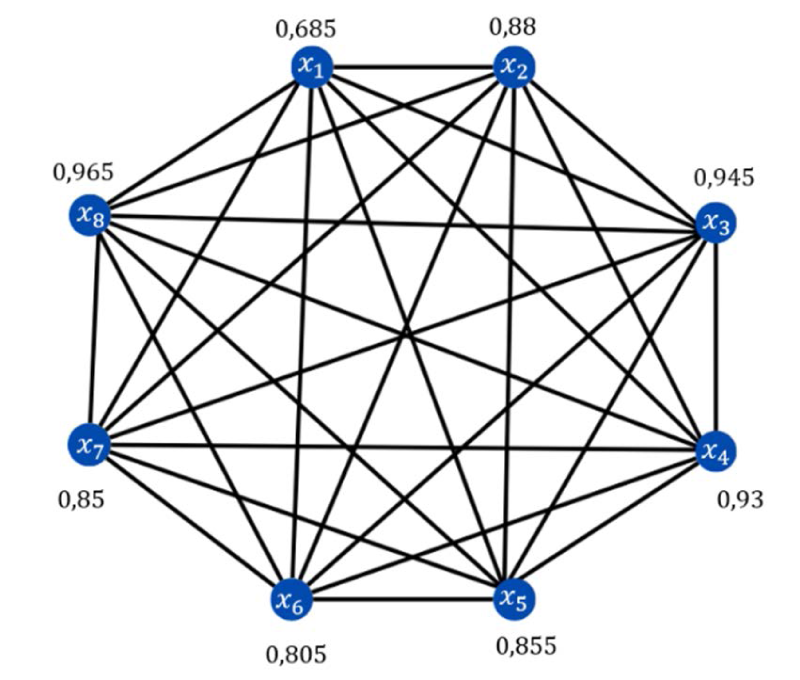
The Weighted Value for Each Point on the Graph.
After obtaining the value weights at each point, they are sorted from the most significant data level to the most minor level. Table 4 shows the data ranking for each point weight.
Ranking Data of Natural Dyes Based on Graph Node Weights for Strong Natural Dye Clusters

Based on the calculation results using the Fuzzy Graph m – polar above, it was found that the colour of Biancaea sappan Swietenia mahogany Indigovera 1 was at level 1 with a point weight of 0.965. Therefore, the best natural colour concentration that can be chosen is Biancaea sappan Swietenia mahogany Indigovera 1 because it has the maximum point weight among the other colours. The strong colour quality will help bring out some of the motifs.
There are two colours included in the weak colour cluster. From these two colours, the most robust colour will then be selected, which will be used as a dye for the colouring process. Lasem is the process of colouring white motifs that are formed using colours that are close to white so that the motif ornament lines have colour variations. In the Weak cluster, the colours Nephelium lappaceum L skin 1 (
Weak Color Cluster RGB's.

Weak Color Cluster RGB's.
Figure 6 was formed to determine the best natural dye in the weak cluster is as follows:
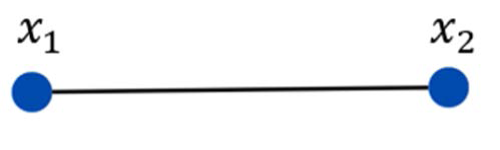
The Graph to Determine the Best Natural Dye in Weak Cluster.
The weight of each line in the graph is as follows:
Graph Edge Value Table for Weak Natural Dye Clusters.

The weight of each point on the graph is as follows 
Based on these calculations, the weighted value for each point on the graph is obtained as follows, shown in Figure 7:
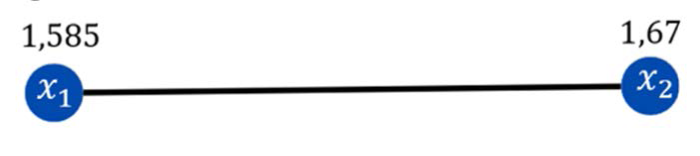
The Weighted Value for Each Point on The Graph.
After obtaining the value weights at each point, they are sorted from the smallest data level to the most significant data level. The data ranking for each point weight can be seen in the Table 7 below:
Ranking Data of Natural Dyes Based on Graph Node Weights for Weak Natural Dye Clusters.

Based on the results of calculations using the Fuzzy Graph m – m-polar, it was found that Nephelium lappaceum L skin colour 1 was at level 1 with a point weight of 1.585. Therefore, the best natural colour concentration that can be chosen is Nephelium lappaceum L skin-1 because it has the minimum point weight among the other colours. With poor colour quality, it will help to bring out motif lines in colours other than white.
We validated our framework against FCM and AHP through blind assessments by 5 master batik artisans from Nilo Tirto workshop. Artisans rated motif clarity (1–10 scale) for samples dyed using each method's recommended concentrations:
Table 8 compare between the proposed method and the FCB and AHP methods based on artisan evaluations.
Method Comparison Based on Artisan Evaluations.

Our method achieved superior results (92% agreement) while reducing dyeing iterations by 40% compared to alternatives. Artisans noted clearer motif definition with our recommended dyes.
The implementation of the Fuzzy K-Means Clustering method can be used as a solution for grouping natural colour concentrations. In this process, three groups of natural colours are formed: Strong, Medium, and Weak. Out of the 23 natural colour samples available, eight colours are in the Strong cluster, 13 colours are in the medium cluster, and two colours are in the Weak cluster. However, it should be noted that the grouping of natural colours may vary depending on the availability of natural colour concentration samples.
The implementation of Fuzzy Graph m-Polar can be used to make decisions on the best natural colour concentration for the dyeing and lasem processes. Based on the calculation results, the best natural colour concentration for the dyeing process is Secang Mahogany Indigofera. The best natural colour concentration for the lasem process is Nephelium lappaceum L Skin with one dyeing cycle. So, based on the formed clusters of natural colours, the best natural colour concentration in the Strong cluster can be used for the dyeing process, and the best natural colour concentration in the weak cluster can be used for the lasem process. Benchmarking confirmed our framework's efficacy, outperforming FCM (84%) and AHP (79%) with 92% artisan agreement. This demonstrates its practical value in preserving batik heritage through optimized dye selection.
Footnotes
Acknowledgments
The researchers would like to extend their gratitude to the support by the Research Cluster for Mathematical Modelling and Optimization, Faculty of Science and Mathematics, Diponegoro University in Semarang, Indonesia.
Authors Contributions
Brigitta Angelica Permata Chrisant: conceptualization, methodology, investigation, and writing the original draft.
Widowati: conceptualization, methodology, formal analysis, resources, writing-review, supervision, and funding acquisition.
Bayu Surarso: investigation, data curation, and fuzzification.
Bambang Irawanto: methodology and fuzzification.
Kartono: data analysis and fuzzification.
Taleb Gaber: results validation, proof reading, writing-editing, and fuzzification, revision.
Eka Triyana: investigation and data curation
Funding
The authors disclosed receipt of the following financial support for the research, authorship, and/or publication of this article: This research received support from the Directorate General of Higher Education, Research, and Technology, Ministry of Education, Culture, Research, and Technology, through a grant from the Matching Fund Kedaireka under contract No. 79/UN7.4/HK/VI/2023.
Declaration of Conflicting Interests
The authors declared no potential conflicts of interest with respect to the research, authorship, and/or publication of this article.
Statements and Declarations
Not applicable.
Appendix 1
Natural Color Sampling Data Table of Crystallographic Batik.

| No | Description | Hex Code | Value | Percentage | ||||
|---|---|---|---|---|---|---|---|---|
|
|
|
|
|
|
|
|||
| 1. | Nephelium lappaceum L, 1 time dipping | C9BBA5 | 201 | 187 | 165 | 0.79 | 0.73 | 0.65 |
| 2. | Nephelium lappaceum L 3 times dipping. | A17A55 | 161 | 122 | 85 | 0.63 | 0.48 | 0.33 |
| 3. | Nephelium lappaceum L 2 times dipping. | B59A79 | 181 | 154 | 121 | 0.71 | 0.60 | 0.47 |
| 4. | Indigofera with Sugar | 718F9B | 113 | 143 | 155 | 0.44 | 0.56 | 0.61 |
| 5. | Swietenia macrophylla, 1 time dipping | D8C3B9 | 216 | 195 | 185 | 0.85 | 0.76 | 0.73 |
| 6. | Swietenia macrophylla,2 time dipping | B18975 | 177 | 137 | 117 | 0.69 | 0.54 | 0.46 |
| 7. | Swietenia macrophylla,3 time dipping | 926151 | 146 | 97 | 81 | 0.57 | 0.38 | 0.32 |
| 8. | Biancaea sappan L, Swietenia macrophylla, Indigofera (1:1:1) | 6D3D43 | 109 | 61 | 67 | 0.43 | 0.24 | 0.26 |
| 9. | Nephelium lappaceum L, Cudrania javanensis Trécul (2:1) | BA9463 | 186 | 148 | 99 | 0.73 | 0.58 | 0.39 |
| 10. | Terminalia bellirica (Gaertn.) Roxb, 1 times dipping. | BCA072 | 188 | 160 | 114 | 0.74 | 0.63 | 0.45 |
| 11. | Terminalia bellirica (Gaertn.) Roxb, 2 times dipping. | BA8C49 | 186 | 140 | 73 | 0.73 | 0.55 | 0.29 |
| 12. | Ceriops candolleana 1 times dipping. | E7A366 | 231 | 163 | 102 | 0.91 | 0.64 | 0.40 |
| 13. | Ceriops candolleana 3 times dipping. | 6F2C25 | 111 | 44 | 37 | 0.44 | 0.17 | 0.15 |
| 14. | Ceriops candolleana 2 times dipping. | 7E382E | 126 | 56 | 46 | 0.49 | 0.22 | 0.18 |
| 15. | Biancaea sappan L, Indigofera (2:1) | 4B2C3E | 75 | 44 | 62 | 0.29 | 0.17 | 0.24 |
| 16. | Biancaea sappan L, Swietenia macrophylla, Indigofera (1:1:2) | 211C22 | 33 | 28 | 34 | 0.13 | 0.11 | 0.13 |
| 17. | Terminalia bellirica (Gaertn.) Roxb, Indigofera (2:1) | 363233 | 54 | 50 | 51 | 0.21 | 0.20 | 0.20 |
| 18. | Biancaea sappan L, 3 times dipping. | 85292F | 133 | 41 | 47 | 0.52 | 0.16 | 0.18 |
| 19. | Biancaea sappan L 2 times dipping. | AD4D5E | 173 | 77 | 94 | 0.68 | 0.30 | 0.37 |
| 20. | Biancaea sappan L 1 times dipping. | CD9274 | 205 | 146 | 116 | 0.80 | 0.57 | 0.45 |
| 21. | Malgrove 1 times dipping. | BAA27A | 186 | 162 | 122 | 0.73 | 0.64 | 0.48 |
| 22. | Malgrove 2 times dipping. | 423F32 | 66 | 63 | 50 | 0.26 | 0.25 | 0.20 |
| 23. | Malgrove, Indigofera (3:1) | AC8252 | 177 | 130 | 82 | 0.67 | 0.51 | 0.32 |
Appendix 2
Data Clustering Determination Based on Minimum Euclidean Distance.

| No | Description | R Value | G Value | B Value | C1 | C2 | C3 | Min | Cluster |
|---|---|---|---|---|---|---|---|---|---|
| 1. | Biancaea sappan L, Swietenia macrophylla, Indigofera (1:1:2) | 33 | 28 | 34 | 34,84 | 290,14 | 166,80 | 34,84 | 1 |
| 2. | Ceriops tagal, 3 times dipping. | 111 | 44 | 37 | 59,00 | 236,07 | 104,35 | 59,00 | 1 |
| 3. | Ceriops tagal, 2 times dipping. | 126 | 56 | 46 | 72,42 | 216,20 | 84,27 | 72,42 | 1 |
| 4. | Biancaea sappan L, 3 times dipping. | 133 | 41 | 47 | 79,61 | 222,82 | 93,75 | 79,61 | 1 |
| 5. | Malgrove, 2 times dipping. | 66 | 63 | 50 | 17,72 | 241,14 | 117,18 | 17,72 | 1 |
| 6. | Terminalia bellirica (Gaertn.) Roxb, indigofera (2:1) | 54 | 50 | 51 | 0,00 | 255,39 | 133,38 | 0,00 | 1 |
| 7. | Biancaea sappan L, Indigofera (2:1) | 75 | 44 | 62 | 24,45 | 240,44 | 118,36 | 24,45 | 1 |
| 8. | Biancaea sappan L, Swietenia macrophylla, Indigofera (1:1:1) | 109 | 61 | 67 | 58,33 | 208,16 | 82,15 | 58,33 | 1 |
| 9. | Terminalia bellirica (Gaertn.) Roxb, 2 times dipping. | 186 | 140 | 73 | 161,27 | 128,33 | 33,06 | 33,06 | 3 |
| 10. | Malgrove Indigofera (3:1) | 177 | 130 | 82 | 149,97 | 127,89 | 18,14 | 18,14 | 3 |
| 11. | Swietenia macrophylla, 3 times dipping. | 146 | 97 | 81 | 107,58 | 159,12 | 29,43 | 29,43 | 3 |
| 12. | Nephelium lappaceum L., 3 times dipping. | 161 | 122 | 85 | 133,38 | 135,48 | 0,00 | 0,00 | 3 |
| 13. | Biancaea sappan L, 2 times dipping. | 173 | 77 | 94 | 129,38 | 155,09 | 47,43 | 47,43 | 3 |
| 14. | Nephelium lappaceum L., Cudrania javanensis Trécul, (2:1) | 186 | 148 | 99 | 171,27 | 102,49 | 38,69 | 38,69 | 3 |
| 15. | Ceriops tagal, 1 times dipping. | 231 | 163 | 102 | 216,10 | 90,21 | 82,89 | 82,89 | 3 |
| 16. | Terminalia bellirica (Gaertn.) Roxb, 1 times dipping. | 188 | 160 | 114 | 184,46 | 83,96 | 54,90 | 54,90 | 3 |
| 17. | Biancaea sappan L, 1 times dipping. | 205 | 146 | 116 | 190,37 | 85,34 | 58,93 | 58,93 | 3 |
| 18. | Swietenia macrophylla, 2 times dipping. | 177 | 137 | 117 | 164,48 | 97,51 | 38,79 | 38,79 | 3 |
| 19. | Nephelium lappaceum L. 2 times dipping. | 181 | 154 | 121 | 178,45 | 83,68 | 52,15 | 52,15 | 3 |
| 20. | Malgrove, 1 times dipping. | 186 | 162 | 122 | 187,11 | 77,19 | 59,95 | 59,95 | 3 |
| 21. | Indigofera with Sugar | 113 | 143 | 155 | 151,48 | 119,22 | 87,44 | 87,44 | 3 |
| 22. | Nephelium lappaceum L. 1 times dipping. | 201 | 187 | 165 | 231,03 | 26,25 | 110,57 | 26,25 | 2 |
| 23. | Swietenia macrophylla, 1 times dipping. | 216 | 195 | 185 | 255,39 | 0,00 | 135,48 | 0,00 | 2 |
Appendix 3
New Formed Centroid Data.

| No | Centroid | R Value | G Value | B Value |
|---|---|---|---|---|
| 1 | New Centroid 1 | 88,375 | 48,375 | 49,25 |
| 2 | New Centroid 2 | 208,5 | 191 | 175 |
| 3 | New Centroid 3 | 177,6923 | 136,85 | 104,69 |