



Abstract
Objectives:
This study aims to explore the impacts of visibility and accessibility of alcohol gel-based hand sanitizer dispensers (HSDs) on healthcare workers’ hand-hygiene (HH) behaviors.
Background:
Despite the importance of HH in reducing nosocomial infection, few empirical studies have quantitatively investigated the impacts of unit shape and size, and the resulted visibility and accessibility on HH, due to the lack of consistent methods to measure and evaluate visibility.
Methods:
The research was developed as a cross-sectional comparative study of two nursing units (Units A and B) with similar patient acuity and nursing care model but different shape and layout. The study applied quantitative research methods including visibility and accessibility analysis using space syntax, 1-week on-site observation, and secondary data analysis on HH compliance rates.
Results:
Results indicate that the unit with higher visibility and accessibility is associated with higher HH frequencies. Unit B has significantly higher visibility of HSDs, p < .001, t(60) = 4.615, and significantly higher frequency of HH activity occurrences, 5.17% versus 1.52%; p < .001, t(16.750) = 5.332, than Unit A, even though Unit B has lower HSD to bed ratio (0.708:1 vs. 1.375:1). The linear regression models also demonstrate that visibility and accessibility of HSDs are significant predictors of HH behavior.
Conclusions:
Overall, this exploratory study identified the importance of visibility of HSDs to improve the chances of HH. It also points out the impacts of nursing unit typology on the visibility of HSDs and in turn affects HH behavior.
Background
In healthcare settings, 5%–10% of patients admitted to hospitals acquire one or more healthcare-associated infections (HAI; Backman et al., 2008). Low hand-hygiene compliance (HHC) of healthcare workers (HCWs) is a key factor contributing to HAI (Joseph & Rashid, 2007). Improved hand hygiene (HH) alone can reduce the infection rate by up to 40% (Backman et al., 2008). The importance of HH is even more prominent with the outbreak of the current COVID-19 pandemic.
Types of HH Approaches
Two common ways for HH are handwashing using soap water and cleaning hands using alcohol-based hand rubbing solutions (ABHRS). The popularity of ABHRS has continued to grow, as ABHRS are more accessible and efficient for the HCWs when compared to the water-based sinks (Cure & Van Enk, 2015). The introduction of ABHRS has shown to be effective in decreasing infection rates (Fendler et al., 2002). Bischoff and colleagues (2000) revealed that the introduction of ABHRS in a medical intensive care unit (ICU) increased the handwashing rate to 19% before contact and 41% after patient care. However, most current studies focused on evaluating the locations and visibility of sinks on HH, while relatively fewer studies investigated the placement of ABHRS and the impacts on HH behaviors (Cloutman-Green et al., 2014; Deyneko et al., 2016). Hence, we focus on exploring the HCW’s HH behavior concerning the location of alcohol-based hand sanitizer dispensers (HSDs) in the nursing unit environment.
Literature Review
Environmental Factors That Impact HHC
Despite the importance of HH, the HHC rate among the HCWs remains lower than the standards (Nevo et al., 2010; Stackelroth et al., 2015). The HHC rate is typically measured by dividing the number of observed HH actions performed when an opportunity occurs by the total number of opportunities (World Health Organization, 2009). Boyce and Pittet (2002) have reported the mean baseline HHC rates as 40%. Increased workload, understaffing, and lack of appropriate infrastructure and equipment to enable HH performance (Allegranzi & Pittet, 2009) were some of the reasons for poor HH behavior of the healthcare professionals. Besides the efforts to balance staff workload, improve the role model effects of physicians and senior nurses (Muto et al., 2000), and improve awareness through education and campaigns (Randle et al., 2006), several studies have also investigated the role of the physical environment on HH behaviors.
Studies have shown that the availability of HSDs could affect HH. Kaplan and McGuckin (1986) found a higher number of handwashing behaviors in the ICU with a higher sink-to-bed ratio. Similarly, Boyce (2001) identified that the low ratio of patient bed to HH sinks and HSDs was a major obstruction for HCWs’ HHC. However, multiple studies showed that increasing the number of sinks or alcohol-gel hand sanitizers alone could not improve HCWs’ HHC (Boyce, 2001; Trick et al., 2007; Vernon et al., 2003). Some additional barriers to HCWs’ HHC include the lack of standardization of the design and appearance of HH products (Stackelroth et al., 2015) and HSDs with poor human ergonomics considerations. For example, inconvenient location of HSDs (including sinks and ABHRS), the complexity of the access to HSDs and long distance between HSDs (Anderson et al., 2010; Joseph & Rashid, 2007), poor visibility (Anderson et al., 2010; Suresh & Cahill, 2007), and poor accessibility of HSDs (Anderson et al., 2010; Deyneko et al., 2016; Suresh & Cahill, 2007) can present a challenge to HCWs’ HHC.
In brief, many factors can discourage HCWs’ HHC but unavailability, poor visibility, poor accessibility, and wide spatial separation of HSDs are the most mentioned obstacles that hinder HCWs’ HHC (Joseph & Rashid, 2007).
Impacts of Visibility and Accessibility on HH
Some studies have specifically evaluated the impacts of visual cues and visibility of HSD on HCWs’ HHC and found that increasing visual cues and visibility of HSDs could improve HCWs’ HHC (Nevo et al., 2010; VanSteelandt et al., 2015). Nevo et al. (2010) evaluated the efficacy of individual HH triggers of HCWs by conducting observations of 75 physicians and 75 nurses doing simulated, standardized patient care tasks in a patient room in a medical–surgical unit. They found that relocating HSDs to fit in direct line of sight could improve the HHC rate by 60% comparing to the baseline condition (p < .01). The visibility of HSDs was determined based on whether HSDs were within line of sight as HCWs entered the patient room; however, the visibility of HSDs related to the entire nursing unit was not considered in this study. Besides, no quantitative measure of visibility was applied in this study.
Space syntax and impacts of visibility on HH
Space syntax provides a theory of space and a set of analytical techniques that can quantitatively measure the visibility of spatial configurations (Hillier & Hanson, 1984). An important measure of space syntax analysis is visual integration, which is a global metric that represents the overall inter-visibility of a layout (Haq & Luo, 2012). Several studies have linked integration with human behaviors such as movement, interactions, and awareness in healthcare facilities (Cai & Zimring, 2012; Sadek & Shepley, 2016). Spaces with higher integration values represent higher visibility or accessibility from the rest of the unit and are associated with higher chances of movement and awareness.
A few studies have developed or applied quantitative measures of visibility and accessibility based on space syntax theory. For instance, Cloutman-Green and colleagues (2014) quantified the visibility of each handwash sink by the amount of floor area (in square meters) where a sink was in the line of sight by the staff based on the space syntax concept. They found that as the sink visibility increased, the frequency of handwashing episodes increased (p = .007) and the degree of microbial contamination outside the sink decreased (p = .018). Neo and Sagha-Zadeh (2017) also applied the space syntax theory to simulate spatial layouts of three units to provide quantitative visibility and global traffic flow scores for each HSD. Visibility was measured by calculating the number of spaces immediately connecting a space of origin, which is equivalent to the “connectivity” value in space syntax measure; global traffic flow was measured by calculating the visual distance from all spaces to all others, which is equivalent to the “visual integration” value in space syntax measure. The frequency of use of HSDs was measured for 2 weeks through electronic tracking with motion sensors. Based on linear modeling analysis, they found that visibility and global traffic flow were significant predictors of the frequency of HH behavior (both p < .001). This was an important study that quantitatively demonstrated the impact of the visibility of HSDs on HH. However, with the cross-section design of this study, data were gathered from units with various care models and patient acuity levels, which did not allow comparison across units. Besides, as the data from three units were compiled together for the analysis, no specific design implications regarding nursing unit typology and shape were given.
Multiple studies have demonstrated that in addition to visibility, better accessibility of HSDs could improve HCWs’ HHC (Anderson et al., 2010; Boyce, 2001; Cure & Van Enk, 2015; Suresh & Cahil, 2007). There is a lack of consistent definitions and measures of accessibility to support strong evidence in this area. Some studies defined accessibility as related to physical barriers or physical distance, while others considered the ergonomic design such as the height, reachability, and usability of the HSDs. For instance, Boyce (2001) pointed out that physical barriers that restricted access to sinks could discourage HCWs’ handwashing. Suresh and Cahil (2007) investigated the user-friendliness of HH resources using an ergonomics tool. They claimed that several deficiencies in the hospital structural layout like poor visibility, difficulty of accessing the HSDs, placement of HSDs at undesirable height, and wide spatial separation of HSDs discouraged HCWs’ HHC. Cure and Van Enk’s (2015) quantitative research analyzed the usability scores for visibility, unobstructed access, reachability, placement at an optimal height, and availability of HSDs within HCWs’ workflow route. In this study, each HSD was placed at the patient room entrance to fit along the doctors’ and nurses’ movement routes. Additionally, visibility, accessibility, and reachability were calculated based on HCWs’ movement routes for direct patient care. The results of this study demonstrated that the visibility and accessibility of HSDs had the most significant impact on the compliance rate. In this study, visibility and accessibility were measured along HCW’s working route as they entered patient rooms. This approach captured the key moments of HH opportunities before and after direct patient care within patient rooms. However, HCWs often perform other tasks that require HH outside patient rooms (e.g. preparing medication, transporting patients). The visibility or accessibility of the HSDs related to the areas outside patient rooms and the overall unit are not considered in the existing studies.
The above studies provided rich descriptions to help establish the link between visibility and accessibility of HSDs with HCWs’ HHC. However, in most studies, accessibility and visibility were either used as general terms or measured from a specific location or a fixed route. Besides, due to the lack of control for care models, patient acuity levels, and the design of HSDs (e.g., height, depth, color, design), limited research was able to establish the link between nursing unit typology, the visibility and accessibility of HSDs, and HCWs’ HH behavior.
Research Questions
To add to the body of knowledge, we aim to investigate the following: (1) How do the nursing unit typology and design impact the visibility and accessibility of the units and the HSDs? and (2) What are the impacts of visibility and accessibility of HSDs on HCWs’ HH behavior?
Research Design and Settings
This study was based on a cross-sectional comparative case study on two nursing units of a large academic medical center. Unit A was in a new patient tower that was constructed in 2017, while the comparison unit (Unit B) was in a different tower that was constructed in 1970 and renovated in 2008. Unit A moved from an old unit with a similar layout as Unit B to the new tower. Both units had hybrid nurse stations that combined four sub-nurse stations with nursing alcoves in between each pair of patient rooms. Both units were progressive care units that shared similar staffing models and patient acuity levels. In both units, nurses had the same workload. The HCWs in both units had a similar amount of training about the importance of HH and maintained the same HH protocols as they worked in the same hospital. HH educational campaign was conducted before the observation. HCWs’ levels of awareness of the importance of HH are considered constant for this study. In both units, each patient room had one sink for handwashing.
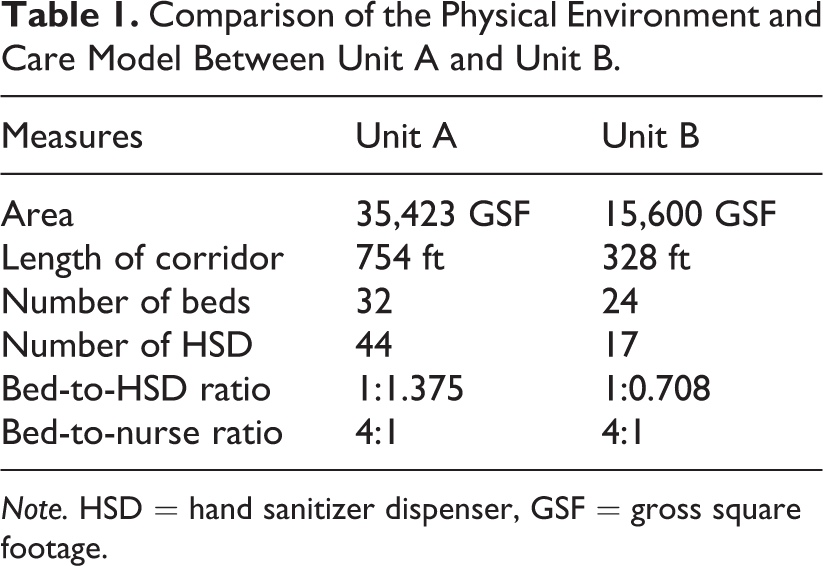
Despite the similarities, these two units varied in size and the shape of the floor plate (Table 1). Unit A had 32 patient rooms and Unit B had 24 patient rooms. Unit A doubled in size and the total length of main corridors than Unit B. Unit A was a long, linear rectangle in shape with a bend in the middle. Unit B was a compact and square floor plate. Based on Catrambone and his colleagues’ (2009) classification of nursing unit configurations and typologies, Unit A was a “parallel corridor” with patient rooms parallel to the central support core, while Unit B was a “surrounded” layout with patient rooms wrapped around the central support space and nurse stations. In terms of placement of HSDs, Unit A had a total of 44 wall-mounted HSDs outside patient rooms. The ratio of the patient room and HSD was 1:1.375. Among them, 32 HSDs were placed at standardized locations at patient room doors, visible upon entering patient rooms, and accessible from the main corridor. Among the 12 other HSDs, five were at the internal service corridors, six were placed at the nurses’ station, and one HSD was at the elevator lobby (Figure 1). Unit B had a total of 17 HSDs and the ratio of patient room and HSD was 1:0.708. Among them, 14 HSDs were placed at patient room entrances and accessible from the main corridor. Among the three other HSDs, two were at the internal service corridor and one was placed at the nurses’ station (Figure 2). All the HSDs were the same brand and model with the same visual appearances and were placed at the same height throughout both units (at 45 in. high).
Comparison of the Physical Environment and Care Model Between Unit A and Unit B.
Note. HSD = hand sanitizer dispenser, GSF = gross square footage.

Hand sanitizer dispenser location map (marked in orange) of Unit A.

Hand sanitizer dispenser location map (marked in orange) of Unit B.
Research Methods
Data Collection
The study applied quantitative methods to examine the impact of visibility and accessibility on HCWs’ HH behavior. The research protocol was approved by the hospital’s institutional review board.
Visibility and accessibility of the unit and HSDs
Visibility and accessibility analyses were conducted using space syntax theory and techniques. We imported computer-aided design floor plans of both units at the same scale to the software “Depthmap X V0.7.0” and used the same grid resolution to conduct visual graph analysis (VGA). The quantitative measures of visibility and accessibility were based on the integrated values generated from VGA. For visibility, all solid partitions below a standing person’s eye level (about 5 ft) were removed for analysis, which simulated the visual inter-connectedness from a standing/walking person’s perspective. For the accessibility, all partitions were kept simulating the experience of a person moving through the unit.
In addition to quantitative measures, we used Depthmap X to generate a visual representation of the visibility and accessibility of both plans as gradient color-coded heat maps, where the red tiles represented the more visually connected or physically accessible areas while the blue tiles represented more segregated areas.
HH observations
The HH rates were evaluated at two levels. The first level was to compare the frequency of HH activity during on-site observations. Due to Health Insurance Portability and Accountability Act (HIPPA) concerns, the researchers only observed HCWs’ use of hand sanitizers in the hallway area where every HSD was accessible for communal use. The HH behaviors at the point of care inside patient rooms were not observed. The second level was to track the changes in HHC rates and infection rates of Unit A during the 6 months before- and after-the-move to the new facility. The data from Unit B were analyzed as a comparison.
On-site behavioral observations
The on-site observations were conducted using behavior mapping (BM) for 1 week in each unit. BM has been widely used to relate behaviors to physical locus (Ittleson et al., 1976). In this study, we used BM to capture the aggregated patterns of HCWs’ HH behavior related to HSDs. Observers followed a standard route through the unit, documented nurses’ activities based on predetermined behavior categories and the associated physical locations in each unit (Table 2). Each set of BM took approximately 15 min to complete the coverage of the entire unit. In total, 40 sets of BM based on 10 hr of observation were recorded in each unit, covering equal amounts of morning and afternoon shifts. The data were collected by a group of student research assistants. Proper training before the data collection and on-site pilot tests with follow-up instructions were given to each individual to maximize the consistency of each test. All data were later inputted into ArcGIS Desktop Version 10.6 and SPSS Statistics Version 25 for analysis.
Nursing Activity Categories for Behavioral Mapping.

Monthly HHC audit report
HHC rate was provided by the hospital. The monthly compliance data were obtained by trained staff members who conduct audits to evaluate whether medical, nurse, ancillary, and support staff completed proper HH before and after patient contact. The auditors randomly sample the HCWs and observe five moments for HH: (1) before touching a patient, (2) before clean/aseptic procedures, (3) after body fluid exposure risk, (4) after touching a patient, (5) after touching the patient’s surroundings or environment. Data were gathered between December 2016 and April 2018.
Clostridium difficile infection (CDI) rate
We also analyzed the CDI rate as possible outcomes of HHC, as HCWs’ HH is one of the crucial approaches to prevent the spread of CDI (Zellmer et al., 2015). The CDI data for Unit A during 6 months before- and after-moving to the new facility and the comparison Unit B during the same period were collected from the hospital quality control department and analyzed using a t test.
Data Analysis
Descriptive statistics were used to compare values of visibility, accessibility, observed HH frequency, and hospital-audited HHC and CDI rates. We also conducted t tests to see whether there is any significant difference between Unit A and Unit B regarding these variables. We used repeated-measures General Linear Models (GLM) to evaluate whether Unit A and Unit B have different changes of HHC and CDI comparing the time periods before-move and after-move. Moreover, we used GLM to run linear regression models to test whether visibility or accessibility increase would predict the increase of the frequency of HH using the HSDs. In this study, a p value < .05 was considered significant.
Results
Visibility and Accessibility of the Units and HSDs
Overall visibility of Unit B was higher than the overall visibility of Unit A (5.77 vs. 5.11, respectively). The overall accessibility value of Unit B was similar to the overall accessibility value of Unit A (4.59 vs. 4.77, respectively).
The average visibility of HSD in Unit B was much higher when compared to the average visibility of HSD in Unit A (7.54 vs. 6.33, respectively). A t test showed that the visibility of HSDs was significantly higher in Unit B than in Unit A, p < .001, t(60) = 4.615 (Table 3). The average accessibility of HSD in Unit B was also higher when compared to the average visibility of HSD in Unit A (6.08 vs. 5.82, respectively), although not statistically significant.
t Test Results Comparing Unit A and Unit B for Visibility, Accessibility, and Hand-Hygiene Occurrences per HSD.

Note. HH = hand hygiene; HSD = hand sanitizer dispenser; M = mean; SD = standard deviation.
*p < .001.
Observed HH Behaviors
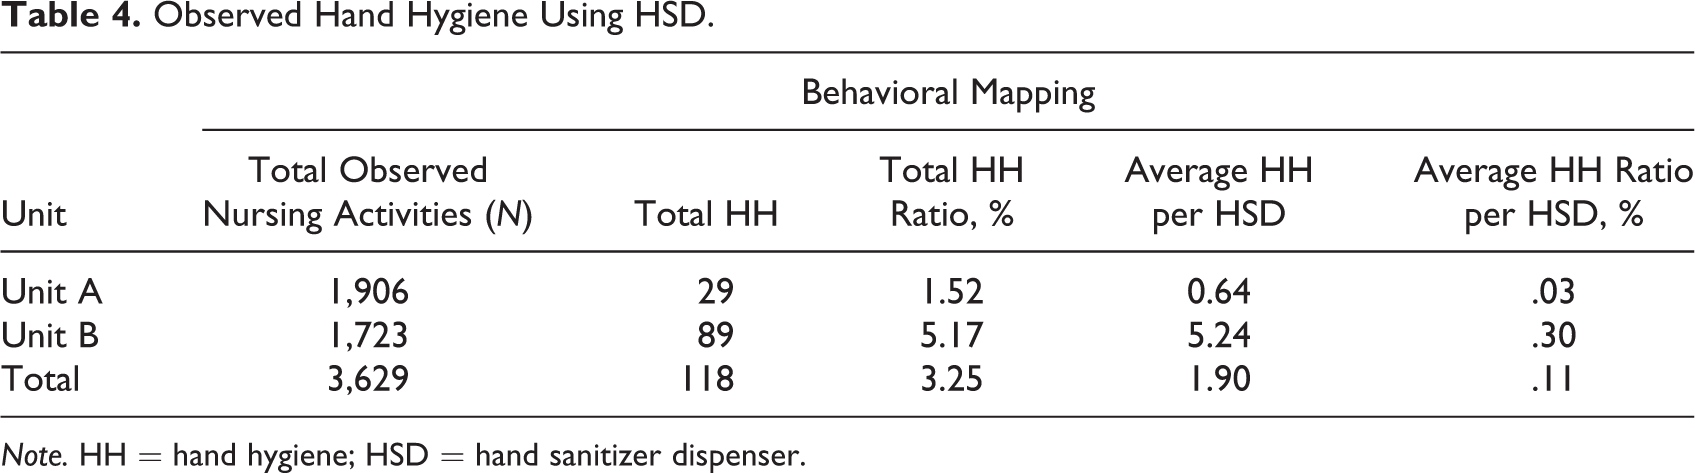
In total, we observed 3,629 activities based on BM. Among them, HH accounted for 3.25% of the total activities. The average frequency of HH was 1.9 times per HSD. Detailed HH comparison between Units A and B is reported in Table 4 and described below.
Observed Hand Hygiene Using HSD.
Note. HH = hand hygiene; HSD = hand sanitizer dispenser.
Observed HH episodes
The total number of activities in Unit A was 1,906, including 29 HH occurrences, which accounted for 1.52% of total activities; while the number of total activities recorded in Unit B was 1,723, including 89 observed HH episodes, which accounted for 5.17% of total activities.
Comparison of HH Frequency
We found that a higher average frequency of HH activity occurred in Unit B compared to Unit A (5.17% vs. 1.52%). The average HH ratio per HSD was also higher in Unit B than in Unit A (0.3% vs. 0.03%). A significant difference was found when comparing the frequency of HH behaviors between these two units, p < .001, t(16.750) = 5.332 (Table 3).
The Influence of Visibility or Accessibility on the Frequency of Use of HSDs
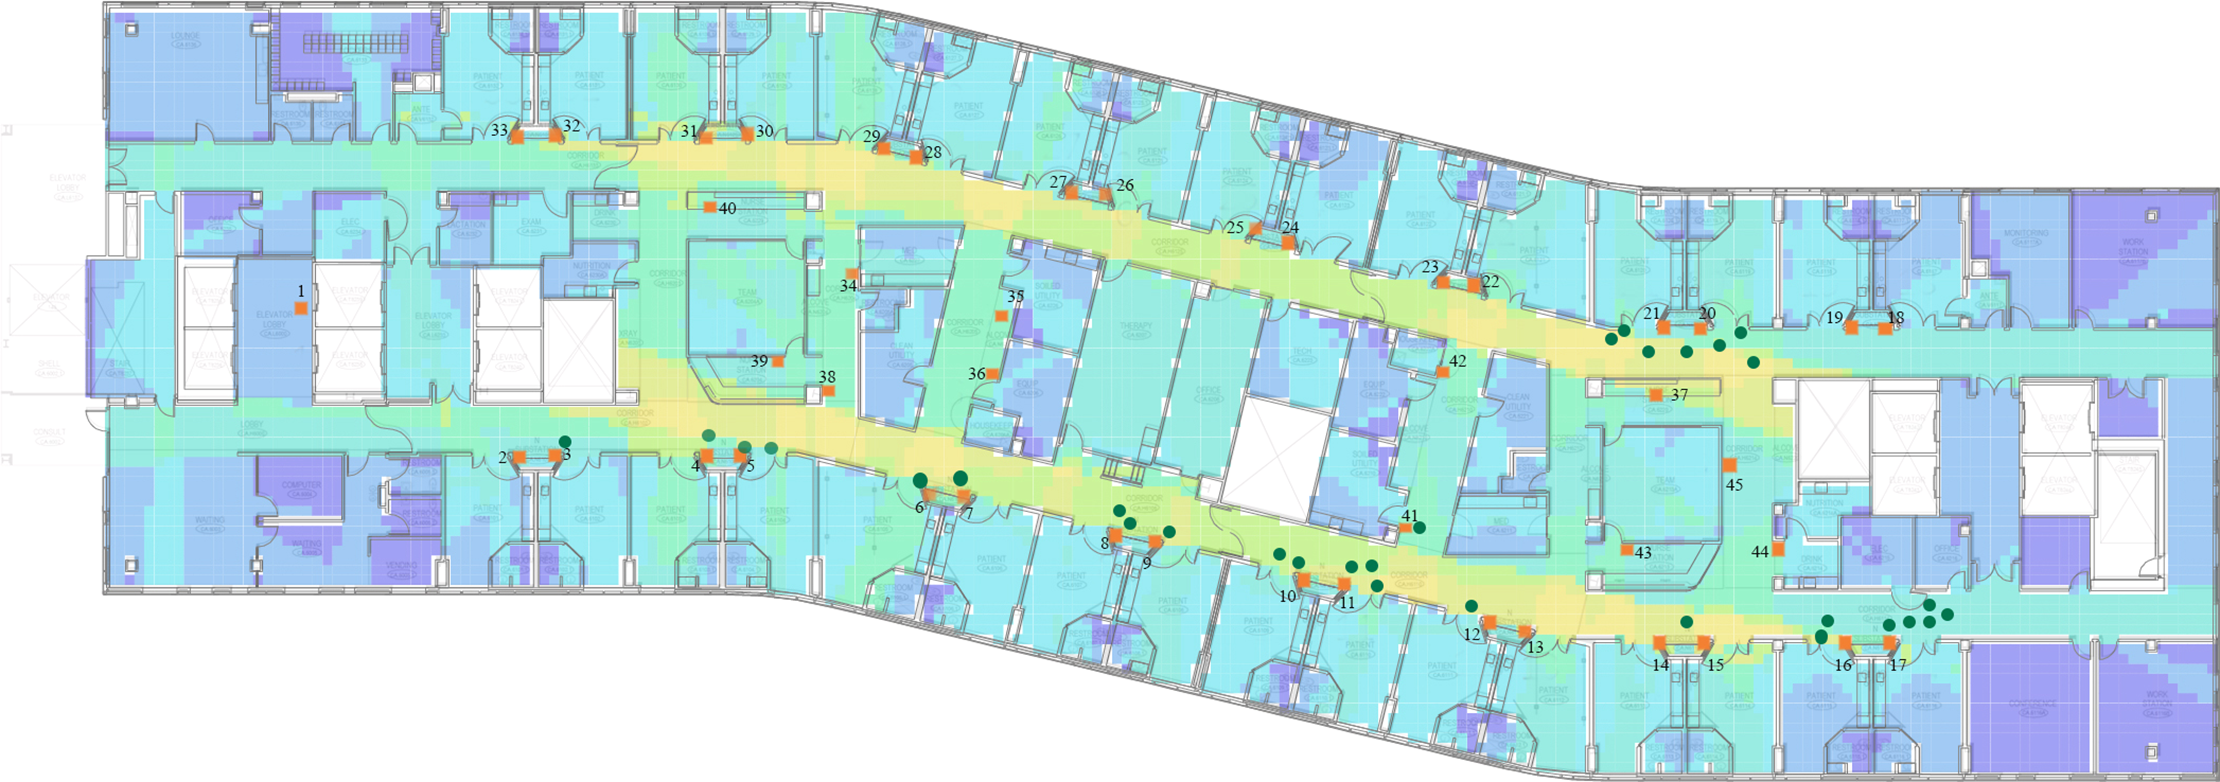
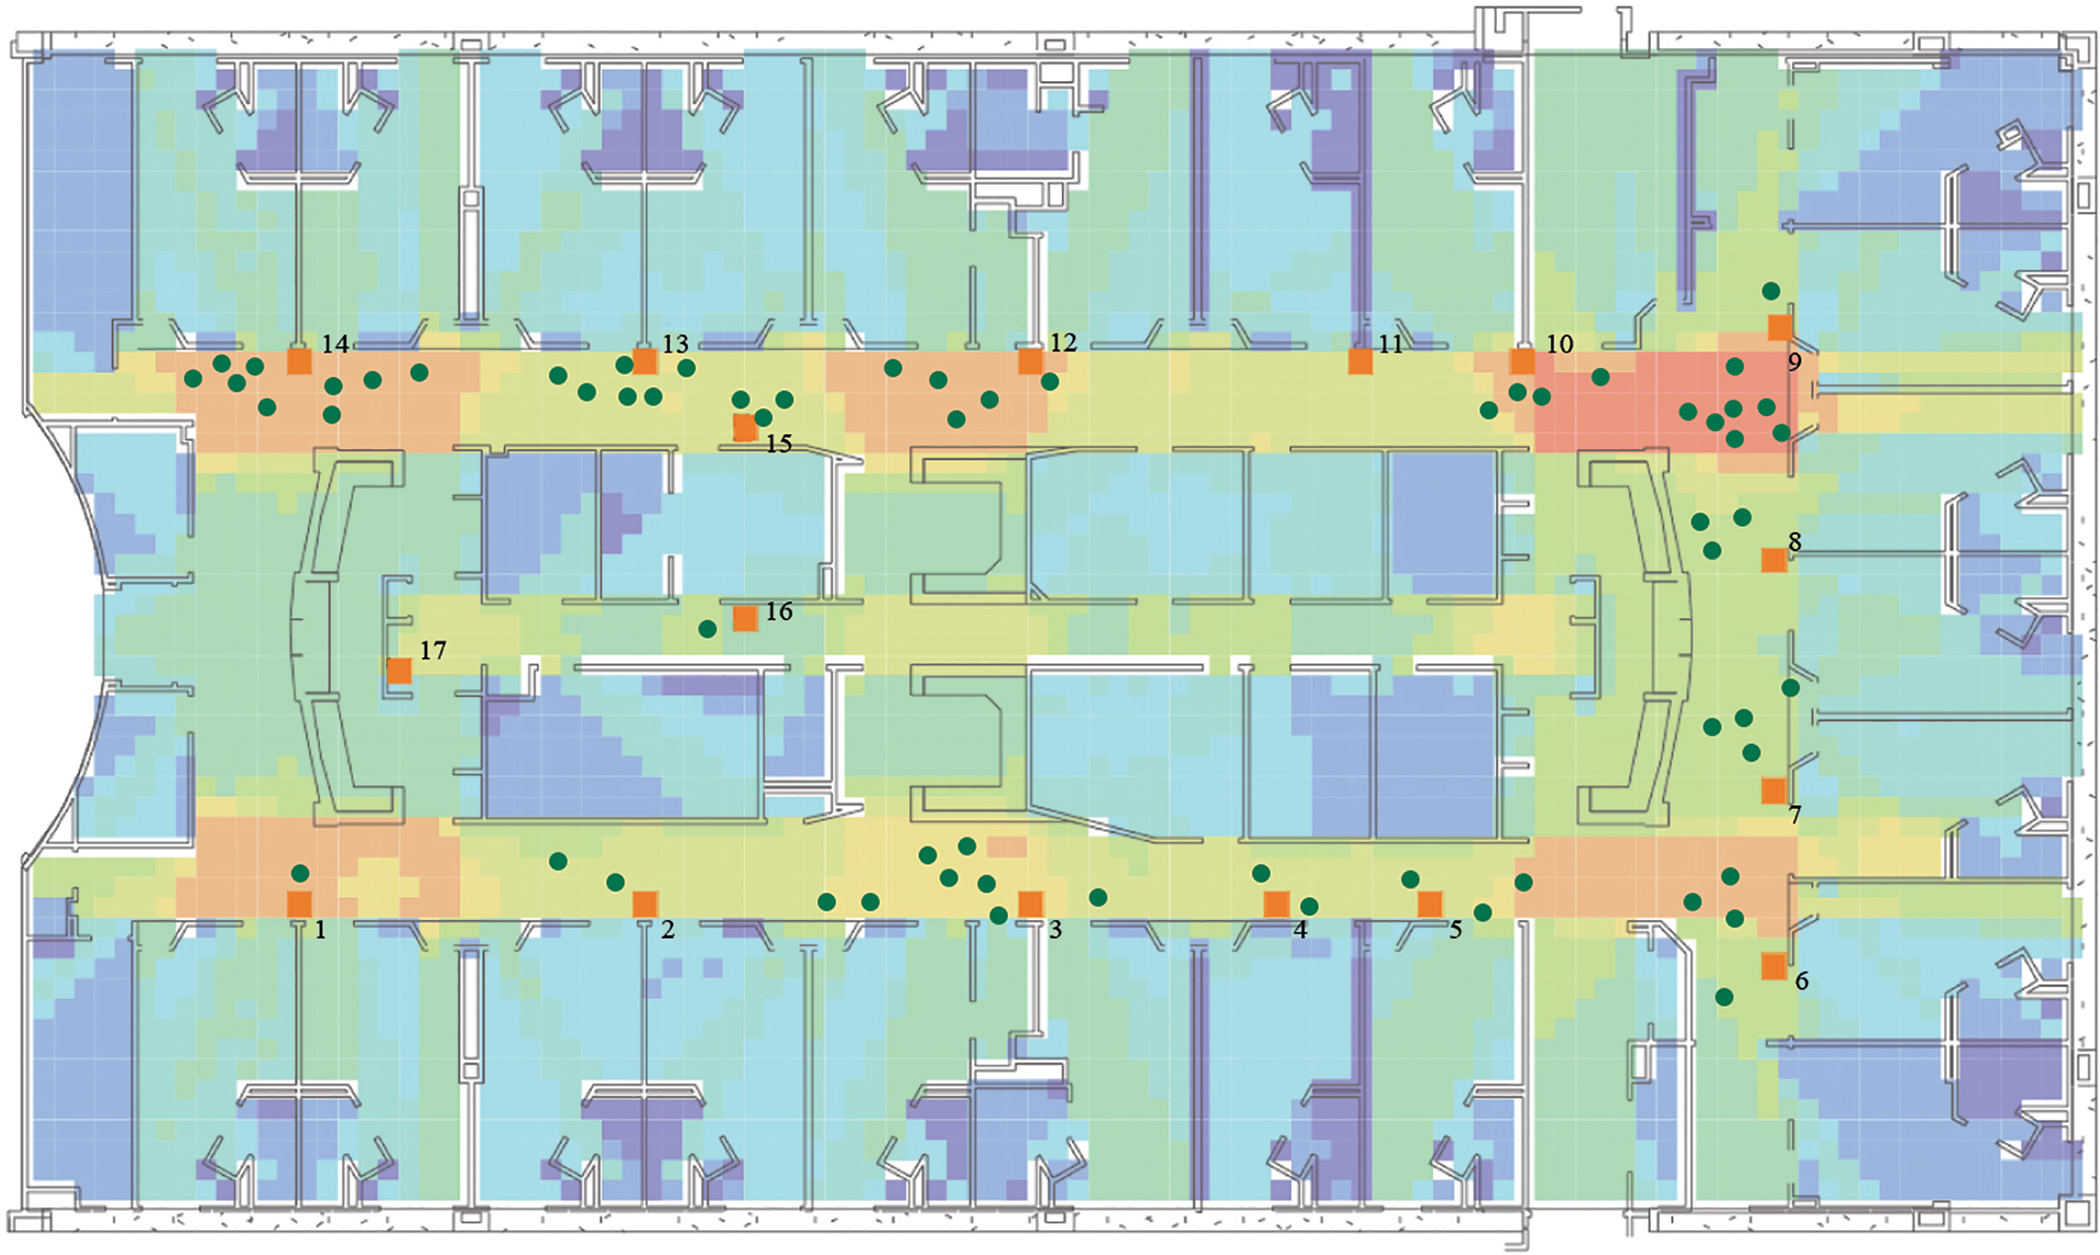
We further evaluated the relationship between visibility/accessibility of HSDs and HH behaviors both visually and quantitatively. First, we overlaid the heat map of visibility and accessibility with the total number of HH episodes observed on each HSD to visualize the relationship between the visibility of each HSD and the amount of HH occurred on that station (Figures 3 –6). The visualization demonstrated a higher number of HH activities clustering around HSDs with higher visibility and accessibility than the HSDs with lower visibility and accessibility.

Overlay of hand-hygiene occurrences based on behavior mapping and visibility heat map in Unit A.

Overlay of hand-hygiene occurrences based on behavior mapping and visibility heat map in Unit B.
Overlay of hand-hygiene occurrences and visibility heat map in Unit A.
Overlay of hand-hygiene occurrences and visibility heat map in Unit B.
Moreover, three separate sets of linear regression models were developed to test the relationship between visibility or accessibility and the frequency of HH, with the first sets of models using data in Unit A, the second sets of models using data in Unit B, and the third sets of models using all observation data from both units. Each set has two models, one for visibility and the other one for accessibility. The results showed that for Unit A, the total number of HH episodes could be predicted by visibility or accessibility. We found from the linear regression model that the visibility and accessibility each separately explained a significant amount of the variance in the frequency of HH, F(1, 43) = 4.448, p = .041, R 2 = .094, R 2 adjusted = .073, and F(1, 43) = 5.061, p = .030, R 2 = .105, R 2 adjusted = .084, respectively. The β values for the standardized regression coefficient were significantly different from zero (β = 0.323; p = .041 for visibility and β = 0.303; p < .03 for accessibility, respectively). The third and fourth models for Unit B did not reveal a significant relationship, perhaps because that the Unit B’s compact “surrounded” or radial layout made the HSDs have relatively homogenous visibility and accessibility, hence fairly evenly distributed HH behavior. When both units’ data were combined, the total number of HH episodes and HH ratio could be significantly predicted by the integration of HSDs. When the visibility of an HSD increased, frequency of use of the HSD would increase, F(1, 60) = 15.255; p < .001, R 2 = .203, adjusted R 2 = .189. The β values for the standardized regression coefficient were significantly different from zero (β = 1.225, p < .001). The total number of HH episodes and HH ratio could also be significantly predicted by the accessibility value of HSDs for all BM data combined. When the accessibility of an HSD increased, the frequency of use of HSD would increase, F(1, 60) = 4.542, p = .037, R 2 = .07, adjusted R 2 = .055. The β values for the standardized regression coefficient was significantly different from zero (β = 0.770, p = .037).
HHC Based on Hospital Audits
Based on the data provided by the hospital spanning from December 2016 to May 2017 and from April 2018 to August 2018, the average HHC rates for Unit A (93%) is similar to Unit B (92%). When comparing the HHC rates before- and after-move to the new facility, both Unit A and Unit B did not have significant changes (93% vs. 93% and 93% vs. 92%, respectively). It is noted that the sample size is rather small (only 6 months’ data were available for Unit A), which might create bias in the analysis. Also, the audits of HH episodes include HH both using the sinks and the HSDs. The combined data might mask the effect of HH contributed to HSDs only.
CDI rates
Based on the reported total number of incidents for CDI using the data from December 2016 to May 2017, and April 2018 to September 2018, both Units A and B have reduced CDI during the after-move period when compared with before-move period (dropped from three to two and 10 to six, respectively), but Unit A has a lower reduction rate when compared to Unit B (33% and 40%, respectively). The difference of change of CDI rate between two units was statistically significant, F(1, 10) = 5, p = .049,
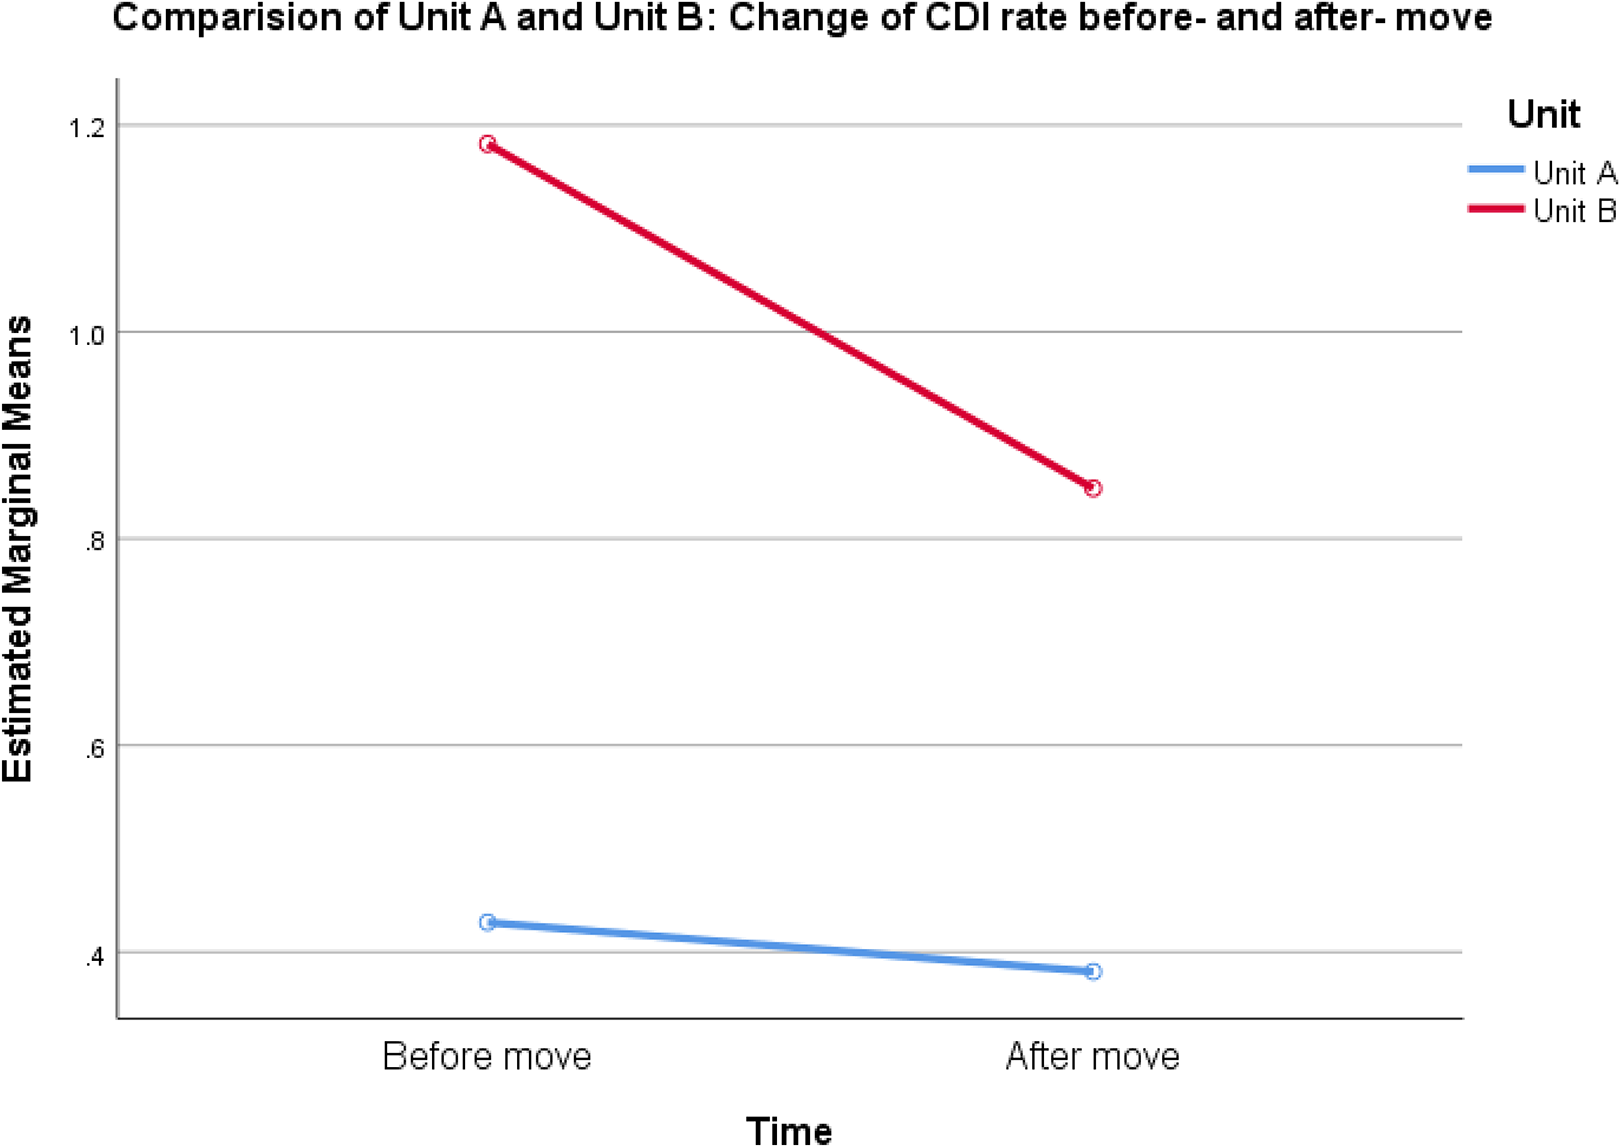
Comparison of changes in Clostridium difficile infection before- and after-move between Unit A and Unit B.
Discussion
The study has shown that different unit design characteristics such as the size and the shape of the unit and the length of the corridor could affect the visibility and accessibility of overall units and individual HSDs. In addition to the much larger size and longer corridor length, the long, linear corridor of Unit A makes the HSDs more spread out and visually less prominent from the corridor. Besides, the bend in the middle of Unit A added to the difficulty of visual access throughout the unit, despite the benefits of the aesthetic value to the building. By contrast, the compact square “surrounded” layout of Unit B made the HSDs more visually connected and accessible from hallways. We found that the visibility and accessibility of the HSDs had impact on HH behavior. The total ratio of HH occurrence in Unit B was much higher than the total HH occurrence in Unit A, even though the HSD to bed ratio was smaller in Unit B than Unit A. The results demonstrated that the frequency of HH did not just depend on the ratio of HH stations to bed. The unit with HSDs that was easily visible and accessible from all areas of the unit presented higher chances for HCWs to be reminded about HH opportunities and could potentially lead to higher HH occurrences.
The linear regression models also showed that the visibility and accessibility of the HSDs were strong predictors of the engagement of HCWs on HH behaviors. The results are consistent with findings from Neo and Sagha-Zadeh’s (2017) research. While they used only visibility as their research parameter, our research applied both visibility and accessibility as variables. Moreover, this research indicated HSD’s visibility as a stronger predictor than its accessibility for HH. It shows that it is important to see the HSD from other areas of the unit before they approach patients.
This research has implications in both design practice and research methods. In terms of design practice, it demonstrated the importance of nursing unit design characteristics such as the shape and size of the unit, as these characteristics can affect the visibility and accessibility of HSDs and hence HH behavior. It is aligned with other studies that have shown that human factors systems approach (e.g., visibility and accessibility of patients, equipment, and supplies) in the healthcare environment is critical for patient safety and care quality (Carayon et al., 2014). The study reinforced the importance of the strategic placement of the HSDs to maximize visibility and accessibility to these HSDs, which strengthened the evidence from several earlier studies (Cloutman-Green et al., 2014; Neo & Sagha-Zadeh, 2017). Even though alcohol-based HSDs are relatively inexpensive and can be installed practically anywhere, the National Fire Protection Association (2003) 101 Life Safety Code determines the maximum quantities of alcohol-based hand rub in one controlled area is 120 gallons, which allows 50 HSDs (750 ml per dispenser) in a typical hospital smoke compartment space enclosed by smoke resistive barriers (maximum 40,000 sq. ft for unit with single patient rooms). Hence, the strategic locations of these HSDs are essential for encouraging HCWs’ HH and reducing the risk of infections. From the research method’s perspective, this cross-sectional comparative study has proven space syntax measures as a reliable predictor of HH behavior, while controlling other confounding variables. With the support of space syntax analysis, the locations of the HSDs can be simulated and evaluated before the actual installation. It is important for architects and facility managers to also consult and coordinate with HCWs on the location, height, and design of the HSDs to make them user-friendly. In addition to space syntax, we used multimethods to triangulate data and supplied a richer understanding of the relation between visibility and accessibility and actual observed behavior, as well as performance data that hospitals already collect as part of their quality control. The mixed-methods approach strengthens the research design, elevating it beyond previous research. It also highlighted the potential of leveraging readily available HH audit data for organizations that lack resources to conduct comprehensive on-site observations.
Limitations and Further Recommendations
The current study has several limitations. First, due to budget constraints, the observation duration of 1 week in each unit is relatively short. It is noted that the number of observed HH occurrences is rather small, which might create bias in the analysis. For instance, the linear regression in Unit B did not reveal significant relationship between HH frequency and visibility or accessibility, which might be due to the small number of observed HH episodes. Second, the number of observed HH behaviors might be underreported as the motion of using HSDs is usually very frequent and rapid, a small number of instances could potentially be missed during the observation. Future studies should deploy automatic sensor-based trackers on HSDs to record both the frequency and time stamps of HH behavior (Neo & Sagha-Zadeh, 2017). It can help reduce the potential risk of Hawthorne effects and collect a larger amount of data with less manpower. Furthermore, even though the compliance percentages were measured several times each month, the data were shared with the researchers in an aggregated manner. It would be helpful to have each HHC audit data reported with the HSD location data to further investigate the impacts of visibility and accessibility on HHC. Although the current study did not reveal clear differences in infection rates, a longitudinal study that spans a longer period is recommended for understanding the long-term effect of the nursing unit design on HHC and patient outcomes such as length of stay and HAI rates. Future research should also study HH behavior based on each staff type in isolation to understand the impacts of visibility and accessibility of HSD on the medical staff. The proposed method should also be applied to multiple hospital units with various acuity levels such as ICUs and medical–surgical units to evaluate whether the relationship between visibility, accessibility, and HHC varies with different patient acuity levels and care models.
Implications for Practice
There is a link between nursing unit typology and shape, visibility and integration of hand sanitizer dispensers (HSDs), and HCWs’ HH behavior.
Simply increasing the bed-to-HSDs ratio cannot improve HH behavior. The visibility and accessibility of HSDs could have a bigger impact on HH frequencies than the ratio of bed-to-HSDs.
The strategic positioning and location of the HH stations are critical to improve HCWs’ HH frequency and HHC.
Space syntax is a valid tool to measure the visibility and accessibility of HSDs and evaluate the effectiveness of the placement of HSDs to encourage HH.
Supplemental Material
Supplemental Material, sj-pdf-1-her-10.1177_1937586720962506 - Impact of Visibility and Accessibility on Healthcare Workers’ Hand-Hygiene Behavior: A Comparative Case Study of Two Nursing Units in an Academic Medical Center
Supplemental Material, sj-pdf-1-her-10.1177_1937586720962506 for Impact of Visibility and Accessibility on Healthcare Workers’ Hand-Hygiene Behavior: A Comparative Case Study of Two Nursing Units in an Academic Medical Center by Hui Cai, Intisar Ameen Tyne, Kent Spreckelmeyer and Jennifer Williams in HERD: Health Environments Research & Design Journal
Footnotes
Acknowledgments
The authors would like to thank for the support of the staff of the University of Kansas Hospital, including Todd Koch, Adam Meier, Stacy White, Miki Mahnke, Katie Mayer, Sarah Villanueva, and all the nurses who contributed to the study. They would like to also thank all the student researchers who have helped collecting on-site data, including Abby Eleeson, Hannah Warren, Yu'ang Sun, Ercheng Wang, Melissa Watson, Jaxon Freeman, and Rui Ge.
Declaration of Conflicting Interests
The author(s) declared no potential conflicts of interest with respect to the research, authorship, and/or publication of this article.
Funding
The author(s) disclosed receipt of the following financial support for the research, authorship, and/or publication of this article: The University of Kansas.

Supplemental Material
The supplemental material for this article is available online.
References
Supplementary Material
Please find the following supplemental material available below.
For Open Access articles published under a Creative Commons License, all supplemental material carries the same license as the article it is associated with.
For non-Open Access articles published, all supplemental material carries a non-exclusive license, and permission requests for re-use of supplemental material or any part of supplemental material shall be sent directly to the copyright owner as specified in the copyright notice associated with the article.
