
Abstract
Problem Statement:
Geographic-specific strategies for reducing air pollutants are of increasing interest for informing policies that reduce disparate air pollution exposure and health impacts. State legislation identifying such geographic areas use varying definitions, often focused on pollutant levels and/or population characteristics, with implications that are not well understood.
Research Question:
How do commonly used legislative definitions of overburdened communities (OBCs) differ in capturing areas that experience excess air pollutants? What are implications for eliminating excess pollutant exposure and health inequities?
Methods:
We extracted OBC definitions from state legislation using cumulative impact frameworks introduced or passed before May 2024. Using Michigan as a case study, we calculated correlations, sensitivity, and specificity of common OBC indicators and thresholds with PM2.5 concentration at the census block group level. We used generalized linear mixed models to forecast change over time (2019–2039) in PM2.5 disparities using selected OBC definitions and various scenarios.
Results:
OBC definitions that included race/ethnicity had significantly larger disparities in PM2.5 concentration, compared with definitions that foregrounded income. Forecasting models indicate increasing inequalities over time for all OBC definitions using current and moderately accelerated intervention scenarios. Inequalities decline or disappear only under modeling scenarios which double or quadruple current rates of change.
Conclusion:
Differences in PM2.5 concentrations were largest when OBC definitions included race/ethnicity, and if current trends continue, are projected to increase over time, regardless of OBC definition. Exposure inequalities for OBCs defined using race and ethnicity are only eliminated under scenarios that double or quadruple current rates of reduction.
BACKGROUND
Environmental justice movement participants have long described the disproportionate presence of multiple environmental toxins in Black and Brown communities. 1 Despite dramatic reductions in criteria air pollutants since the passage of the Air Pollution Control Act in 1955, renamed the Clean Air Act (CAA) in 1963, and most recently amended in 1990, 2 inequities in the distribution of those pollutants and their associated harms to human health remain.3,4 In most cases, the largest disparities fall along racial and ethnic lines, with Black, Asian, and Hispanic Americans persistently experiencing the highest levels of air pollution exposures5,6,7,8,9,10 and the greatest burdens in mortality attributable to them.11,12,13,14 Studies also demonstrate consistent, although generally less dramatic, disparities between low and higher income populations.15,16
Strategies for addressing air pollution under the CAA focus on bringing criteria pollutants (ozone, particulate matter, carbon monoxide, lead, sulfur dioxide and nitrogen dioxide), within National Ambient Air Quality Standards at a regional scale. 17 Yet the persistence of racial/ethnic and economic inequities in exposures and health harms18,19 has led to questions about the effectiveness of such regional approaches. 20 Furthermore, there is increasing recognition that exposures to air pollutants or “chemical stressors” affect health in conjunction with what are sometimes called “non-chemical stressors” 21 including for example, socioeconomic stressors, age related susceptibilities, and existing health issues. 22 The term “cumulative impacts” (CI) is defined by the U.S. EPA as “the totality of exposures to combinations of chemical and non-chemical stressors and their effects on health, well-being, and quality of life outcomes (p. vii).23,24 Multiple studies using conceptual and analytic frameworks informed by this definition have demonstrated that the conditions that contribute to social and economic stressors and physical environmental exposures are not randomly distributed, but often co-occur, 25 shaped by historic and contemporary policies, such as redlining, segregation, discriminatory lending practices, and disparities in regulatory enforcement.26,27
Together, these critiques have led to the emergence of efforts to focus air pollution reduction in areas with persistently high pollutant exposures and populations that experience the greatest vulnerability to associated harms. 28 We use the term “CI frameworks” to describe frameworks that seek to identify the coincidence and joint impacts of high pollutant (chemical) exposures and population characteristics associated with excess harm (non-chemical exposures) due to, for example, racial/ethnic discrimination, poverty/economic divestment, young or older ages, or existing health conditions, to inform strategic actions to reduce harms. Studies conducted at a national scale have suggested that such area-specific strategies can be more effective in reducing health inequities attributable to air pollutants than CAA-based regional efforts, and that the impacts of location-specific strategies on environmental justice are contingent upon the definitions used to identify areas for additional oversight or protections. 29 A number of states have introduced, and a handful have passed, legislation that uses CI frameworks to identify overburdened geographic areas for heightened protections in environmental decision-making. 30 Various definitions are used to identify overburdened communities (OBCs) across state-level legislative documents, with unexplored questions about their implications for addressing racial/ethnic and socioeconomic health inequities. 31
Our overarching goal in this article is to examine similarities and differences in the extent to which commonly used definitions for identifying OBCs in state-level legislation capture areas that simultaneously experience excess air pollutant concentrations, and to assess the implications of those decisions for area-specific policy strategies to reduce racial/ethnic and socioeconomic inequities in pollutant exposure over time. Our analysis builds on, and substantially extends, recent analyses focused on definitions used in national policies. 32 States are currently an important site of activity in applying CI frameworks for environmental rulemaking. We begin by analyzing sociodemographic indicators or definitions used in state-level CI legislation to identify OBCs. We then examine the potential for area-specific strategic actions to reduce disparities in environmental pollutants between OBC and non-OBCs. For this portion of the analysis, we focus on disparities in air pollution, the focus of a substantial subset of the state policies identified. We selected the state of Michigan for the case study, a state with diverse populations and geographies (e.g., densely populated urban areas, large rural areas, American Indian land areas), which has recently introduced but not yet passed legislation to offer additional protections against air pollutants in OBCs. In this case study, we examine two additional research questions: To what extent do socio demographic definitions and thresholds identify localities with high PM2.5 concentrations (as a proxy for high air pollution more broadly)?; and What are the implications of those different definitions for forecasting the potential for policy interventions to reduce PM2.5 concentration disparities across areas in Michigan?
METHODS
Data sources
We identified state-level CI legislation introduced or passed prior to May 2024 using LegiScan, 33 a legislative tracking service, and the Cumulative Impacts Issue Page of the National Caucus for Environmental Legislators (NCEL). 34 Of the 44 unique legislative documents identified, 14 were enacted between 2017–2024 and 30 had been introduced but not yet been passed. We analyzed each legislative document (introduced or passed into law) for language used to define overburdened or disproportionately impacted communities (henceforth, OBCs) and tabulated the results. See Supplementary Table S5 in Supplementary Data for links to each legislative document included in this analysis, and the corresponding language used to define “overburdened” or “vulnerable” communities.
We used the U.S. Census Bureau’s American Community Survey (ACS) 5 year summary (2015–2019) to draw census block group (CBG) data for demographic, economic and American Indian Land Areas for Federally Recognized tribes in Michigan. We downloaded PM2.5 concentration Land Use Regression (LUR) estimates developed by the Center for Air, Climate and Energy Solutions (CACES) using v1 empirical models as described in Kim et al. 35
Measures
All variables are measured at the CBG level, the finest spatial scale and most commonly used unit in state-level CI legislative documents that define “overburdened” or “vulnerable” communities within specific geographic areas (see results section). For most variables, we used both continuous (e.g., the proportion of households in a CBG with incomes below poverty) and dichotomous (e.g., ≥35% of households with low incomes) versions, as described below.
PM2.5 concentrations
PM2.5 concentrations reflect the annual average concentration of particulate matter 2.5 microns in diameter, in micrograms per cubic meter of air (μg/m3). Additional information about how these estimates were derived is available from CACES for the LUR models. 36 In addition to continuous versions of PM2.5 concentration (μg/m3) estimates derived from LUR models, 37 we used rank-ordered percentiles, and dichotomous versions that identify CBGs with PM2.5 concentrations that fell into the top 50th, 70th, and 80th rank ordered percentiles for PM2.5 concentrations in the state of Michigan. We selected PM2.5 as our dependent variable given that PM2.5 has well-studied health impacts with studies reporting higher mortality risks than with ozone38,39 with substantial differences in exposure between White vs. non-White populations in Michigan (10% higher) and the U.S. as a whole. 40
Median annual household income
Median annual household income (MAHI) was derived from ACS data, and calculated as the MAHI for the state as a whole (2015–2019), and the MAHI for each CBG in the state, using data from the same time period. A dichotomous version coded CBGs that were above or below 65% of the state MAHI.
Low income (LI)
Low income (LI) is the proportion of households in a CBG with household income less than or equal to twice the federal poverty level. We used continuous proportion LI (e.g., proportion of households in the CBG with incomes below 200% of the federal poverty level), and a dichotomous version that coded each CBG as ≤35% LI or not.
Black, indigenous or people of color (BIPOC)
The percent of individuals in a CBG who indicated race other than White alone and/or ethnicity as Hispanic or Latino. We used continuous proportion BIPOC, and a dichotomous version that identified each CBG as ≥20% BIPOC or not.
American Indian land areas for federally recognized tribe
This variable was derived from the ACS and designates any CBG that contains land areas for a federally recognized tribe. This variable was dichotomous (1 = CBG containing federally recognized tribal land area, 0 = CBG with no federally recognized tribal land area).
Limited English proficiency
Limited English proficiency (LEP) households are those in which no member aged ≤14 speaks only English or speaks a non-English language and speaks English “very well.” Both the continuous proportion of households in a CBG classified as LEP and a dichotomous version (e.g., CBGs with ≥15% LEP) were used.
Matrix definitions
We used two composite indicators, made up of commonly used sets of variables, illustrative of the types of composite indicators identified in legislative documents.
Data analysis
To address our first research question, we searched the text of each state-level legislative document 41 for definitions used to identify OBCs. We coded and themed those indicators (e.g., income levels, racial composition), and identified those most commonly used: Subsequent phases of analysis were informed by those results. See Supplementary Data, Supplementary Table S5, for links to each legislative document reviewed, and language within each document used to identify OBCs.
To address our second question, we first used ArcGIS to map CBGs in Michigan identified using the most commonly used definitions, using ACS data (2015–2019). We examined correlations among continuous versions of each metric and PM2.5 concentrations, then assessed the
For our final research question, we used generalized linear mixed models to calculate rates of change over time in PM2.5 concentrations for CBGs identified using each of the above definitions, using CACES data for 2016–2019.
43
Models estimated both main effects and interactions between each definition of OBC and time at the CBG level, to assess whether rates of change differed in CBGs designated as OBCs versus non-OBC communities. Results are shown in Supplementary Table S4.

Where Y = PM2.5 at the CBG level, β0 = intercept, β1 = OBC definition, β2 = time, and β3 indicates whether there are differences between OBC and non-OBC communities in the rate of change.
We used results from the above models, which were based on CACES data 2016–2019, to forecast trends for Michigan CBGs (2019–2039), using a generalized linear mixed models with random intercept approach. Twenty-year projections were forecast using four definitions of OBCs, derived from state-level legislation that has been introduced but not yet passed in the state of Michigan (HB 5901, introduced in 2024). These include Matrix definition 1, the definition of OBC used in the introduced bill. We also assess two components of that definition (>35% LI, >20% BIPOC), in order to understand more clearly how the Matrix definition 1 compares with its component parts. Because Matrix definition 1 includes a “screening” layer, requiring CBGs to first meet the criteria of MAHI lower than or equal to 65% of the state MAHI (not commonly applied in other state’s definitions of OBCs), we also assess Matrix definition 2, which is parallel to Matrix Definition 1 with the exception that it does not include the MAHI screener.
For each of these four definitions of OBCs, we forecast six scenarios. The first assumes a business as usual (BAU) scenario, in which the rates of change observed in 2016–2019, continue for the projection period (2019–2039). We then forecast five scenarios in which we assume more rapid rates of reduction in PM2.5 in OBC communities and BAU in non-OBC communities, over the same 20 year period, 2019–2039. These included five scenarios which increase the rate of reduction of PM2.5 in OBC communities by 25%, 50%, 75%, 200%, and 400%, respectively, over BAU. In all of these models, non-OBC communities continued with BAU rates of change, and we assumed that population characteristics of the OBC communities remained constant.
RESULTS
Our search yielded a total of 44 state-level legislative documents that used CI frameworks to identify OBCs to guide a wide range of environmental decision making (e.g., all environmental permitting, air permitting, prioritization of resources to those communities, additional compliance or enforcement). Results from our analysis of definitions and thresholds used to identify OBCs are presented in Table 1. Commonly used definitions included: proportion of residents who identify as Black, Indigenous, or People of Color (n = 26; BIPOC); proportion of households with LIs (n = 25); MAHI (n = 19); LEP (n = 18); and AILA (n = 5). While some legislative documents used a single indicator, “matrix” definitions that included multiple variables (e.g., MAHI and LI and BIPOC) were more common. Five legislative documents did not define “vulnerable” or “overburdened” communities and eight did not define geographic units associated with those definitions. Of the remaining 31, 58% (n = 18) used CBGs, 39% (n = 12) used census tracts, and 3% (n = 1) used zip codes. The list of state-level legislation identified and corresponding definitions of OBCs is included in Supplementary Data, Supplementary Table S5.
Results from Analysis of Definitions Used to Identify Overburdened Communities in State-Level Legislation That Uses Cumulative Burden or Cumulative Impacts to Inform Environmental Decision-Making
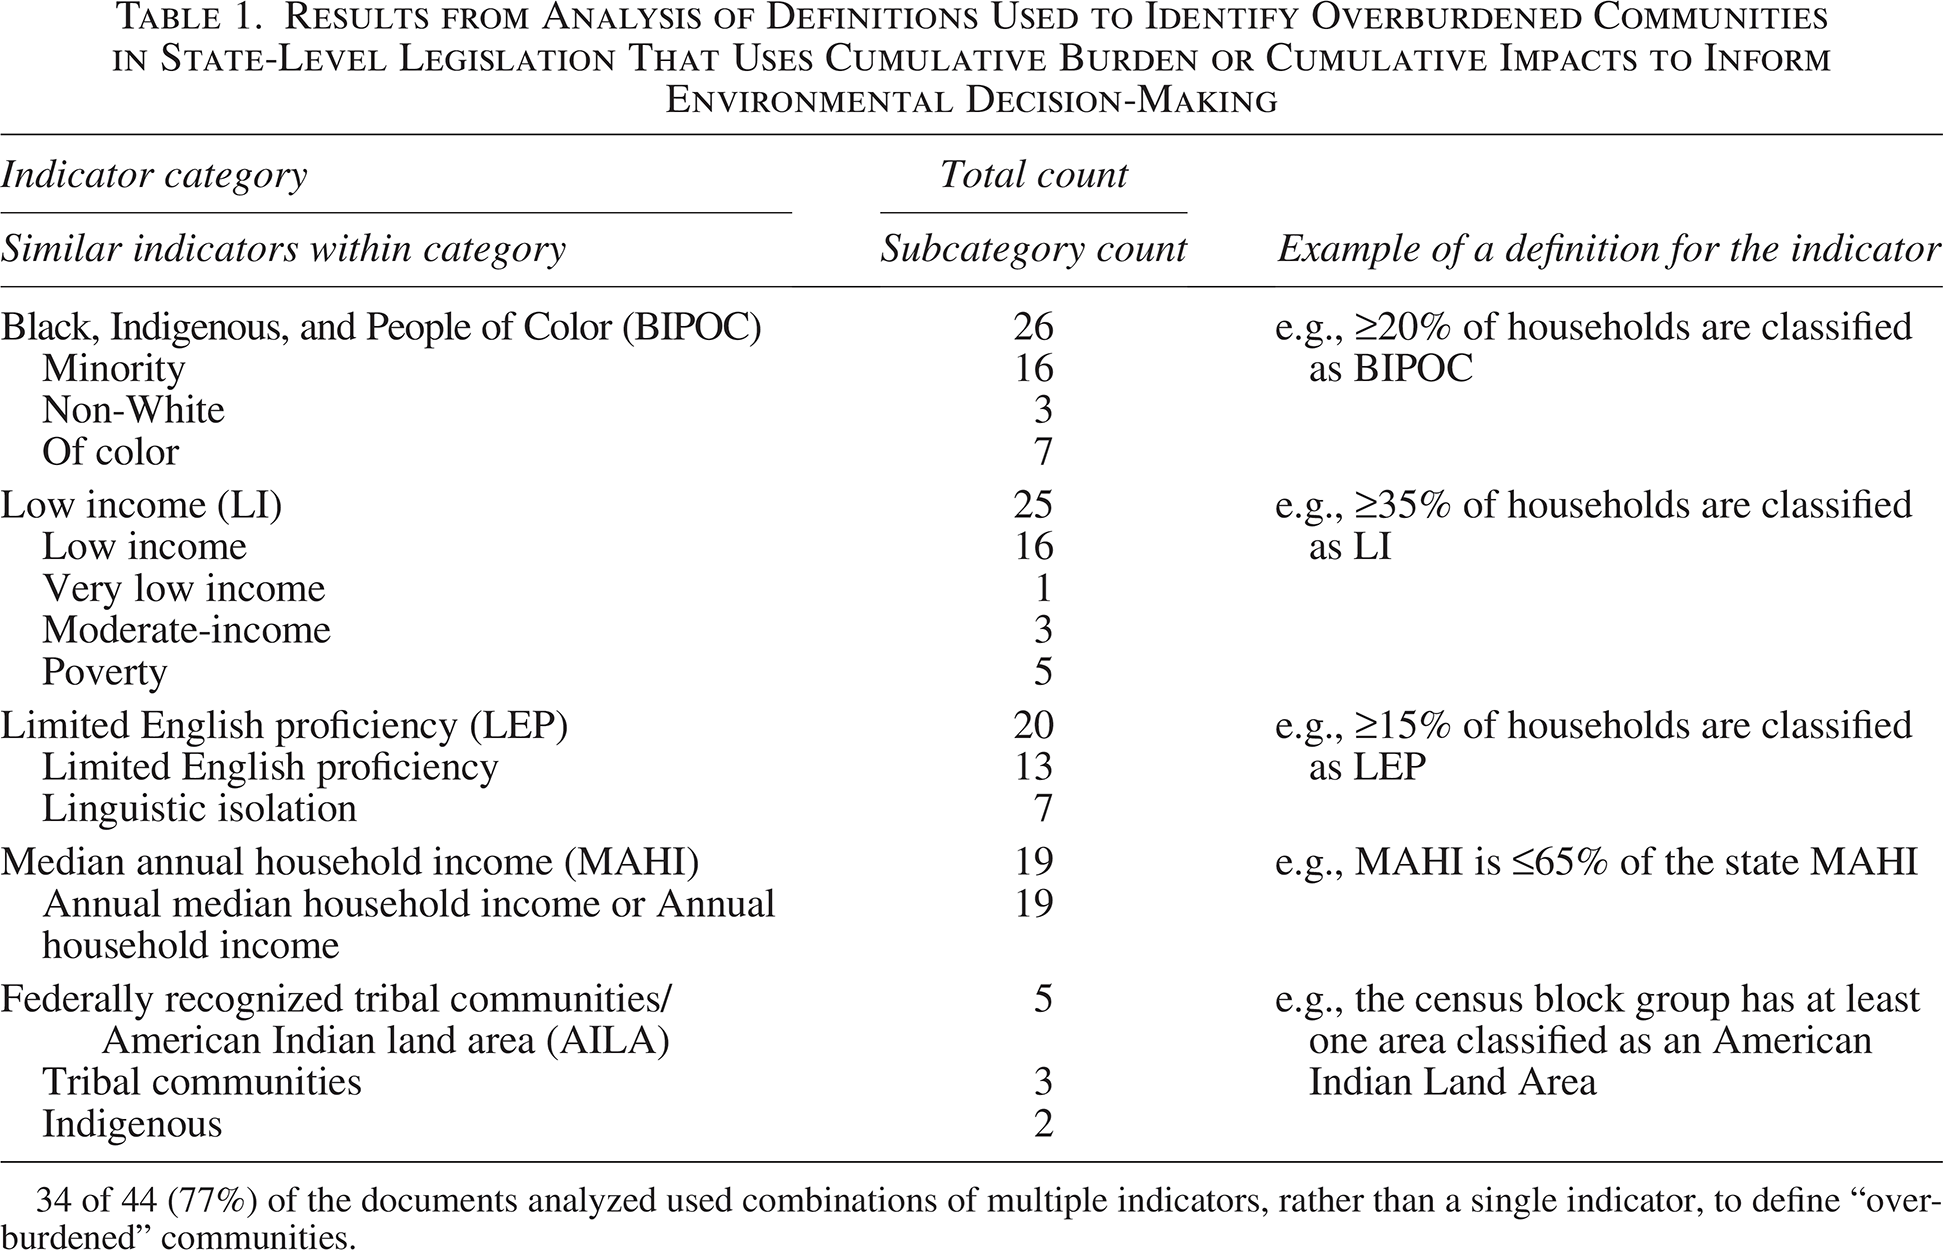
34 of 44 (77%) of the documents analyzed used combinations of multiple indicators, rather than a single indicator, to define “overburdened” communities.
Table 2 presents descriptive statistics showing the distribution of Michigan CBGs identified as overburdened using each indicator, and proportion of CBGs meeting commonly used dichotomous cut points. A majority (77%) of legislative documents reviewed used matrix definitions 44 with multiple sociodemographic indicators. Just over 40% (n = 3,374) of CBGs in Michigan met criteria for ≥20% BIPOC residents; 44% (n = 2570) met criteria for ≥35% LI households; just over 2% (n = 184) had ≥15% LEP and just over 1% (n = 104) met the definition for AILA. About one in five (n = 1,601) CBGs in Michigan met criteria specified under Matrix Definition 1, and nearly three in five (n = 4,744) CBGs met conditions for Matrix Definition 2.
Descriptive Statistics for Census Block Group (CBG) Indicators and Percentage of Michigan CBGs That Meet Each Definition (n = 8,205; n = 46 CBGs Have no Data)
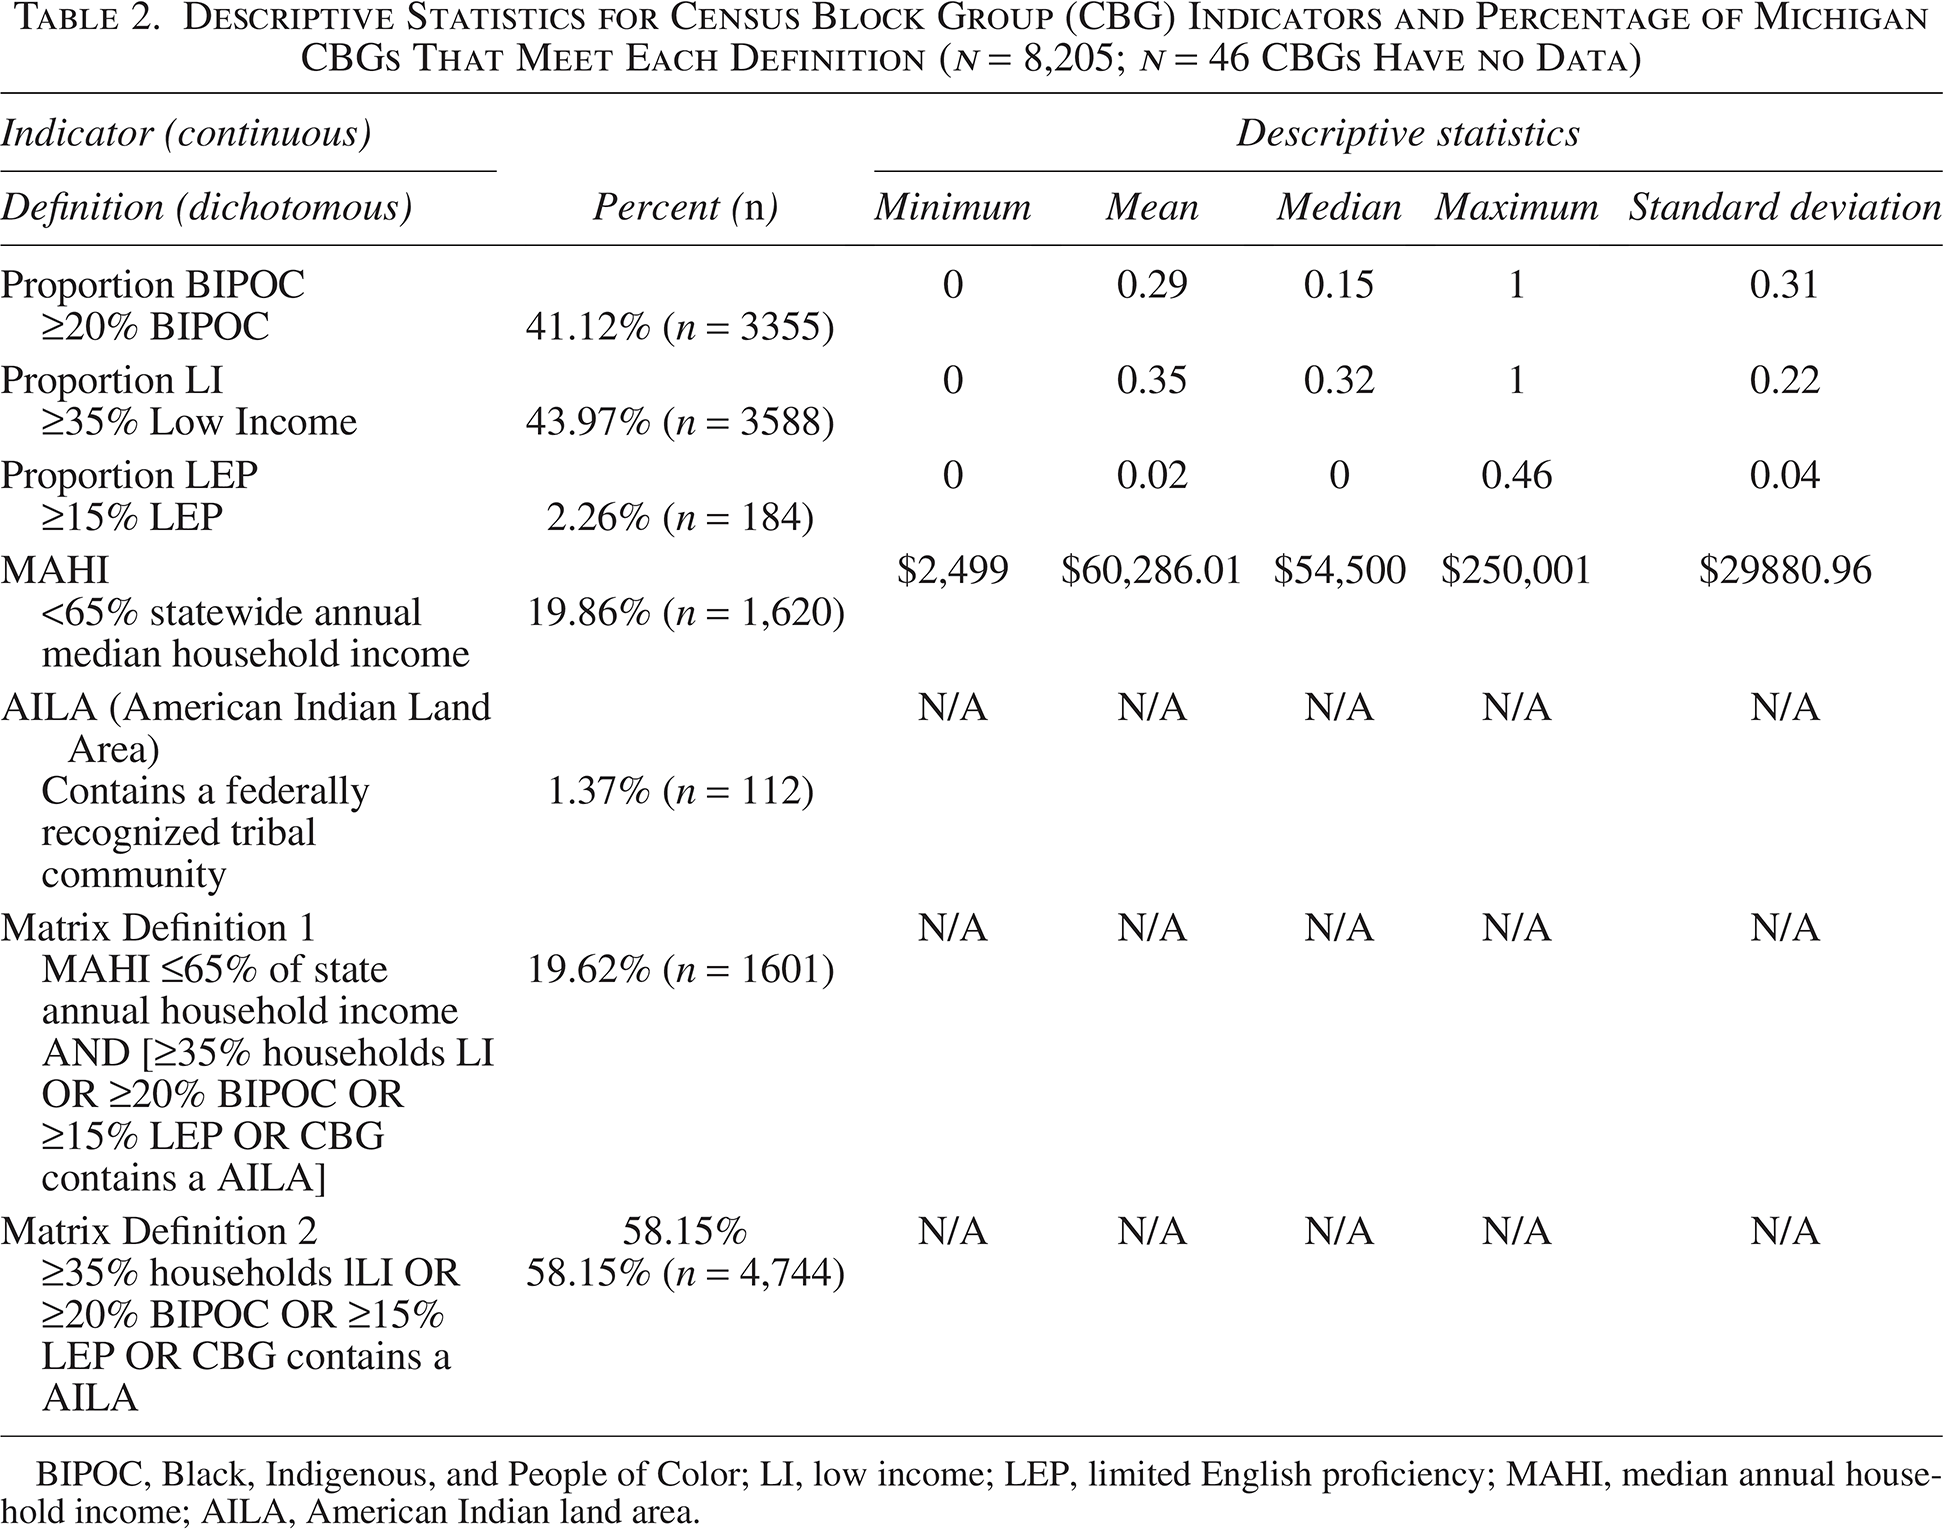
BIPOC, Black, Indigenous, and People of Color; LI, low income; LEP, limited English proficiency; MAHI, median annual household income; AILA, American Indian land area.
Figure 1 illustrates the distribution of CBGs identified using four definitions of overburdened: ≥20% BIPOC, ≥35% LI, Matrix Definition 1, and Matrix Definition 2. For reference, we also include a map of Michigan showing CBGs above the 50th percentile for rank ordered PM2.5 concentrations. These maps help visualize differences in locations identified using various definitions and their relationship to the distribution of CBGs with PM2.5 concentrations above the median. Definitions that emphasize income tend to capture more rural CBGs (which appear as larger areas on the maps due to less dense populations), compared with CBGs captured by definitions that foreground race and ethnicity (which appear as smaller areas due to more dense urban populations).
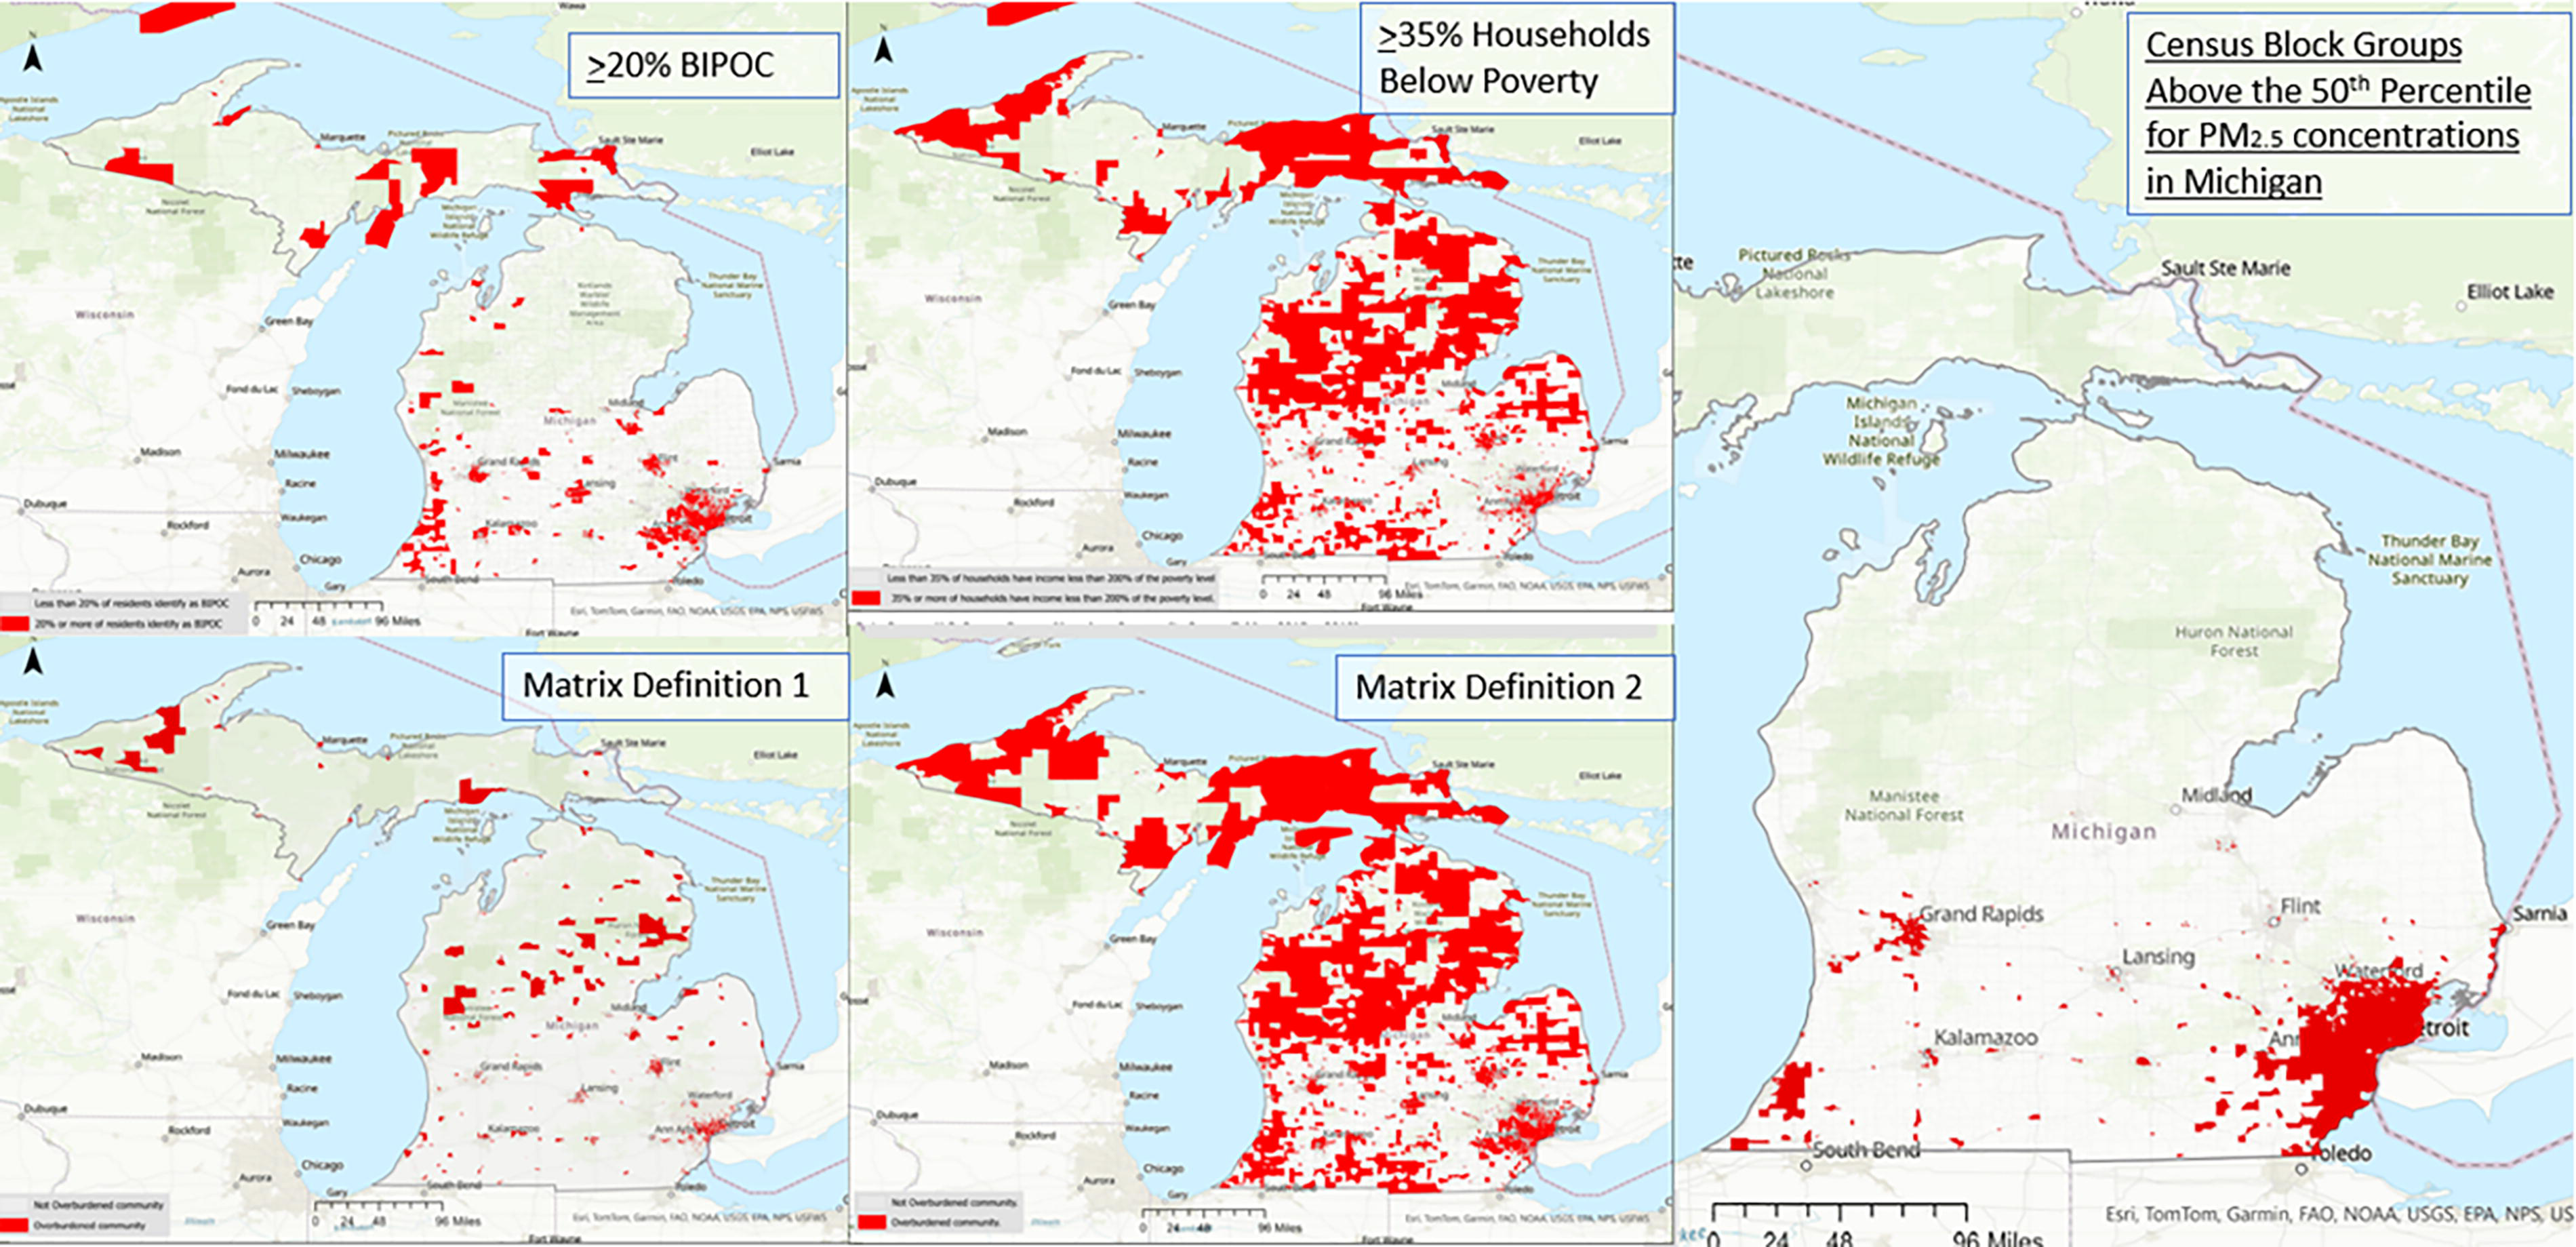
Maps showing Michigan census block groups identified by four metrics for identifying overburdened communities, and census block groups above the 50th percentile for PM2.5. *Matrix Definition 1: census block groups with annual median household income ≤65% of state median household income and [≥20% BIPOC OR ≥35% low income OR ≥15% LEP OR federally recognized tribal land area]. **Matrix Definition 2: census block groups with [>20% BIPOC OR <=35% low income OR ≥15% LEP OR federally recognized tribal land area.
We created a Pearson’s Correlation matrix with CBG sociodemographic characteristics and annual average PM2.5 concentrations. Results are shown in Supplementary Table S2 of the Supplementary Data and described briefly here. We found the strongest correlation between PM2.5 concentrations and OBC’s defined using >20% BIPOC, n (0.479, p < 0.001). We found more moderate correlations between PM2.5 concentrations and Matrix Definitions 1 and 2, LEP, and LI, ranging from 0.231–0.169. Correlations with AILA definition were inverse, and MAHI was not significantly correlated with PM2.5
Results from tests of sensitivity and specificity are shown in the Supplementary Data, Supplementary Table S3 (see Supplementary Data). The OBC definitions with the highest scores for both sensitivity (correctly identifying a high proportion of high PM2.5 CBG) and specificity (correctly ruling out those with low concentrations) were Matrix Definition 2, >20% BIPOC, and >35% LI. OBC definitions that used MAHI either alone or as a screener (e.g., Matrix Definition 1) had low sensitivity and high specificity. While LEP and AILA had high specificity, they captured just 4–6% and 0–0.1%, respectively, of high PM2.5 concentration CBGs.
To model implications of these differing OBC definitions for attaining environmental justice, we selected the three definitions with the highest sensitivity and specificity scores above (Matrix Definition 2, BIPOC, and LI). Because Matrix Definition 1 is currently included in legislation that has been introduced in Michigan, we also included it in our forecasting models, despite its relatively poor sensitivity. Estimates of rates of change using CACES data (2016–2019) indicated that PM2.5 concentrations were declining in Michigan overall, with non-OBCs experiencing greater reductions in PM2.5 concentrations compared with OBCs. These differential trends were significant for each of the definitions examined. For OBCs identified using the LI and Matrix Definition 2, PM2.5 concentrations were declining, but less rapidly than in non-OBCs. Reductions in CBGs with ≥20% BIPOC were only slightly different from 0 (no change), and OBCs identified by Matrix Definition 1 showed increases in PM2.5 concentrations during this time period (see Supplementary Table S4).
Figure 2 illustrates results from models that use these trends to forecast change in PM2.5 concentrations, 2019–2039, assuming continued BAU. For all four definitions, disparities in PM2.5 concentration increased over this period. The BIPOC definition showed the largest disparities in PM2.5 concentrations at baseline (0.25 μm/m3): More rapid declines in air pollutants in CBGs with <20% BIPOC and nearly flat rates of change on those with ≥20% BIPOC result in relatively large increases in disparities over time. The LI definition and Matrix Definition 2 show more modest disparities in PM2.5 concentrations at baseline (0.07 μm/m3 and 0.10 μm/m3, respectively), with modest increases in disparities over time. With Matrix Definition 1, OBCs initially had slightly lower levels of PM2.5 concentrations than non-OBCs: Patterns reversed in 2018 and disparities increased over time as PM2.5 concentrations increased in OBCs communities under this definition.
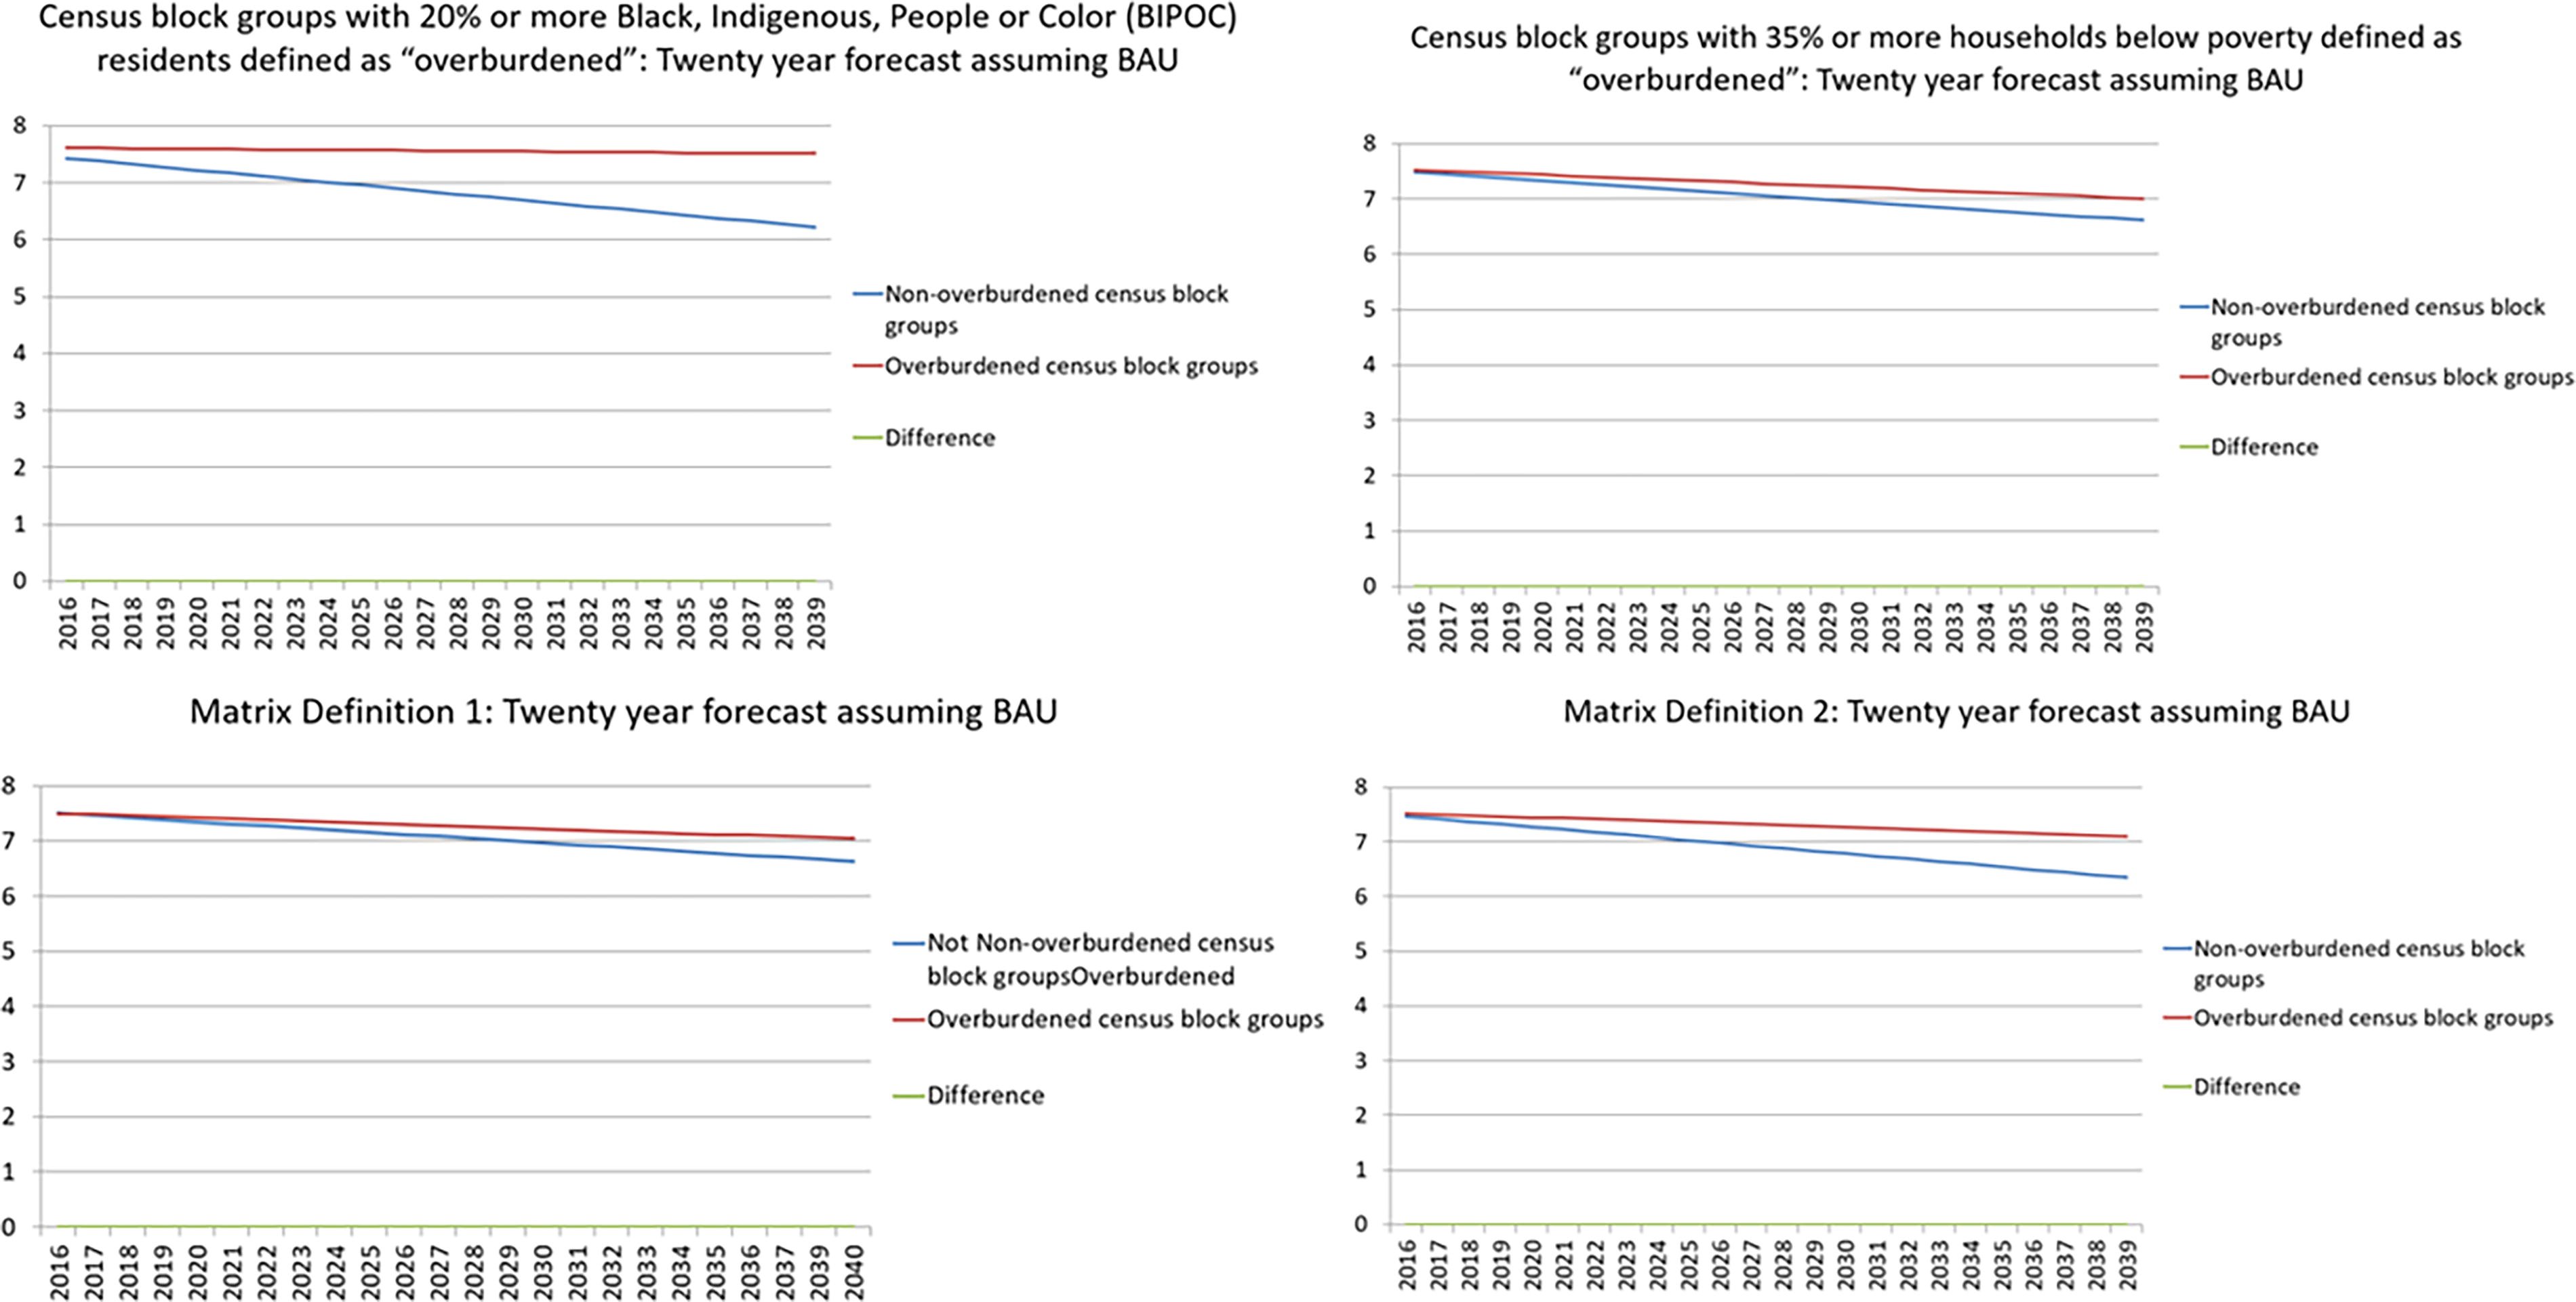
Twenty-year forecast, change over time in PM2.5 concentrations for “overburdened” and “not overburdened” communities using four illustrative definitions and assuming rates of change 2016–2019 continue (BAU scenario). *Matrix Definition 1: census block groups with annual median household income ≤65% of state median household income and [≥20% BIPOC OR ≥35% low income OR ≥15% LEP OR federally recognized tribal land area]. **Matrix Definition 2: census block groups with [>20% BIPOC OR ≤35% low income OR ≥15% LEP OR federally recognized tribal land area.
Figure 3 shows results from models forecasting change over the same 20-year period, applying six scenarios: BAU; incremental change scenarios with 25%, 50%, and 75% more rapid reductions in OBCs; and more aggressive change scenarios in which we assume hypothetical rates of reduction in OBCs that are doubled and quadrupled over those observed 2016–2019. In all scenarios, the 2016–2019 BAU rate of change was applied in non-OBCs.
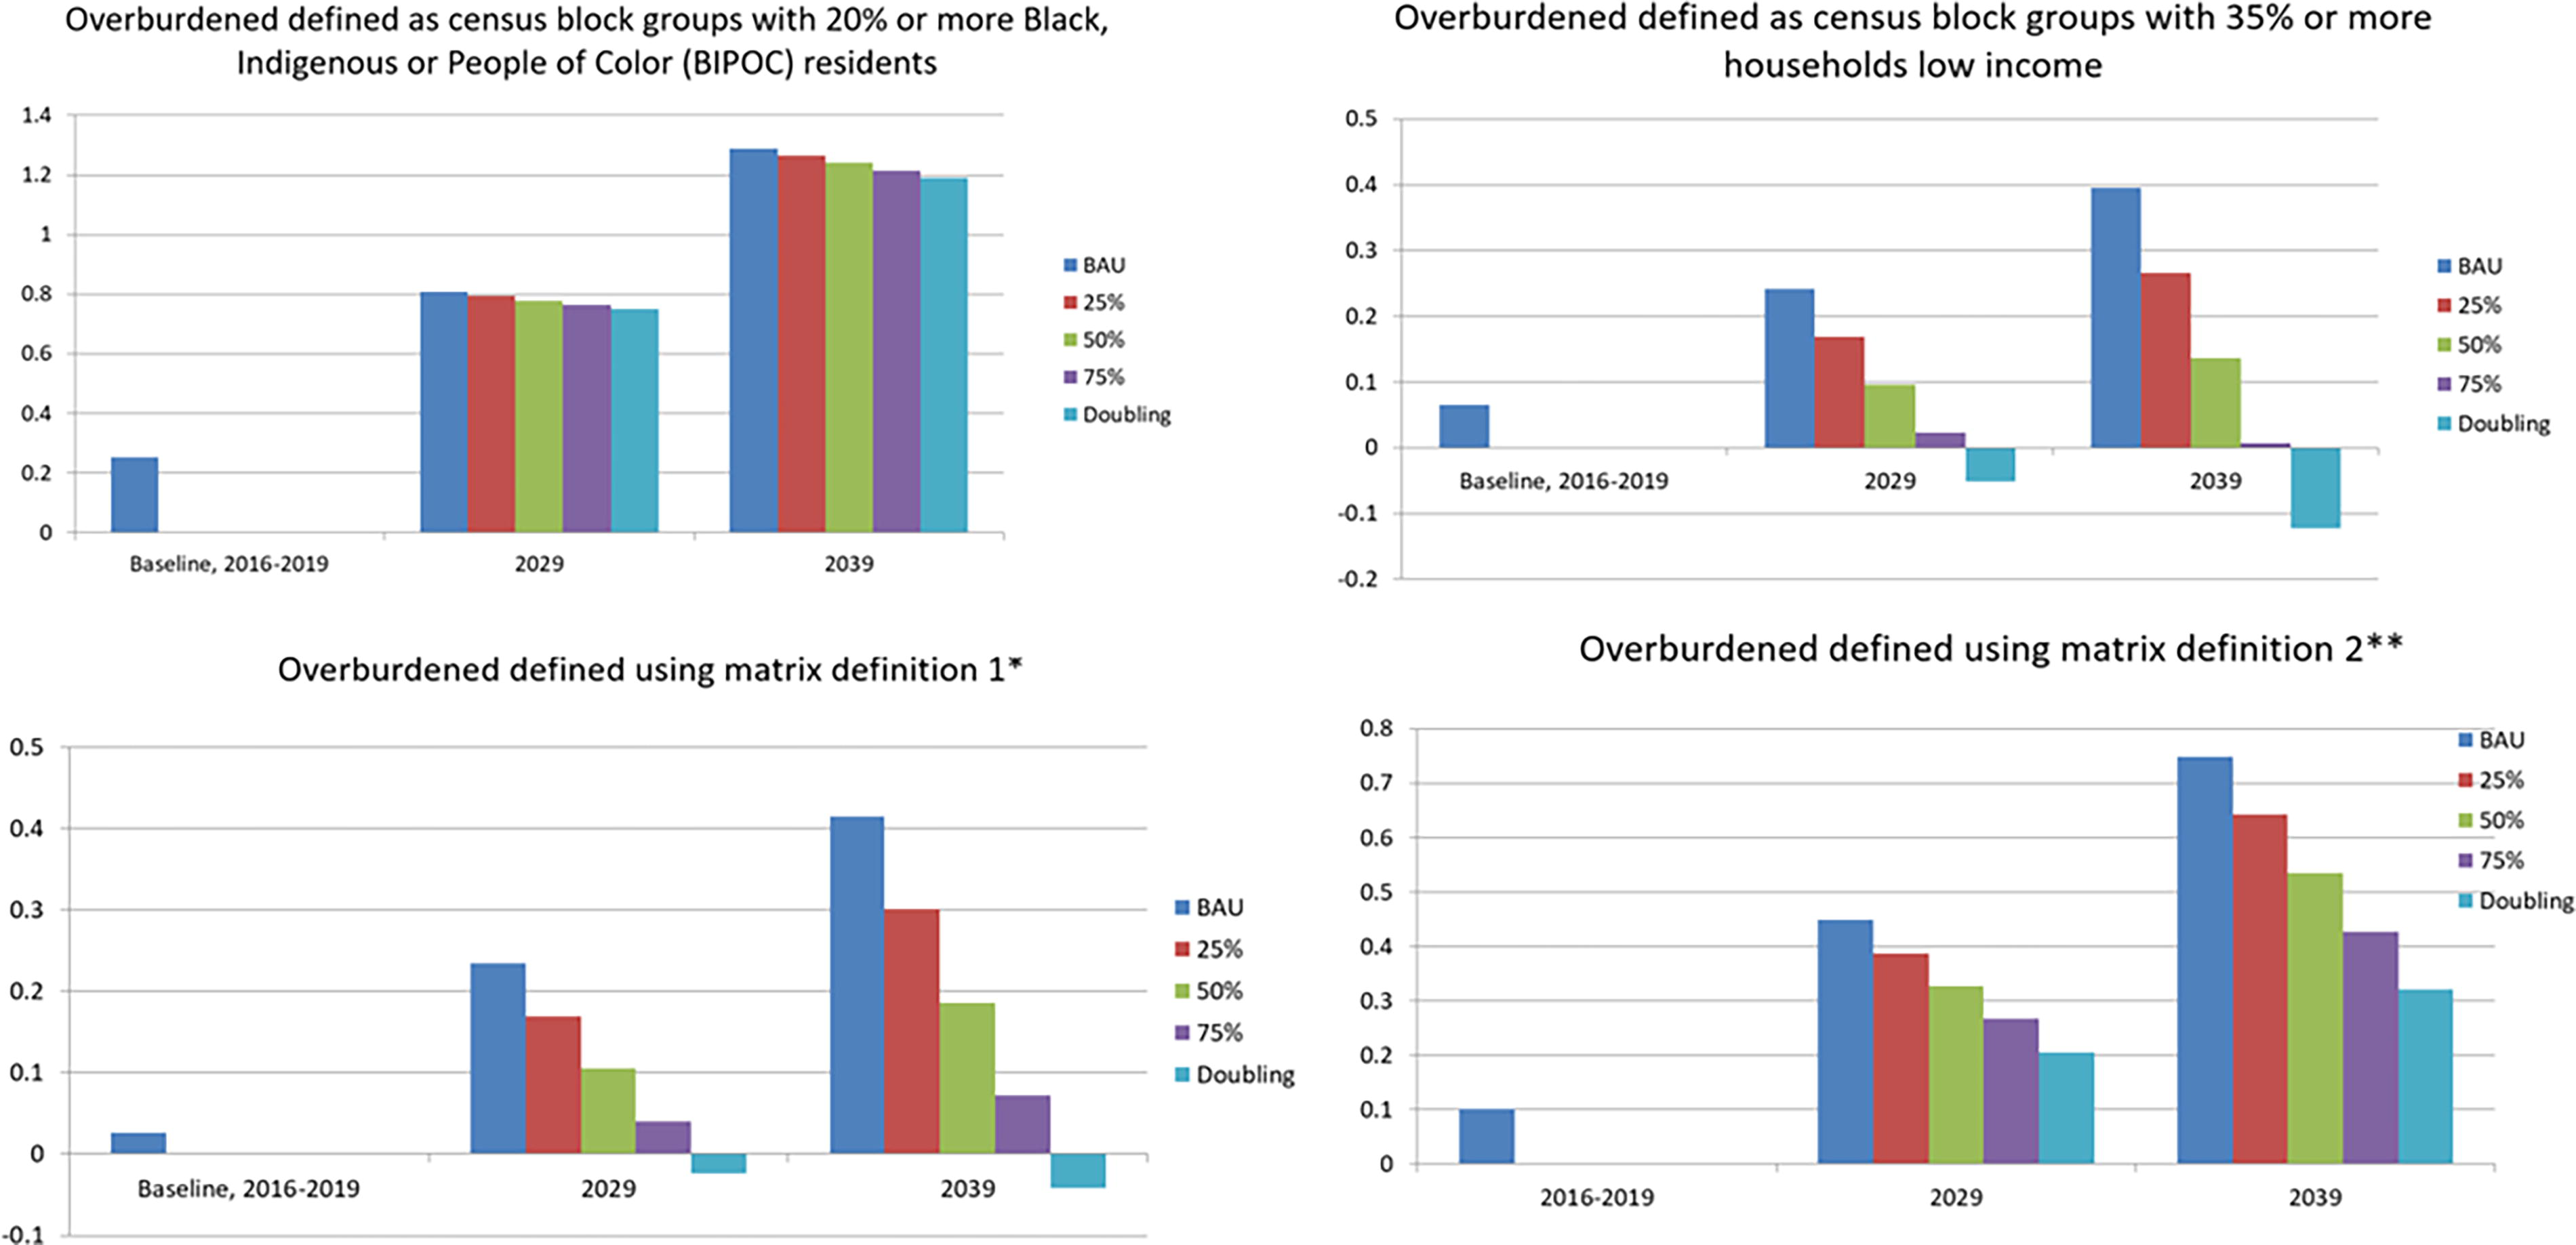
Difference in PM2.5 concentration between “overburdened” and non-overburdened census block groups: 20-year forecasts using four illustrative definitions and six scenarios (BAU, 125%, 150%, 175%, and doubling scenarios). *Matrix Definition 1: census block groups with annual median household income ≤65% of state median household income and [≥20% BIPOC OR ≥35% low income OR ≥15% LEP OR federally recognized tribal land area]. **Matrix Definition 2: census block groups with [>20% BIPOC OR ≤35% low income OR ≥15% LEP OR federally recognized tribal land area.
Regardless of how OBCs are defined, our modeled scenarios show increasing disparities between OBCs and non-OBCs over time, except under the most ambitious hypothetical modeling scenarios, which assume doubling and quadrupling of baseline (2016–2019) reductions in OBCs.
DISCUSSION
We examined three specific research questions to address our larger goal of understanding the implications of variations in commonly used definitions for identifying OBCs in state-level legislation for reductions in racial and socioeconomic inequities in air pollutant exposure over time. We discuss findings for each of these questions before turning to a discussion of implications for our larger objective.
What are commonly used sociodemographic indicators for identifying OBCs in state-level CI legislation?
The most commonly used sociodemographic indicators identified in our scan of state-level legislation using CI frameworks were indicators of the racial or ethnic composition of an area (e.g., percent BIPOC) and low income (e.g., percent below poverty). Other indicators included area-level Median Annual Household Income (MAHI), limited English language proficiency (LEP) and indicators of tribal land (AILA). Over three quarters of the legislative documents we reviewed used combination or matrix definitions, which are made up of more than one of these indicators. Definitions varied across states and across legislation introduced within the same state.
To what extent do those sociodemographic indicators identify communities with high levels of air pollutants?
Maps illustrating CBGs identified using four different definitions of OBCs show a wide range of locations identified, contingent upon the definitions used. The strongest correlations for continuous measures were between proportion BIPOC and PM2.5 concentrations, with moderate correlations for Matrix Definition 2, LEP, Matrix Definition 1, and LI. The absence of an association between PM2.5 concentrations and MAHI suggests that this indicator may be less useful in identifying CBGs that simultaneously experience excess PM2.5 and high vulnerability to its adverse health effects. Tests of sensitivity and specificity lend additional weight to the differential effectiveness of varying socio demographic indicators for identifying communities that also experience high PM2.5 concentrations. BIPOC definitions and, to a somewhat lesser extent, LI, correctly identified a majority of CBGs with higher PM2.5 concentrations and correctly ruled out at least half of CBGs with lower PM2.5 concentrations. Matrix Definition 2 had strong sensitivity, identifying three quarters of CBGs with high PM2.5 concentrations, but correctly ruled out only a small proportion of those with lower pollutant concentrations. Matrix Definition 1 identified only between a quarter and a third of CBGs with high PM2.5, while ruling out 4 out of 5 with low levels. These findings are consistent with a large body of evidence indicating that Black, Hispanic, and Asian residents are the most exposed to air pollutants in the United States, with significant but more modest differences between low and high income populations. Based on these models, matrix definitions using economic screeners (e.g., Matrix Definition 1, which uses a screener for MAHI) may be less effective in identifying Michigan CBGs with high concentrations of PM2.5 than other definitions examined here.
What are the implications of different definitions of OBCs for achieving more equitable distributions of PM2.5 across geographic locations?
Our final question examined the implications of applying these different definitions of overburdened in terms of the effectiveness with which they identify geographic locations where residents experience disparate exposures to PM2.5 and the scenarios under which those disparities might be reduced. Our findings are consistent with a large body of literature indicating the largest disparities in PM2.5 concentrations at baseline using the BIPOC definition for OBCs: Baseline disparities were more than double those observed using any of the other definitions examined. Under the BAU scenario, disparities increased over time for all definitions, with the greatest increases observed for the BIPOC definition and Matrix Definition 1. These scenarios were influenced by differential rates of change at baseline: OBCs defined using LI and Matrix definition 2 experienced declines in PM2.5 at baseline, although less steep compared with those in non-OBCs. In contrast, while PM2.5 concentrations declined in non-OBCs identified using BIPOC and Matrix Definition 1, under these scenarios, residents of OBCs experienced the same or even increased PM2.5 concentration, respectively, resulting in the greatest increases in exposure disparities over time.
Perhaps not surprisingly, given the smaller disparities at baseline and in rates of change, PM2.5 concentrations converged more quickly and under less aggressive scenarios using the LI definition, compared with the three other definitions examined. Even under the doubling scenarios examined, disparities in PM2.5 concentrations increased over the next 20 years using the BIPOC and Matrix Definitions 1 and 2. Only when the quadrupling modeling scenarios were applied were disparities eliminated (BIPOC) or reversed (Matrix Definitions 1 and 2).
Limitations and strengths
There are a number of limitations to the analysis presented here. First, our scan of legislation introduced and passed into law was broad, identifying any legislation that sought to identify communities currently overburdened with environmental exposures for a wide range of protections, to promote more just environmental decision making and exposures. Our case study examined a subset of definitions and thresholds within the context of one state (Michigan), using one measure of air pollution (PM2.5) to examine policy relevant questions related to implications for environmental and health justice. Decisions about OBC definitions may vary across states (e.g., reflecting differences in geography and population characteristics), and contingent upon the purposes (e.g., air emission permitting, prioritization of resource distribution), in ways that are not captured in our analysis.
Second, the measure of air pollution used in this article, PM2.5 concentration at the CBG level, captures ambient outdoor PM2.5 from all sources. It does not, however, capture gaseous pollutants such as carbon monoxide or sulfur dioxide, or air toxics, and is therefore not a measure of cumulative burden from all air pollutants. Our findings should not be extrapolated to the distribution of multiple air pollutants. Chaudhary and colleagues 45 argue that use of PM2.5 as a proxy for total air pollutants has the potential to underestimate the total impacts of multiple pollutants on health outcomes. 46 Further analyses of the air pollutant patterns and forecasts using, for example, indices that incorporate multiple air pollutants, are needed to more completely understand the patterns and associations with sociodemographic indicators used to identify potentially OBCs.
A third limitation of the analysis presented here is our assumption that the demographic characteristics of OBC communities remain static over time. Particularly for policy purposes, additional analyses that project trends over time in demographic characteristics, and their implications for which CBGs are defined as OBCs using different definitions will offer important additional information for decision makers.
Finally, we note that our use of CBGs in this analysis reflects the fine spatial scale that was used to define OBCs in a majority (58%, n = 18) of the 31 legislative documents that offered both specific definition of population characteristics and geographic units of analysis. However, of the total of 44 legislative documents reviewed, 13 (30%) either did not define OBC population characteristics or did not define a spatial scale, and 42% (n = 13) of those that defined OBCs used either census tract or zip code level. Findings reported here may not reflect patterns observed within legislation using those coarser spatial scales.
Despite these limitations, this article has a number of strengths. It is the first of which we are aware to identify commonly used definitions for OBCs for additional regulatory oversight in state-level legislation and the only of which we are aware to forecast the comparative implications of different OBC definitions for more equitable distribution of PM2.5, within the context of the state of Michigan. Given the importance of PM2.5 as a contributor to the overall health burden of air pollutants, and the multitude of evidence regarding racial/ethnic and socioeconomic disparities in the distribution of those burdens, the analyses presented here offer additional insights into the maldistribution of this pollutant, and the need for concerted attention to the types of strategic interventions necessary to reduce those environmental injustices.
Implications for reducing differences in PM2.5 concentrations and adverse health impacts
There are several key implications for understanding the effectiveness of different definitions of OBCs in achieving more equitable exposures and associated health outcomes. First, definitions used to identify OBCs captured substantially different geographic locations for additional scrutiny during environmental decision-making. These locations differed in the extent to which they correlated with PM2.5 concentrations, sensitivity in identifying CBGs with high pollutant levels, and specificity in ruling out CBGs with lower pollutant levels.
Second, the CBGs identified with the definitions examined here had significantly different baseline levels and rates of change in PM2.5 concentrations. CBGs with ≥20% BIPOC had significantly higher PM2.5 concentrations at baseline, and significantly smaller rates of decline compared to CBGs with <20% BIPOC residents and to those using LI and Matrix Definition 2. These Michigan-specific findings are consistent with well-established scientific literature documenting the largest disparities in air pollution exposure and their health related harms along racial and ethnic lines, 47 with significant but less dramatic differences between lower income and higher income communities. The divergent trends identified using Matrix Definition 1, with OBCs initially reporting lower levels of air pollution and then increased pollutant concentrations (contrary to both statewide trends and patterns observed in all other definitions) suggests the importance of close scrutiny of definitions used, the locations they identify, and their implications for understanding trends over time. In particular, the unusual use of the MAHI “screener” in Matrix Definition 1 results in patterns that differ markedly from those observed when using the same definition but without the MAHI screener (see results for Matrix Definition 2).
Third, results from forecasting models indicate that although PM2.5 concentrations generally declined over time, under BAU conditions they declined more rapidly in non-OBCs compared with OBCs using all definitions examined in this article: In other words, under BAU conditions, disparities are expected to
Elimination of disparities for these latter groups was only achieved under modeling scenarios that doubled or quadrupled the baseline rate of change in PM2.5 concentrations (2016–2019) in the OBCs. These findings suggest the need to identify and apply policy or engineering interventions that can achieve the more vigorous reductions in PM2.5 within OBCs in order to reduce PM2.5 concentration disparities and their inequitable impacts on health. When baseline rates of change in PM2.5 concentrations in OBC communities are indeed small, as was especially the case in models using the percent BIPOC and Matrix I definitions in this analysis, policy or engineering interventions that double or quadruple rates of reduction rates may reflect relatively small absolute changes in order to reach equity over time.
CONCLUDING COMMENTS
Together, the findings presented here suggest that states are actively applying frameworks that consider pollutant levels in conjunction with population characteristics-what we have termed CI frameworks-to promote more just environmental decision making and more equitable health outcomes. The specific scope and intent of such legislation varies, as do definitions of OBCs, and there are important policy-relevant questions about the implications of those differences for identification of communities that may be in greatest need of protections from additional pollutants. In this article, we examined two such questions, within the context of a single state and a single indicator of air pollution at a relatively fine spatial scale. Results from our analysis suggest that different definitions of OBCs identify substantially different geographic areas, with differences in pollutant burden, and with different trends in pollutant concentrations over time. Our finding that OBC definitions that include race and ethnicity are more sensitive indicators of differences in PM2.5 are consistent with those reported elsewhere in the literature. They extend those previous findings substantially, through modeling the implications of efforts to promote environmental justice through additional oversight of new air emissions in current OBC. Specifically, our forecasting models suggest that if 2016–2019 scenarios continue (BAU), with more rapid reductions in non-OBCs compared with OBC communities, disparities in PM2.5 concentrations will increase in Michigan, regardless of OBC definition. Incremental reductions in PM2.5 concentrations in OBCs, using any of the definitions examined in this article, do not eliminate those increasing disparities, modeled over a 20-year period: They are eliminated only when reductions in OBCs are doubled or quadrupled, allowing OBCs to “catch up” with the more rapid PM2.5 concentration reductions in non-OBC communities. Our findings are consistent with calls for the use of improved methods to project and track the distributional impacts of new policies at finer geographic scales. 48 Models using varying definitions of OBCs, within different state contexts, and with a wider range of pollutant outcomes, are needed in order to better inform policy decisions that define OBCs and take action to promote environmental and health justice.
AUTHORS’ CONTRIBUTIONS
A.J.S. was responsible for conceptualization, funding acquisition, supervision, writing major portions of the initial draft, reviewing and editing; G.M.R.F. was responsible for background research, writing original text for portions of the article, reviewing and editing, and portions of the data analysis; R.d.M. was responsible for data curation and data analysis; G.M. was responsible for data curation and statistical analysis; G.Y. was responsible for background research, portions of data analysis and visualization; C.G. was responsible for methodology, review and editing; K.S. was responsible for conceptualization, review and editing; and L.B.D. was responsible for conceptualization, review and editing.
Footnotes
ACKNOWLEDGMENTS
The Community Action to Promote Healthy Environments (CAPHE) Partnership is a community-based participatory research partnership working to develop and implement strategies to reduce air pollution and its adverse health effects in Detroit. Partners include Detroit Hamtramck Coalition for Advancing Healthy Environments; Detroit Hispanic Development Corporation; Detroiters Working for Environmental Justice; Ecology Center; Great Lakes Environmental Law Center; Green Door Initiative; Southwest Detroit 48217; Michigan Department of Environment Great Lakes and Energy (EGLE); Michigan Environmental Justice Coalition; Sierra Club; Southwest Detroit Community Benefits Coalition; Southwest Detroit Environmental Vision; University of Michigan’s School of Public Health, University of Michigan-Dearborn. CAPHE builds on 20 years of community-academic partnerships including the Detroit Community-Academic Urban Research Center, the Healthy Environments Partnership and Community Action Against Asthma.
AUTHOR DISCLOSURE STATEMENT
The authors have no conflicts of interest to disclose.
FUNDING INFORMATION
This research was supported by the National Institute of Environmental Health Sciences (NIEHS) (#RO1ES022616, #R01ES032389) and the Fred A. and Barbara M. Erb Family Foundation, with additional support provided by the Michigan Center on Lifestage Environmental Exposures and Disease (M-LEEaD) (NIEHS #P30ES017885).