
Abstract
This article considers efforts to understand and respond to cumulative impacts of environmental burdens in Chicago, Illinois, to explore the efficacy of mapping as a policy tool to prevent and even reverse the disproportionate distribution of cumulative environmental burdens. It is well established that maps incorporated into formal laws and policies directly contributed to the U.S. environmental burdens landscape, spatially concentrating polluting industries in, and redirecting environmental benefits away from, areas where government action also forced communities of color to live. The question here is: if mapping got us into this mess, can mapping get us out? Spatial data-based mapping tools such as the U.S. Environmental Protection Agency’s EJScreen can produce compelling representations of environmental justice geographies. These representations have advanced the saliency of demands for policy reform from the environmental justice movement because such maps use ostensibly objective public data to dramatic visual effect, especially when drawing comparisons to reveal profound racial and class disparities in pollution burden, ambient environmental quality, and access to environmental amenities. Cumulative impact mapping can therefore be considered a kind of counter-mapping that advances critical cartography’s key claim that maps are not neutral arbiters of truth but instead help create social realities. In recent years, Chicago advocates have harnessed counter-mapping tools to oppose specific industrial siting decisions and demand systemic reform of land use frameworks. This article offers a case study of the campaign against the proposed relocation of General Iron’s scrap metal shredder in Chicago, which deployed a counter-mapping strategy that resulted in novel, ongoing cumulative impacts policy reforms at the city and state level. This article closes with observations to inform efforts in Chicago and elsewhere to incorporate EJ counter-mapping or geographic scoring approaches into public policy decision-making processes.
The world has literally been made, domesticated and ordered by drawing lines, distinctions, taxonomies and hierarchies: … maps provide the very conditions of possibility for the worlds we inhabit and the subjects we become.
John Pickles
A History of Spaces
Together, we can and will make Chicago a place where your zip code doesn’t determine your destiny.
Mayor Lori Lightfoot
No matter what socioeconomic and racial equity variables one plots on a map of Chicago, an unmistakable pattern of geographical inequality reveals a starkly divided city (Fig. 1). While maps wield considerable power in disclosing stubborn disparities, it remains an open question whether—and how—mapping can be integrated into policy processes in order to address them. This question lies at the heart of ongoing efforts around the nation to leverage cumulative impact mapping in the context of policy reforms. We explore questions about the efficacy of mapping in this article through the case of contemporary Chicago, where local advocates’ use of cumulative impact mapping to fight the relocation of a noxious industrial facility grew into a wider effort to amend the city’s land use planning policy and practice—an effort that continues as this article goes to press amid tectonic changes in the national EJ landscape.
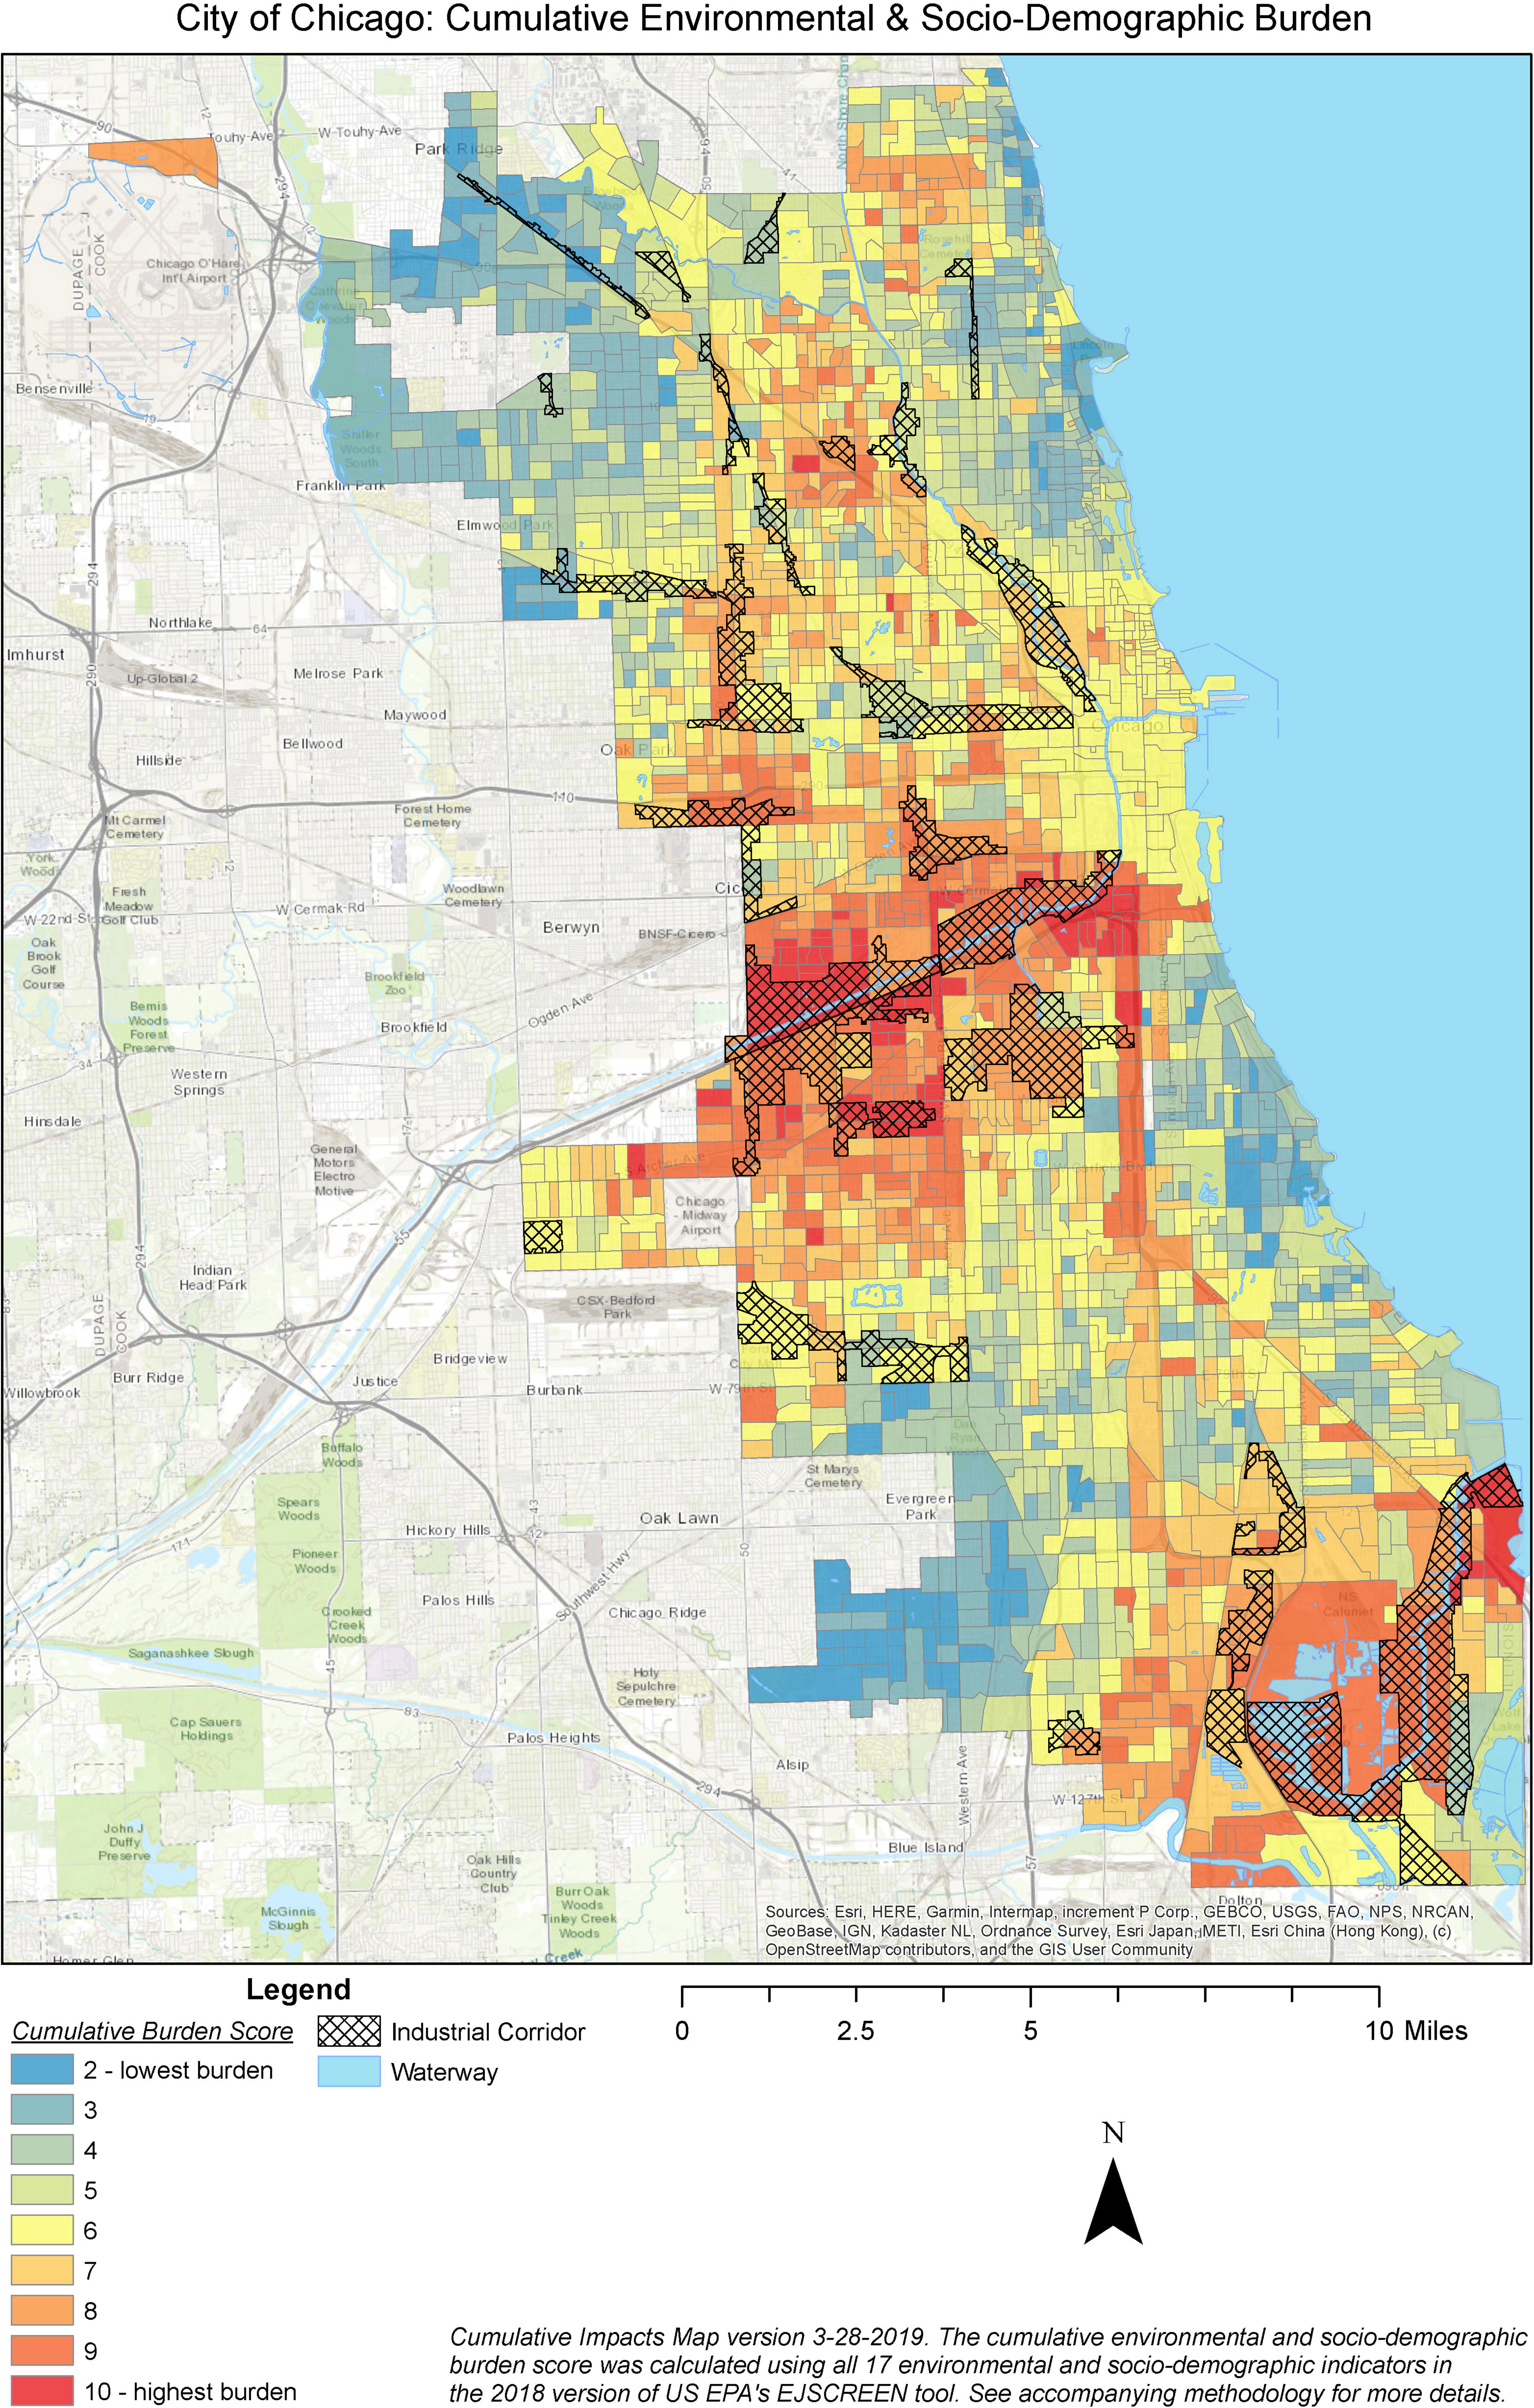
NRDC cumulative impacts map of Chicago.
We locate cumulative mapping within the dynamic field of critical cartography and its key tenets about how maps produce social facts, how mapping is thereby an exercise of power, and how communities are wresting control of the cartographer’s tools to advance demands for justice. The article begins by tracing the emergence of critical cartography’s fundamental reassessment of maps as simple representations of social reality, and its corollary argument that maps have always been arbiters of social reality. We then follow critical cartography’s influences outside the academy into the realm of so-called “counter-mapping,” which has become an umbrella term for “any effort that fundamentally questions the assumptions or biases of cartographic conventions, that challenges predominant power effects of mapping, or that engages in mapping in ways that upset power relations.” 1 We suggest the use by community organizations and public interest advocates of spatial data-based mapping tools in public policy reform efforts fits squarely within counter-mapping’s theory and practice.
The article then pivots to the case of Chicago and its experience with EJ counter-mapping. We consider how the city’s first official cumulative impacts map recreated a map initially generated by local EJ advocates and was borne of a campaign to prevent a metal recycling facility from relocating from a rapidly revitalizing and predominantly White and wealthier north side area to a south side neighborhood that experiences both historic and ongoing disproportionate environmental burdens. The novel use of civil rights legal strategies by campaign advocates changed the terms of discussions around the relocation to daylight the historic and pervasive context of Chicago land use policy in ways that transcended the metal recycling case. Perhaps not surprisingly, the famously contentious arena of Chicago mayoral politics figured into the city’s agreement to revamp its zoning policies. As the saying goes, “all politics is local,” and the same is true in understanding effective strategies to integrate cumulative impacts mapping into government policy.
The article concludes with reflections rooted in the Chicago experience on challenges facing the broader movement to incorporate counter-maps using EJ screening tools, such as recent legal developments involving the use of race in government policy. Bracketing this entire article, of course, are the fundamental shifts and outright reversals in the relevant federal legal, policy, and data spaces since the 2024 election. We conclude with reminders that counter-mapping is exempt from neither the trepidations of making choices about where to draw the line, nor the traps of unavoidable stagnancy of maps purporting to represent highly dynamic social and spatial processes.
THE TURN TO CRITICAL CARTOGRAPHY
Cartography—the putative science of map-making—helped cement geography’s status during the 20th century as the expert source of knowledge about spatial representations. For example, geographers occupied prominent positions in the Office of Strategic Services during World War II, charged with producing useful military maps in a cartographic environment rife with propaganda. Crampton and Krygier 2 relate how wartime concern with “clear, efficient and effective” map design carried over to postwar academic preoccupations with scientific methods and “the look and form” of maps. “In the postwar era, cartographers came to identify any relationship of mapping with politics as bias, lies and exaggeration.” 3 A lingering wariness about the deployment of maps as propaganda foreclosed frank disciplinary discussion of the politics of map-making.
Nonetheless, from the 1950s through the 1970s, driven by post-colonial movements abroad and social movements at home, questions about cartography’s complicity in imperialism, dispossession, and displacements became rallying cries among a new generation inspired by emerging critiques of the role of science in society. Increasing attention was paid to how maps inscribe power and support dominant political structures. Denis Wood’s 1992 book The Power of Maps 4 forcefully demonstrated how maps can embody social and political interests that are typically hidden. His work so captured the changing cartographic zeitgeist that it became a national bestseller and the basis for a major exhibition in the halls of the Smithsonian Institution. As the 20th turned to the 21st century, geographers exposed cartography’s “hidden agenda” of apolitical claims and pretense to accuracy and objectivity and advanced the notion that the map is
… a social product and a social actor, a product of and embedded in complex networks of social relations and interests. Like any other technology and product, the map must be interrogated in its social contexts of emergence, dissemination, and use. 5
The turn to critical cartography was buttressed by the “rediscovery” of the residential security maps developed by the Home Owners Loan Corporation (HOLC), 6 a project that stands as a perhaps peerless embodiment of cartography’s “hidden agenda.” To revive the troubled housing market during the Great Depression, HOLC devised a risk assessment plan to guide public and private lenders that depended on researchers fanning out across the nation, in cities large and small, to collect purportedly neutral, factual data about individual properties that were aggregated into a four-part neighborhood valuation scheme. Cartographers then developed representations of the survey “findings” in color-coded security maps. As is well documented, HOLC’s guiding framework was steeped in urban ecology’s founding notions of “invasion and succession” as a determinative process whereby new immigrants and African American migrants in cities drove property devaluation by virtue of their mere presence. 7 Racialized assumptions about what raised or maintained property values (exclusively residential neighborhoods of relatively new single-family homes occupied by White people) or threatened them (multifamily housing, mixed land use, and above all the presence of non-White people) were inscribed into the survey instruments. HOLC’s maps were less a reflection of Depression-era urban housing conditions and rather more an indication of an already consolidated political commitment to enshrining segregation as the guiding principle in the nation’s housing market.
The rest, as they say, is history. 8 HOLC maps concretized urban social and spatial inequalities whose long-term effects are still being experienced and assessed. One recent study of California cities found that “formerly redlined neighborhoods have distinct ecologies compared with greenlined neighborhoods,” 9 including poorer air quality and intensified urban heat islands. A growing body of public health scholarship has offered fresh revelations about the overlap and co-occurrence of environmental quality indicators and population health outcomes in formerly redlined urban zones.10,11,12
THE MAP IS DEAD: LONG LIVE THE COUNTER-MAP
One might expect a critique of the politics of mapping to weaken the power of the map and to work against a transition putting maps into more people’s hands. But just the opposite has happened. 13
Critical cartography forced a recognition that maps cannot be considered neutral or unproblematic spatial representations. That reckoning furthermore called for “… the production of new maps for new worlds … in the interest of broader democratization of knowledge and information,” 14 signaling that the reach and impact of critical cartography should extend far outside the discipline of geography and boundaries of academia writ large. “Cartography has been slipping from the control of the powerful elites” in no small part because the practice of collecting and representing spatial data “… is passing out of the hands of the experts. The ability to make a map, even a stunning interactive 3D map, is now available to anyone with a home computer and internet connection.” 15
But technology originally had little to do with birthing this “people’s cartography,” which owes rather more to community-based mapping practices developed in the global south. In the early 1990s, environmental sociologist Nancy Peluso first coined the phrase “counter-mapping” to describe Indigenous map-making practices in Kalimantan, Indonesia, where customary forest use by Indigenous populations was threatened by government planners seeking to monetize forest resources. 16 Because of their situated local knowledge, local groups could “claim power through mapping by using not only what is on a map, but what is not on it. One effect of having multiple maps of a single forest, for example, could be to challenge the accuracy of a ‘standard’ map used for planning.” 17 Peluso’s research powerfully demonstrated how maps can offer alternatives to the language and images of power and themselves “become a medium of empowerment or protest” that can “greatly increase the power of people living in the mapped area to control representations of themselves and their claims to resources.” 18
Since its introduction, counter-mapping theory and practice have developed along a few different paths. In our view, the one most closely aligned with EJ work derives from Peluso’s original identification of counter-mapping practice as a “tactic for confronting unequal geographical power relations and achieving local political goals.” 19 Consistent with the wider counter-mapping movement, cumulative impact mapping can reflect and, at its best, incorporate community-based local knowledge and lived experience of environmental burdens to reveal spatial inequities and, crucially, to compel public policymakers to recognize and act to ameliorate those inequities. 20 For example, California-based “Mapping for Environmental Justice” describes its mission as creating “maps [that] demonstrate the intersection of socioeconomic factors, environmental effects and pollution, and public health outcomes in an intuitive, accessible format.” 21 Maps can be used “as a tool to advocate against these injustices and create policy change so that all people can enjoy healthy, safe places to live.” 22 Likewise, community organizing that successfully led to early environmental justice legislation in Minnesota utilized “a collection of maps showing environmental and demographic data layers and manually laying them on top of one another.” 23
The EJ counter-mapping movement has encouraged government agencies to use publicly available data to visualize cumulative environmental impacts and identify “environmental justice communities.” As of 2022, “[t]hirteen states (CA, HI, IL, MA, MD, MI, MN, NJ, NM, NY, OR, VT, WA) were identified that have legislation, mapping tools, and/or agency guidance documents that include consideration of CI. Four of these 13 states (CA, MN, NY, WA) ha[d] developed, or are currently developing, geo-spatial mapping tools for expressing [cumulative impacts].” 24 Since 2022, several of these states have advanced cumulative impacts projects, and other states and local jurisdictions have launched efforts that, like Chicago’s, reflect specific geographical circumstances.
Government agencies have begun using these new visual tools as a means to prioritize areas identified as bearing disproportionate environmental burdens to guide programs that distribute funding or other benefits. 25 “At the state level, California and New York have enacted legislation targeted at redistribution” based on cumulative impacts scoring maps implemented by state agencies. 26 In Illinois, the “Solar For All” program uses a cumulative impacts geographic scoring approach, developed with robust public participation and environmental justice organization leadership, to identify communities that receive particular financial and resource support for renewable energy development. 27 “Prioritizing vulnerable communities for attention, engagement, and resources is a good first use of this information.” 28 These and other state initiatives might suggest counter-mapping-inspired policies are well on their way to becoming the law of the land. In fact, such initiatives face an increasingly uncertain fate after the 2024 election, as the current administration has forcefully repudiated—and banished federal policies recognizing—the very principle of disparate environmental impacts.
The fate of state- and local-level disparate impact policies remains an open question. Nonetheless, and as discussed in the following Chicago case study, policymakers there are still attempting to integrate cumulative impact mapping into more proscriptive government decision making, such as environmental permitting and local land use determinations.
COUNTERING GENERAL IRON WITH CUMULATIVE IMPACTS MAPPING
The cumulative impacts mapping story in Chicago and in Illinois is a microcosm of nationwide and global trends in the use of spatial data to effect change. Community groups and their allies have used maps to dramatically highlight environmental racism and to support public, political, and legal campaigns. Agencies and the state legislature have used mapping to inform the distribution of benefits. Now, Chicago and Illinois stand at the forefront of integrating cumulative impacts mapping into policymaking, with efforts underway to deploy cumulative impacts mapping to guide substantive environmental permit and land use decisions. The incorporation of spatial representations of disparate impacts into such public policy formations realizes a central goal of EJ advocates’ counter-mapping efforts.
A necessary starting point is understanding the abiding connections between residential geography and social and environmental conditions that contribute to the quality of life in Chicago. Mayor Lori Lightfoot’s quotation at the outset of this article is not only a pithy summation of something Chicagoans observe and experience daily, but also a reminder of how those experiences can be reflected in a paradigmatic American mapping tool: the zip code. 29
While generations of Chicagoans have understood intuitively the repercussions of the city’s deep racial segregation, only recently have advocates begun using mapping to illustrate those consequences to catalyze environmental justice policy reform. The breakthrough mapping effort dates to 2018, when the Natural Resources Defense Council (NRDC) published the first “Chicago Cumulative Impacts Map.” This map (Fig. 1) leveraged U.S. Environmental Protection Agency (USEPA) EJScreen data to present environmental and sociodemographic metrics for census tract comparisons throughout Chicago. 30
The timing of NRDC’s map release was no coincidence. Its publication was part of a counter-mapping strategy deployed by one of the city’s most historically burdened communities in its effort to oppose yet another polluter moving into its midst. Though NRDC provided technical expertise, the map, along with a parallel map in Newark, NJ, was co-created with community leaders in both cities, working “in close partnership to develop a method that could assess cumulative environmental burdens in those two cities and potentially be used in other places.” 31 Through her leadership in the Southeast Environmental Task Force (SETF) and long experience living in that environmentally burdened neighborhood, one of the co-authors of this article, Olga Bautista, was both a co-creator of the NRDC map and co-author of the white paper explaining it. 32 As she relates, the map began with community groups and the NRDC having “initial discussions [that] revealed that communities are eager to use cumulative impacts maps and analyses to inform land use and economic development policies.” 33
The backstory here is a revealing tale of two cities. For decades, residents of Chicago neighborhoods straddling the North Branch of the Chicago River complained about the dust, smells, and air pollution coming from the General Iron scrap metal shredder. The city received complaints weekly about General Iron, two 2015 fires there blanketed the area in smoke and dust, the facility was cited repeatedly for violations by the City and USEPA, and researchers had documented high levels of pollution from the site. 34 The neighborhood was also changing. General Iron’s north side industrial neighbors had been vacating the North Branch for decades while wealthier and whiter gentrifying neighborhoods squeezed the shrinking industrial corridor from both east and west. Cheered by aggressive commercial and residential developers eyeing the North Branch of the Chicago River for a transformative megadevelopment, then-Mayor Rahm Emmanuel put a plan in action that would facilitate getting General Iron out of the north side.
Chicago’s “Industrial Corridor Modernization Initiative” of the mid-2010s involved the City actively working with industrial polluters on the north side to find new homes in so-called “receiving corridors” elsewhere in the city. The idea was to keep industry from moving out of Chicago entirely, but also keep industry out of those parts of Chicago to which City Hall was most politically responsive, namely the predominantly whiter and wealthier North Side. After discussions with the City in 2016, General Iron decided to relocate to a Southeast Side site in a designated “receiving corridor” where its corporate affiliate already operated. In September 2019, the City and General Iron announced that it would wind down north side operations and make an “efficient and expeditious” move to the Southeast Side, without any specific commitments or community benefits. 35
But by that time, the cumulative impacts map co-created by community advocates and the NRDC was in circulation among local EJ advocates and threatening to upend Emmanuel’s “win–win” plan for General Iron’s relocation. The trouble began with the recognition that the Southeast Side location happened to be across the street from a public high school and continued with revelations that the new site also happened to be in a community that was roughly 83% Black or Hispanic and experienced 77% of all toxic substance releases citywide. 36 Not coincidentally, the Southeast Side is also home to community-based organizations with decades of experience living with and fighting against environmental racism in Chicago, including those directly involved in co-creating the cumulative impact map.
Spurred by students at that nearby high school, anchor EJ organizations People for Community Recovery (PCR) and the SETF organized escalating community opposition throughout 2019 and 2020. Despite being one of the areas of the city hardest hit by the COVID-19 pandemic, the Southeast Side showed up to protest at every in-person and online public meeting. Community members traveled across the city to march in front of the homes of Mayor Lightfoot, who had inherited the relocation plan from her predecessor.
During the same period, the City granted a series of land use approvals and building permits to General Iron, and the Illinois Environmental Protection Agency (IEPA) issued the company a Clean Air Act construction permit. Community outcry greeted each and every public comment opportunity, beseeching the City and IEPA to consider the fact that a notorious serial polluter from the North Side would be added to an area that already suffered far more than almost any other part of the city from industrial pollution and associated public health harms. In the written comments submitted by residents and advocates, the NRDC map appeared again and again as testimony and testament to the power of maps to create social facts.
By December 2020, General Iron had decommissioned its north side facility, completed its Southeast Side facility, and awaited a single City permit to begin operations. But by then, and at long last, the Southeast community started to be heard. After about 30 people went on a month-long hunger strike, USEPA administrator Michael Reagan visited in May 2021 and suggested the city consider cumulative impacts in reviewing that final permit application.
The City denied the final permit in February 2022. Central to its decision making were facts collected in a “Health Impacts Assessment” that deployed the City’s newly created “Air Quality & Health Index” map that revealed the impacted communities already “rank[ed] among the highest in Chicago for vulnerability to air pollution.” 37 At this writing, the City’s denial of that final permit remains under judicial review. The facility’s current corporate incarnation is asking a state appellate court to force the City to issue the permit. 38
LIMITS OF ENVIRONMENTAL LAW AND OPPORTUNITIES FOR CIVIL RIGHTS STRATEGIES LEVERAGING CUMULATIVE IMPACTS MAPPING
Community groups and their allies fighting the General Iron relocation aggressively and creatively identified every available procedural opportunity to voice their objections. The cumulative impact map they co-created with NRDC became a powerful visual statement accompanying community testimony. Despite the attention and support they gathered for their case; however, the Southeast Side community groups reached the inescapable conclusion that traditional environmental law offered them no remedy with General Iron. They therefore turned to civil rights legal strategies to assert their claims about cumulative and disparate impacts. In so doing, the City of Chicago itself became the primary focus of advocacy efforts, as it was the City’s practices and policies that created the conditions and incentives for General Iron’s proposed relocation.
Title VI of the federal Civil Rights Act prohibits discrimination on the basis of race, national origin, and other protected classifications in the administration of any program that receives federal funding. 39 In cases where discrimination is not the explicit intent of the federal-funding recipient but its actions nonetheless create racially disparate impacts, the U.S. Supreme Court has held that victims of such discrimination cannot sue directly in court. 40 Instead—and at least in the multiple decades prior to the current Presidential administration—victims of such discrimination must ask the federal agencies that provided the funding to step in and enforce Title VI themselves.
Employing this legal strategy in December 2020, SETF, joined by PCR and the Southeast Side Coalition to Ban Petcoke (SSBPC) filed two separate formal civil rights complaints with both the Department of Housing and Urban Development (HUD) and USEPA.
SETF and PCR submitted a formal Title VI complaint to HUD alleging that the City, which receives millions of dollars in HUD funding, was actively facilitating General Iron’s relocation for the specific purpose of relieving White north side neighbors while harming Black and Brown Southeast Side communities. The HUD complaint explained how the history of Chicago’s de jure racial residential segregation and the City’s affirmative industrial land use policies and practices combined to create a funnel for pollution into the City’s Black and Brown communities. 41 Once again, the co-created NRDC map proved crucial. When HUD issued a “Letter of Findings” formally agreeing with the allegations in the complaint, it included a map comparing racial segregation with the 2020 City Air Quality and Health Index map. 42 The Air Quality map had emerged directly from discussions with co-creators of the NRDC map and had the effect of lending an official imprimatur to the collective counter-mapping effort. 43
SETF and the SSBPC also filed a Title VI complaint with USEPA that alleged the Illinois EPA’s air permitting process that granted General Iron its Clean Air Act construction permit created disparate impacts on communities of color. This separate USEPA complaint highlighted, among other failures, IEPA’s failure to provide proper public participation and IEPA’s willfully ignoring the cumulative impacts of multiple air pollutant sources in the context of existing and well-documented health disparities and burdens.
In the years since—while the General Iron facility has sat waiting on the appeal of that final City permit but is otherwise ready to open on the Southeast Side—both the HUD and USEPA civil rights investigations have closed with settlement agreements requiring significant reform at both the City and state agency. While a full review of the commitments made in those agreements is beyond the scope of this article, here we highlight some which bear directly on cumulative impacts mapping.
In May 2023, on the last day of the Lightfoot administration, HUD, the city, and SETF and PCR entered into a “Voluntary Compliance Agreement” (VCA), which resolved the civil rights complaint and required the city to implement a suite of “remedial actions.” Those remedial actions involved several City departments and included an obligation for the City to undertake a community co-created “Cumulative Impacts Assessment” that would be followed by a specific proposal for municipal code reforms to address those impacts and embed cumulative impacts considerations in land use law and policy. 44
After completing a process with deep community engagement, in late 2023 the City published its Cumulative Impacts Assessment. 45 The analytical heart of the assessment was an “Environmental Justice Index,” which combined metrics reflecting both environmental exposures and socioeconomic demographic sensitivities to calculate a single representative score for neighborhoods throughout Chicago. 46 When mapped, the new “Environmental Justice Index” produced spatial patterns strikingly similar to the NRDC map and earlier city efforts (Fig. 2). 47 The report closed with recommendations for city ordinance reforms to implement its findings, as the HUD VCA required. After completing the Cumulative Impacts Assessment in fall of 2023, the city missed HUD deadlines to follow through with its promised legislative reforms. 48 On April 16, 2025, however, Mayor Johnson’s administration finally introduced the “Hazel Johnson Cumulative Impacts Ordinance,” named for the founder of PCR and a founding mother of the Environmental Justice movement. 49
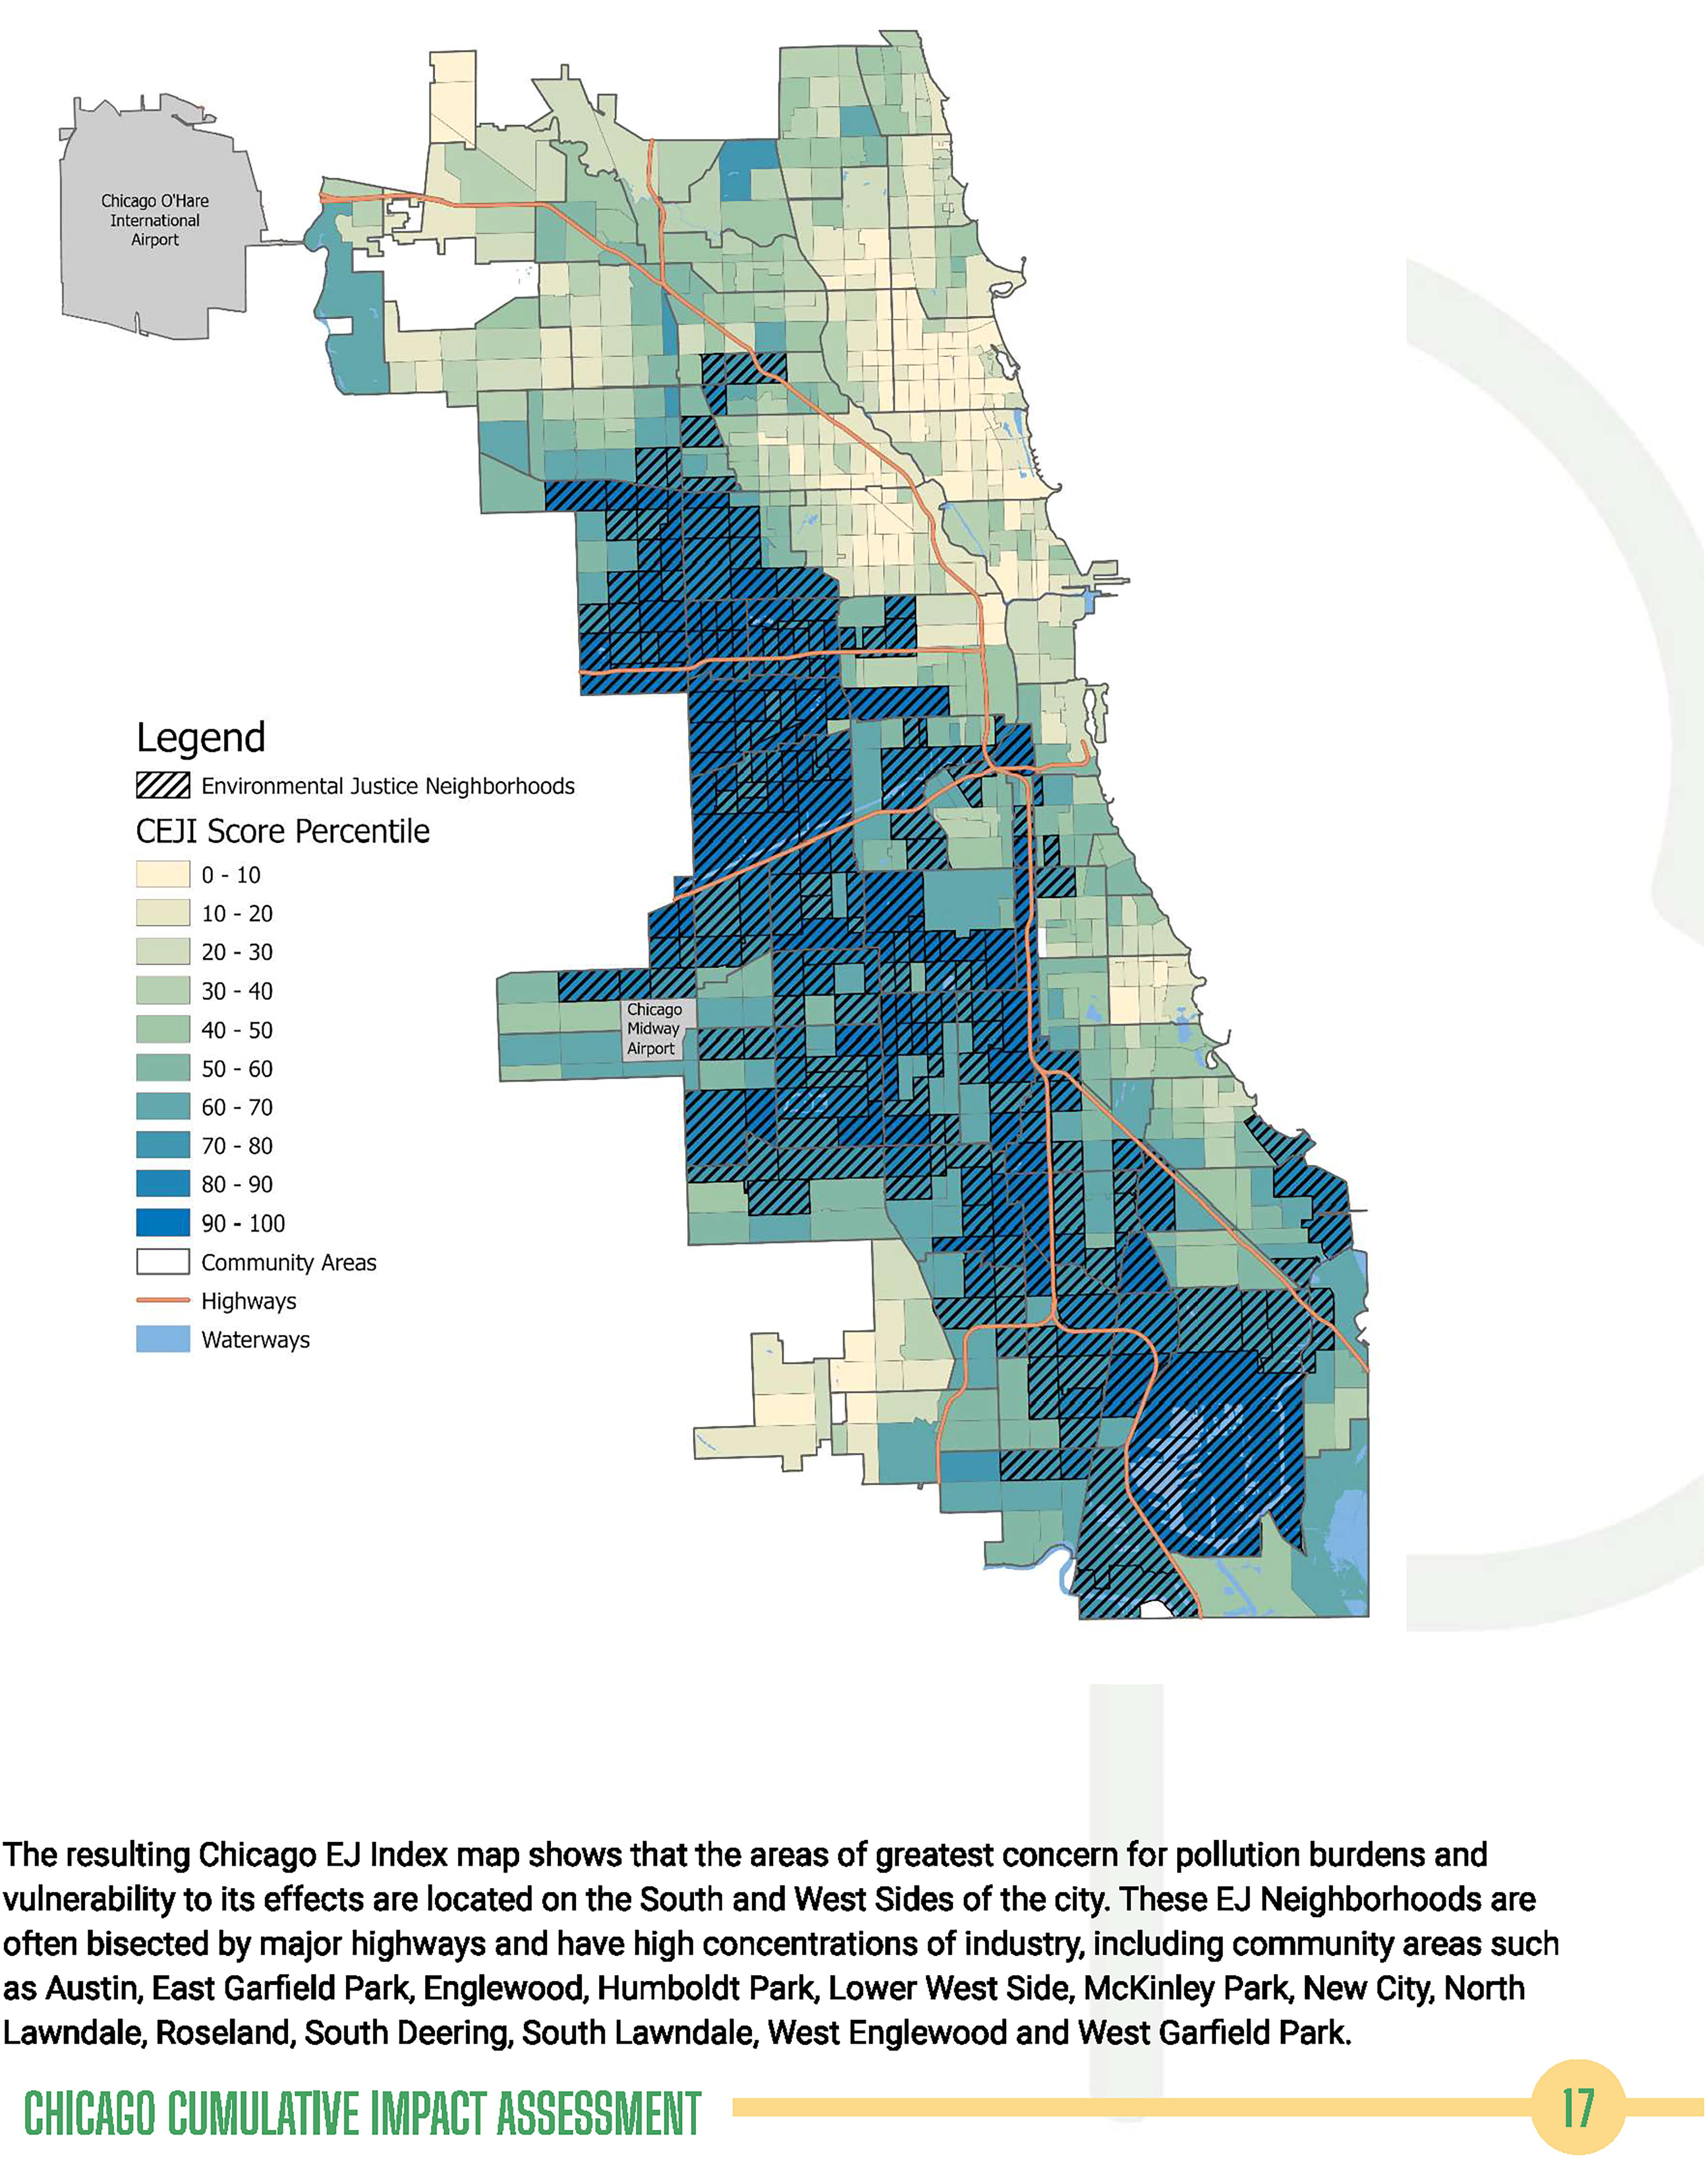
Chicago Environmental Justice Index.
On the state policy side, in February 2024, the USEPA complaint process concluded with a settlement between IEPA and its federal counterpart that will require the state agency to integrate civil rights analyses in its construction permit program. 50 Among other mandates, the settlement requires IEPA to use an existing environmental justice mapping tool as a screen to trigger both increased public participation processes and “further analysis” to assess the potential for cumulative and disparate impacts in the environmental and social context of the proposed construction-permitted activity. 51 IEPA agreed to consider various steps to mitigate potential disproportionate adverse impacts uncovered in the further analysis.
As an important outgrowth of the General Iron controversy, IEPA also committed to far more searching consideration of an applicant’s compliance history and to imposing permit conditions based on that history. 52 As an agreement between regulatory agencies, the settlement could not change underlying state statutes, such as provisions that set outdated and low permit application fees and limit air permit review processes to 180 days. 53 These time and resource constraints raise serious questions regarding the robustness of analyses to be done under the settlement and whether this model can be expanded to additional permit programs. IEPA has met its deadlines thus far in terms of public participation policy reforms; evaluation of changes to its permitting system will only be possible in the context of specific future permit applications.
In November 2024, USEPA published for comment its Interim Cumulative Impacts Framework that defines four basic methods to assess cumulative impacts: Single Scoring, Matrix Approaches, Community-based Approaches, and Exposure Modeling Approaches. 54 Each of those methods played a role in the Chicago story. Both Community-based and Exposure modeling were conducted or discussed during the General Iron City permit review process and supported the City’s permit denial. Single scoring was used by the city in its combined environmental and demographic index in the Cumulative Impacts Assessment under the HUD settlement, and IEPA has agreed to use something of a matrix approach by using demographic data as a first screen that leads to additional notification and civil rights analysis requirements.
The controversy over General Iron’s relocation illuminates why and how cumulative impact mapping manifests the goals and practices of counter-mapping. Until EJ community organizations and advocates began using cartographic tools to demonstrate their claims of environmental injustice, evidence about harms associated with dangerous and toxic land uses largely existed within the realms of either individual testimonials or dense technical data. Such testimonials, while deeply compelling, could too often be dismissed or minimized in policy discussions precisely because of their individuality—for example, as when a harm like breathing difficulty is ascribed to a co-occurring activity like cigarette smoking. And scientific data from air quality monitors or population-level public health data lacked the normative and narrative power necessary to alter political dynamics. Cumulative impact mapping wove together the lived experience of individuals and technical data into an effective and sharp tool to shape public policy outcomes by demonstrating vividly how collective harm experienced by people as individuals was concentrated in certain communities. Cumulative impact mapping by advocates forced policymakers to account for social facts of the specific place—Chicago’s Southeast Side—when considering development contemplated by the existing industrial corridor zoning map that was drawn to focus on facilities that operate in a place and not the families that live there.
CAN POLICYMAKERS MOVE MAPS FROM REVEALING ENVIRONMENTAL JUSTICE INEQUITIES INTO DECISION-MAKING FRAMEWORKS TO RESOLVE THEM?
Despite the tremendous value in agencies’ use of cumulative impacts mapping as a learning exercise and to prioritize grant funding, mapping does not, ipso facto, dismantle or halt environmental racism that is expressed most directly through land use approvals and permit issuances that result in the continued concentration of environmental burdens in environmental justice communities. 55 “While the development of CI tools has increased in the last decade, the application of these tools to environmental decision making, such as permitting, has been less prevalent.” 56 Bills to integrate cumulative impacts considerations in environmental permitting have been introduced at the local, state, and federal level, 57 including in Illinois, and even passed in New Jersey—in Newark and at the statewide level, with the success of implementation still to be seen. In California, a statewide land use law that requires environmental justice considerations in local planning has shown mixed results, as many local governments lack the necessary political will or technical skill to implement the mandate. 58 As environmental justice thought leader Charles Lee puts it, the “use of EJ mapping tools to address cumulative impacts in land use planning, zoning and facility siting and permitting” is a “story … yet to be written.” 59 Given the headwinds facing implementation of public policies animated by the disparate impact framework, the near-term odds are stacked against that story being written any time soon.
Chicago and Illinois are among the jurisdictions where cumulative impacts assessments are being advanced to reform statutes and regulations, and may serve as a bulwark against national rollbacks. Advocates have experienced the full range of potential cumulative impact assessment approaches. Without diminishing the powerful lessons to be drawn from cumulative impacts campaigns in various other politically, historically, and environmentally distinct jurisdictions around the country, we draw upon the admittedly specific Chicago experience to close with a set of reflections and suggestions on the potential pitfalls and promise of integrating cumulative impacts mapping in land use and environmental decision-making processes.
Maps are subject to inherent limitations of spatial data and must be “ground-truthed”
Cumulative impact maps create visual depictions of environmental injustice by organizing quantitative data (i.e., air pollution levels, or asthma rates) by geographic subunit (e.g., zip code). Reliance on quantitative data comes with all sorts of practical data source limitations and questions like: What variables are available and at what spatial scale? Are data collected consistently across the map’s geographic subunits? The experience of using zip codes to address Flint, Michigan’s lead contamination crisis in its municipal water system offers a cautionary tale about the pitfalls of using zip codes to guide EJ-associated work related to public health. 60 To this list of questions about data quality must be added the new problem in 2025 of the current federal administration proactively erasing once-reliable federal data sources that underpinned many cumulative impacts maps created by advocates, local governments, and state agencies.
Simply stated, maps do not speak for themselves. As one of the architects of the 2018 NRDC map put it, “[n]o map is a definitive accounting of real conditions on the ground.” 61 To ensure the fidelity of its cumulative impacts map, NRDC worked closely with “community partners on the ground who verified that the results resonated with their understandings and lived experience.” 62 Maps must be ground-truthed with local knowledge in a process of co-creation that allows EJ communities and activists to highlight the importance of difficult-to-quantify indicators for inclusion in cumulative impacts policies. 63 Otherwise, using quantitative screening maps alone can “render[] invisible” truly disadvantaged communities revealed by using a mix of quantitative and qualitative approaches. 64
Maps do not translate easily into policy mandates
Cumulative impacts maps are remarkably effective at illustrating environmental racism and the overlapping concentration of environmental harms and socioeconomic vulnerabilities. What maps cannot do so easily, however, is instruct an agency permit writer about what limits to set or what monitoring to require when faced with a specific decision about a specific polluting facility. In the local land use context, planners attempting to avoid cumulative impacts may actually run counter to the historic mandate of zoning law to segregate and concentrate the production of industrial pollution. 65 Cumulative impacts mapping will probably require more than a “culture shift.” New planning and policy epistemologies may well be necessary to realize its full transformative potential.
Typically, cumulative impacts maps show environmental inequity throughout a given political geography (city or state). When an application for a permit or land use approval is made, the proposed facility’s address can easily be plotted on that map. That simple act may be enough to prioritize or trigger certain government responses. Perhaps a facility in an identified overburdened area will be subject to greater monitoring requirements or increased inspections. Those determinations, however, do not tell a permit writer what those increased requirements can or should be. The map also does not forecast the result of adding the proposed facility to the already overburdened community. For that, one must perform modeling and analysis specific to the proposal. In sum, maps might be helpful by triggering increased scrutiny, but cannot, in and of themselves, direct most permitting and land use decisions.
One policy that would avoid this limitation is a map-based ban on new pollution. Such a policy is technically very easy to construct and essentially prohibits the issuance of new permits or land use approvals that will result in new pollution in an area identified as overburdened. Even considering such a bright-line policy is a bold move, however. Unlike cumulative impact mapping that “merely” highlights a societal problem or helps allocate grants, using cumulative impact maps to prohibit or condition industrial activity directly challenges the investment and managerial prerogatives of private enterprise—a posture typically anathema to elected officials. “Protective policies substantially change the approach to regulating industries in EJ communities and can face greater opposition from regulated industries.” 66 A case in point is Illinois, where industry opposition to an “EJ in Permitting” bill has been fierce—even though its provisions came far short of such mapping-based bright-line proscriptions—and state agencies have larded proposed legislative language with terms seemingly designed as “poison pills” to elicit such opposition, like increased permit fees. 67 Unsurprisingly, these bills have generally not become law. 68
Maps can hide policy judgments
Whatever its policy consequences, the use of a cumulative impact map itself can obscure serious normative decisions. For example, a policy may include special provisions for any permit in a map area indicated as overburdened, for example, by being shaded a particular color. But the decisions regarding how that shading is done and what sorts of variables go into the mix when designating overburdened areas are technically complicated and morally significant. 69 Inevitably, such line drawing can produce a map that seems patently unfair or untrue to people with on-the-ground knowledge.
A Chicago example is cautionary. Depending on how map coding thresholds are selected—that is, what numeric cutoffs a user selects in filtering the environmental and socioeconomic variables used in the index scoring—Chicago’s Cumulative Impacts Assessment Map could be drawn to exclude the Altgeld Gardens community as an identified environmental justice community. 70 Altgeld Gardens is the public housing development where Hazel Johnson, the namesake of the proposed Cumulative Impacts ordinance, founded PCR and is a recognized birthplace of the environmental justice movement. 71 In another instance, immediately after Chicago’s map was released, a group of McKinley Park residents pointed out that they lived across the street from a designated “environmental justice” area and dealt with the same serial polluter, but were nonetheless excluded from that definition under the initial, demonstrative index scoring thresholds. 72 In New York, a similar dispute has emerged over a 2019 law requiring the use of cumulative impacts mapping and a scoring approach to define “disadvantaged communities” eligible for increased investment and regulatory attention. 73 The application of that approach is now being litigated as unfair. 74 The above-mentioned overreliance on zip codes to address Flint, Michigan’s 2010s water contamination crisis foreshadowed contemporary discussions of the fraught nature of using existing boundary lines on urban maps to guide EJ policy.
Because maps embed moral and policy judgments, at a minimum, “it is imperative that EJ communities are part of the process of determining what are appropriate thresholds and how they should be calculated.” 75 Mapmakers and users should also consider whether features like community self-designation should be available for maps that trigger statutory or regulatory requirements. 76
Race against maps
The environmental justice movement forces policymakers to grapple with structural racism: government policies and social structures that have created a demographic landscape in which exposure to pollution is, significantly, a function of a person’s race. 77 Accordingly, many approaches to assess environmental injustice involve comparing the spatial distribution of pollution to the spatial distribution of minority racial populations. As detailed above, maps can do this quite easily to expose environmental racism, and for this reason many—though not all 78 —state and local cumulative impacts mapping tools include race as a variable. 79
But policymakers looking to use those maps to expose and undo environmental racism have little choice but to pause those efforts in light of recent U.S. Supreme Court jurisprudence. In last year’s decision in the Students for Fair Admission, Inc. v. President and Fellows of Harvard College, the Supreme Court held that the use of applicants’ racial information in college admissions violated the Equal Protection Clause of the Fourteenth Amendment. 80 The Court applied a familiar “strict scrutiny” test to the admissions programs after finding they, indeed, discriminated on the basis of race by including race as a factor in a multipart admission process. 81 The strict scrutiny test asks first whether the use of race in a government decision is necessary to “further compelling government interests,” and if so, whether the use of race is “narrowly tailored to achieving that interest. 82 The majority acknowledged that remedying specific instances of past discrimination can be a compelling government interest. 83 The Supreme Court’s decision put a fine point on a clear trend among conservative judges around the country. 84 A prime example is a federal judge in Florida who struck down a Biden administration program issuing loan forgiveness payments to “socially disadvantaged farmers,” which the government defined as farmers who are Black, American Indian/Alaskan Native, Hispanic, Asian, or Pacific Islander. The court ruled that the government’s use of race violated a White farmer’s right to equal protection because it inflexibly assigned benefits to farmers strictly on the basis of race. 85
Under such case law, even government policies using Cumulative impact mapping to distribute benefits or provide preferences in grantmaking could be vulnerable to challenge if the underlying maps include racial demographic information. 86 There are strong counterarguments, however, and the strength of those counterarguments would turn on specific policy design choices that rely on CI mapping inclusive of race information. For example, an explicit and functional connection to remedying past racial discrimination by the relevant government actor could fortify such a policy from legal challenge. 87
CONCLUSION: NO CLEAR PATH ON THE MAP
An enduring lesson of the Great Depression-era HOLC project is that maps and their makers had immense power to produce environmental injustice in America. In an age of counter-mapping, however, maps and their makers have demonstrated the potential to expose environmental injustice. Yet we are left where we began, with the questions of whether and how maps can be put to use in providing governmental redress to the injustices created, in part, by government-sanctioned maps.
While Chicago’s experience with EJ mapping is specific to time and place, it nonetheless offers a few signposts for policymakers contemplating integrating cumulative impact mapping into formal land use and permit policies. First and foremost, maps must be co-created with communities to ensure equity and local knowledge underlie the normative and policy choices embedded in them. Maps do not speak for themselves and must be paired with qualitative data sources that embed spatial data in ground truths. The use of racial demographic information must balance legal pragmatism and moral principle through highly intentional policy design and justification. Cumulative impacts maps have proven themselves as screening tools within policy processes, but their enduring impact may rest with the ability to maintain the map as a living space of dynamic, qualitative, and site- and facility-specific information that cannot be reduced to a jurisdiction-wide map lodged permanently set statically into municipal code or agency rule.
The efficacy of cumulative impact counter-mapping in the context of skilled and supported community organizing strategies is a large reason that the integration of similar maps into policymaking is so attractive. No doubt that maps can and do show us the lay of the land; what maps cannot do, however, is replace human agency in choosing a path with a clear sense of direction.
AUTHORS’ CONTRIBUTIONS
O.B., R.A.W., and M.B.P. contributed to the conceptualization, provided resources, provided validation, and review and editing. In addition, R.A.W. and M.B.P. contributed formal analysis, investigation, and original draft writing.
Footnotes
AUTHOR DISCLOSURE STATEMENT
No competing financial interests exist.
FUNDING INFORMATION
No funding was received for this article.