
Abstract
Recent work has begun to examine the link between motivation for specific emotions and psychopathology. Yet research on this topic to date has focused primarily on depression. To understand patterns of motivation for emotions within and across affective disorders, we assessed motivation for emotions in adults at increased risk for and diagnosed with bipolar disorder (BD). We focused on motivation for negative (i.e., sadness) and positive (i.e., happiness) emotions and for emotional instability using self-report and behavioral measures. Both increased BD risk and diagnosis of BD were associated with increased motivation for sadness and decreased motivation for happiness as assessed by behavioral measures. Such motivational tendencies were less consistent when assessed by self-reports. Higher BD risk was associated with increased self-reported motivation for emotional instability (Studies 1–3), although this association was not evident in BD (Study 4). Findings suggest both similarities and differences in motivation for emotions in affective disorders.
Emotion-regulation difficulties are common across psychiatric disorders (e.g., Sheppes et al., 2015). Such difficulties often involve maladaptive use of emotion-regulation strategies (e.g., Aldao et al., 2010) or the maladaptive pursuit of certain emotions (e.g., Ford et al., 2015; Millgram & Tamir, 2019). Research on the latter focused primarily on unipolar depression. Compared with nondepressed individuals, depressed individuals 1 are more motivated to experience negative emotions (i.e., sadness) and less motivated to experience positive emotions (i.e., happiness; Millgram et al., 2015, 2019). Such motivations, in turn, prospectively predict clinical outcomes (e.g., Millgram et al., 2019).
Do differences in motivations for emotions extend beyond unipolar depression? This is particularly relevant in bipolar disorder (BD), a chronic affective disorder marked by heightened and unstable emotional experiences (e.g., Johnson et al., 2007). BD and depression share common features (i.e., episodes of depression) but differ in important ways. Unlike depression, BD is associated with intense positive emotion or irritability (e.g., Deckersbach et al., 2004; Gruber, 2011) and emotional instability (e.g., Henry et al., 2008). These characteristics render BD an ideal comparison for depression when examining similarities and differences in motivations for emotions. Therefore, we assessed motivation for negative and positive emotions in individuals at higher risk for and diagnosed with BD.
Motivations for Emotions
Emotions are spontaneous reactions to events, yet people can try to change their emotional reactions by engaging in emotion regulation (e.g., Gross, 2015). Emotion regulation involves attempts to change what people feel into what they want to feel (e.g., Tamir, 2016). For instance, people regulate emotions to feel happier or less sad. Motivation for an emotion refers to the drive to experience it (Mauss & Tamir, 2014). For example, people might want to feel happiness to a large extent and sadness to a small extent. Motivation for emotion plays a critical role in emotion regulation, determining whether, when, and how people regulate their emotions (Tamir, 2021). To achieve what they want to feel, people implement emotion-regulation strategies (e.g., Gross, 2015). For instance, people can use situation selection, which involves selecting situations or stimuli that are likely to induce desired emotional states (e.g., Webb et al., 2018). For instance, people might choose to watch a funny movie to increase happiness.
Motivation for emotions can be measured by continuous self-report measures (e.g., “To what extent do you want to feel happy?”). Motivation for emotions can also be measured behaviorally by assessing the direction in which people implement emotion-regulation strategies, such as situation selection (e.g., Wood et al., 2009). Because people typically select stimuli that induce desired emotions, the emotional nature of selected stimuli (e.g., images, music) can index motivation for emotions. For instance, people who wanted to feel happier selected happiness-inducing stimuli (e.g., Parkinson & Totterdell, 1999), whereas people who wanted to feel sadder selected sadness-inducing stimuli (e.g., Hackenbracht & Tamir, 2010). There is evidence supporting the convergent and predictive validity of these measures (e.g., Porat et al., 2016; Tamir et al., 2013; Wood et al., 2009).
How motivated people are to experience certain emotions is important given its influence on the outcomes of emotion regulation. Because what people want to feel can influence what they do to regulate emotions, it ultimately can shape how people feel (e.g., Markovitch et al., 2017). For instance, how angry people wanted to feel determined whether they chose to read anger-inducing newspaper articles (e.g., Porat et al., 2016) or listen to anger-inducing music (e.g., Tamir et al., 2008). Engaging in such activities increased the experience of anger (e.g., Porat et al., 2016). Therefore, if people differ in motivation for emotions, they might differ in how they regulate emotions and in how they ultimately feel.
People differ in motivations for emotions. For instance, people with low self-esteem were less motivated to experience positive emotions (e.g., Wood et al., 2003) and less motivated to repair sad moods (e.g., Wood et al., 2009). One factor that might account for individual differences in motivations for emotions is how familiar emotions are. In general, people prefer familiar experiences—experiences that they encounter frequently (e.g., Zizak & Reber, 2004). Some studies suggest that this might extend to familiar emotional experiences—people may prefer emotional experiences that they experience more frequently (e.g., Augustine et al., 2010; Ford & Tamir, 2014; Wood et al., 2009). For instance, extraverts who are familiar with high arousal states want to experience more high arousal states than introverts do (Augustine et al., 2010). Likewise, people who experience more (vs. less) anger or fear are more motivated to experience anger or fear, respectively (Ford & Tamir, 2014). Building on these studies, we assume that familiarity of emotions reflects how frequently these emotions are experienced in daily life rather than how intensely they are experienced in response to specific events.
If people prefer familiar emotional experiences and try to regulate their emotions accordingly, they might ultimately sustain familiar emotions. This might be disadvantageous when familiar emotions are disruptive, as in certain forms of psychopathology.
Motivations for Emotions in Psychopathology
Research on motivations for emotions in psychopathology has focused primarily on unipolar depression (e.g., Arens & Stangier, 2020; Millgram et al., 2015, 2019; Yoon et al., 2020). This work revealed that although depressed individuals wanted to feel more happy than sad, they reported wanting to feel more sadness and less happiness compared with nondepressed individuals (e.g., Millgram et al., 2015, 2019). Depressed individuals were also more likely than nondepressed individuals to select sadness-inducing stimuli (i.e., images, music; e.g., Arens & Stangier, 2020; Millgram et al., 2015) and to choose to increase their emotional reactions to sadness-inducing stimuli (e.g., Millgram et al., 2015), which resulted in more sadness. These findings suggest that clinically depressed individuals might choose to regulate their emotions in ways that ultimately exacerbate their sadness (e.g., listening to sad music). Such differences in motivations for emotions in depression prospectively predicted the severity of clinical symptoms during stress (Millgram et al., 2019). Because depression is characterized by increased sadness and decreased happiness, these findings are consistent with the possibility that depressed individuals are somewhat motivated to experience familiar emotions (e.g., Arens & Stangier, 2020).
Examining motivation for emotions has informed emotion-regulation deficits in depression. However, to understand motivations for emotions in psychopathology, it is necessary to assess them in disorders other than unipolar depression. This was the goal of this investigation, which focused on BD.
Motivations for Emotions in Bipolar Disorder
BD is a chronic affective disorder, characterized by episodes of intense elevated or irritable mood (i.e., mania) and intense sad mood or lack of pleasure (American Psychiatric Association, 2013). BD was ranked among the top 10 causes of medical disability worldwide (World Health Organization, 2001). Like depression, BD is frequently characterized by episodes of depression. However, BD differs from depression because it is also characterized by elevated positive mood or irritability (i.e., mania) and periods of heightened emotional instability (Henry et al., 2001, 2008; Johnson et al., 2016).
Previous research suggests that individual differences in motivations for emotions may be linked to familiarity of these emotions, or the frequency with which people experience them (e.g., Ford & Tamir, 2014). Therefore, we hypothesized that people at higher risk for and diagnosed with BD would be more motivated to experience familiar emotional patterns. Some familiar emotions in BD overlap with familiar emotions in depression, whereas others differ. With respect to negative emotions, daily assessments reveal that, on average, people at risk for BD and people diagnosed with BD experience elevated levels of negative emotions compared with healthy control participants, even in remission (e.g., Gruber et al., 2013; Havermans et al., 2010). As in depression, therefore, negative emotions may be more familiar in BD. Therefore, we predicted that people at risk for and people diagnosed with BD would be more motivated to experience negative emotions compared with healthy individuals.
With respect to positive emotions, patterns of daily experiences in BD are less consistent. Some studies found that, on average, people diagnosed with BD experienced similar levels of positive emotions as healthy individuals did (Gruber et al., 2013), whereas others found they experienced lower levels of positive emotions than healthy individuals did (e.g., Gruber et al., 2009; Havermans et al., 2010). Because findings on positive emotions in daily life in BD are inconsistent, how familiar they are in BD is inconclusive. Therefore, we had no a priori predictions regarding the motivation for happiness in BD.
Familiar emotional experiences may extend beyond discrete emotional states to broader emotional patterns. People prefer familiar experiences such as familiar foods (e.g., Aldridge et al., 2009), places (e.g., Hammitt et al., 2006), and television shows (e.g., Derrick, 2013). Given that preferences for familiarity are found across such a broad range of experiences, it is plausible that it might encompass both the type and the pattern of emotional experiences.
Mood fluctuations are a central feature of BD (e.g., Hofmann & Meyer, 2006). People with BD report more oscillations between negative and positive emotions than healthy control participants do, even in remission (e.g., Henry et al., 2001, 2008). Daily assessments of emotional experiences in BD risk find increased emotional instability compared with healthy control participants (e.g., Kwapil et al., 2011). Therefore, assuming people are motivated to experience not only familiar types but also familiar patterns of emotional experiences, we predicted that people at risk for and people diagnosed with BD would be more motivated to experience emotional instability compared with healthy individuals.
The Present Investigation
We tested whether BD was associated with motivation for negative and positive emotions and emotional instability. We focused on sadness and happiness, in particular, as prototypical examples of negative and positive emotions (e.g., Mata et al., 2012) and as the focus of previous studies on motivations for emotions in depression (e.g., Millgram et al., 2019; Yoon et al., 2020). Recent clinical and epidemiological research provides support for a continuum of bipolar psychopathology, ranging from subclinical manifestation of BD symptoms to clinical disorders (e.g., Walsh et al., 2012). Accordingly, we tested our hypotheses using continuous self-report measures of BD risk in the general population (Study 1), comparing people who scored either high or low on continuous measures of BD risk (Study 2), and comparing adults with and without a clinical history of BD I (Study 3).
In Study 1, we assessed motivations for emotions using self-report measures. In Studies 2 and 3, we also used a behavioral-performance-based task in which participants chose how to implement situation selection to regulate their emotions (e.g., Millgram et al., 2015, 2019). In the task, participants chose whether and how often to shift between sad, happy, and neutral images. We could then assess the extent to which participants shifted toward sad images, reflecting motivation for sadness, and toward happy images, reflecting motivation for happiness. The task also allowed us to assess participants’ shifts between different types of emotion-inducing images, reflecting motivation for emotional instability. Finally, to assess motivations for decreasing emotions (either happiness or sadness) and to ensure that avoidance of one emotional state (e.g., sadness) does not necessarily imply selection of another (e.g., happiness), we included neutral images in the task and assessed motivation to shift toward neutrality. Studies 1 through 3 tested two aims.
Aim 1: motivation for sadness and happiness
First, we tested whether BD is linked to motivation for sadness (Aim 1a). Given that negative emotions are likely to be more familiar in BD, we predicted that BD risk and diagnosis would be linked to a stronger motivation for sadness. Second, we tested links between BD and motivation for happiness (Aim 1b). Because the familiarity of positive emotions in BD remains unclear, we had no a priori predictions regarding associations between motivation for happiness and BD risk or diagnosis. To verify that any differences in motivations for sadness and happiness cannot be attributed to current feelings, we repeated analyses controlling for current sadness or happiness, respectively. To account for the possibility that differences in motivations for sadness and happiness were related to active depressive or manic symptoms, we repeated analyses, controlling for symptoms of depression and mania.
Aim 2: motivation for emotion instability
We tested whether BD is related to motivation for emotional instability. Given that emotional instability is likely to be more familiar in BD, we predicted that BD risk and diagnosis would be linked to a stronger motivation for emotional instability. Again, we repeated the analyses controlling for current manic and depressive symptoms.
Study 1: Associations Between a Measure of BD Risk and Motivations for Emotions in the General Population
Study 1 assessed associations between a self-reported measure of BD risk and motivation for sadness, happiness, and emotional instability in two independent samples drawn from the general population. We used the same measures for assessing motivation for sadness, happiness, and emotional instability across the two samples. However, in the second sample, we added a measure of motivation to experience emotional instability (i.e., preferred rate of emotional instability). We assessed how much people wanted to experience changes in mood and the frequency with which people wanted their emotions to change. This allowed us to test motivation to experience mood fluctuations as well as how frequently participants wanted these fluctuations to occur.
Method
Participants
Two independent samples were recruited from Amazon’s Mechanical Turk (MTurk.com; e.g., Buhrmester et al., 2016). The first sample included 203 participants recruited as part of a larger research project, 2 for which they received $6. The second sample included 200 participants who received $5 for participating. All participants were U.S. residents. Sixteen participants were excluded for failing to pass attention checks (i.e., instructional manipulation checks; Oppenheimer et al., 2009), leaving a sample of 387 participants (48.1% females, mean age = 33.29 years; for demographic information, see Table S1 in the Supplemental Material available online). According to a power analysis, a sample size of 387 provided .80 power to detect small effect sizes (|r| = .141, with α = .05).
Materials
Risk for BD
Participants completed the Hypomanic Personality Scale (HPS; Eckblad & Chapman, 1986), a self-report measure assessing risk for BD. It consists of 48 true or false items capturing bipolar-relevant shifts in emotion, energy, and behavior (e.g., “I often have moods where I feel so energetic and optimistic that I feel I could outperform almost anyone at anything”). The HPS has high internal consistency and established predictive validity for the onset of future hypomanic/manic episodes (e.g., Eckblad & Chapman, 1986; Kwapil et al., 2000). For instance, in a 3-year longitudinal study (Walsh et al., 2015), 58% of people who scored in the upper quartile of the HPS qualified for bipolar spectrum disorders. Scores on the HPS in the present study were representative of a normative adult sample (M = 12.46, SD = 9.13; range = 0–44; α = .91), and 17 (4.4%) scored above the clinically significant cutoff score.
Current symptoms
Participants completed the Altman Self-Rating Mania Scale (ASRM; Altman et al., 1997; α = .81 in the current sample). The ASRM is a five-item scale that assesses the severity of manic symptoms, over the past week, on a scale from 0 (not present) to 4 (present to a severe degree). The ASRM is commonly used (e.g., Feldman et al., 2008). The Beck Depression Inventory–II (BDI-II; Beck et al., 1996) was used to assess the severity of current self-reported symptoms of depression (α = .95 in the current sample). The BDI-II is a 21-item scale that assesses the severity of depressive symptoms during the past 2 weeks. It has good psychometric properties (e.g., Segal et al., 2008).
Motivations for sadness and happiness
Participants rated the extent to which they generally wanted to experience various emotions in daily life (e.g., “To what extent do you generally want to feel sad in your daily life?”; 1 = very little, 7 = extremely; e.g., Porat et al., 2016; Tamir et al., 2013). To assess motivation for sadness, we averaged across three items (sad, depressed, and gloomy; α = .88). To assess motivation for happiness, we averaged across three items (happy, joyful, and cheerful; α = .88). Items were selected on the basis of previous studies assessing motivations for sadness and happiness in depression (e.g., Millgram et al., 2015, 2019).
Motivation for emotional instability
Six items assessed the degree to which participants wanted to experience instability in their mood (“I prefer stable over unstable emotional experiences,” reverse-scored; “Sometimes I like it when my mood changes”; “I don’t like experiencing drastic mood changes,” reverse-scored; “I like being emotionally unpredictable”; “I don’t like feeling the same way for very long”; and “I like it when my mood changes from day to day”; α = .80). Participants rated the extent to which each item applied to them (1 = not at all, 7 = to a large extent).
Preferred rate of emotional instability (i.e., shifts)
Four items assessed the frequency with which participants wanted their feelings to change (1 = minutes, 2 = hours, 3 = days, 4 = weeks, 5 = months). The items were “I like it when my mood changes every few X,” “I don’t like feeling the same way for more than a few X,” I don’t like experiencing drastic mood changes within a few X” (reverse-scored), and “If I could control my feelings, I would try to change them”: 1 = every few minutes, 2 = every hour, 3 = every day, 4 = every week, 5 = every month, 6 = not at all. The reversed item significantly decreased internal reliability (α = .52 with the reversed item and α = .73 without it). Therefore, we computed the overall score using the three nonreversed items. 3
Current emotions
Participants rated how much they experienced various emotions at that moment (e.g., “To what extent do you feel sad at this moment?”; 1 = very little, 7 = extremely). To assess current sadness, we averaged across ratings of sad, depressed, and gloomy (α = .92). To assess current happiness, we averaged across ratings of happy, joyful, and cheerful (α = .92).
Procedure
Participants rated their current sadness and happiness. In the first sample, participants completed the remaining measures in one of two counterbalanced orders. In the second sample, participants completed the measures in random order.
Results
Table S2 in the Supplemental Material presents simple correlations and descriptive statistics of the variables in Study 1.
Aim 1a: motivation for sadness
We correlated HPS scores with the motivation for sadness. As predicted, we found a significant positive correlation, r(387) = .289, p < .001. The higher the participants’ HPS scores, the stronger their motivation for sadness. This association remained significant when controlling for current manic and depressive symptoms and for current sadness, β = 0.248, SE = 0.004, t(386) = 4.98, p < .001, and was not sample-dependent, β = 0.284, SE = 0.004, t(386) = 5.85, p < .001.
Aim 1b: motivation for happiness
We correlated HPS scores with the reported motivation for happiness. The association was not significant, r(387) = −.055, p = .278. However, when controlling for manic and depressive symptoms and for current happiness, the effect was significant, β = −0.136, SE = 0.008, t(386) = −2.66, p = .008, such that higher HPS scores were associated with lower motivation for happiness. This pattern was not sample-dependent, β = −0.131, SE = 0.007, t(386) = −2.58, p = .010.
Aim 2: motivation for emotional instability
We correlated HPS scores with self-reported motivation for emotional instability. As predicted, we found a significant positive correlation, r(387) = .446, p < .001. This association remained significant when controlling for manic and depressive symptoms, β = 0.430, SE = 0.005, t(386) = 8.95, p < .001, and sample, β = 0.433, SE = 0.005, t(386) = 9.04, p < .001.
Next, we tested the association between HPS scores and the preferred rate of emotional shifts, which was assessed in the second sample. As predicted, we found a significant negative correlation, r(192) = −.246, p = .001, 5 indicating that the higher participants’ HPS score was, the more frequently they wanted their emotions to change. On average, participants wanted their emotions to change every few weeks, and this preference varied as a function of participants’ HPS score. This association was not qualified by manic and depressive symptoms, β = −0.171, SE = 0.008, t(191) = −2.17, p = .031. 4
Discussion
Consistent with our predictions, in the general population, higher scores on a measure of BD risk were associated with an increased motivation for sadness. They were unrelated to the motivation for happiness, although a negative association between HPS scores and motivation for happiness emerged when current symptoms and current happiness were controlled for. Higher HPS scores were also significantly related to an increased motivation for emotional instability. This was reflected in the reported motivation for emotional changes and in how frequently participants wanted their emotions to change. It remains to be tested whether these patterns persist when assessing motivation for emotions with measures other than self-report and when contrasting people at higher risk for BD compared with lower risk for BD.
Study 2: Motivations for Emotions Comparing High and Low HPS Scorers
In Study 2, we compared motivations for sadness, happiness, and emotional instability in people at higher risk compared with lower risk for BD. We also went beyond self-report and assessed the direction in which participants implemented situation selection to regulate their emotions. We assessed whether and how often participants chose to shift between sad, happy, and neutral images. To verify that any potential group differences would be related to the emotional content of the images, we included a comparable nonemotional task in which participants could shift between types of nonemotional images (i.e., geometrical shapes). We expected the self-report measures and the behavioral indices to converge.
Method
Participants
Participants were prescreened according to their score on the HPS (Eckblad & Chapman, 1986), administered online to a large sample of students (N = 596) approximately 1 to 5 weeks before the experiment. We invited to the lab participants who scored 1 SD above or below the mean of HPS scores in the sample (mean HPS = 17.56, SD = 8.62). Participants who scored either 26 or above or 9 or below on the HPS were invited. During the laboratory session, we readministered the HPS to verify that participants’ group assignment remained consistent (30 participants were excluded because their HPS scores were not consistent across the two administrations). According to a power analysis based on the average effect sizes obtained in Study 1 (i.e., |r| = .344), a sample size of 62 participants provided .80 power to detect such an effect size with α = .05. The final sample included 63 participants (65% female, mean age = 23.42 years). The higher risk group included 32 participants with high HPS scores (mean HPS = 32.25, 6 SD = 4.94). Parallel results were obtained when using more clinically stringent cutoffs in a smaller sample. 7 The lower risk group included 31 participants with low HPS scores (mean HPS = 5.48, 7 SD = 1.84). Participants received course credit or $15 for participating. Groups did not differ significantly by age, t(61) = 1.31, p = .195, or gender, χ2(1) = 0.386, p = .535.
Materials
We used the same measures as in Study 1 to assess current manic symptoms (ASRM; α = .81), current depressive symptoms (BDI-II; α = .93), motivation for sadness (α = .77), motivation for happiness (α = .78), motivation for emotional instability (α = .86), preferred rate of emotional shifts (α = .73), current sadness (α = .89), and current happiness (α = .89).
Emotional-image-selection task
The task was designed to behaviorally assess participants’ motivations for sadness, happiness, and emotion instability via their choices to shift between emotion-inducing images. The task included 20 sad, 20 happy, and 20 neutral images selected from the International Affective Picture System (Lang et al., 2005), according to the norms published by Lang et al. (2005) and by Mikels et al. (2005). We selected eight sad images that were rated as inducing high levels of sadness (M = 4.63, SD = 0.41), 20 happy images that were rated as inducing high levels of amusement and contentment (amusement: M = 4.39, SD = 0.54; contentment: M = 4.29, SD = 0.36), and 20 neutral images that were rated as inducing average levels of valence (M = 5.23, SD = 0.45) and relatively low levels of arousal (M = 3.27, SD = 0.47). We selected 12 additional sad images that were found to induce high levels of sadness in previous experiments with mood-disordered groups (e.g., Millgram et al., 2015; M = 6.18, SD = 0.77).
As seen in Figure 1a, on each trial, a sad, happy, or neutral image appeared on the full computer screen for 2,000 ms. Images were presented in random order. After image offset, the same image appeared at the top of the computer screen. Below it, three additional images were presented: one sad, one happy, and one neutral image. Participants were asked to choose which of the three images they would like to view next. Participants made their selection by pressing the “1,” “5,” or “9” key. The location of the images on the screen was counterbalanced across trials. After selecting their preferred image, participants watched the image on the full screen for 2,000 ms. Before the next trial, a black screen appeared for 2,000 ms. The task included 15 trials: five trials in which the initial image was sad, five trials in which the initial image was happy, and five trials in which the initial image was neutral.
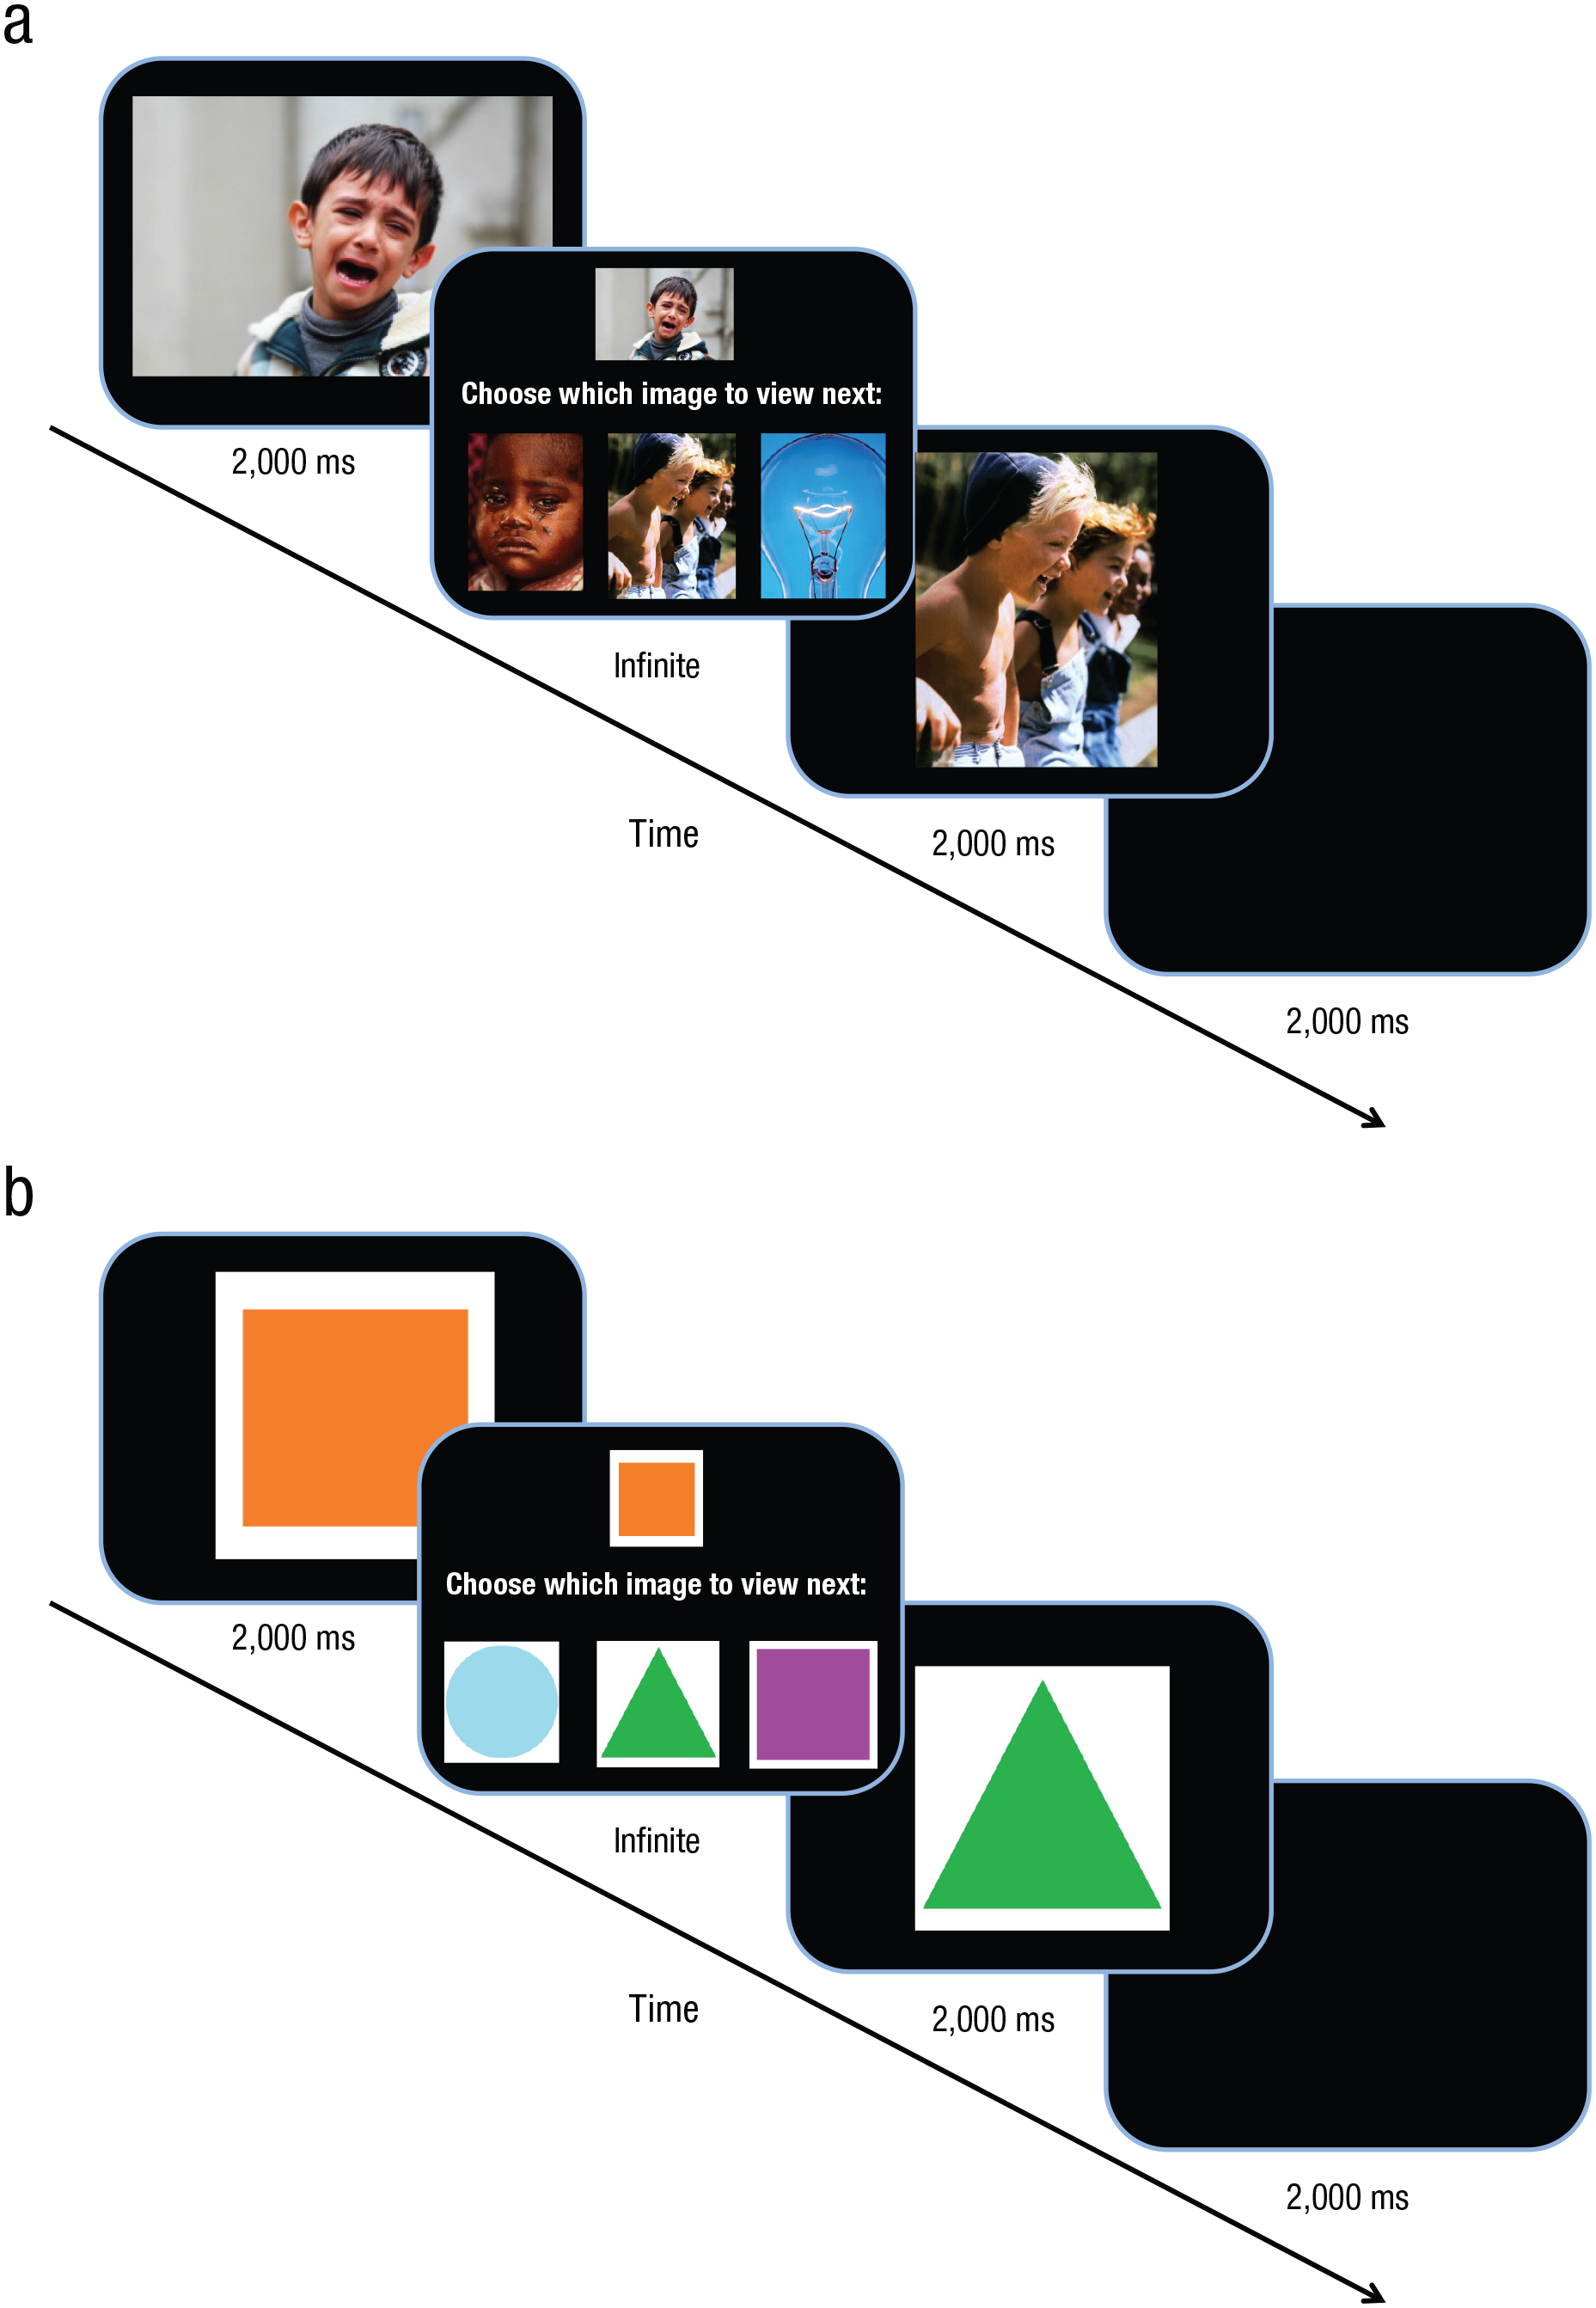
The content of a typical trial in the emotional-image-selection task (a) and nonemotional-image-selection task (b) in Study 2.
Nonemotional-image-selection task
The nonemotional-image-selection task was used to confirm that any findings that might be obtained in the emotional-image-selection task would be specific to emotion content. Images of geometrical shapes replaced the emotion-inducing images. Using the Microsoft Paint program, we created 20 images of squares, 20 images of triangles, and 20 images of circles. Images differed from one another by color and size (see Fig. 1b). Trials in the nonemotional-image-selection task were identical to trials in the emotional image selection task, and images of squares, triangles, and circles replaced sad, happy, and neutral images.
Procedure
Before arriving at the lab, participants received a link to online questionnaires by e-mail and were asked to complete them before the lab session. 8 In the online questionnaires, participants first rated their current emotions and then rated their motivations for sadness and happiness. 9 Upon arrival at the lab, participants rated their current emotions again. Then, they completed the emotional-image-selection task, followed by the nonemotional-image-selection task. Next, participants completed measures of motivation for emotional instability, preferred rate of emotional shifts, and current symptoms of mania and depression. Measures were completed in random order. Finally, participants rated their emotional reactions to the images in the emotional-image-selection task. Each image appeared on the computer screen, and participants rated the extent to which each image made them feel sad (1 = not at all, 9 = to a large extent) and happy (1 = not at all, 9 = to a large extent). Images were presented in random order.
Results
Tables S3 and S4 in the Supplemental Material present demographic information (Table S3) and correlations and descriptive statistics of key variables (Table S4) in Study 2.
Part 1: self-reported motivations
Aim 1a: motivation for sadness
To assess group differences in motivation for sadness, we conducted an independent samples t test, with group (higher vs. lower HPS scores) as the independent variable and motivation for sadness as the dependent variable. Contrary to Studies 1 and 2, we did not find a significant group difference between groups with higher HPS scores (M = 1.49, SD = 0.89) and lower HPS scores (M = 1.20, SD = 0.38), t(60) = −1.66, p = .102, d = 0.42. When controlling for manic and depressive symptoms and current sadness, group differences were significant, F(1, 57) = 4.67, p = .035, η2 = .08, such that people with higher HPS scores reported wanting to experience more sadness (M = 1.55, SD = 0.12) than did people with lower HPS scores (M = 1.15, SD = 0.12).
Aim 1b: motivation for happiness
We repeated the above analysis with motivation for happiness as the dependent variable. We found a significant difference between groups, t(60) = 2.22, p = .030, d = 0.55, such that participants with higher HPS scores wanted to experience less happiness (M = 5.66, SD = 1.16) than did participants with lower HPS scores (M = 6.19, SD = 0.69). When controlling for manic and depressive symptoms and for current happiness, the effect was no longer significant, F(1, 57) = 3.25, p = .077, η2 = .05. However, when controlling for manic and depressive symptoms, current happiness, and participants’ age and gender, the effect was significant, F(1, 55) = 4.38, p = .041, η2 = .07.
Aim 2: motivation for emotional instability
We conducted an independent samples t test, with group (higher vs. lower HPS scores) as the independent variable and motivation for emotional instability as the dependent variable. As predicted, we found a significant difference between groups, t(61) = −4.03, p < .001, d = 1.02, such that participants with higher HPS scores (M = 3.40, SD = 1.36) were more motivated to experience emotional instability than participants with lower HPS scores (M = 2.34, SD = 0.55). These findings were not qualified by manic or depressive symptoms, F(1, 59) = 9.05, p = .004, η2 = .13.
We repeated the above analysis with the preferred rate of emotional shifts as the dependent variable. As predicted, we found a significant difference between groups, t(61) = 2.46, p = .017, d = 0.60, such that people with higher HPS scores wanted to experience emotional shifts more frequently (M = 3.45, SD = 0.87; every few days to every few weeks) than people with lower HPS scores (M = 3.97, SD = 0.80; every few weeks). 10 When controlling for current manic and depressive symptoms, the effect became nonsignificant, F(1, 59) = 3.95, p = .051, η2 = .06.
Part 2: image-selection task
Manipulation check
We first tested whether the images had the expected emotional impact and whether such impact differed across groups. We conducted a 2 × 3 × 2 repeated measures analysis of variance (ANOVA) with group (higher vs. lower HPS scores) as a between-subjects factor and image (sad, happy, neutral) and emotional reaction (sadness, happiness) as within-subjects factors. As expected, we found a significant Image × Emotional Reaction interaction, F(2, 60) = 591.25, p < .001, η2 = 0.91. Pairwise comparisons (least significant difference) confirmed that more sadness was evoked by the sad images (M = 6.81, SE = 0.24) than by the happy images (M = 1.20, SE = 0.07) and neutral images (M = 1.40, SE = 0.12), ps < .001. Likewise, more happiness (M = 6.81, SE = 0.23) was evoked by the happy images than by the sad images (M = 1.15, SE = 0.05) and neutral images (M = 1.83, SE = 0.18), ps < .01. The Group × Emotional Reaction × Image interaction was not significant, F(2, 60) = 0.92, p = .403, η2 = .02, indicating no group differences in emotional reactions to the images. 11
Aim 1a: motivation for sadness
Figure 2a depicts the percentage of shifts between image types by group. We assessed motivation for sadness by measuring participants’ choices to shift toward sad images. We tested whether groups differed in the percentage of sad images selected and whether the selection of sad images was qualified by the type of image that was presented before participants made their choice. We conducted a repeated measures ANOVA with group (higher vs. lower HPS scores) as a between-subjects factor and the type of image from which participants shifted (sad, happy, neutral) as a within-subjects factor. The percentage of choices to view sad images was entered as the dependent variable. As expected, we found a significant main effect of group, F(1, 61) = 17.87, p < .001, η2 = .23. Participants with higher HPS scores were more likely to shift toward sad images (M = 25.00%, SE = 3.11%) than participants with lower HPS scores (M = 6.24%, SE = 3.16%). There was no interaction between group and the type of image from which participants shifted, F(2, 61) = 0.543, p = .583, η2 = .01, indicating that participants with higher HPS scores were more likely to choose sad images compared with participants with lower HPS scores regardless of the type of image that was presented before they made their choice. Group differences, therefore, could not be explained by inertia.
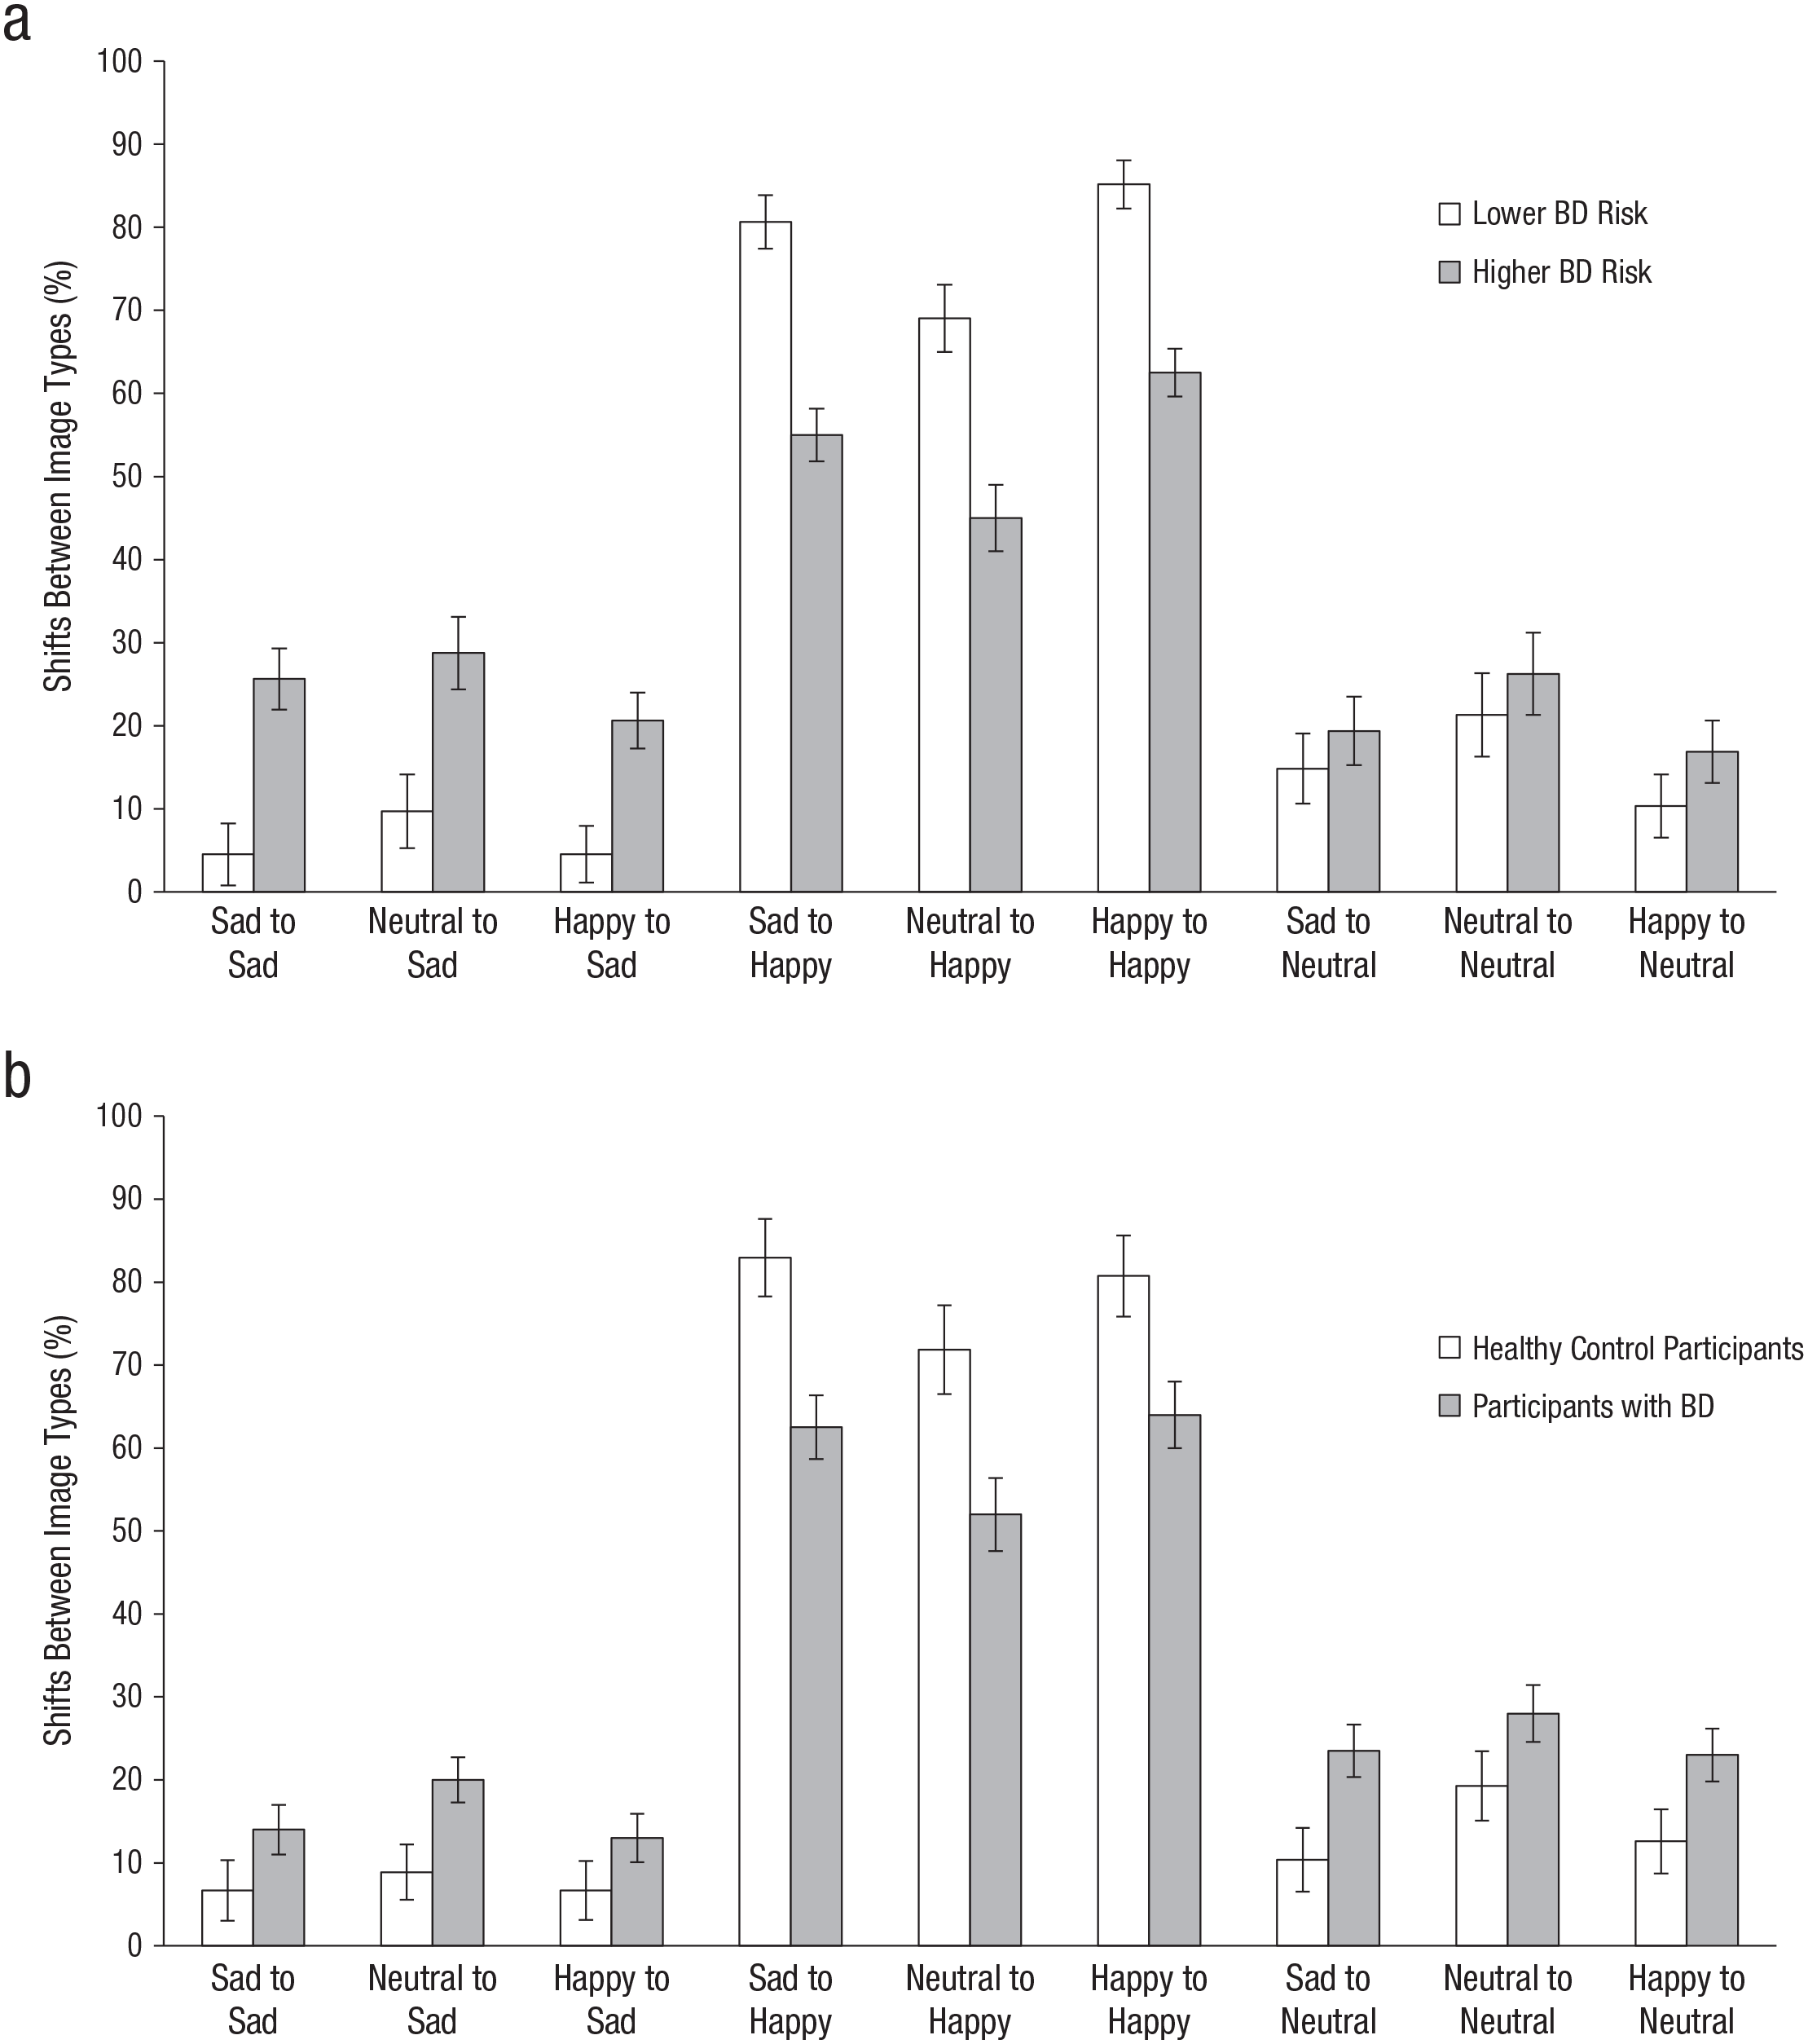
Percentage of shifts between image types made by participants with higher compared with lower risk for bipolar disorder (BD) in Study 2 (a) and by participants with bipolar disorder and healthy control participants in Study 3 (b). Error bars indicate to ±1 SEM.
Group differences in shifts toward sad images remained significant when controlling for manic and depressive symptoms, F(1, 59) = 8.32, p = .005, η2 = .12. Groups also differed in their selection of sad images following a neutral image, t(61) = −3.23, p = .002, d = 0.82 (M = 28.75%, SD = 25.37%, and M = 9.68%, SD = 21.21% for the higher and lower HPS groups, respectively), ensuring that groups differed in shifts toward sad images even when shifting away from a neutral emotional state.
Aim 1b: motivation for happiness
We tested whether groups differed in the percentage of happy images selected and whether selection of happy images was qualified by the image presented to participants before they made their choice. We conducted a repeated measures ANOVA with group (higher vs. lower HPS scores) as a between-subjects factor and the type of image from which participants shifted (sad, happy, neutral) as a within-subjects factor. The percentage of choices to view happy images served as the dependent variable. We found a significant main effect of group, F(1, 61) = 20.22, p < .001, η2 = .25. Participants with higher HPS scores were less likely to shift toward happy images (M = 54.17%, SE = 3.76%) than participants with lower HPS scores (M = 78.28%, SE = 3.82%). The Group × Image Type interaction was not significant, F(2, 61) = 0.129, p = .879, η2 < .01, indicating that groups differed in shifts toward happy images regardless of the type of image they shifted away from. Group differences in shifts toward happy images remained significant when controlling for manic and depressive symptoms, F(1, 59) = 11.35, p = .001, η2 = .16. Groups differed in their shifts toward happy images even when they were shifting away from a neutral emotional state, t(61) = 3.40, p = .001, d = 0.86 (M = 45.00%, SD = 27.82%, and M = 69.03%, SD = 28.21% for the higher and lower HPS scorers, respectively).
Aim 2: motivation for emotional instability
To behaviorally assess motivation for emotional instability, we calculated the percentage of choices to shift between images that induce different emotional experiences. Participants could make six different shifts: sad to happy, happy to sad, neutral to happy, neutral to sad, happy to neutral, sad to neutral. We then tested whether groups differed in the percentage of shifts between emotional images. We conducted an independent samples t test with group (higher vs. lower HPS scores) as the independent variable and the percentage of shifts between image types as the dependent variable. There was no significant difference between participants with higher (M = 61.88%, SD = 8.51%) compared with lower HPS scores (M = 63.01%, SD = 7.47%), t(61) = 0.562, p = .576, d = 0.14.
We repeated the above analyses with the percentage of choices to view neutral images as the dependent variable. There was no significant main effect of group, F(1, 61) = 2.16, p = .147, η2 = 0.03 (M = 20.83%, SE = 2.55% and M = 15.48%, SE = 2.59% for higher and lower HPS groups, respectively). There was no interaction between group and image type from which participants shifted, F(2, 61) = 0.80, p = .924, η2 < .01.
Nonemotional-image-selection task
We calculated for each participant the percentage of choices to shift between different types of geometrical shapes in the nonemotional-image-selection task. We conducted an independent samples t test with group (higher vs. lower HPS scores) as the independent variable and the percentage of choices to shift between geometrical shapes as the dependent variable. As expected, there was no significant group difference, t(61) = −0.208, p = .836, d = 0.06, and no group differences in choices to shift toward circles, F(1, 61) = 1.00, p = .320, η2 = .02; triangles, F(1, 61) = 0.36, p = .548, η2 < .01; and squares, F(1, 61) = 2.68, p = .107, η2 = 0.04. These findings indicate that group differences in choices to shift toward sad and happy images were specific to the emotional content of the stimuli.
Discussion
Contrary to Study 1, in Study 2, people at higher risk for BD did not differ from people at lower risk for BD in their self-reported motivation for sadness. However, behaviorally, participants at higher risk were more likely than participants at lower risk to shift toward sadness-inducing images. With regard to happiness, participants at higher risk for BD reported wanting to experience happiness less than participants in the lower risk group. Consistent with their self-report, participants at higher BD risk were less likely to shift toward happiness-inducing stimuli than did participants at lower BD risk. These patterns persisted even after controlling for current manic and depressive symptoms.
Consistent with Study 1, in Study 2, compared with people at lower risk for BD, people at higher risk reported wanting to experience increased emotional instability and preferred more frequent emotional shifts. Behaviorally, however, we did not find differences between groups in their choices to shift between stimuli that induce different emotional states. An essential next step is to assess motivation for emotions among people who are diagnosed with BD.
Study 3: Motivations for Emotions in People Diagnosed With BD
In Study 3, we sought to test whether the patterns observed in the previous studies extended to people with a clinical diagnosis of bipolar I disorder according to diagnostic criteria in the fourth edition of the Diagnostic and Statistical Manual of Mental Disorders (DSM-IV; American Psychiatric Association, 1994).
Method
Participants
We recruited for the current study participants with BD and nonpsychiatric control participants who had previously participated in at least one of three studies at either Yale University (institutional review board [IRB]: HSC 0912006070, HIC 1012007722, HIC 1309012679) or the University of Colorado Boulder (IRB 14-0597, 14-0672, 14-0390). Participants were invited to participate in the current study approximately 4 years later as part of a broader online follow-up survey study (e.g., also see Anderson et al., 2020).
Participants’ group status was determined at initial study entry. BD participants were not excluded for comorbid Axis I disorders given the high rate of comorbidity in BD (Kessler et al., 2005). Participants in the nonpsychiatric control group had no current or lifetime history of any DSM-IV Axis I disorder upon study entry. Exclusion criteria for both groups included head trauma, stroke, neurological disease, severe medical illness, severe cognitive impairment precluding participation, and current alcohol or substance abuse/dependence in the past 6 months. Participants were 40 adults diagnosed with bipolar I disorder (BD; 62.5% female) and 27 healthy control participants (HC; 77.8% female) between 21 and 62 years of age (BD group: M = 35.37 years, SD = 12; HC group: M = 33.78 years, SD = 9.52). BD participants were interepisode (i.e., not currently depressed, manic, or mixed) at initial study entry. However, participants were not restricted to symptomatic status for the follow-up survey, including the current study. Ten participants from the BD group and five participants from the HC group were excluded for failing attention checks, and one potential BD participant was excluded because of ineligibility determined in the initial diagnostic interview. According to a power analysis, our sample size of 40 provided .80 power to detect an effect size of d = 0.71 (with α = .05). See Table 1 for demographic and clinical characteristics.
Demographics and Clinical Characteristics in Study 4
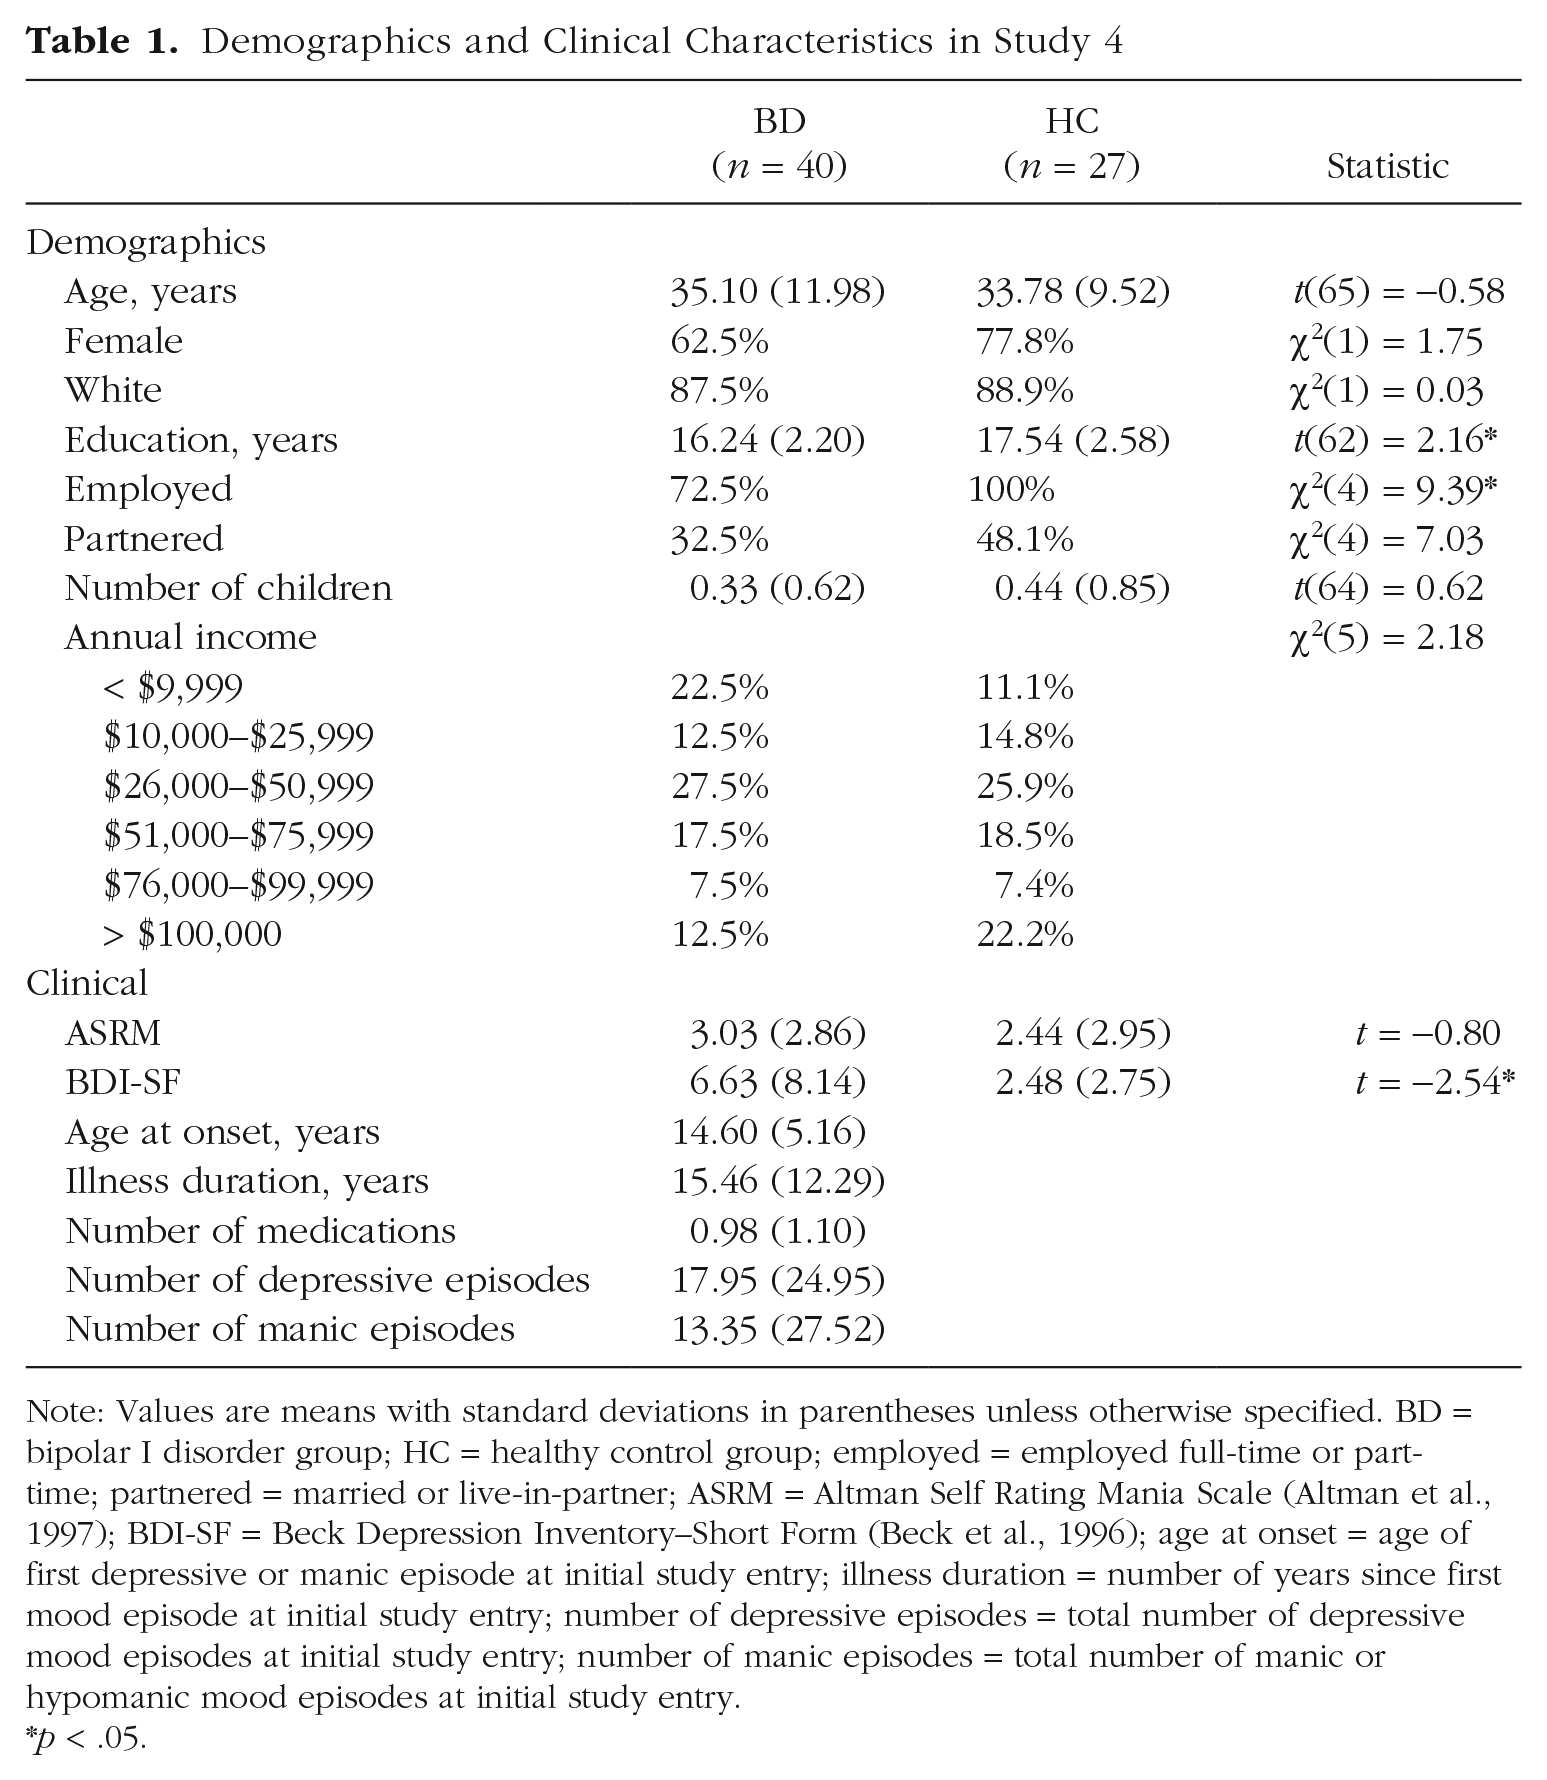
Note: Values are means with standard deviations in parentheses unless otherwise specified. BD = bipolar I disorder group; HC = healthy control group; employed = employed full-time or part-time; partnered = married or live-in-partner; ASRM = Altman Self Rating Mania Scale (Altman et al., 1997); BDI-SF = Beck Depression Inventory–Short Form (Beck et al., 1996); age at onset = age of first depressive or manic episode at initial study entry; illness duration = number of years since first mood episode at initial study entry; number of depressive episodes = total number of depressive mood episodes at initial study entry; number of manic episodes = total number of manic or hypomanic mood episodes at initial study entry.
p < .05.
Materials
We used the same measures as in Studies 1 and 2 to assess current manic symptoms (ASRM; α = .67), motivation for sadness (α = .78), motivation for happiness (α = .84), motivation for emotional instability (α = .64), preferred rate of emotional shifts (α = .63), current sadness (α = .89), and current happiness (α = .92). For assessing depressive symptoms, we used the Beck Depression Inventory–Short Form (BDI-SF; Beck & Beck, 1972; α = .94).
DSM-IV clinical diagnostic assessment
The Structured Clinical Interview for DSM-IV (SCID-IV; First et al., 2007) was used to determine diagnostic status at study entry for both BD and control groups. Trained clinical interviewers administered the SCID-IV. Interrater reliability for clinical diagnoses was assessed by raters who viewed the interviews and performed initial ratings independently (i.e., did not look at the interviewer’s scores beforehand) and discussed discrepancies and corrected any errors in scoring during consensus meetings (for additional details, see Gruber & Weinstock, 2018).
Emotional-image-selection task
We used the same task as in Study 3.
Procedure
Participants were contacted to participate in an optional follow-up online survey. Interested participants were reconsented and completed all survey measures remotely using Qualtrics, including questionnaires not relevant to the present investigation. 12 Participants first rated their current emotions. Then, they completed the emotional-image-selection task. Finally, they completed the remaining measures in random order.
Results
We report demographic and clinical characteristics of BD and HC in Table 1. Groups differed only in years of education and employment status (see Table 1). As expected, the BD group reported greater symptoms of depression than the HC group, t(65) = −2.54, p = .013, but did not differ on current symptoms of mania, t(65) = −0.80, p = .424. There were no significant gender differences in depression symptoms, t(65) = 0.151, p = .880, or mania symptoms, t(65) = −1.06, p = .293, across both groups.
Part 1: self-reported motivations for emotions
Aim 1a: motivation for sadness
We conducted an independent samples t test with group (BD, HC) as the independent variable and motivation for sadness as the dependent variable. We did not find a significant group difference, t(65) = −1.71, p = .090, d = 0.44 (M = 1.48, SD = 0.66 and M = 1.23, SD = 0.38 for the BD and HC groups, respectively). Results were identical when controlling for manic and depressive symptoms, F(1, 63) = 1.40, p = .241, η2 = .02. 13
Aim 1b: motivation for happiness
We repeated the above analysis with motivation for happiness as the dependent variable. We found no significant group difference, t(65) = 0.068, p = .946, d = 0.01. Results remained unchanged when controlling for manic and depressive symptoms, F(1, 63) = 0.002, p = .969, η2 < .01.
Aim 2: motivation for emotional instability
We repeated the analysis with emotional instability as the dependent variable. There was no group difference, t(65) = −1.11, p = .272, d = 0.28 (M = 2.90, SE = 0.90 and M = 2.67, SD = 0.73 for the BD and HC groups, respectively). Results were unchanged when controlling for manic and depressive symptoms, F(1, 63) = 2.53, p = .117, η2 = .04.
We repeated the above analysis with preferred rate of emotional shifts as the dependent variable. We found no difference between groups, t(65) = −0.323, p = .748, d = 0.08. 14 Results remained unchanged when controlling for manic and depressive symptoms, F(1, 63) = 0.106, p = .746, η2 = .02.
Part 2: image-selection-task
Aim 1a: motivation for sadness
Figure 2b depicts the percentage of shifts between image types by group. As in Study 2, we tested whether groups differed in the percentage of sad images selected and whether the selection of sad images was qualified by the image that was presented before participants made their choice. We conducted a repeated measures ANOVA with group (BD, HC) as a between-subjects factor and the image type from which participants shifted (sad, happy, neutral) as a within-subjects factor. The percentage of sad images selected served as the dependent variable. As predicted, we found a significant main effect of group, F(1, 65) = 5.51, p = .022, η2 = .08, such that participants with BD were more likely to shift toward sad images (M = 15.67%, SE = 2.23%) compared with the control group (M = 7.41%, SE = 2.72%). There was no interaction between group and the image type from which participants shifted, F(2, 65) = 0.512, p = .600, η2 < .01, indicating that the groups differed in shifts toward sad images regardless of what type of image they were shifting away from. When controlling for manic and depressive symptoms, group differences became nonsignificant, F(1, 63) = 2.96, p = .090, η2 = .05, but when controlling for manic and depressive symptoms and for medication status, results were again significant, F(1, 62) = 4.96, p = .034, η2 = .07. Groups differed in their shifts toward sad images even when they were shifting away from a neutral emotional state, t(65) = −2.58, p = .012, d = 0.64 (M = 20.00%, SD = 19.74%, and M = 8.89%, SD = 12.81% for the BD and HC groups, respectively).
Aim 1b: motivation for happiness
We repeated the above analysis with the percentage of choices to view happy images as the dependent variable. We found a significant main effect of group, F(1, 65) = 12.70, p = .001, η2 = .16. Participants in the BD group were less likely to shift toward happy images (M = 59.50%, SE = 3.39%) compared with the control group (M = 78.52%, SE = 4.12%). There was no interaction between group and the image type from which participants shifted, F(2, 65) = 0.20, p = .818, η2 < .01, indicating that group differences in shifts toward happy images were not qualified by the type of image participants shifted from. The results remained significant when controlling for manic and depressive symptoms, F(1, 63) = 5.81, p = .019, η2 = .08. Groups also differed in their shifts toward happy images when they were shifting away from a neutral emotional state, t(65) = 2.86, p = .006, d = 0.72 (M = 52.00%, SD = 29.23%, and M = 71.85%, SD = 24.97% for the BD and HC groups, respectively).
Aim 2: motivation for emotional instability
As in Study 2, for each participant, we calculated the percentage of choices to shift between images that induce different emotional experiences. We then conducted an independent samples t test with group (BD, HC) as the independent variable and the percentage of shifts as the dependent variable. We did not find a significant difference between groups, t(65) = −0.083, p = .934, d = 0.01. This did not change when controlling for manic and depressive symptoms, F(1, 63) = 0.023, p = .880, η2 < .01.
Motivation for a neutral emotional state
We repeated the above analysis with group (BD, HC) as a between-subjects factor, the type of image from which participants shifted (sad, happy, neutral) as a within-subjects factor, and the percentage of choices to view neutral images as the dependent variable. We found a significant main effect of group, F(1, 65) = 7.65, p = .007, η2 = .11. Contrary to the findings in Study 2, participants in the BD group (M = 24.83%, SE = 2.46%) were more likely than the control group (M = 14.07%, SE = 3.01%) to shift toward neutral images. There was no interaction between group and the type of image from which participants shifted, F(2, 65) = 0.29, p = .746, η2 < .01, indicating that group differences were not qualified by the type of image presented to participants before they made their choice. When controlling for manic and depressive symptoms, the group difference was no longer significant, F(1, 63) = 2.48, p = .120, η2 = .04. When we compared the BD and HC groups in their selection of neutral images following a neutral image, there was no significant difference between groups, t(65) = −1.62, p = .111, d = 0.42 (M = 28.00%, SD = 23.45%, and M = 19.26%, SD = 18.80% for the BD and HC groups, respectively).
Discussion
The findings of Study 3 suggest that, compared with healthy control participants, people diagnosed with BD are less likely to direct emotion regulation toward happiness and more likely to direct it toward sadness and a neutral emotional state. This was indicated by fewer shifts toward happiness-inducing stimuli and more shifts toward sad and neutral stimuli, although only the group difference in shifts toward happy stimuli remained significant when controlling for manic and depressive symptoms. With regard to self-report, participants diagnosed with a clinical history of BD did not differ from control participants in their self-reported motivation for sadness, happiness, or emotional instability.
General Discussion
In this investigation, we assessed motivations for emotions among people at higher risk and people diagnosed with BD (for a summary of findings in Studies 1–3, see Table 2). We found that BD risk and diagnosis are associated with an increased motivation for sadness and a decreased motivation for happiness, as manifested in regulatory behavior. These motivations were also observed in self-reports but less consistently. With regard to emotional instability, BD risk, but not the diagnosis of BD, was associated with an increased motivation for emotional instability and a preference for more frequent emotional shifts, as manifested in self-reports. Below, we discuss the implications of these findings for understanding motivations for emotions in BD, motivations for emotions across disorders, and research on motivation for emotions more generally.
Summary of Results in Studies 1 to 3
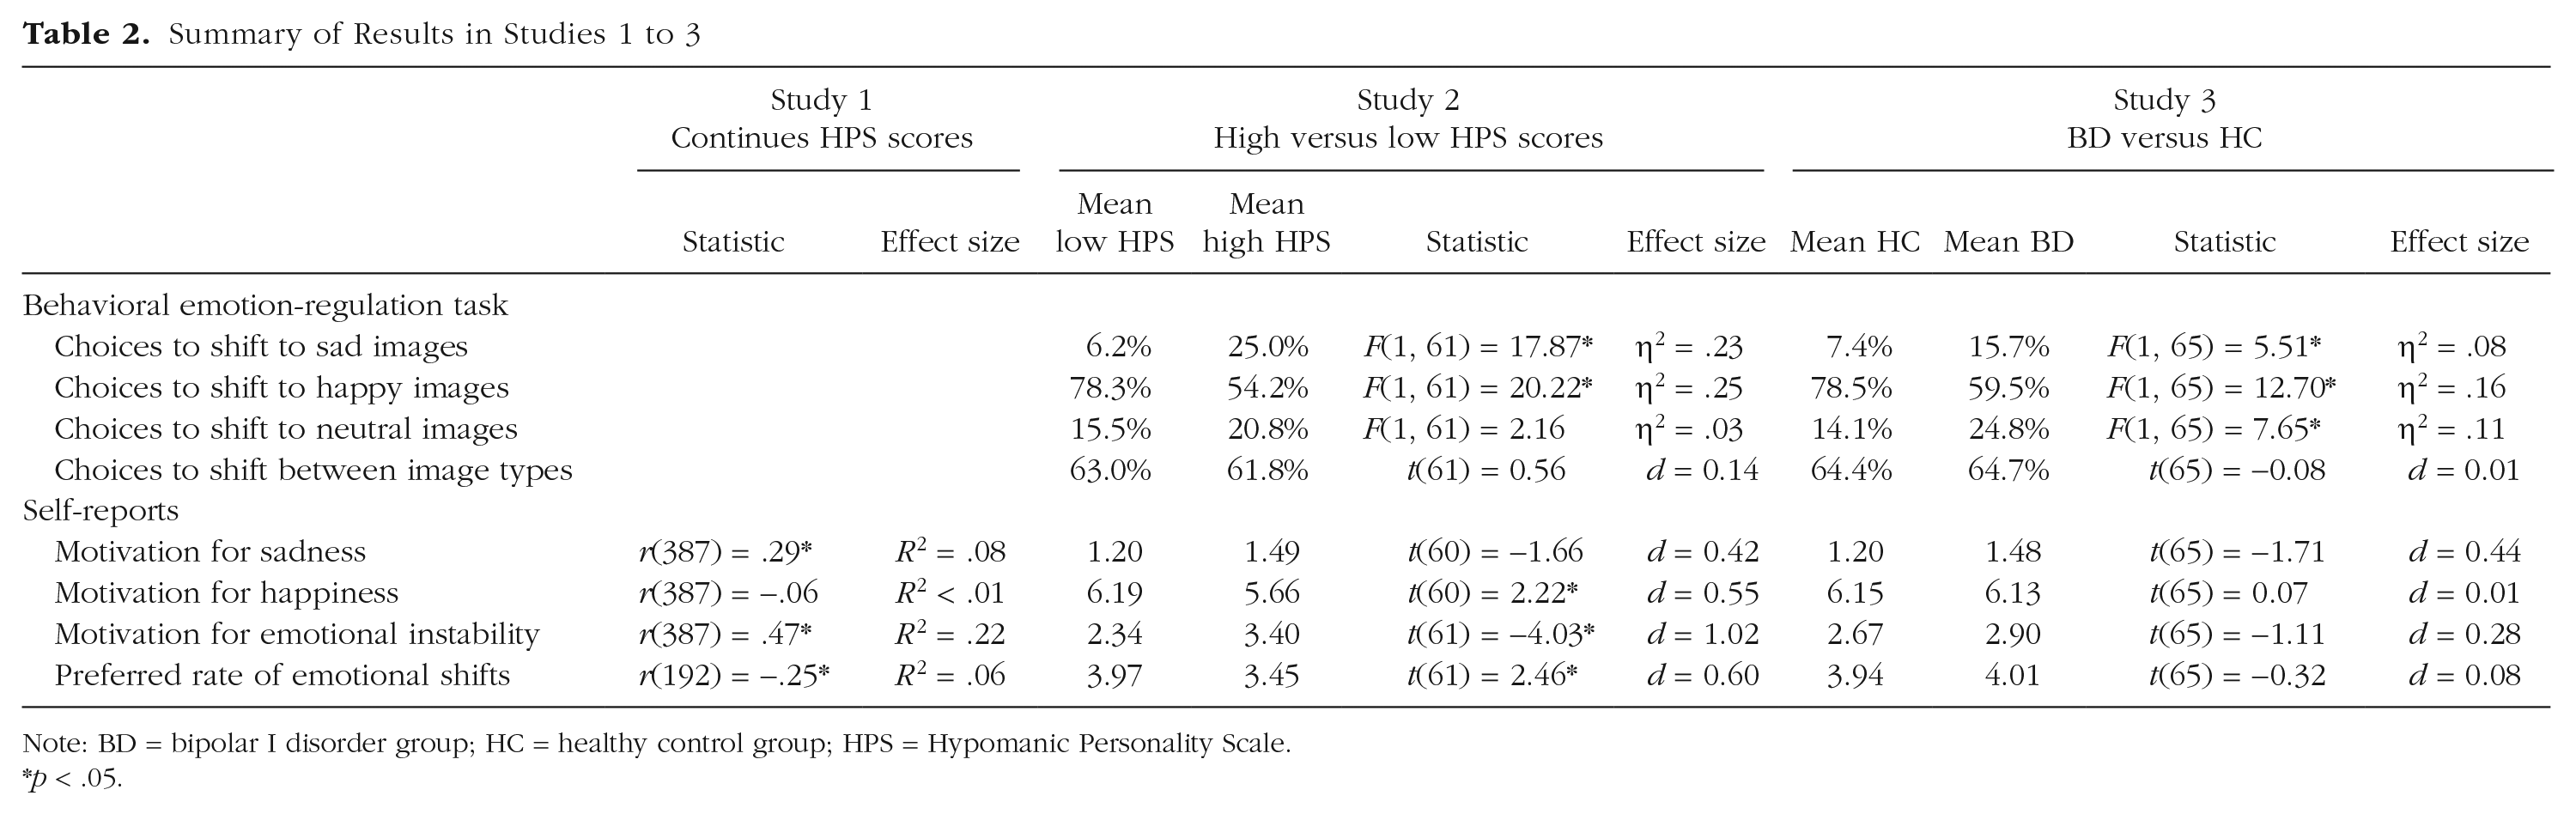
Note: BD = bipolar I disorder group; HC = healthy control group; HPS = Hypomanic Personality Scale.
p < .05.
Motivations for emotions in bipolar disorder
Sadness and happiness
Similar to the patterns ob-served in unipolar depression, we found that BD risk and diagnosis are associated with more frequent choices to direct emotion regulation toward increasing sadness and decreasing happiness. Regardless of whether they initially watched a sad, happy, or neutral image, people at a higher risk for and people diagnosed with BD were more likely than control participants to shift toward sad images by choosing to watch a sad image next. Likewise, when examined behaviorally, both participants at a higher risk for BD and people with BD were less likely than control participants to shift toward happy stimuli. Participants made significantly fewer choices to shift toward happy images regardless of the type of image they were shifting away from.
Associations between risk for and diagnosis of BD and motivation for sadness and happiness as assessed by self-reports were less consistent. We found evidence for an association between BD risk and elevated motivation for sadness in one of three studies. However, when controlling for depressive and manic symptoms, this association was evident in two of three studies. With regard to happiness, an association between BD risk and decreased motivation for happiness was observed in one of three studies. Given that low desirability of negative emotions and high desirability of positive emotions are dominant social norms (e.g., Tsai, 2007), self-reports of motivation for sadness and happiness might have been more susceptible to demand characteristics compared with the behavioral task. Another possibility is that people might have limited insight into their motivation for certain emotions. Future research should address this inconsistency, perhaps by using other indirect measures of motivations for emotions.
Negative and positive emotions are but one component in bipolar disorder. Sadness, for instance, is not synonymous with depression. Yet accumulating research attests to the central role of negative and positive emotions in BD and their implications for level of functioning (e.g., Gruber et al., 2013; Johnson et al., 2016). To the extent that individuals with BD are more likely than healthy individuals to behave in ways that increase their sadness or decrease their happiness, this could potentially contribute to elevated levels of negative affect and lower levels of positive affect.
These findings may shed light on conflicting evidence regarding positive affect in BD. In lab assessments, responses of people with BD to positive stimuli tend to be more intense and habituate more slowly (e.g., Gruber et al., 2008). In contrast, in daily life assessments, results are mixed: Some studies have found lower or equivalent levels of positive emotions among people with BD compared with healthy control participants (e.g., Gruber et al., 2013; Havermans et al., 2010). To explain this gap, some have suggested that whereas in the lab, participants are exposed to the same stimuli, in daily life, people with BD may encounter more stressors and therefore have fewer opportunities to experience positive emotions (e.g., Gruber et al., 2013). Our findings raise an additional possibility. People with BD might be less motivated to experience positive emotions and therefore experience them less often in daily life, where they can have more control over their feelings. Future research could test this possibility by tracking the motivation for positive emotions, emotion-regulatory behaviors, and positive emotion in daily life.
Finally, researchers of some studies have found that people with BD scored higher than healthy control participants on the valuation of happiness scale (e.g., Ford et al., 2015). We believe such findings do not necessarily conflict with the current findings. Luhmann and colleagues (2016) demonstrated that the valuation of happiness scale captures three distinct factors. Only one of these was related to lower well-being. That factor may capture the extent to which people judge themselves negatively when they feel unhappy (e.g., “If I don’t feel happy, maybe there is something wrong with me”) rather than the valuation of happiness per se. It is therefore possible that the association between BD and scores on the valuation of happiness scale is driven by negative self-judgments. Future research should simultaneously assess and compare the motivation for happiness and the valuation of happiness in people with BD.
Emotional instability
Our findings suggest that risk for BD is associated with an increased self-reported motivation for emotional instability. People at a higher compared with a lower risk for BD reported wanting to experience more emotional changes and wanting to shift more frequently between emotional states. Fluctuations between emotional states is central to BD (e.g., Holmes et al., 2016). Therefore, to the extent that motivation can shape the direction of emotion regulation, the motivation for greater emotional instability could potentially contribute to unstable emotional experiences. It is at least theoretically possible that a stronger motivation for emotional instability in people at higher risk for BD could lead them to regulate emotions in a manner that increases oscillations between different emotional states, which, in turn, might increase their risk to develop mania. Alternatively, experiences of emotional instability may lead people to retroactively report they want to feel this way. Future research could use prospective designs or manipulate the motivation for emotional instability to test these competing accounts.
Although we found consistent associations between BD risk and motivation for emotional instability as assessed by self-report, we did not detect associations between BD risk and shifts between different emotional stimuli in a behavioral task. One possibility is that people report certain motivations but do not act accordingly. Another possibility is that we did not find differences in regulatory behavior because of limitations of our behavioral task. In the self-report measures, individuals at higher risk for BD wanted to experience shifts in emotions every few days to every few weeks (M = 3.45; 2 = hours, 3 = days, and 4 = weeks), compared with every few weeks (M = 3.97) among people at lower risk for BD. Nonetheless, individuals at a higher BD risk wanted emotional shifts every few days to weeks rather than every few seconds, which is the type of shifts captured by our behavioral task. Accordingly, group differences in regulatory behavior related to the preferred rate of emotional shifts might manifest only over longer periods of time. Such differences could potentially be captured using experience sampling paradigms that track emotion-regulatory behavior over time.
Although we found increased motivation for emotional instability in people at higher risk for BD, we did not find this pattern among people diagnosed with BD. It is possible that because individuals with BD suffer substantial functional impairment associated with mood fluctuations (e.g., Samalin et al., 2016), they do not differ from control participants in their motivation for changes in mood even if such changes are familiar to them. People at higher risk for BD, however, typically do not experience the same level of impairment. Taken together, the results regarding emotional instability imply that although increased motivation for emotional instability might characterize people at higher risk for developing mania, it does not appear to extend to people who are suffering from BD.
Implications for understanding motivations for emotions across disorders
The findings regarding motivations for emotions in BD can also be considered within the broader context of psychopathology. Mood disorders, such as depression and BD, might be characterized by increased motivation for negative emotions (e.g., sadness) and by reduced motivation for positive emotions (e.g., happiness). This motivational tendency, in turn, could potentially affect subsequent emotional experience, ultimately exacerbating depressed mood and anhedonia. Because increased motivation for sadness and decreased motivation for happiness are also at least partly associated with a higher risk for BD, it is possible that this tendency poses a risk for developing mood disorders. It is therefore important to test whether this tendency extends to people at risk for depression (e.g., youths with familial risk for depression) and to assess the possible prospective effects of these motivational tendencies for the onset, maintenance, and recurrence of mood disorders. Our findings also support the possibility of disorder-specific patterns. The motivation for emotional instability might be specific to higher BD risk. If so, this would support the presence of both similar and unique patterns of motivation for emotions in psychopathology. Future research should directly compare the motivation for emotional instability and discrete emotions in different disorders (e.g., depression, BD, anxiety disorders) to identify differences and commonalities across psychopathologies.
Implications for understanding motivated emotion regulation
Examining motivation for emotions in the context of BD can provide some insight into the nature of motivated emotion regulation more generally. For instance, our findings demonstrate that people vary not only in the extent to which they want to experience discrete emotions but also in their motivation for other types of familiar emotional patterns (i.e., emotional stability/instability). To our knowledge, this is the first investigation to assess the extent to which people want to experience emotional patterns rather than emotional states. It raises the possibility that emotion regulation could be driven not only by how people want to feel in the moment but also by how they want their feelings to change over time. Assessing the motivation for emotional instability in the general population and its potential implications for emotion regulation and experience is an important future direction.
Limitations and future directions
The current investigation provided initial information regarding motivation for emotions associated with BD risk and BD. However, many open questions remain. First, the sample of participants diagnosed with BD in Study 3 was heterogeneous with respect to symptomatic status (i.e., in remission, depressed, manic). Because motivation for certain emotions might change as a function of symptomatic status, future research is needed to separately assess and compare motivation for emotions during manic episodes, during depressive episodes, and during remission. Differences in the selection of sad stimuli between BD and HC groups did not remain statistically significant when controlling for manic and depressive symptoms. This further raises the possibility that group differences could depend on current symptoms. In addition, because the online format of Study 3 imposed length limitations, we did not collect participants’ reactivity ratings in response to the images in the behavioral task, as was done in Study 2. Future research should assess and compare reactivity across groups.
Another limitation of the current investigation was that although participants at a higher risk for BD in Study 2 scored at least 1 SD above the mean in the risk for mania measure (HPS), not all participants in the higher risk group met Eckblad and Chapman’s (1986) cutoff for high BD risk. When repeating the analyses with only participants who met the cutoff, we obtained identical results. In addition, people who score between 20.5 and 30 on the HPS were also shown to be at greater risk for developing bipolar spectrum disorders (Walsh et al., 2015). Nonetheless, a replication with a larger sample of participants that meet Eckblad and Chapman’s cutoff is required. We also acknowledge that because we compared groups with either higher or lower HPS scores, we cannot determine whether the effects in Study 2 were driven by people who scored extremely low on the HPS or by people who scored extremely high on the HPS.
Future research could also explore the potential mechanisms underlying differences in motivations for emotions in BD. Our findings provide some support for the idea that people may be somewhat motivated to experience familiar emotional patterns even when these patterns are the ones characterizing their emotional disturbance. It is still unclear, however, whether familiarity or other mechanisms (e.g., hopelessness) causally drive differences in motivation for emotions in BD.
Finally, further research is needed to assess the potential implications of differential motivation for emotional experiences in BD. It is possible that differential patterns of motivations for emotions merely characterize people at higher risk for BD and people diagnosed with BD without carrying significant implications for future emotional experiences or mental health. It is therefore important to test whether a stronger motivation for emotional instability predicts subsequent mood fluctuations and a higher likelihood of a manic episode among individuals at higher risk for BD. There is also a need to assess the clinical implications of increased motivation for sadness and reduced motivation for happiness observed among people at higher risk for and diagnosed with BD. In depression, the reduced motivation for happiness was prospectively related to fewer attempts to down-regulate negative emotions and to more severe clinical symptoms during stress (e.g., Millgram et al., 2019). In the context of BD, however, the motivation for happiness could be a double-edged sword. On the one hand, avoiding happiness-inducing activities could be adaptive to the extent that it serves to prevent mania (e.g., Edge et al., 2013). On the other hand, it could exacerbate negative emotions and perhaps facilitate depression (e.g., Edge et al., 2013). Testing the unique implications of the motivation for emotional experiences in BD, therefore, is an important task for future research.
Supplemental Material
sj-pdf-1-cpx-10.1177_2167702620979583 – Supplemental material for Motivations for Emotions in Bipolar Disorder
Supplemental material, sj-pdf-1-cpx-10.1177_2167702620979583 for Motivations for Emotions in Bipolar Disorder by Yael Millgram, June Gruber, Cynthia M. Villanueva, Anna Rapoport and Maya Tamir in Clinical Psychological Science
Footnotes
Acknowledgements
Transparency
Action Editor: Michael F. Pogue-Geile
Editor: Kenneth J. Sher
Author Contributions
Y. Millgram, J. Gruber, and M. Tamir developed the study concept and contributed to the study design. Data collection was performed by Y. Millgram, A. Rapoport, and C. M. Villanueva. Data analysis was performed by Y. Millgram under the supervision of M. Tamir. Y. Millgram, J. Gruber, and M. Tamir drafted the manuscript, and C. M. Villanueva provided critical revisions. All of the authors approved the final manuscript for submission.
Notes
References
Supplementary Material
Please find the following supplemental material available below.
For Open Access articles published under a Creative Commons License, all supplemental material carries the same license as the article it is associated with.
For non-Open Access articles published, all supplemental material carries a non-exclusive license, and permission requests for re-use of supplemental material or any part of supplemental material shall be sent directly to the copyright owner as specified in the copyright notice associated with the article.