



Abstract
The thermodynamic surface properties of biomaterials play a key role in governing interfacial interactions and are commonly characterized by surface free energy (SFE) and its components derived from wetting data. However, different theoretical approaches used for SFE determination may yield substantially different results, particularly for polar and high-energy surfaces. In this study, the total surface free energy and its components were systematically analyzed for a range of clinically relevant biomaterial surfaces, including titanium, gold, cobalt–chromium alloy, nano-hydroxyapatite, and amorphous Teflon, prepared as smooth thin films on glass substrates. Static contact angles with water, glycerol, ethylene glycol, and diiodomethane were measured to assess wettability and to calculate SFE using three commonly applied models: the Owens–Wendt–Rabel–Kaelble (geometric mean) approach, the Lifshitz–van der Waals/acid–base (LW–AB) approach, and the equation of state (EOS) approach. These models estimate total SFE as well as nonpolar, polar, and acid–base components, enabling a detailed comparison of model-dependent surface energetic data. The results show good agreement between the different approaches for low-energy, hydrophobic surfaces, whereas pronounced discrepancies occur for hydrophilic, high-energy materials, particularly in the calculated polar and acid–base contributions. While total SFE values were partly consistent across methods, the relative magnitudes of individual SFE components strongly depended on the applied theoretical model. Overall, this study highlights that SFE should not be considered an intrinsic material property but a model-dependent descriptor. Careful selection of the SFE calculation approach and cautious interpretation of SFE components are essential when using thermodynamic surface analysis to compare biomaterial surfaces or to relate surface energetics to interfacial phenomena such as biofilm formation.
Keywords
Introduction
Wettability, quantified by contact angles and linked to surface free energy via the fundamental Young equation, 1 is defined as the ability of a liquid to spread on a solid surface. 2 It is a key surface property governing interfacial interactions across a wide range of fields and applications: Wettability affects coating adhesion, lubrication, and microfluidic performance in engineering systems; controls wetting, spreading, anti-fouling behavior, and environmentally relevant surface processes; enables reversible switching of surface functionality; and influences protein adsorption, cell attachment, and bacterial adhesion in biomedical implants and tissue engineering.3–6 Bacteria growing in matrix-enclosed biofilms, the counterpart of non-attached individual planktonic species, are prevalent on most wet surfaces in nature and can cause serious environmental and biomedical problems.7,8 A problem with respect to medicine is the resistance of biofilms to host immune responses and antibiotic treatments.7,9,10 Thus, in terms of resource consumption, biomaterial related infections will continue to constitute one of the largest problems facing the changing health care systems in the future.
Biofilms on implantable materials are one of the primary causes of chronic implant infections and implant failure, and multidisciplinary strategies (material modification, antimicrobial coatings, biological approaches) are needed to reduce the risk.7,11
Staphylococci, particularly S. epidermidis and S. aureus, are the primary pathogens implicated in infections of medical implant devices. In dentistry, S. aureus may contribute to systemic infections through bacteremia following invasive procedures, and bacterial contamination is considered a contributing factor to early implant failure. 12 Dental titanium implants, which function as artificial tooth roots, therefore require an optimized epithelial seal and biofilm-reducing surface properties to prevent bacterial infiltration into subgingival regions and subsequent infection.3,13,14 Consequently, dental implants share infection risks not only during surgical placement but throughout their functional lifetime, similar to other transcutaneous invasive devices such as central venous catheters. Investigating the role of biomaterial surface properties in early bacterial adhesion is thus essential for the development of advanced anti-adhesive or biofilm-reducing surfaces for dental and biomedical implants.
Primary bacterial adhesion to artificial surfaces depends on physicochemical surface properties such as chemical composition, charge, roughness, hydrophilicity, and free energy of both the bacteria and the material surfaces.15,16 Moreover, bacterial adhesion is influenced by environmental factors, the presence of conditioning films, and by the flow conditions.17–19 Bacterial adhesion to surfaces is therefore very complex and multifactorial and it is open to question whether it can ever be captured in one generally valid mechanism. 17
Due to the colloidal dimensions of bacteria assuming that bacteria behave as inert particles, bacterial adhesion can be understood by a physico-chemical approach. 20 Physico-chemical predictions concern the first, reversible phase of bacterial adhesion which is followed by a slower second, irreversible phase of biological activity. 20 The classical DLVO (Derjaguin-Landau-Verwey-Overbeek) theory of colloidal stability described the cell/substratum interactions as the sum of attractive van der Waals interactions and repulsive electrostatic interactions due to their overlapping electrical double layers of the charged surfaces of both the bacteria and the substrate. The DLVO theory predicts reversible bacterial adhesion arising from a secondary interaction minimum, the depth of which depends on the electrolyte concentration. The extended DLVO theory is incorporating Lewis acid–base interactions in addition to van der Waals and electrostatic forces. This enables a more realistic description and prediction of microbial adhesion to surfaces. 21
In contrast to DLVO theory, which considers the distance dependence of interaction energy, the thermodynamic approach evaluates the strength of interaction based on the balance of interfacial free energies between the bacteria, substrate, and surrounding liquid. 22
We applied in our study different thermodynamic approaches to a range of biomaterial and dental surfaces in order to shed more light on surface thermodynamics.
For this evaluation, there are currently different approaches 23 based on contact angle measurements revealing total surface free energy (SFE) or components thereof, such as polar and dispersion components of SFE. More sophisticated approaches utilize SFE consisting of nonpolar and polar portions and split the polar component into acidic and basic components, considering the electron donor and electron accepting components of surfaces. Since the latter, the Lifshitz-van der Waals/acid-base (LW-AB) approach 24 is controversially debated in the literature,25–27 we additionally applied two alternative approaches, that is, the geometric mean, 28 and the equation of state (EOS) approach. 29
Furthermore, previous studies indicated that surface roughness levels greater than 0.2 µm influence dental bacterial adhesion and biofilm formation, whereas on smoother material surfaces biofilm formation is unlikely to depend on variations in roughness. 30 Accordingly, the present study focused on a detailed SFE characterization of smooth surfaces below 0.2 µm of clinically applied and experimental biomedical materials, including pure titanium (Ti), gold, and a cobalt–chromium alloy (Co–Cr). In addition, experimental surface coatings intended either for bone contact, such as nano-hydroxyapatite (nano-HA), or for oral biomaterial surfaces, such as amorphous Teflon (Teflon AF), were investigated. The primary objective of this study was to compare surface energetic parameters obtained using different surface free energy (SFE) approaches across these biomaterial surfaces.
Materials and methods
Surface Preparation
All material layers were prepared as thin films on 76 mm × 26 mm × 1 mm glass slides using different coating procedures, as described below. Prior to coating, all glass slides were ultrasonically cleaned for 30 min in Piranha solution (2:3, 30% H2O2:H2SO4 (conc.)), rinsed with ultrapure water, and dried under a nitrogen stream. Two samples only per surface modification were prepared, as this study was designed as a pilot investigation. While the small number of replicates limits statistical power, the data provide valuable preliminary insights into the surface properties of the investigated materials. The three metallic coatings (titanium, gold, and cobalt–chromium) were deposited by sputtering using a Sputron I system (Balzers AG, Liechtenstein) at a power of 100 W under argon atmosphere, with a working pressure of approximately 3 × 10⁻³ mbar, while maintaining the substrate temperature below 100°C. Films with a nominal thickness of 100 nm were produced to ensure continuous surface coverage while minimizing bulk material effects. The targets had a purity of ⩾99.9% for titanium, gold, and the metallic components of the Co–Cr alloy. The deposition rate was approximately 1 nm/s, and film thickness was controlled by deposition time and verified using a stylus profilometer (Dektak, Veeco Instruments Inc., USA) which was regularly calibrated using a geometry standard. The base pressure prior to sputtering was on the order of ~10−5 mbar, and the substrate-target distance, determined by the Sputron I system geometry, was in the typical range of 10–15 cm.
As fluoropolymer, the original 6% solution of Teflon® AF (Du Pont, USA), amorphous Teflon (type 1601) in Fluorinert FC-40 (3M, USA) was used. For spin-coating, the original Teflon AF solution was further 1:3 (Teflon AF:Fluorinert FC40) diluted. The polymer thin coatings were achieved by standard spin-coating technique (KW-4A, SPI supplies, USA), using 200 µl of the diluted Teflon AF solution at spin-coater level 1 at 1000 rpm for 12 s, and at level 2 at 3000 rpm for 30 s. Coated samples were dried for 15 min in an oven at 110°C. Adhesion to glass substrates was optimized by silanization using a 3.5% solution of 1H,1H,2H,2H-perfluorodecyltrichlorosilane (ABCR, Karlsruhe, Germany) in absolute ethanol. Glass plates were ultrasonically treated for 2 min in the silane solution, which was maintained at 35°C. Subsequently, the samples were rinsed twice with absolute ethanol and dried at 110°C for 10 min in an oven. After drying, the samples were briefly allowed to cool to room temperature prior to spin coating.
Nano-hydroxyapatite (HA) sol was synthesized by a wet chemical method following previously reported procedures.31,32 Calcium nitrate and ammonium hydrogen phosphate were mixed in aqueous solution at a Ca/P molar ratio of 1.67 under vigorous stirring at room temperature. The mixture was aged at 100°C for 48 h and then cooled to room temperature to obtain the nano-HA sol. The sol was deposited onto glass substrates by spin-coating and dried in air. Detailed characterization of particle size and crystallinity has been reported elsewhere.31,32
Glass plates, ultrasonically cleaned by ethanol and dried under nitrogen, were used as reference. All surfaces with the exception of glass were investigated as prepared without further cleaning.
Surface roughness analysis
Surface roughness of all prepared surfaces was controlled by a profilometer (Perthometer Concept, Mahr, Göttingen, Germany) equipped with a diamond tracing stylus (point radius 2 µm, point angle 90°). Instrument calibration was regularly done using a geometry standard (PGN-1 No.8251, Mahr, Göttingen, Germany). Mean roughness Ra and ten-point average roughness Rz were calculated according to DIN EN ISO 4287:1998. Two plates from each sample were investigated with single profile lengths of 5.6 mm. Measurements were done with a cutoff Gaussian digital filter length of 0.8 mm separating roughness from waviness, and with a measurement speed of 0.5 mm/s. Five parallel profiles were analyzed on each plate, followed by five more profiles perpendicular to the initial profiles, for a total of 10 measurements per sample.
Hydrophilicity analysis
To quantify hydrophilicity, 2 water contact angles were measured by a high-resolution drop shape analysis system (DSA10-MK2, KRUESS) at controlled room temperature of 22 ± 1°C. Water (Millipore) drops (2 µl) were placed on the material surfaces and the respective drop shapes were recorded by a CCD video camera. Contact angles of equilibrated drops were measured exactly 10 s after drop delivery on each material surface, respectively. On each sample, one drop of each of the four wetting liquids was analyzed. The reported contact angles correspond to the average of the left and right angles determined from the sessile drop profile by the instrument software. No significant differences between the left and right angles were observed during measurements.
Surface free energy analysis
SFE estimates of the solid surfaces were based on additional contact angle measurements with diiodomethane, glycerol and ethylene glycol (Merck, Darmstadt, Germany) as wetting liquids, using the same experimental set-up and 2 µl drop volume as described for hydrophilicity measurements. For all four liquids, their mean contact angle values on the respective surfaces were used for SFE calculations. According to the Young-equation (equation (1)), theoretically, the equilibrium contact angle

To calculate
Total SFE, the nonpolar Lifshitz-van der Waals (LW) and the polar Lewis acid-base (AB) components of SFE with the polar electron acceptor

The acid and base components are related to the total acid-base component

Based on the equation of state approach which yields total SFE values without splitting them into components, 29 SFE was calculated according to equation (4) 33 with setting the value of the constant ß to 0.0001247 (m2/mJ)2,34 and requires the contact angle of one wetting liquid.

In another approach, Owens and Wendt expressed the total SFE as a sum of dispersion and polar intermolecular force components,

After combining this equation with equation (1), linear equation (5) can be obtained:

Using the measured contact angles, the Y-axis intercept and the slope of the straight line can be calculated by linear regression, thereby determining the polar and dispersed components of the SFE. Rabel systematically listed polar and disperse components of surface energy. 36 Kaelble proposed the technique we used in our study, which consists in taking the mean of paired contact angles of two test liquids calculated according to Owens-Wendt. 28 Acknowledging all contributions to the development of this approach, it is often referred to in the literature as the Owens–Wendt–Rabel–Kaelble method.
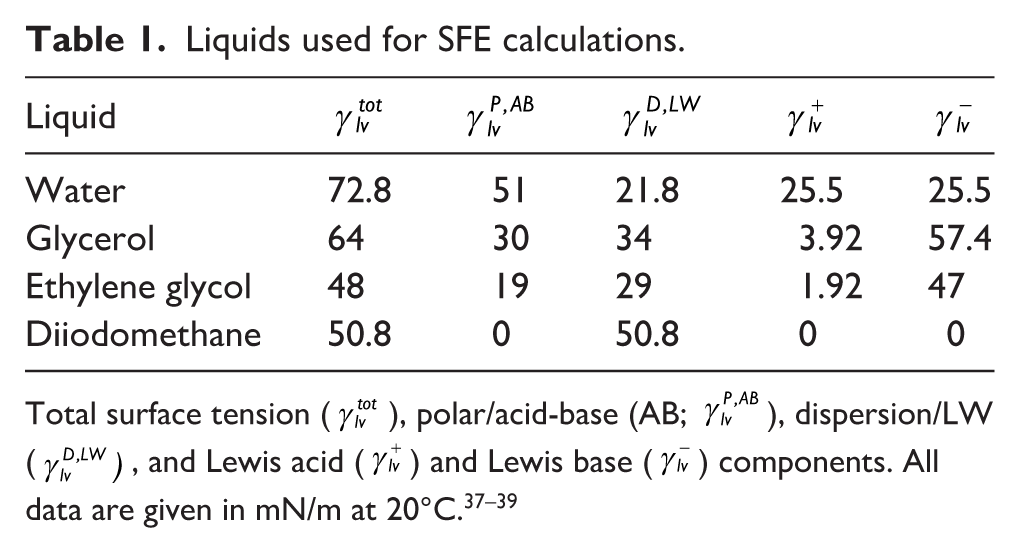
Liquid selection is based on the requirement of at least one apolar and one polar liquid for the geometric mean approach, and at least one apolar (pure LW) liquid and two polar liquids with differing acid–base characteristics for the LW–AB approach. In addition, the selected liquids used for SFE calculations (Table 1) cover a broad range of polar and dispersive surface tension components, which enhances the robustness of the surface energy determination. The polar liquids were chosen to exhibit different electron donor/acceptor properties, enabling a reliable separation of acid–base contributions. Furthermore, the liquids provide stable and reproducible contact angles on the investigated surfaces and are commonly used in the literature, facilitating comparison with previous studies. The use of four liquids results in an overdetermined system of equations, which was solved by least-squares fitting to improve statistical reliability. EOS was calculated individually for each of these liquids. Calculations for all three SFE approaches have been performed using DSA calculation software (DSA, version 1.65.0.49, Kruess, Germany) and SCA20 Version 6.1.11 (DataPhysics Instruments GmbH, Filderstadt, Germany).
Liquids used for SFE calculations.
Results
Roughness and thermodynamic characteristics
Surface roughness of all substrates was analyzed by profilometry and quantified by means of two surface amplitude parameters, Ra and Rz. As shown in Figure 1, Ra characterizes all substrate surfaces as very smooth. Ra values range between 0.026 µm for nano-HA and 0.031 µm for the gold surface. Similar roughness of all substrates is also shown by Rz values which range between 0.234 µm both for Ti and gold, and 0.271 µm for Teflon AF.
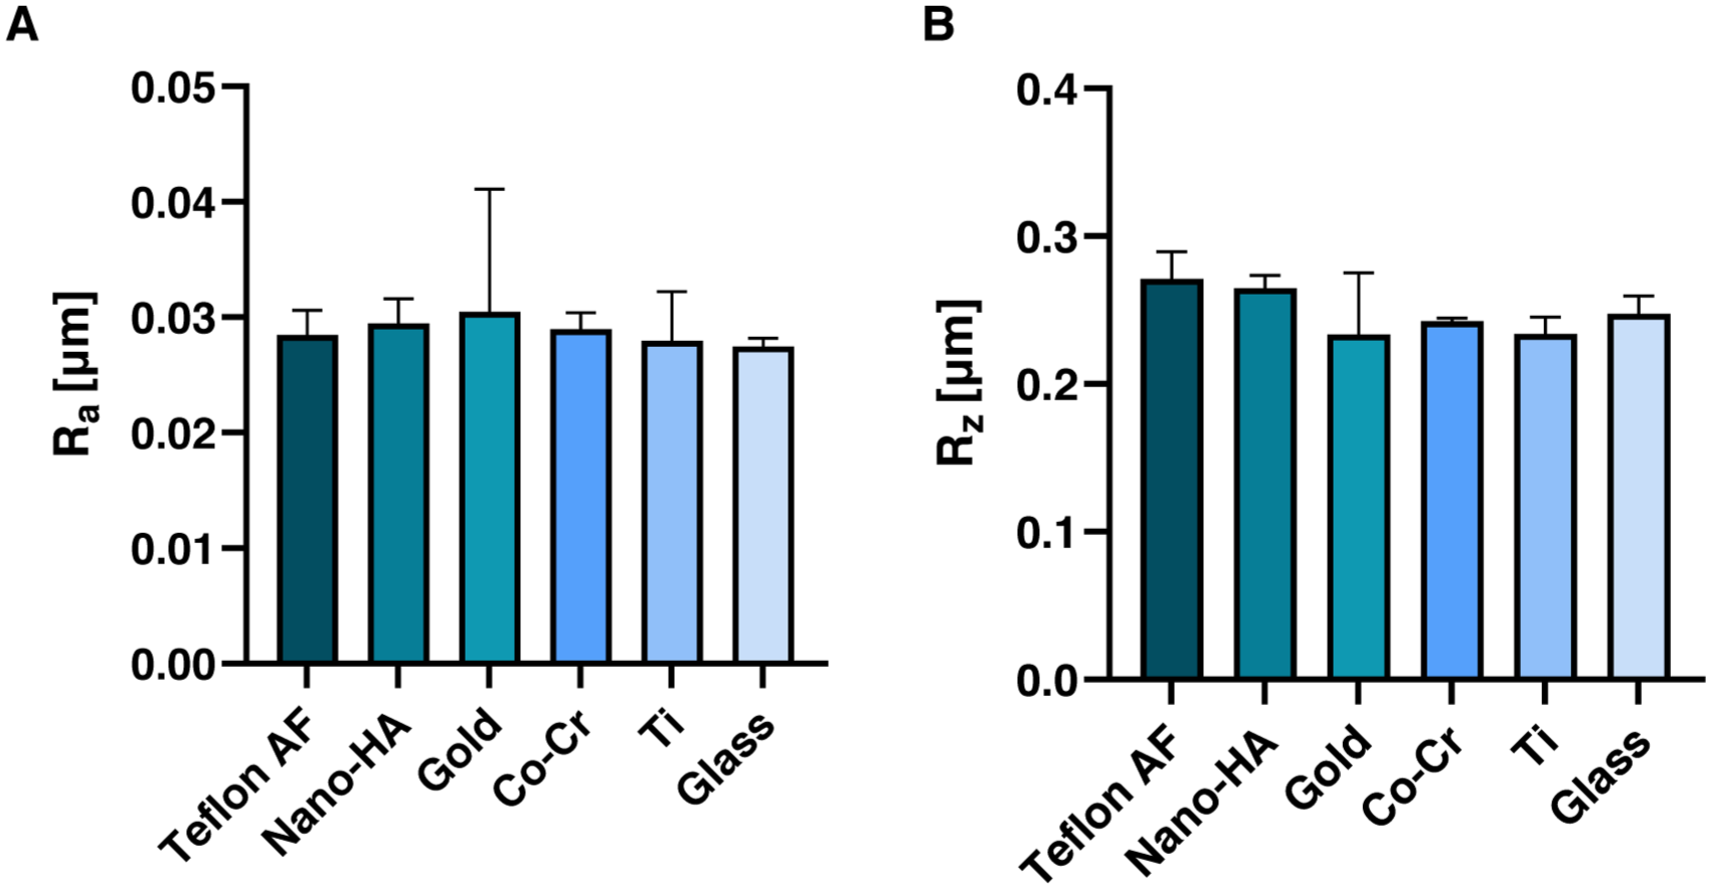
Mean (standard deviation) values of roughness parameters Ra and Rz.
In contrast to roughness, thermodynamic surface properties significantly differ within the materials under research. Hydrophilicity of all surfaces was quantified by static water contact angle measurements. The water contact angles are reported together with all measured contact angles of further liquids in Table 2.
Mean (standard deviation) static contact angles (°) of the wetting liquids on the respective biomaterial surfaces.

The contact angles show a wide range in the hydrophilicity of the different types of material surfaces under research. Teflon represents the only material surface with water contact angles > 90°, indicating strong hydrophobicity. Co-Cr had poor wettability with contact angles just below 90°. A moderate hydrophilicity could be attributed to nano-HA (63°) and gold (63°), whereas Ti and glass were more hydrophilic with water contact angles of 25° and 47°, respectively.
The results of total SFE
SFE analysis according to Lifshitz-van der Waals/acid-base (see equation (2)
24
), and geometric mean approach (see equations (5) and (6)28,35) with the following components: Total SFE (
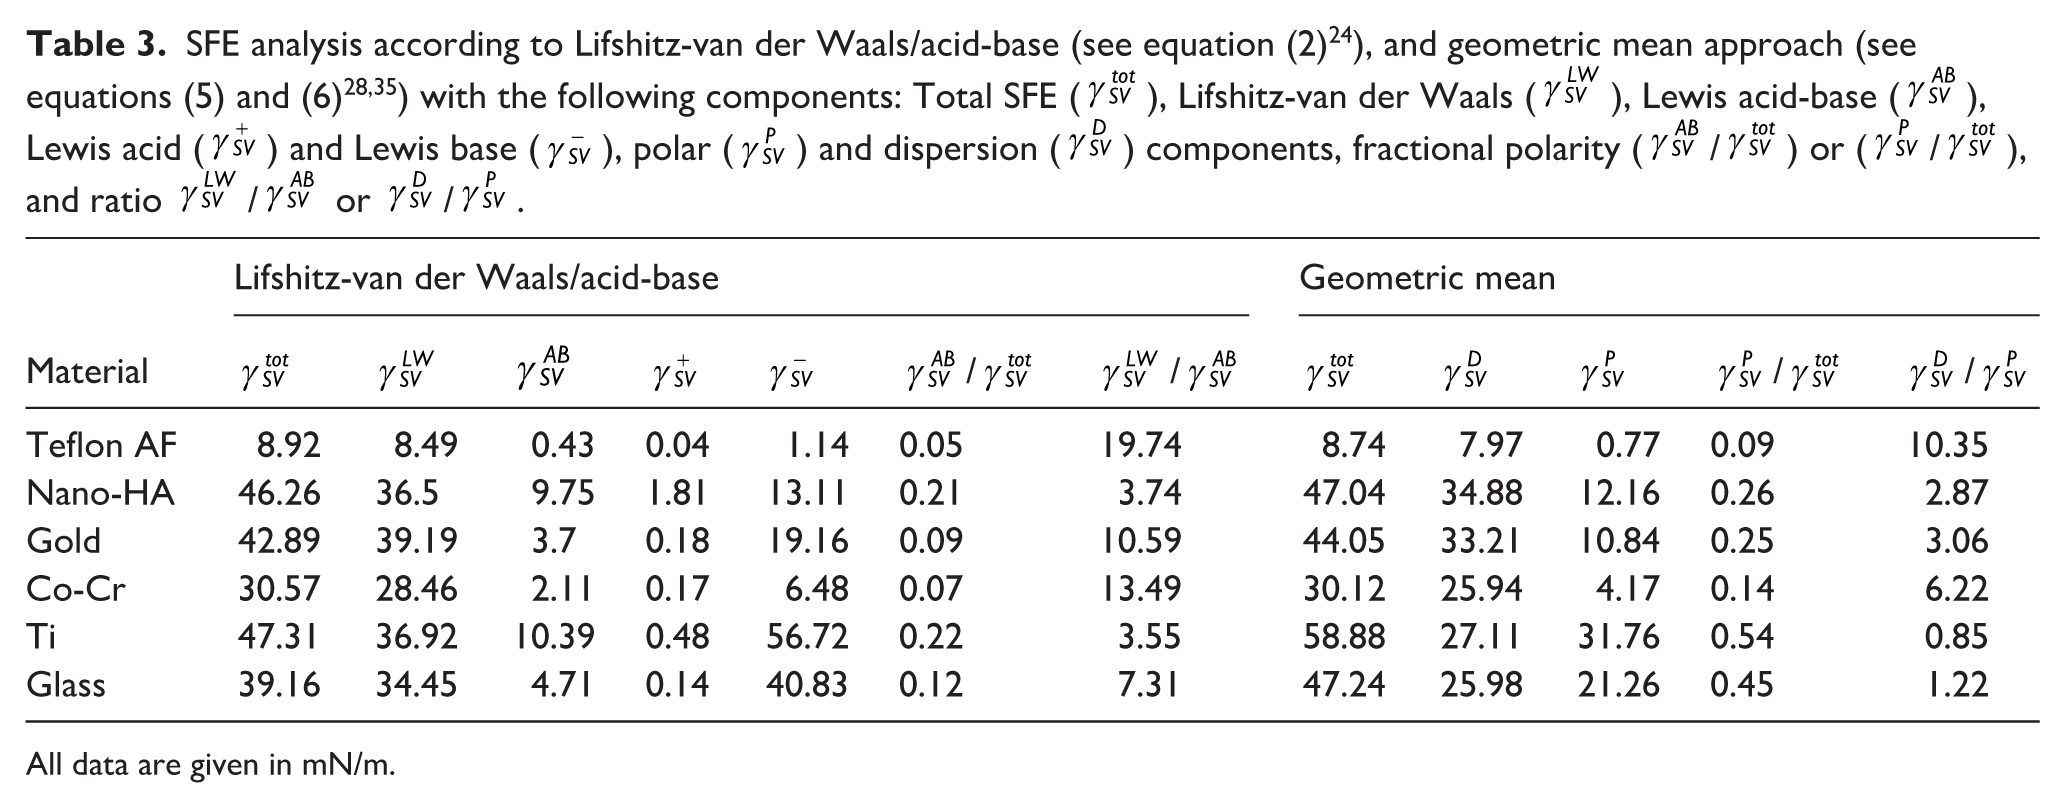
All data are given in mN/m.
Total SFE (
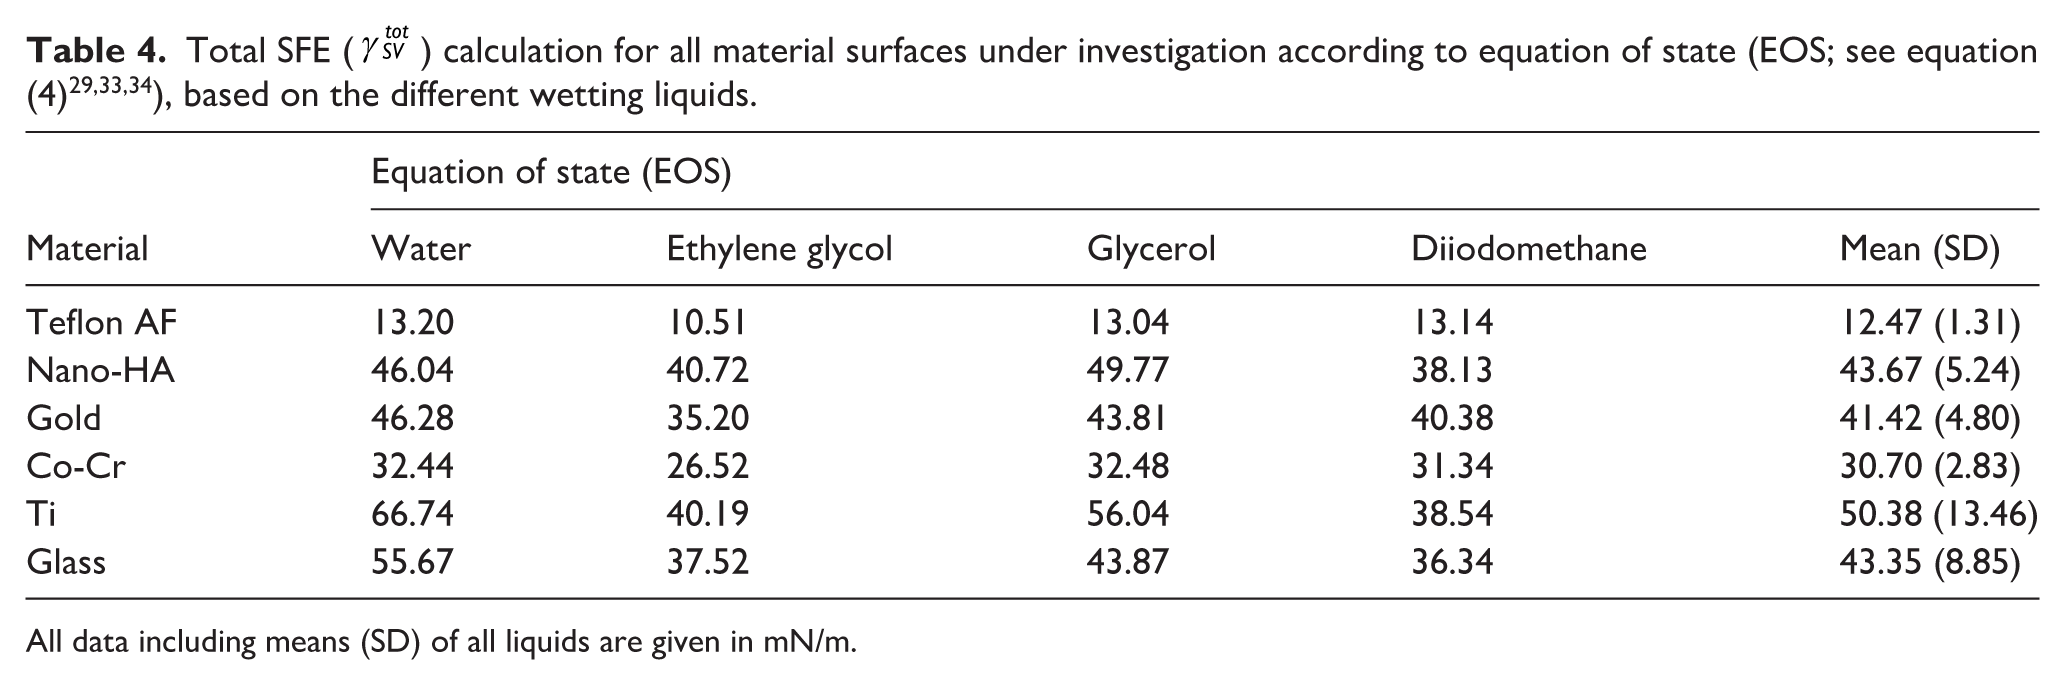
All data including means (SD) of all liquids are given in mN/m.
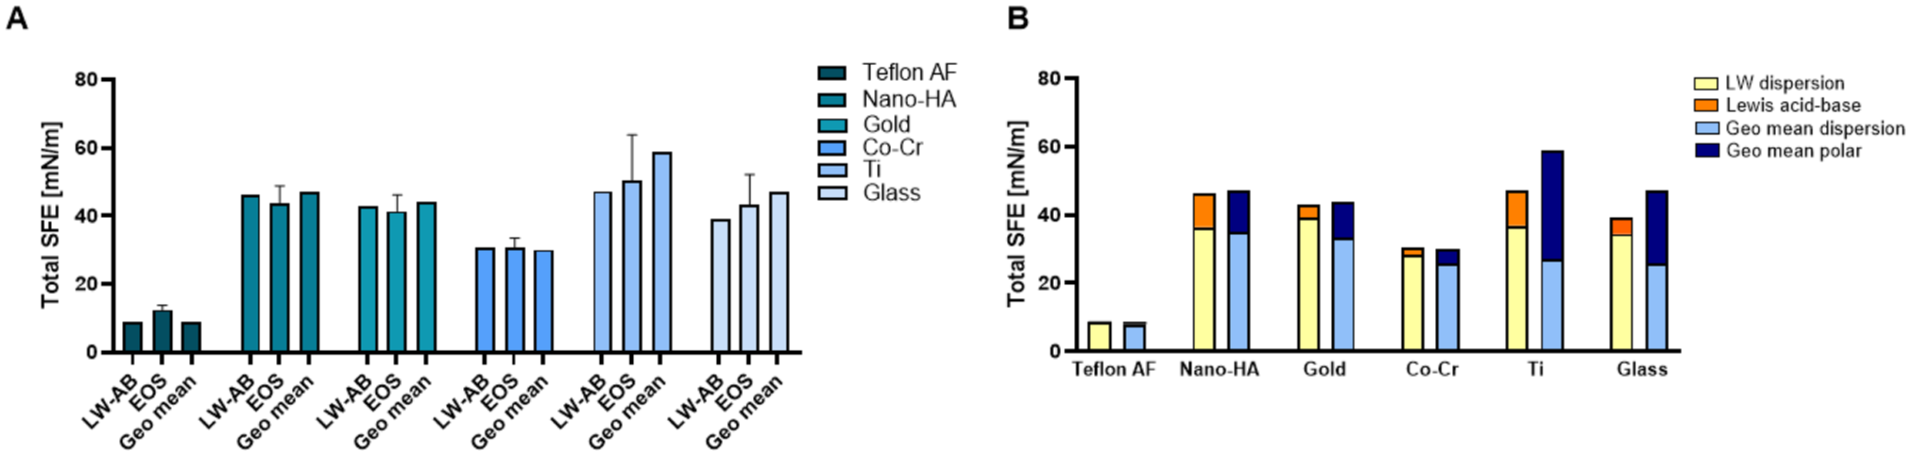
With the exception of Teflon, which has very low dispersion and Lifshitz-van der Waals components, all other material surfaces were similar in their nonpolar characteristics, ranging between 25.9 and 34.9 mN/m for
Comparing rankings of the materials with
Overall, rankings of materials using total SFE or SFE components obtained from different approaches show substantial discrepancies. Whereas hydrophobic materials such as Teflon can consistently be ranked as the lowest-energy surfaces, the ranking of more hydrophilic materials varies between approaches.
Table 3 additionally shows the fractional polarity
Discussion
Contact angle measurements in this study were performed 10 s after droplet deposition. This choice reflects a compromise between competing time-dependent effects that influence droplet shape. On short timescalesdroplet relaxation processes, both with and without contact line motion, lead to a continuous evolution of the contact angle, such that measurements taken immediately after deposition may not represent a quasi-equilibrated state. This time dependence of contact angles during spreading and relaxation is well documented in the literature. 40 On longer timescales, however, evaporation can increasingly affect droplet geometry. However, within the selected time window of 10 s, evaporation effects are negligible under the present experimental conditions, 41 while the most pronounced initial relaxation processes have largely decayed, allowing the droplet to approach a near-equilibrium configuration. Although complete equilibration may require longer times, the use of a fixed delay of 10 s provides a consistent and reproducible basis for comparison across all measurements.
The surface tension component values were taken from literature sources reported at 20°C. All experiments in this study were conducted at 22 ± 1°C, which is very close to the reference temperature; therefore, any temperature-related deviations in surface tension are expected to be minimal and do not significantly affect the calculated surface energy values.
All three SFE approaches yield similar results for the total SFE
Compared to the EOS and geometric or harmonic mean approaches, the Lifshitz-van der Waals/acid-base (LW-AB) approach yields additional data by subdividing the polar component into Lewis acid and Lewis base components. It should be pointed out that the values of the Lewis base component are much larger than the corresponding Lewis acid values. This is in general accordance with the LW-AB approach, which seems to characterize surfaces as overwhelmingly basic with a small or negligible acidic component. 23
Beyond method-dependent differences between individual materials, the present results emphasize that SFE should not be interpreted as an absolute material property, but rather as a model-dependent descriptor influenced by both the selected wetting liquids and the underlying theoretical assumptions. This is particularly relevant for hydrophilic, high-energy surfaces, where polar and acid–base interactions dominate and small variations in contact angle measurements can lead to pronounced differences in calculated SFE components. Consequently, absolute SFE values obtained using different calculation approaches are not directly comparable and should be interpreted with caution. Moreover, the pronounced dominance of Lewis base components across all materials underscores the importance of electron-donor interactions in aqueous biological environments, potentially affecting biological responses at material–biosystem interfaces. In this respect, the LW–AB approach provides greater mechanistic insight than models limited to dispersive and polar contributions.
Actually, studies support the key role of Lewis acid–base interactions in microbial adhesion.23,46
Several studies have suggested specific parameters such as the dispersion-to-polar ratio and fractional polarity as relevant predictors of bacterial interactions.16,47 In the present study, most surfaces exhibited dispersion-to-polar ratios greater than one, indicating low overall polarity, although comparatively more polar materials (e.g. Ti, nano-HA, glass) may promote biofilm formation relative to low-polarity surfaces (e.g. Teflon, Co–Cr, gold).
Since all materials displayed similarly low surface roughness (Ra < 0.05 µm), differences in biofilm formation are unlikely to be driven by topography. 30 Biofilm development is a complex, multistage process influenced by surface chemistry, SFE, and environmental factors rather than roughness alone.11,15,16,19,20,22,48–52 Thermodynamic considerations further highlight this complexity, as initial bacterial adhesion depends not only on the substrate surface energy, but also on the bacterial surface energy and the surface tension of the surrounding liquid.22,53
Taken together, the present findings clearly underline that the choice of SFE calculation approach should be guided by the specific research question. For rapid screening of biomaterial surfaces, simplified approaches such as EOS may be sufficient, whereas material characterizations requiring information about the polar and dispersion fractions of SFE may be addressed using the geometric mean approach. More detailed mechanistic investigations of surface–biological interactions may benefit from component-resolved models such as LW–AB. Future studies combining thermodynamic surface analysis with direct biological assays will be essential to further clarify which SFE-derived parameters are most predictive of biological performance.
The findings of this study should be interpreted in light of several limitations.
First, static contact angles were used to calculate surface free energy (SFE) using different approaches. While sufficient for comparative analysis, alternative measurements such as advancing contact angles or the average of advancing and receding contact angles could provide thermodynamically more stable contact angles for SFE calculations.
Second, surface chemical homogeneity and oxidation states are critical factors influencing wetting behavior. In this study, measurement repeats do not allow for a statistical assessment of surface heterogeneity. Furthermore, surface chemistry was not characterized using XPS or FTIR; therefore, potential effects of hydrocarbon contamination, surface oxidation, or chemical heterogeneity on hydrophilicity and SFE component analyses cannot be assessed.
Third, two-dimensional surface roughness measurements were performed using a stylus profilometer with a tip radius of 2 µm. Due to the finite tip size, tip convolution effects may lead to smoothing of fine surface features, particularly at the observed low roughness levels (Ra about 0.03 µm, Rz about 0.3 µm), and thus to a slight underestimation of roughness values. However, the measurements provide consistent comparative values across samples. A formal uncertainty analysis was not performed; measurement reliability is supported by instrument specifications and repeatability. Three-dimensional surface characterization (e.g. AFM or optical profilometry) would likely provide additional insight into correlations between nanoscale surface features, wettability, and bacterial adhesion and should be considered in future studies.
Finally, possible biological responses related to the observed SFE characteristics were discussed. However, relationships between total SFE or individual SFE components and biological reactions are based solely on literature and were not directly investigated in this study.
Conclusions
This study demonstrates that clinically relevant biomaterial surfaces with comparable low roughness can differ substantially in their estimated thermodynamic surface properties. While the three applied surface free energy (SFE) approaches yield comparable total SFE values for low-energy, hydrophobic materials such as amorphous Teflon, pronounced method-dependent differences occur for more hydrophilic, high-energy surfaces, particularly titanium and glass. In these cases, the LW-AB approach results in lower total SFE values, the geometric mean approach in higher values, and the equation of state approach in intermediate values.
Differences between materials are mainly governed by the polar or acid–base contributions rather than by the nonpolar or Lifshitz–van der Waals components, which were similar for most substrates except Teflon. The LW-AB analysis further reveals a pronounced dominance of Lewis base over Lewis acid contributions for all materials. Material rankings based on total SFE or polarity therefore depend on the chosen calculation method, especially for hydrophilic surfaces.
In contrast, derived parameters such as fractional polarity and dispersion-to-polar ratios appear to show more consistent trends across different computational approaches and may therefore be considered potentially more robust descriptors for comparative assessment of biomaterial surfaces. Overall, the results underline that thermodynamic surface characterization is highly sensitive to the applied model, emphasizing the need for careful method selection and cautious interpretation when relating surface energetics to potential biological responses.
Footnotes
Funding
The authors received no financial support for the research, authorship, and/or publication of this article.
Declaration of conflicting interests
The authors declared no potential conflicts of interest with respect to the research, authorship, and/or publication of this article.