
Abstract
This study investigates the influence of internal infill geometry and density on the mechanical and rheological behavior of 3D-printed silicone structures fabricated using direct ink writing. Test samples with three different infill patterns (linear, triangular, and honeycomb) and four infill densities (55%, 70%, 85%, and 100%) were manufactured and evaluated through rheological creep–recovery analysis, static tensile and compression tests, and cyclic compression loading. The results demonstrate that both geometry and infill degree significantly affect the rheological and mechanical properties, such as static and cyclic compressive tests of the printed structures. Linear infill exhibited the highest compressive strength at 85% density and maintained favorable short-term stability during initial cyclic loading. Triangular patterns displayed significant sensitivity to infill density, with distinct stiffness characteristics, while honeycomb structures offered a balanced trade-off between density and mechanical response. Microscopic observations confirmed that print path quality and structural continuity correlate with the mechanical properties. The findings underscore the importance of tailored infill design in optimizing the functional performance of silicone-based components for applications such as orthotic insoles, soft robotics, and cushioning systems.
Introduction
3D printing with flexible materials such as silicone represents a promising direction in additive manufacturing (AM).1–3 The global market for elastomers for 3D printing reached $151 million in 2021 and is expected to grow by 22.5% annually, reaching $1.39 billion by 2030. 4 Silicone, due to its high flexibility, chemical stability, nontoxicity, and resistance to thermal degradation, finds broad application in medicine, materials engineering, and the automotive and electronics industries.5,6 Unlike conventional molding methods, AM allows rapid prototyping, personalization, and the creation of complex spatial structures without the need for molds.7–9 Traditional techniques, such as pressure molding or machining, are limited to orthotics with homogeneous internal structures, 10 where pressure adjustment relies on changes in geometry or material combinations. 11 In contrast, 3D printing enables the design of orthoses with porous, spatially varied internal architectures within a single material. By tuning infill density, layer orientation, and wall thickness, the biomechanical properties of an insole can be precisely tailored to user needs, thereby improving therapeutic functionality. 12
A key factor determining the success of silicone processing in 3D printing is its rheological behavior. Rheology governs both printability and final mechanical performance. 13 During extrusion, parameters such as viscosity and viscoelastic modulus control filament formation and layer adhesion, while optimized rheology allows for stable fabrication of complex structures. This is particularly relevant in biomedical applications requiring components that endure repetitive loads while maintaining elasticity and dimensional stability. 14 Although direct ink writing (DIW) of silicone is increasingly applied in soft tissue implants and orthopedics, 15 understanding the link between material rheology, print geometry, and mechanical durability remains a critical challenge.
The potential of additive technologies in orthotic design has been highlighted by several authors. Miguel et al. 16 demonstrated the possibility of printing silicone insoles with adjustable cushioning at a low cost. Ma et al. 17 and Koprivnik et al. 18 showed that porous elements and lattice structures (e.g., gyroids) have a significant impact on mechanical properties and reduce plantar pressure compared with solid materials. Similarly, Nickerson et al. 19 proved that lattice-based structures offer superior durability over conventional foams. However, most studies focus on complex lattice structures or static loads. There is a lack of comprehensive comparative analyses of the impact of basic infill geometries (linear, triangular, honeycomb) in combination with different densities on material fatigue under cyclic loading, which is crucial for the long-term reliability of orthopedic insoles.
Therefore, the purpose of this study was to evaluate the effect of the type and degree infill in internal structures on the mechanical properties and viscoelastic properties of 3D-printed silicone samples. The testing methodology included rheological creep–recovery analysis of the cross-linked structures to assess their elastic response, followed by static tensile and compression tests to determine their mechanical properties. Crucially, cyclic compression tests were performed to evaluate the preliminary cyclic response. This approach aims to determine the optimal internal architecture for orthopedic applications that require a balance between structural stiffness and long-term cushioning.
Materials and Methods
Materials
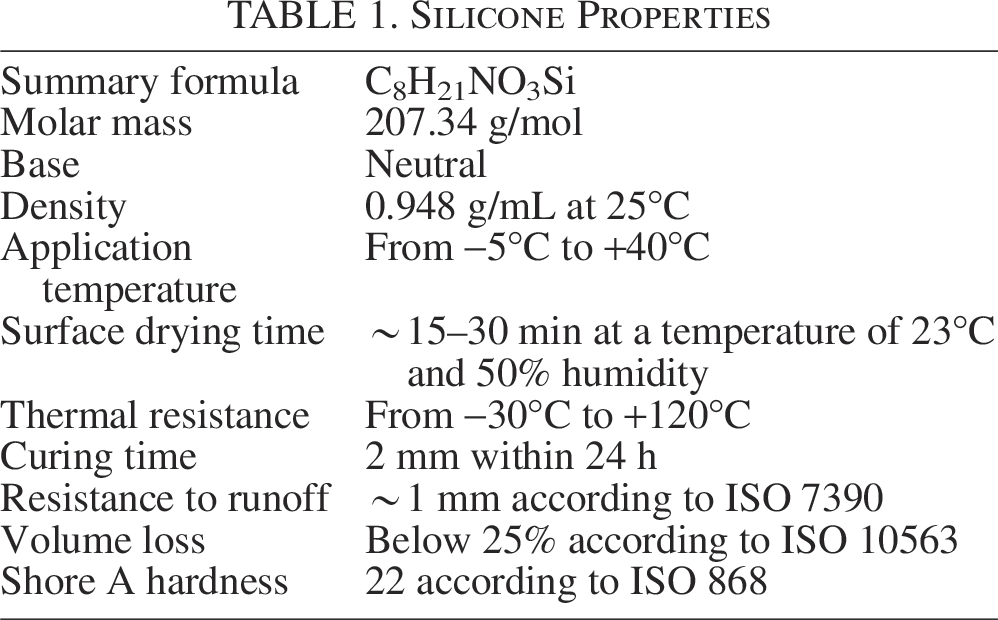
In this work, a commercial neutral silicone with a low elastic modulus was used, with the following composition: silicone rubber based on poly(dimethylsiloxane)—PDMS (45–70%), fillers (including quartz) (20–40%), plasticizers (2–5%), cross-linking/curing agent (2–4%), and functional additives (fungicides, adsorbents, dye) (1–3%). The properties of the material are summarized in Table 1. This silicone was selected due to its favorable rheological properties suitable for the DIW process and its stable mechanical characteristics under cyclic loading.
Silicone Properties
Parameters of 3D printing
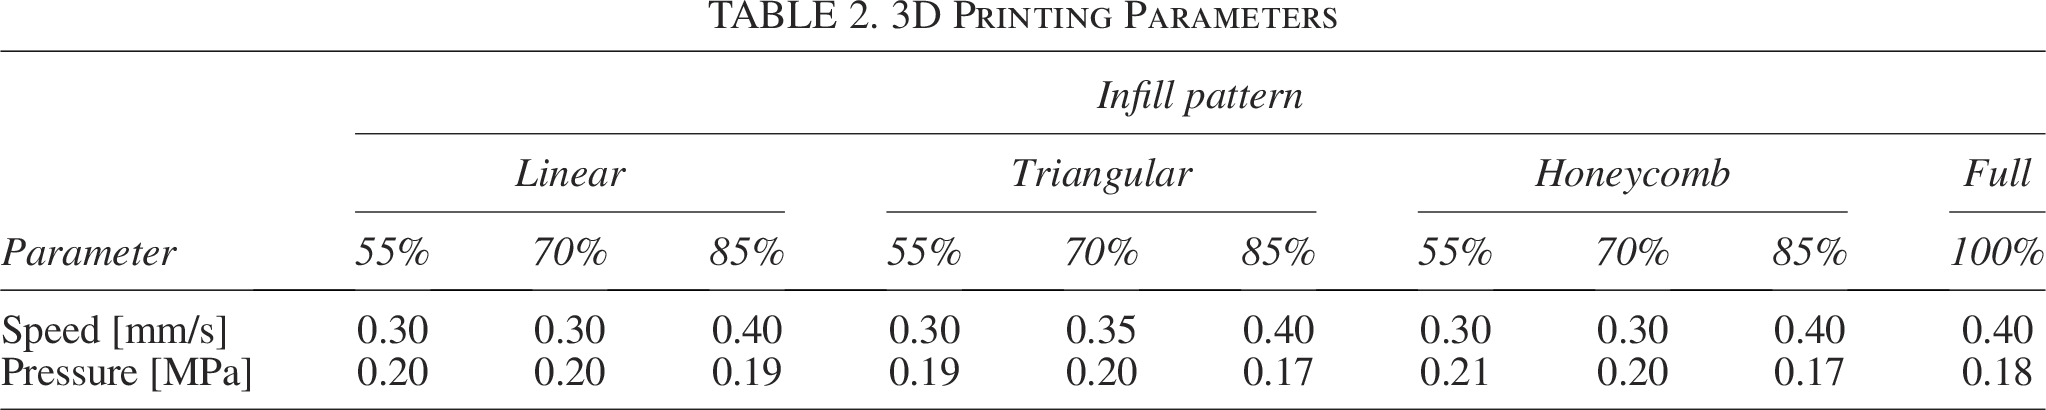
DIW additive technology was used to produce test samples from silicone material. The process was carried out using a F-NIS 23151 (Flunis 3D) 3D printer (Sygnis S.A.). The silicone material was loaded into a 55 mL cartridge equipped with a 0.63 mm diameter nozzle, and a layer height of 0.3 mm was used. Before each printing cycle, the device was calibrated. Samples with four different infill densities were developed: 55%, 70%, 85%, and 100%. Three infill geometry variants were generated using standard commercial slicing software to ensure practical reproducibility: a honeycomb structure, a triangular pattern, and lines forming a grid pattern. Table 2 presents the printing parameters. Differences in print speed and extrusion pressure resulted from the systematic calibration of process parameters, which was necessary to maintain the structural fidelity of each variant. As the infill density increased, the distances between the filament strands decreased, making it necessary to adjust the settings to prevent excessive extrusion and strand merging. By adjusting these parameters, consistent quality of the individual filament was ensured, guaranteeing that the observed mechanical differences resulted solely from macroscopic geometry and density rather than from printing defects. The 3D-printed samples were left to cross-link in air at room temperature for 24 h.
3D Printing Parameters
It is worth noting that silicone hardens under the influence of moisture from the environment; therefore, the curing time varied for different structures. Structures with lower infill density (55–85%) have open porosity and a higher surface-to-volume ratio, which facilitates moisture infiltration and promotes more uniform curing of the filaments across the entire cross-section. In the case of solid samples (100% infill), moisture infiltration into the interior is limited, which can lead to a crosslinking gradient. Therefore, the crosslinking time for these samples was extended to avoid this effect and its impact on the results.
Methods
The rheological properties of silicone samples with varying internal infill were investigated using the HAAKE RheoStress 6000 rotational rheometer (Thermo Fisher Scientific, USA) equipped with a plate-to-plate measuring geometry. The measurements were carried out at room temperature (∼24°C) on cylindrical samples (diameter: 20 mm; height: 3 mm). Each sample was carefully placed on the bottom plate and compressed using a constant normal force of 1 N to ensure full contact between the sample and the plates. Creep–recovery experiments were conducted by applying a constant shear stress of 100 Pa for 100 s (creep phase), followed by complete removal of the stress for another 100 s (recovery phase). Throughout both phases, the time-dependent shear strain was recorded. Creep compliance was then calculated as the ratio of strain to applied stress.
All mechanical tests were performed using a ZwickRoell Z010 universal testing machine, using five samples for each experiment. In the static tensile test, samples prepared in accordance with the guidelines of PN-EN ISO 527-2 (type 1B) 20 were used, which were stretched at a constant speed of 50 mm/min until breakage. Cylindrical samples with a diameter and height of 15 mm were used for the compression tests. Static compression was performed at a speed of 10 mm/min until the sample reached 90% of its original height. Cyclic compression was performed with a preload of 1 N at a speed of 450 mm/min, performing 100 cycles with a relaxation time of 100 ms between repetitions. The test conducted, involving 100 cycles, is a preliminary study. In target biomedical applications, such as orthopedic insoles, silicone components are subjected to millions of load cycles. The proposed methodology allows for the assessment of the early stage of structural degradation and the analysis of the material’s initial stabilization, enabling a quick and relative comparison of the properties of different geometries. The short-term cyclic degradation factor was determined as the ratio of the stress in the last cycle to the stress in the first cycle.
The relationship between compressive strength and fatigue coefficient was evaluated using the Pearson correlation coefficient (r). This method was selected because both variables were continuous and approximately normally distributed. Due to the limited sample size (n = 5), p values were not calculated, and the estimated correlation was treated as an exploratory analysis to identify preliminary hypotheses regarding the data structure.
Microscopic observations were performed using the confocal scanning microscope, Olympus LEXT OLS4000 and optical microscope, VHX7000 Keyence. The analysis allowed for verification of the quality of the printed tracks and evaluation of the infill structure in the tested samples.
Results and Discussion
Rheological characterization of silicone
Figure 1 presents the results of rheometric creep–recovery tests performed on silicone samples fabricated by DIW. Each curve shows creep compliance as a function of time: 100 s of loading under a constant shear stress of 100 Pa, followed by 100 s of recovery after stress removal. Three infill geometries are compared: (1) linear, (2) triangular, and (3) honeycomb. Within each geometry, the colored curves correspond to different infill densities (55%, 70%, 85%, and 100%). The rheological properties of the material prior to crosslinking, characterized by a decrease in dynamic viscosity from 3234 Pa·s to 500 Pa·s at 10 s−1, were reported in previous studies. 21 For this reason, this study focused on evaluating the viscoelastic properties of crosslinked 3D structures.
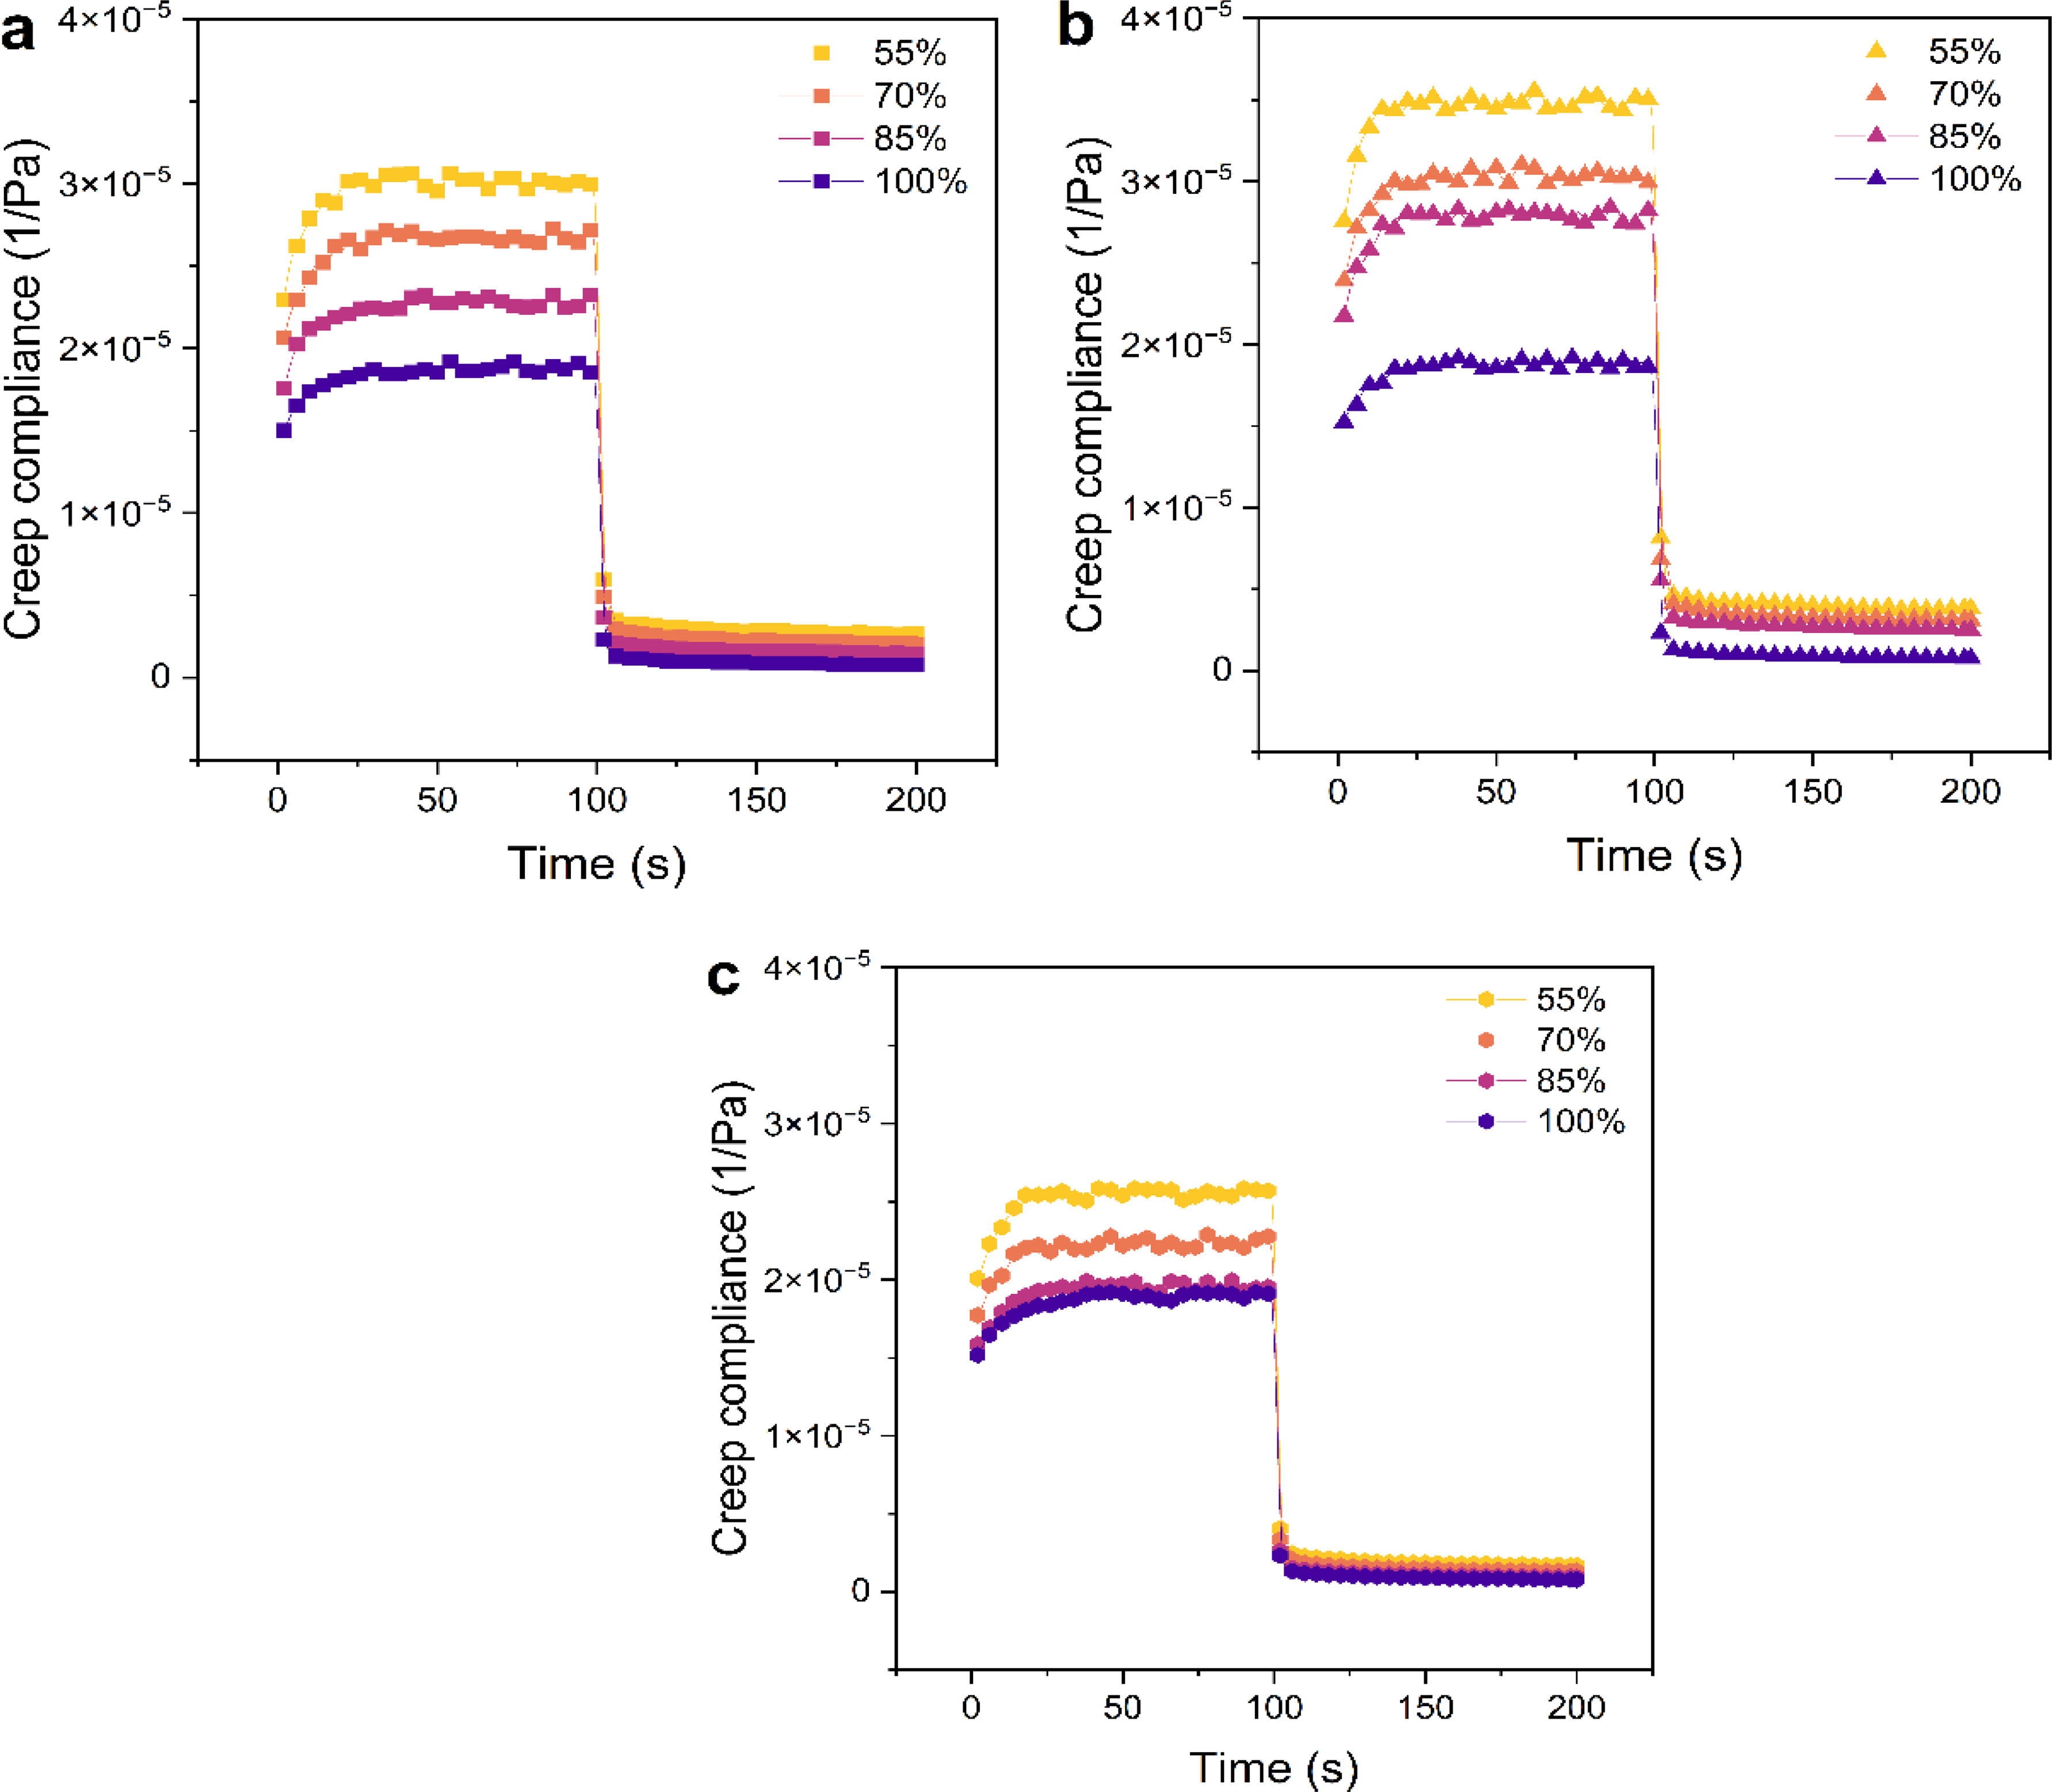
Creep–recovery rheological measurements of silicone samples fabricated by direct ink writing with different infill geometries:
The overall shape of the creep–recovery curves reflects the predominantly elastic character of the silicone samples. Under constant stress, creep compliance increases only during the first few seconds and then quickly reaches a plateau, which is characteristic of materials with a strong elastic response and limited viscous flow. After stress removal, all geometries show an abrupt drop in creep compliance, almost to zero, indicating nearly complete elastic recovery. An exception is observed for the triangular infill, where the recovery does not return fully to zero, suggesting the presence of irreversible deformation and reduced elastic recovery compared with the linear and honeycomb structures.
At the end of the creep phase, the fully dense (100% infill) samples exhibit the lowest compliance (≈1.87 × 10⁻⁵ Pa−1), whereas reducing the infill to 55% (i.e., a 45% mass and volume) increases compliance to ≈3.01 × 10⁻⁵ Pa−1 for the linear pattern (+61%), ≈3.49 × 10⁻⁵ Pa−1 for the triangular pattern (+86%), and 2.61 × 10⁻⁵ Pa−1 for the honeycomb (+39%). Expressed per 10% reduction in mass, this corresponds to a 13.6% increase in compliance for the linear structure, 19.1% for the triangular, and only 8.7% for the honeycomb, clearly demonstrating that the honeycomb geometry provides the most favorable trade-off between weight reduction and stiffness preservation.
Static tensile strength test
Figure 2 shows the tensile stress–strain curves for different types and densities of infill. For the linear structure (Fig. 2a), samples with 55–85% infill exhibit similar characteristics, whereas the sample with 100% infill achieves significantly higher stress values (∼0.5 MPa). In contrast, in triangular structures (Fig. 2b), there is a clear difference in stress values, which increase proportionally with increasing density. The honeycomb geometry (Fig. 2c) exhibits a nonmonotonic behavior, where the 70% infill sample exceeds the 85% infill sample within the range of moderate strains. This is probably due to local structural defects limiting load transfer, as seen in the images in “Microscopic observation” section. A comparison at constant densities (Fig. 2d–f) confirms that the sample with 100% infill consistently exhibits the highest stress values. Among the tested samples, the honeycomb and linear geometries exhibit better load transfer capacity compared with the triangular structure.
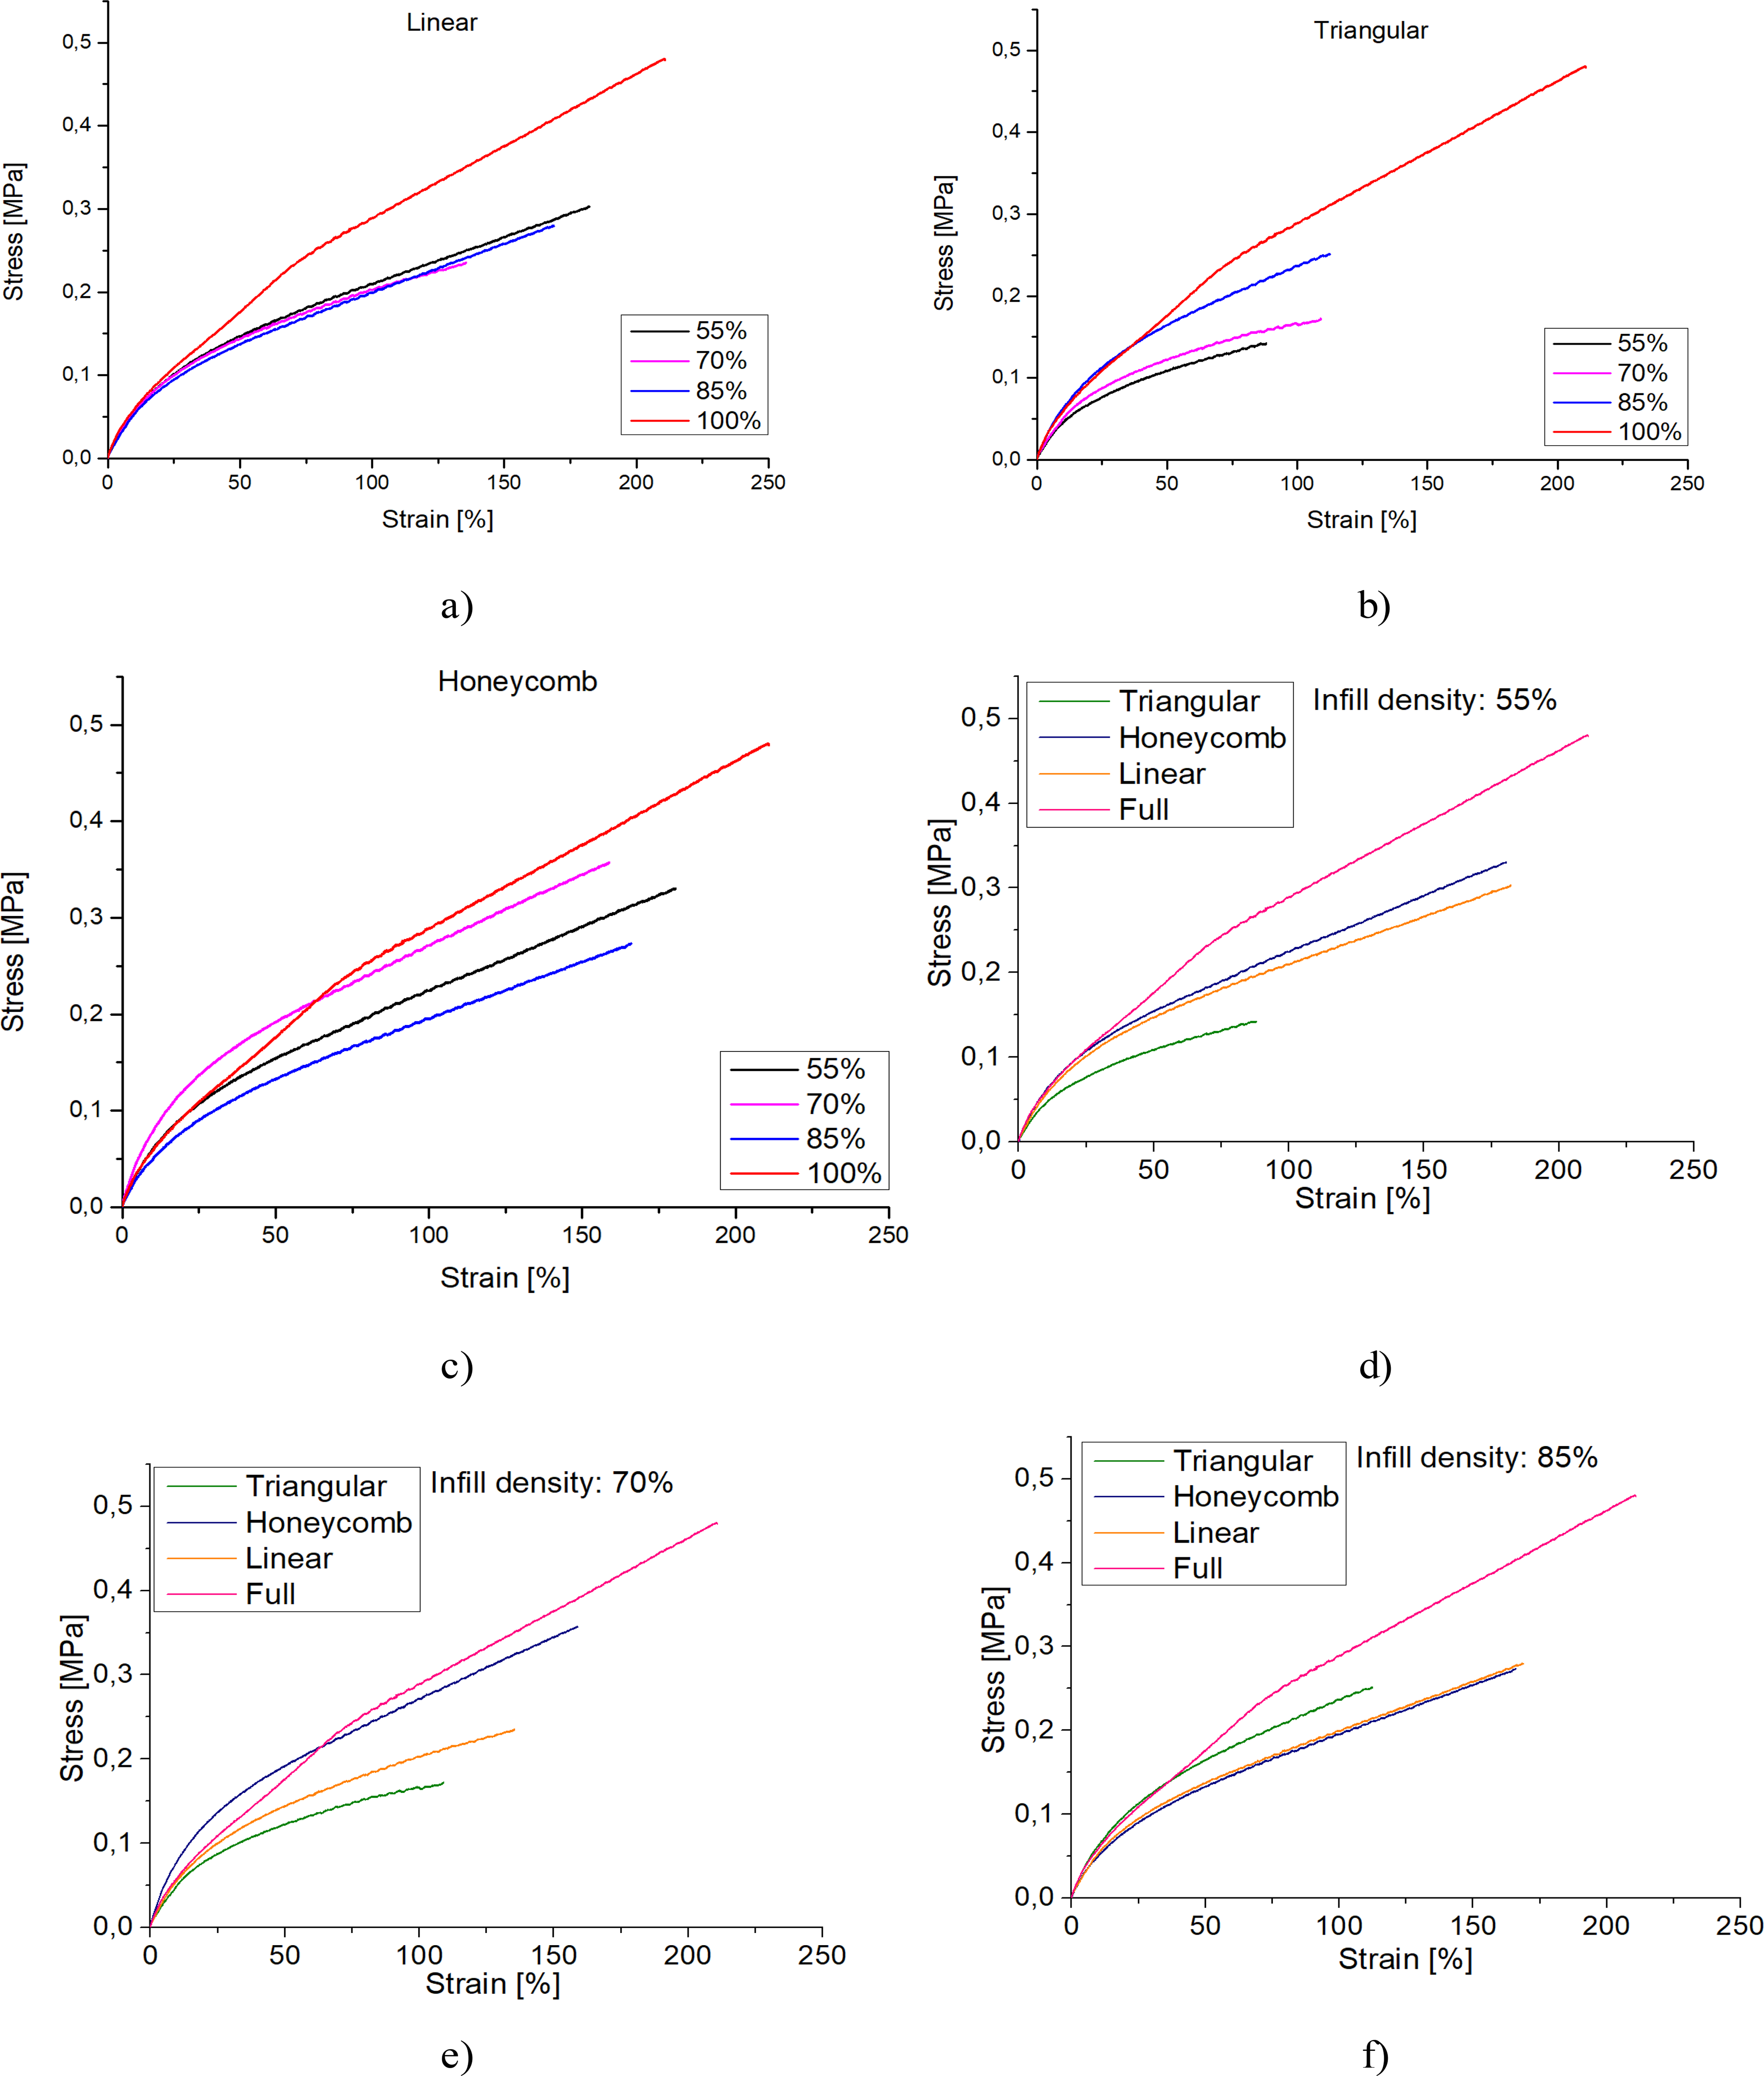
Tensile stress–strain response of 3D-printed silicone samples with different infill geometry and densities:
Figure 3 presents the tensile strength results for the tested samples. For samples with linear infill, the highest tensile strength was obtained for full infill (100%): 0.481 ± 0.020 MPa, whereas the values for lower densities ranged from 0.236 to 0.304 MPa, exhibiting no increasing trend as the infill density increased. Samples with triangular infill showed a systematic increase in tensile strength from 0.143 ± 0.007 MPa (55%) to 0.252 ± 0.008 MPa (85%), indicating a strong dependence of mechanical parameters on infill density. Different characteristics were observed for honeycomb infill, where the highest tensile strength values were recorded at 70% infill (0.358 ± 0.015 MPa). For the remaining densities, the tensile strength was lower: 55% (0.330 ± 0.010 MPa) and 85% (0.274 ± 0.009 MPa). These results confirm that the optimal choice of infill density to achieve maximum tensile strength depends on the internal geometry used.
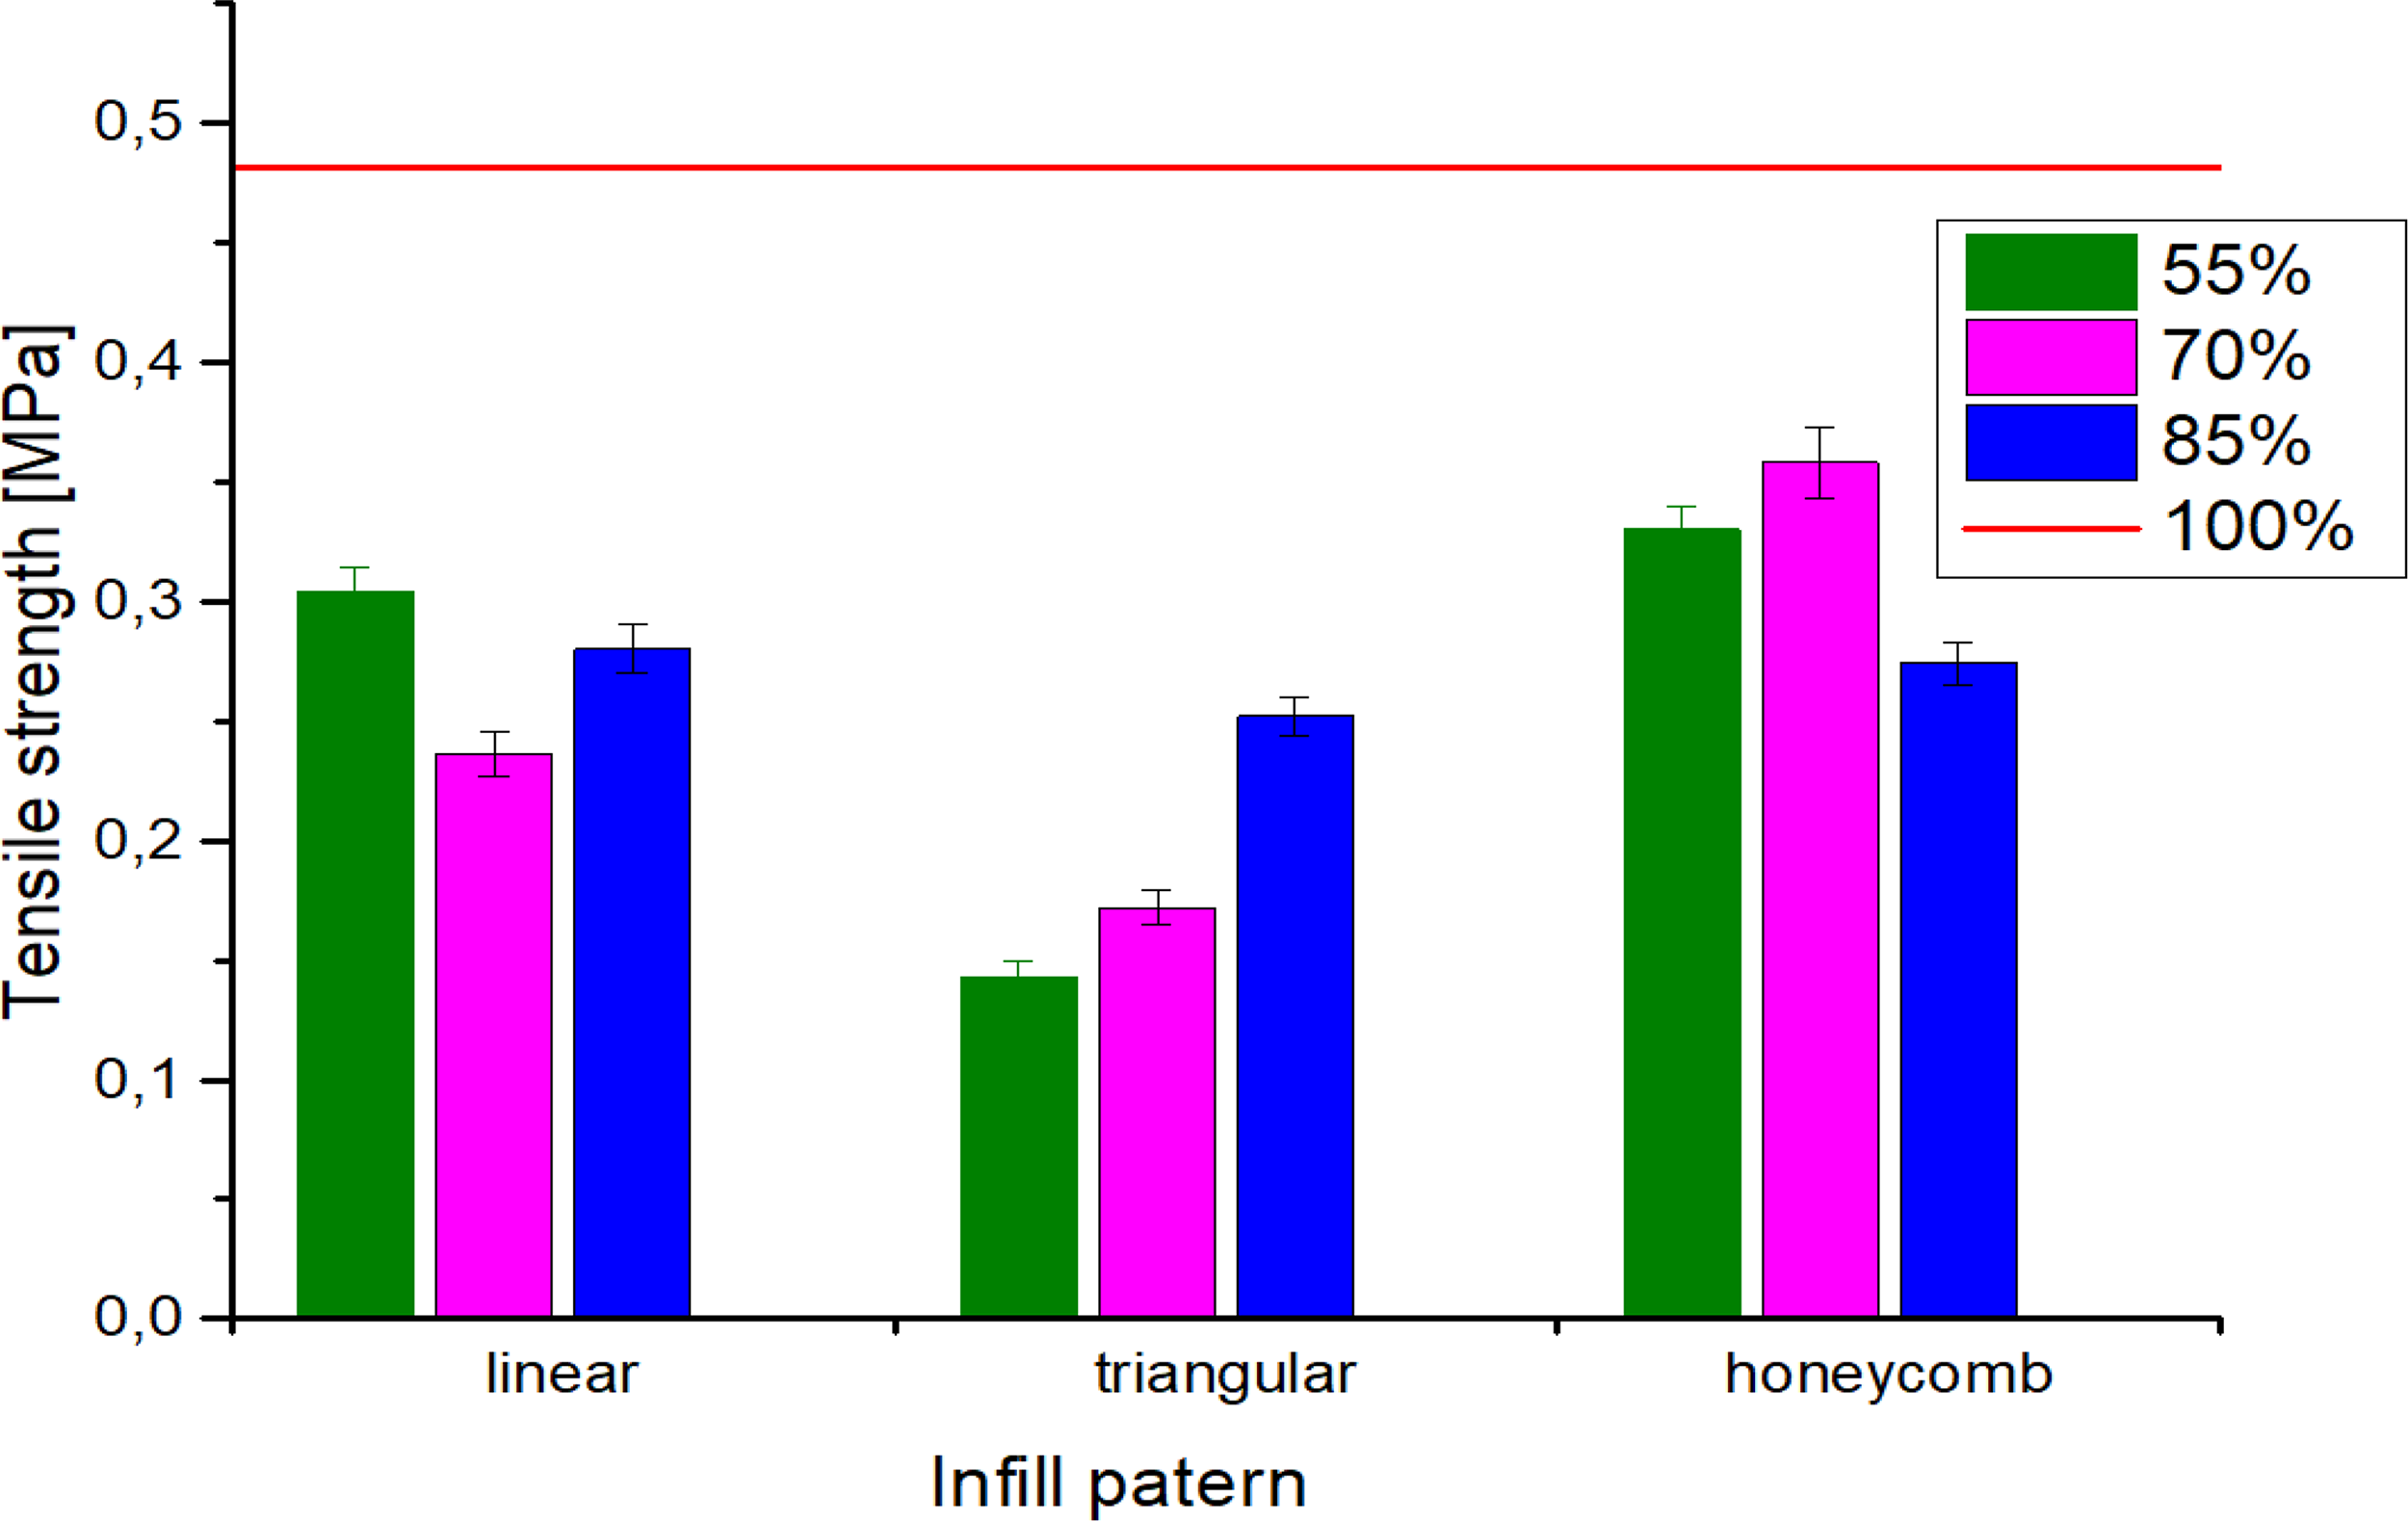
Tensile strength of the tested samples.
The triangular geometry exhibited much greater sensitivity to changes in the infill density, showing complex and less predictable mechanical properties, including a stiffness saturation effect and a tendency for a disproportionate increase in deformation resistance when the density was increased above 70%. These results correlate with the observations reported by other authors, including Chen et al., 22 Qi et al., 23 and Cojocaru et al., 24 who confirmed the beneficial effect of honeycomb geometry and linear infill on rheological stability and creep resistance in elastomeric structures. Increasing the infill density leads to a noticeable increase in the sample’s tensile strength, as confirmed by the research results presented by Ambati et al. 25 and Chicos et al. 26 This effect results from improved stress transfer within the material, which occurs with an increased volume fraction of the solid structure relative to the voids within the infill.25,26 An important observation from the work of Tanveer et al. 27 is that layered variation in infill density can maintain high strength parameters while reducing raw material usage, making this strategy particularly interesting from the perspective of cost and environmental optimization of the printing process. Furthermore, as pointed out by Terekhina et al., 28 appropriate modeling of the infill volume fraction allows for tailoring the mechanical properties of the component to functional requirements while minimizing weight. The conducted research also clearly demonstrated that, under tensile loads, a nonlinear stress–strain curve is observed throughout its entire course, consistent with the findings of Holzman, 29 highlighting the complexity of the deformation mechanisms characteristic of additive structures. The mechanical response of the material depends not only on global parameters (e.g., overall infill density) but also on local microstructural effects, such as the distribution of stress concentration zones and local strain patterns. 30
Static compression test
Figure 4 shows the stress–strain curves obtained from the compression tests. The general trend is an increase in stress values with increasing infill density, which is attributed to the greater volume of load-bearing material. The linear geometry (Fig. 4a) shows the most consistent behavior, where the characteristics of the sample with 85% infill are similar to those of the sample with 100% infill.

Compressive stress–strain response of 3D printed silicone samples with: (
Nonlinear relationships were observed in the other structures. For the triangular geometry (Fig. 4b), a different trend is observed, in which the sample with 70% infill exhibited higher stress values than the sample with 85% infill. This may be due to a local loss of wall stability at higher packing density. The honeycomb geometry (Fig. 4c) is characterized by a rapid increase in stress values in the final stage of compression. A comparative analysis (Fig. 4d–f) confirms the significant influence of geometry. Notably, at a density of 85%, the honeycomb structure best mimicked the characteristics of the material with 100% infill.
An analysis of the compressive strength results presented in Figure 5 revealed that the highest compressive strength was obtained for the linear structure with 85% infill (14.00 ± 0.30 MPa). In the case of triangular geometry, the highest compressive strength was obtained at 70% infill (11.06 ± 0.30 MPa), while for the honeycomb structure, the highest value was observed at 85% infill (10.48 ± 0.20 MPa). The lowest compressive strength values were recorded, respectively, for the linear structure: 55% infill (6.03 ± 0.02 MPa), for the triangular structure: 55% infill (5.41 ± 0.15 MPa), and for the honeycomb structure also 55% infill (4.70 ± 0.10 MPa). When comparing geometries with the same infill density, the linear pattern demonstrated the highest compressive strength at 55% and 85% infill, whereas at 70% infill density, the triangular geometry exhibited the highest strength values. The results indicate that the optimal configuration for achieving high compressive strength depends on both the type of infill and its density.

Compressive strength of the tested samples.
Liu et al. 31 demonstrated that the triangular infill geometry provided the highest compressive strength, which may be explained by its greater resistance to local deformation. However, comparison of the results from this study with those reported by Liu et al. 31 showed that the highest compressive strength values were observed for the linear structure. These discrepancies may primarily result from the specific type of silicone and 3D printing parameters used. Furthermore, Moradi et al. 32 indicated that the infill percentage is the second most important factor, after the material used, in determining the mechanical properties of printed elements. This is also confirmed by the cited experimental results obtained in this study.
Cyclic compression test
The analysis of cyclic compression (Fig. 6a) showed that stress values increased with increasing infill density for all geometries, although the magnitude of change varied. Linear structures exhibited the highest efficiency: at 85% infill, they reached a stress value of 0.14 MPa, matching that of the solid sample, whereas at 55% infill, it was only 0.04 MPa. In triangular structures, an increase in density above 70% did not result in significant improvement, indicating a plateau effect at ∼0.08 MPa. In contrast, for the honeycomb structure sample, a significant increase in strength (to 0.11 MPa) was achieved only at an 85% infill density, which corresponded to ∼79% of the value observed for the solid material.
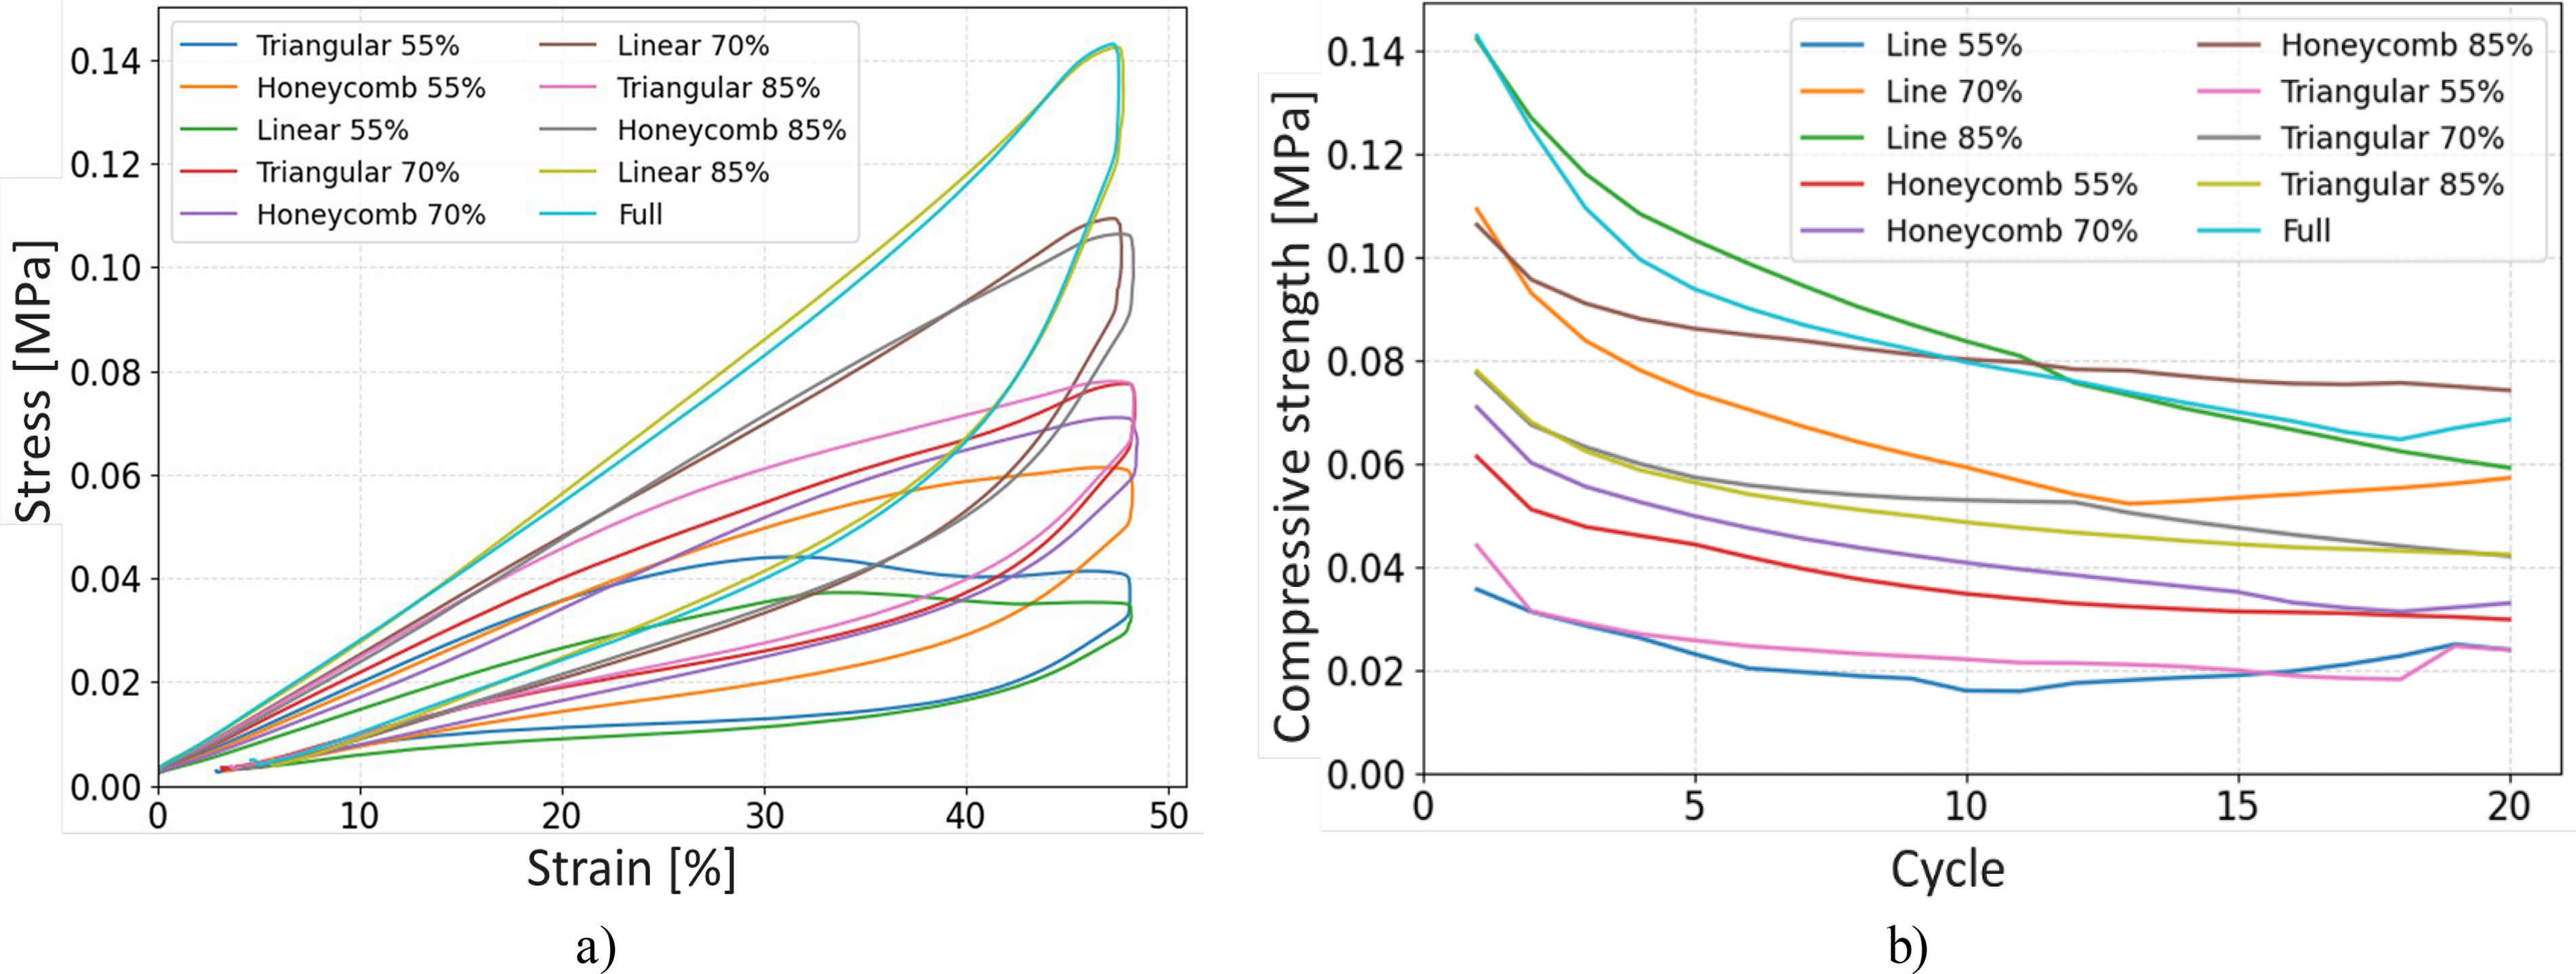
(
In the analysis of the cycle progression (Fig. 6b), a gradual decrease in compressive strength was observed over successive cycles, indicating progressive material fatigue. Linear structures demonstrated the highest stability, providing the optimal balance between maximum compressive strength and resistance to cyclic degradation. Triangular structures degraded more quickly, and the lack of differences between the 70% and 85% infill variants confirmed the limited effectiveness of further densification. In the case of the honeycomb structure, a noticeable improvement in stability was observed only at the highest infill density, confirming the crucial influence of density on the mechanical behavior of this geometry.
The results of this study are generally consistent with the literature on the qualitative fatigue mechanisms of elastomers subjected to cyclic compression. The differences between studies are mainly attributed to material properties and testing conditions. Persson et al. 33 studied thermoplastic vulcanized elastomer (TPV) and liquid silicone rubber (LSR). TPV showed a strong temperature dependence and higher hysteresis than conventional rubbers. In contrast, LSR showed better elasticity, lower compression set, and a slightly stronger Mullins effect, leading to greater energy dissipation. These differences demonstrate the distinct microstructure of LSR, characterized by a dense cross-linked network and lower filler adhesion. Furthermore, while many studies have focused on homogeneous solids, this study included samples with internal structure in which the presence of voids reduced stiffness while preserving the qualitative nature of the cyclic response.
The results of mechanical tests showed that partially infilled samples (70–85%) often outperformed solid samples (100%) in terms of compressive strength and in cyclic tests. This relationship is supported by the rheological creep–recovery results (Fig. 1), where low creep compliance values (ΔJ) were also obtained for the 70–85% structures, regardless of geometry. The mechanism behind this phenomenon is related to the 3D printing technology.34,35 During the extrusion of narrow paths, the silicone is subjected to high shear forces, which orient the segments of polymer chains along the direction of deposition. This process creates ordered, continuous load-bearing paths within the structure, resembling microfibers, which strengthen the material’s response to stress. 4
During normal walking, peak plantar pressures typically range from 0.2 to 0.5 MPa, occasionally reaching up to 1.0 MPa during rigorous activities or in pathological conditions such as diabetic foot. 36 The ultimate compressive strengths of the 3D-printed silicone structures tested in this study (ranging from 4.7 to 14.0 MPa) greatly exceeded these physiological loads, ensuring a substantial safety factor against structural collapse. Furthermore, under cyclic loading at functional strain levels, the generated stresses (∼0.04–0.14 MPa) indicated highly compliant behavior. These values align well with the pressure-relieving characteristics required for shock absorption and offloading, offering a stiffness range comparable to that of conventional commercial cushioning materials such as ethylene-vinyl acetate (EVA) foams and soft polyurethanes. However, unlike homogeneous commercial foams, the DIW 3D-printing approach allows spatial tuning of these compressive properties within a single continuous part by simply adjusting the infill density and geometry, thereby confirming its practical viability for personalized orthotic devices.
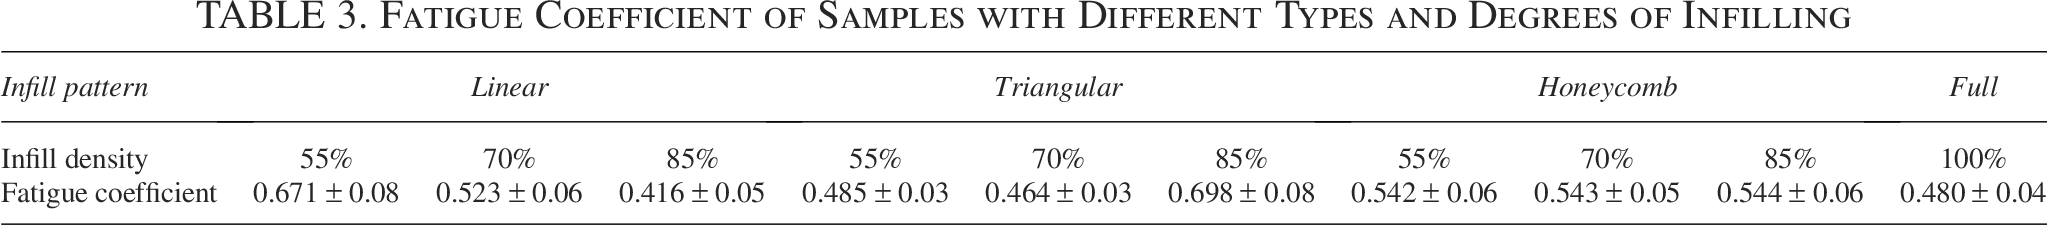
Table 3 summarizes the fatigue coefficients obtained from the cyclic tests. The results represent the average of five independent measurements for each variant. For the linear infill, the fatigue coefficient decreased markedly with increasing infill density, from 0.671 at 55% to 0.416 at 85%, indicating that excessive structural stiffness may accelerate fatigue degradation. In the triangular infill, similar values were observed at 55% and 70% (0.485 ± 0.03 to 0.464 ± 0.03), followed by a clear increase to 0.698 at 85%, suggesting a density-dependent change in fatigue behavior. In contrast, the honeycomb structure exhibited nearly constant fatigue coefficients across all tested densities (0.542 ± 0.06 to 0.544 ± 0.06), indicating limited sensitivity to infill density. The fully solid specimen (100%) showed a coefficient of 0.480 ± 0.04, confirming that a monolithic structure does not necessarily ensure superior fatigue resistance. Overall, these results demonstrate that both infill geometry and density significantly affect fatigue performance.
Fatigue Coefficient of Samples with Different Types and Degrees of Infilling
The correlation analysis (Table 4, Fig. 7) revealed that the relationship between compressive strength and fatigue coefficient strongly depends on infill geometry and density. Due to the limited number of data points analyzed for each geometry (three density levels), the Pearson correlation analysis should be considered illustrative only. The obtained values serve to illustrate the general trend of the observed changes and do not provide a basis for precise quantitative conclusions. Linear structures exhibited an apparent inverse trend (r = –0.98), suggesting that increasing compressive strength is associated with a pronounced reduction in fatigue resistance, likely due to limited energy dissipation under cyclic loading. Triangular structures exhibited a less pronounced relationship (r = –0.36), which may result from a more favorable stress distribution within the geometry. For honeycomb structures, no correlation could be determined due to the negligible variation in fatigue coefficients.
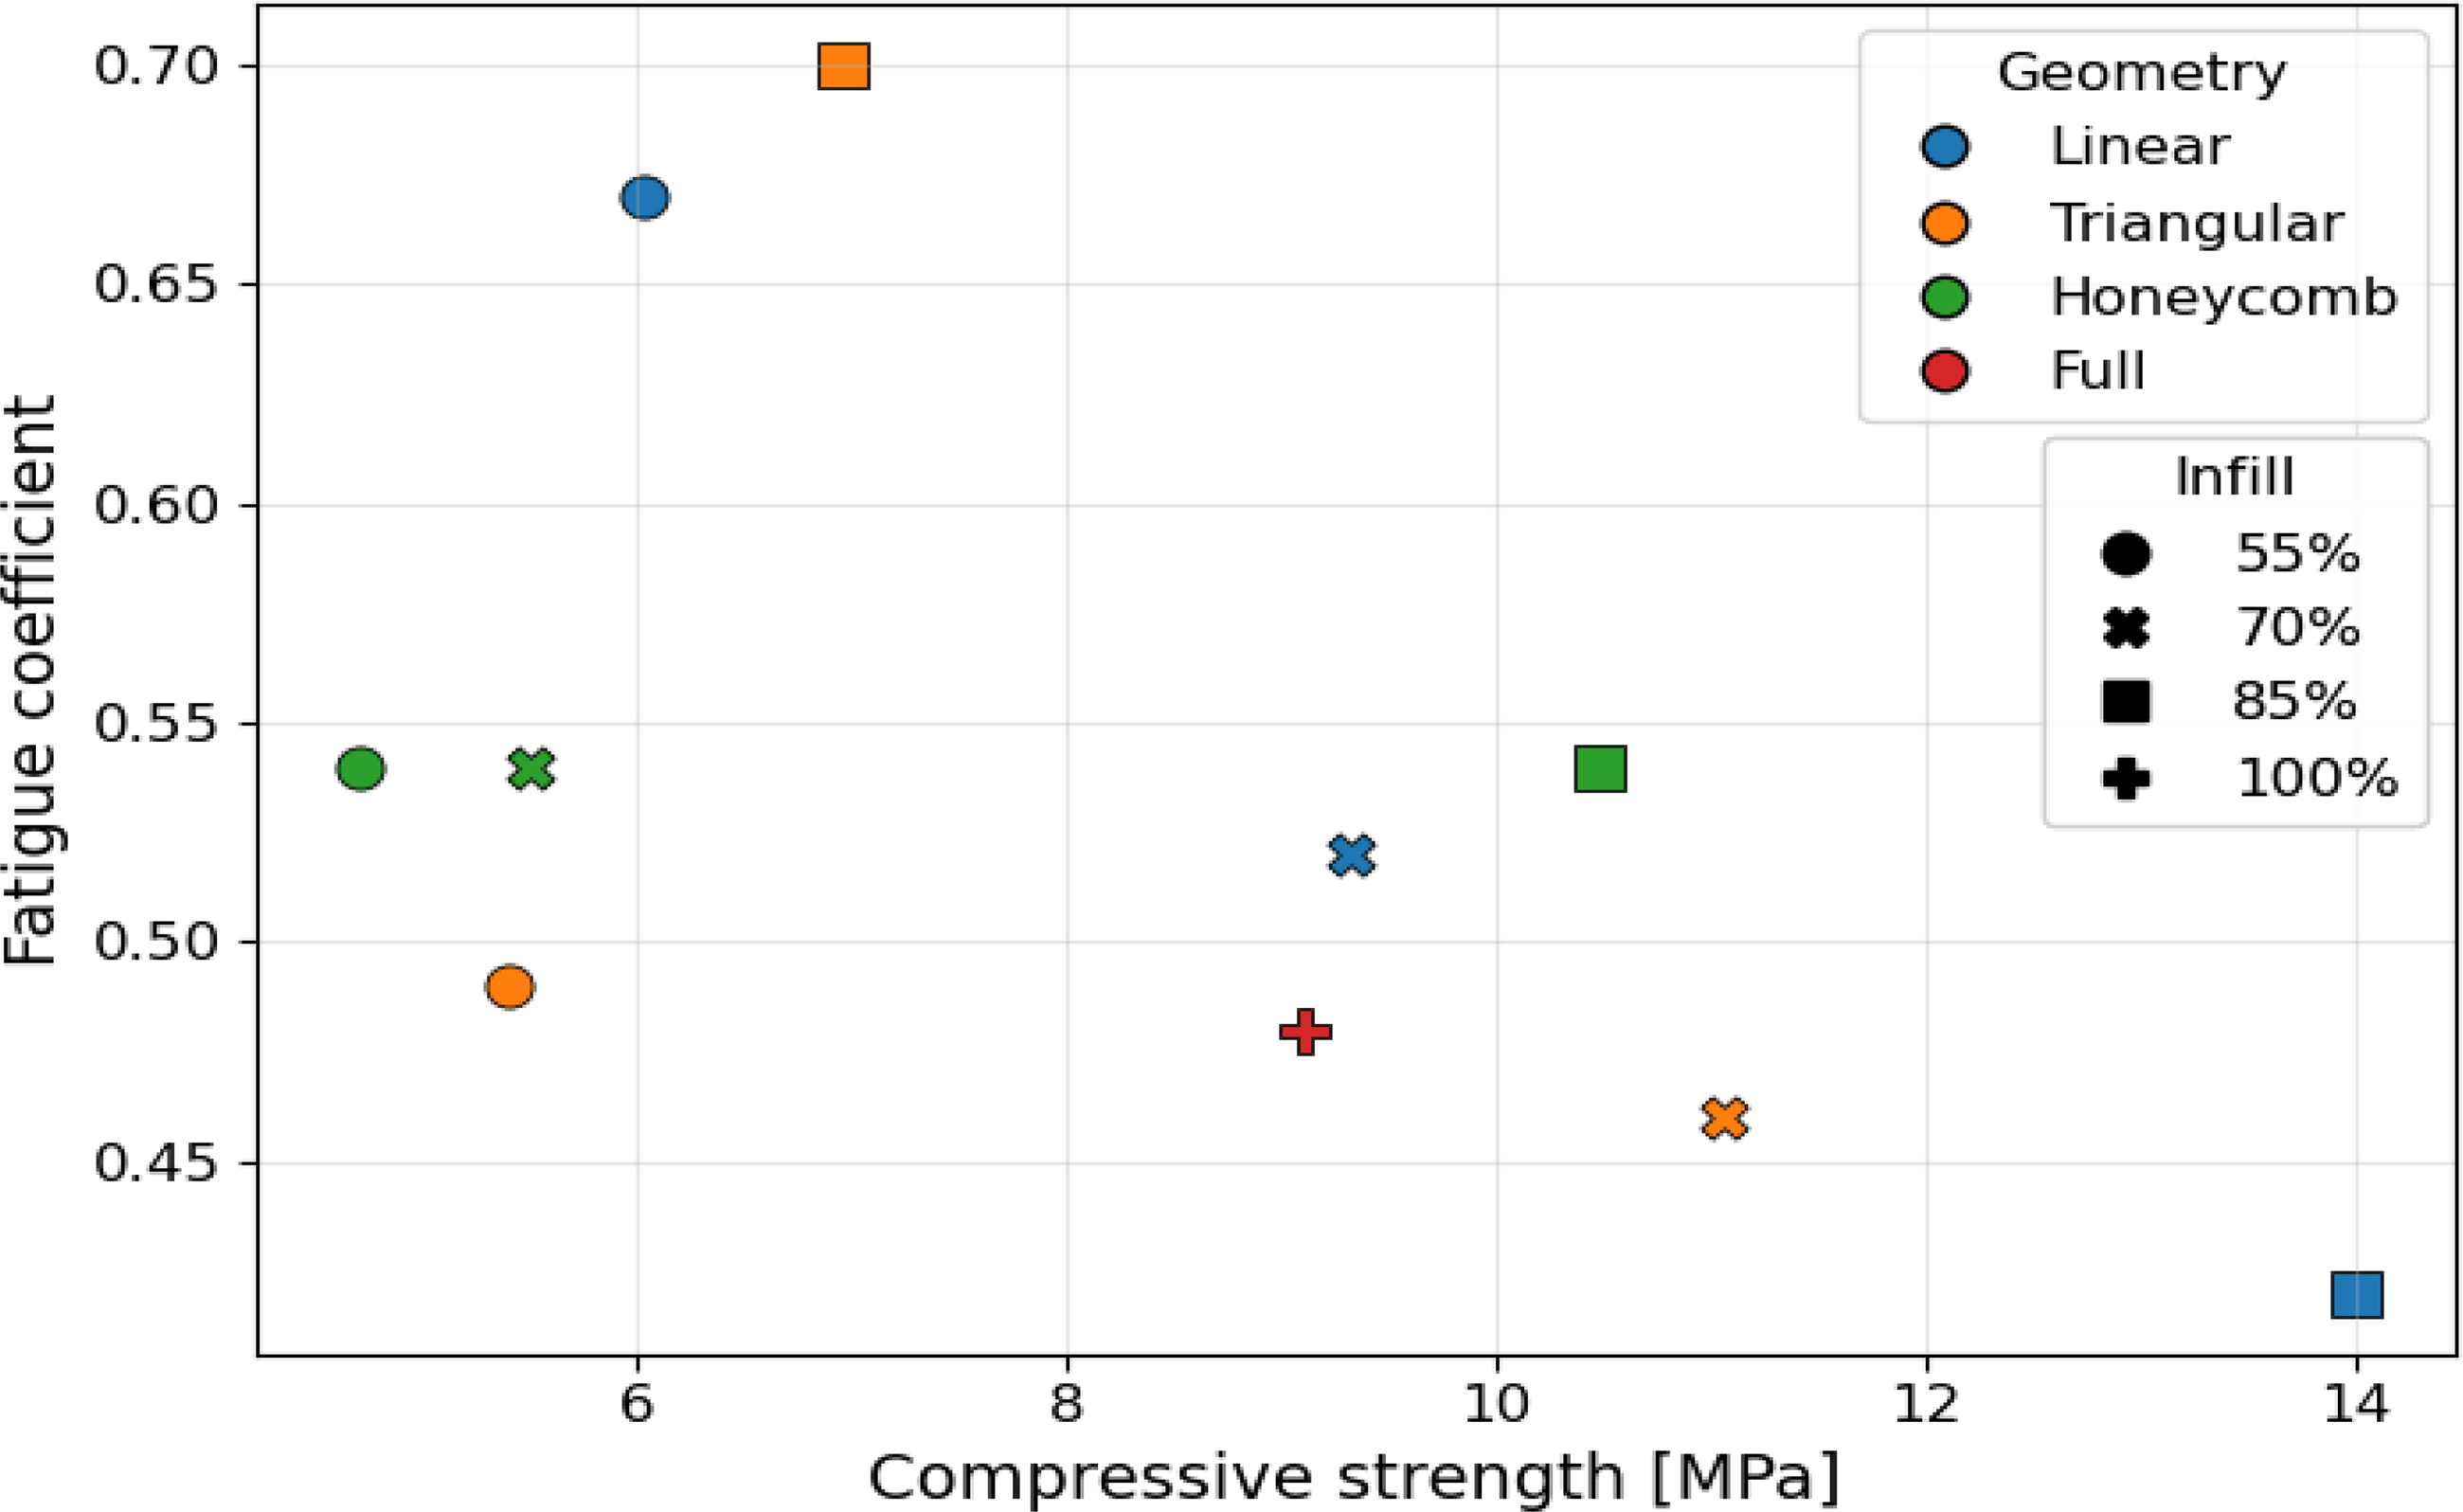
Relation between compressive strength and fatigue coefficient.
Pearson Correlation in Different Groups
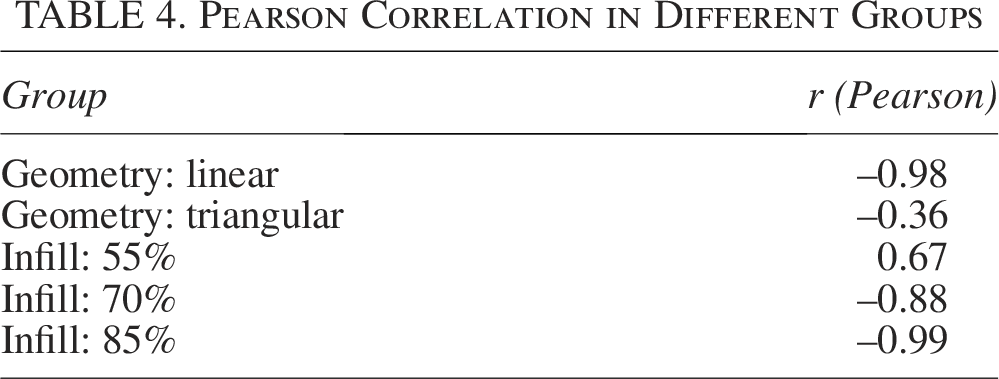
When grouped by infill density, an observable positive trend was noted at 55% infill (r = 0.67), suggesting that in more porous structures, increased strength may enhance fatigue resistance. At higher densities (70% and 85%), a strong inverse tendency was prominent (r = –0.88 and r = –0.99, respectively), indicating that densification improves stiffness at the expense of fatigue durability.
Figure 7 illustrates the overall inverse relationship between compressive strength and fatigue coefficient. This trend is most pronounced for the linear infill, where increasing density significantly reduces fatigue resistance. The honeycomb and triangular patterns showed more dispersed behavior, highlighting geometry-dependent stress redistribution mechanisms. The solid sample exhibited intermediate performance, further confirming that maximum density does not optimize fatigue resistance. These findings underline the need to balance strength and fatigue performance through the appropriate selection of infill geometry and density.
Linear infill, characterized by aligned orthogonal paths, provides effective vertical load transfer and high compressive strength due to its unidirectional stiffness. However, this structural stiffness limits internal deformation zones, reducing the ability to dissipate energy under cyclic loading, hence the observed lower fatigue coefficients. In contrast, the triangular geometry results in higher energy absorption and delayed fatigue accumulation, especially at intermediate infill levels (70–85%), despite slightly lower compressive strength. The honeycomb pattern offered a compromise: It maintains relatively high stiffness with moderate fatigue resistance due to better stress redistribution. It is worth noting that in the honeycomb structure, increasing the infill density above 85% resulted in reduced benefits in terms of both strength and fatigue resistance, possibly due to local wall thickening and limited deformation.
Microscopic observation
Figure 8 shows images of the internal surface structure of silicone samples produced using the DIW method. In the samples with 55% infill (Fig. 8a–c), clear morphological differences were observed among the geometries. The honeycomb structure was characterized by a regular spatial arrangement, although locally thinner walls were visible, which may reduce mechanical strength (Fig. 8a). The linear infill showed uniform filament alignment with good interlayer bonding, supporting efficient load transfer (Fig. 8b). The triangular infill showed thinner connectors and sharper nodes, potentially contributing to reduced mechanical resistance at lower material densities (Fig. 8c).
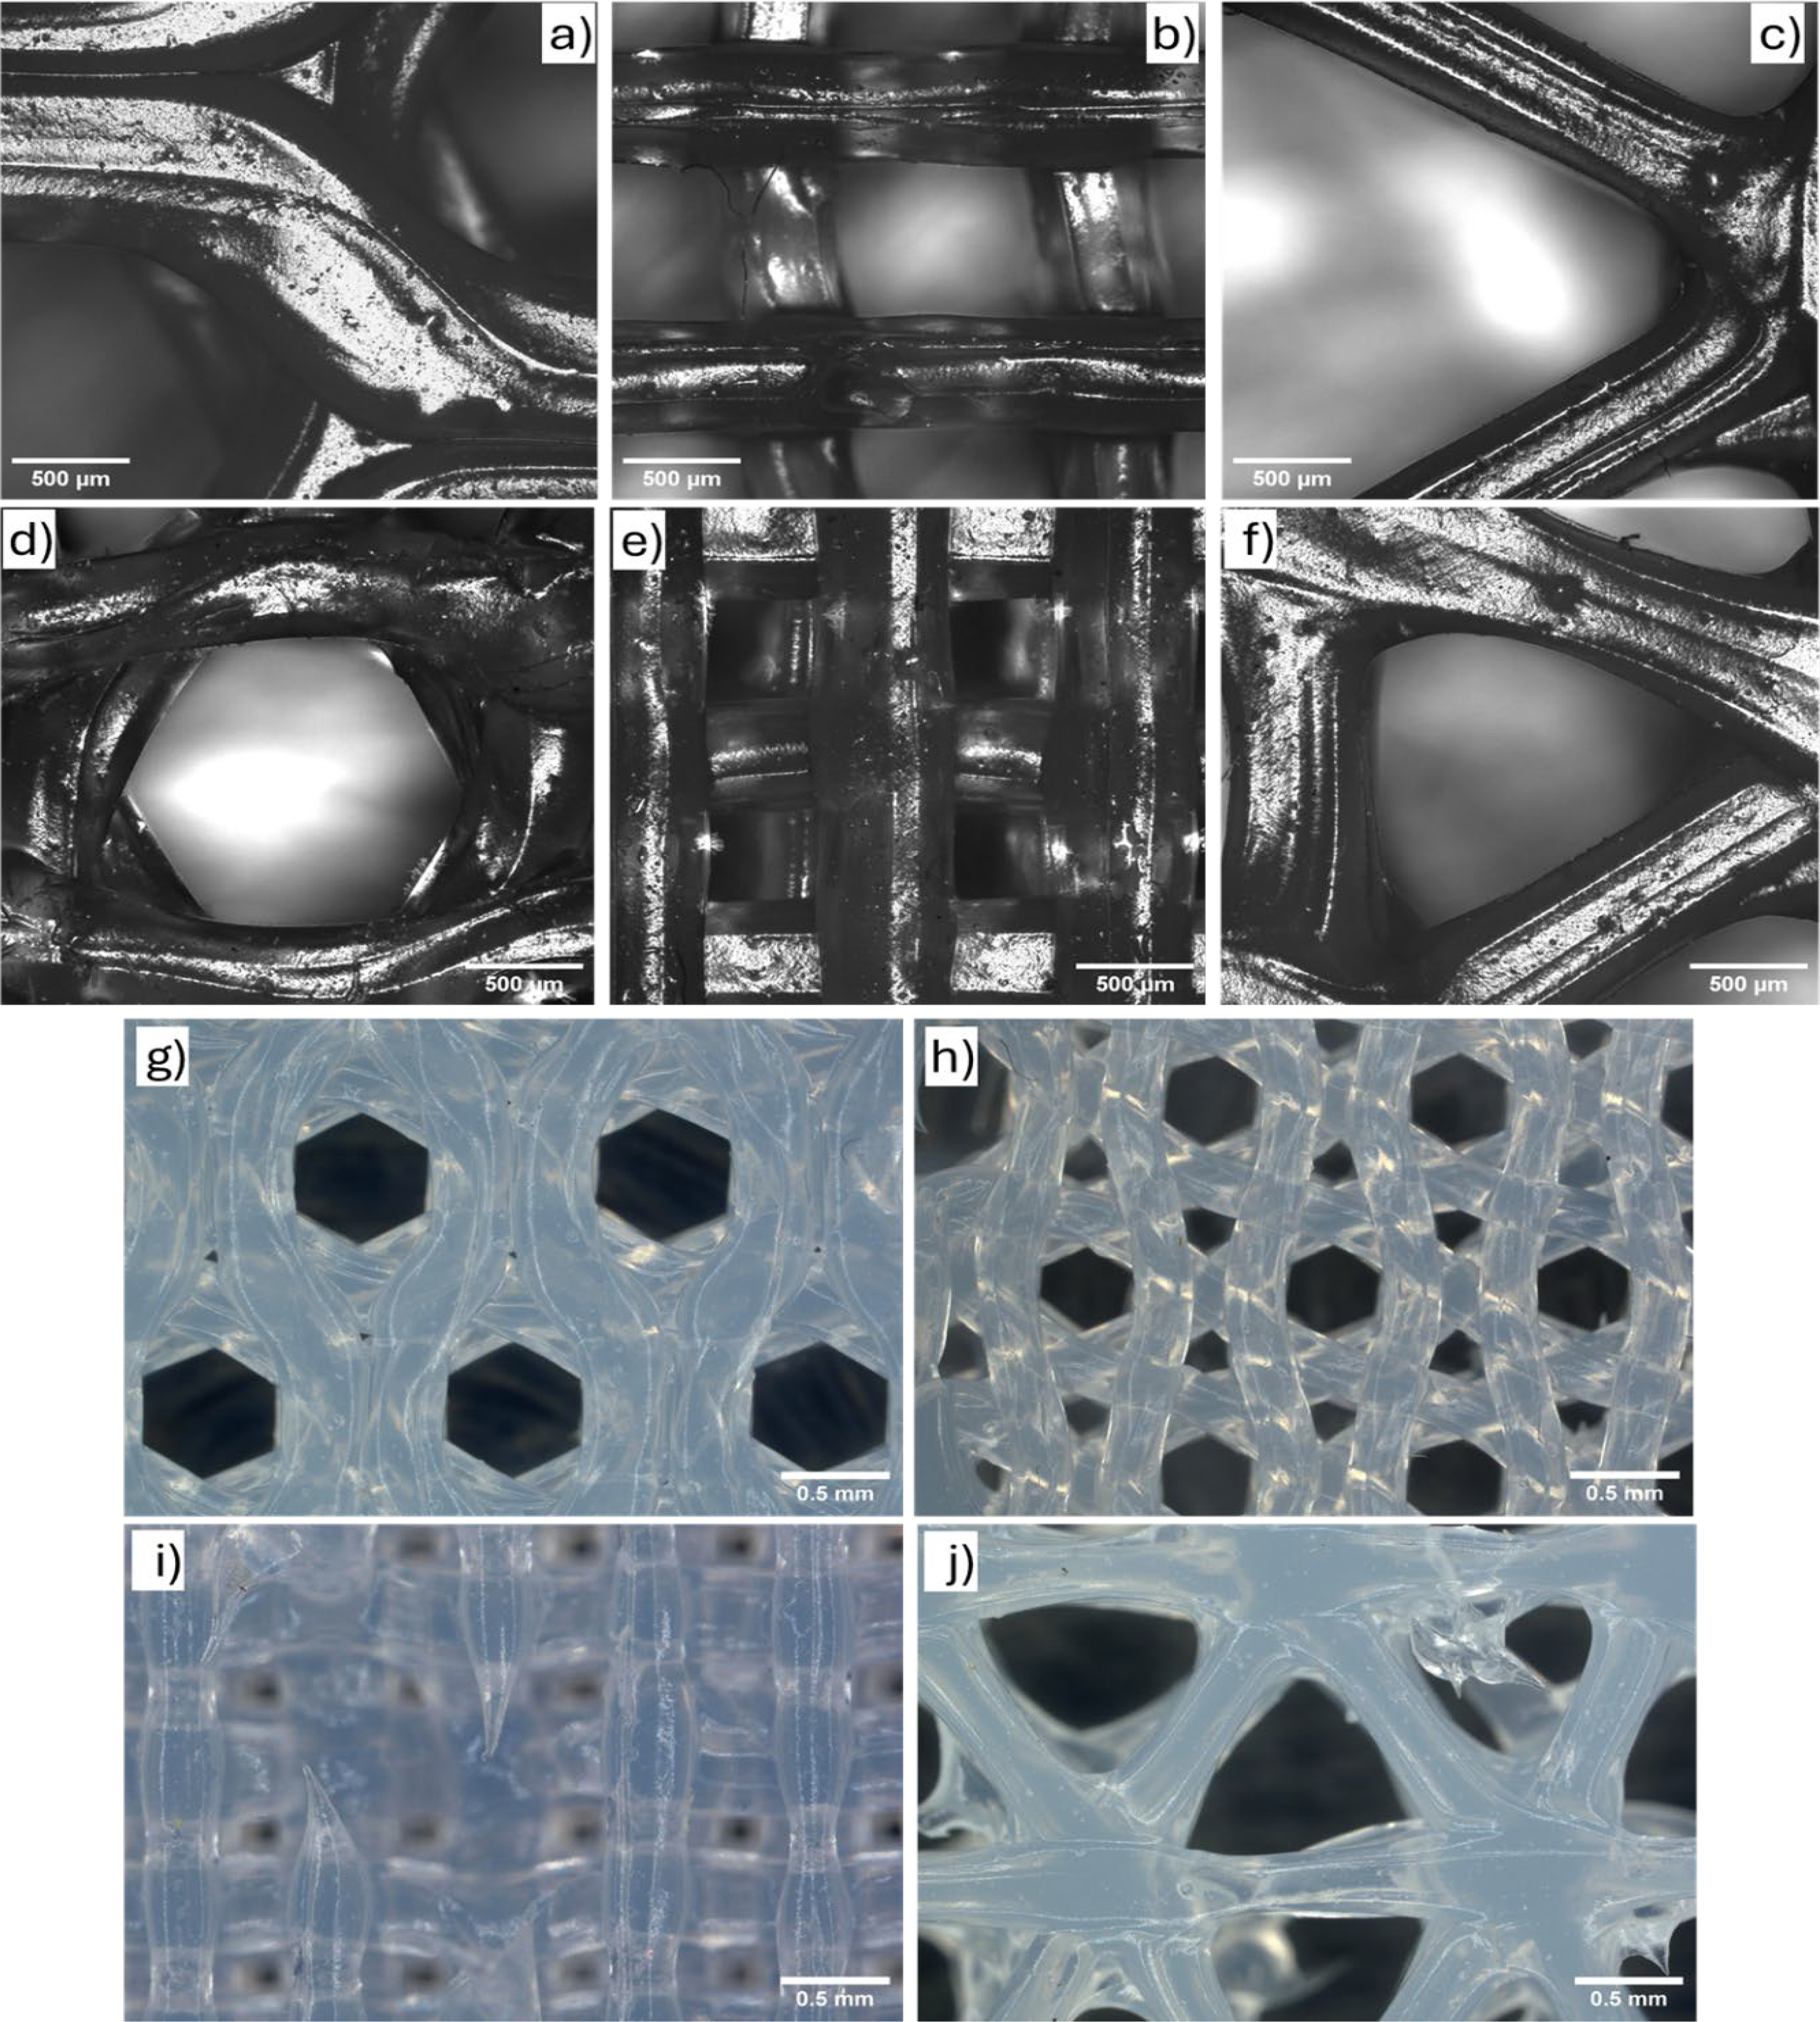
Microscopic images of print paths for densities of 55%
For samples with 70% infill, significant differences in morphology were observed between the different geometries. The honeycomb structure showed well-defined cells but incomplete line connections in some regions, creating potential weak spots (Fig. 8d). The linear infill at the same infill density was characterized by a more compact and uniform fiber arrangement, which contributed to better sample integrity (Fig. 8e). The triangular geometry was characterized by thickened load-bearing elements and fewer voids, indicating improved structural stability at higher material densities (Fig. 8f).
Figure 8g–j shows defects in the structures of printed paths with different infill densities and types. In samples with a honeycomb geometry, the image for a density of 70% (Fig. 8g) shows a more homogeneous path structure compared with a density of 85% (Fig. 8h). The higher-density honeycomb structure was characterized by irregular nodes and undulating paths, as well as a lack of path connectivity and the formation of a complete structure. This suggests the development of local internal stresses that may weaken the structure during tensile loading. Analysis of the linear fill at 70% density (Fig. 8i) revealed macroscopic pathway continuity defects in the form of narrowings and gaps in the paths. The presence of these defects explains the lack of an upward trend in tensile strength. In the triangular structure with a density of 85% (Fig. 8j), massive nodes were observed with distinct and irregular material overflow that disrupts the geometric continuity of the infill. This is the cause of the decrease in compressive strength.
A comparison of the mechanical test results (Figs. 3 and 5, Table 3) with the microscopic observations (Fig. 8) reveals a strong correlation between infill geometry, print path quality, and mechanical properties. In the honeycomb geometry, the more homogeneous path structure observed at 70% infill directly correlates with its peak tensile strength. Conversely, increasing the density to 85% leads to irregular nodes, undulating paths, and a lack of complete path connectivity, which generates internal stresses and weakens the structure. For the linear infill, although it achieved the highest compressive strength at 85% infill (14.00 MPa) and favorable fatigue stability (coefficient of 0.42), microscopic analysis at 70% density revealed macroscopic continuity defects, such as narrowings and gaps. These localized flaws disrupt load transfer, explaining the lack of an upward trend in tensile strength. The triangular infill achieved high compressive strength (11.06 MPa) at 70%; however, at 85% density, it exhibited massive nodes with irregular material overflow and geometric instability, which likely compromised its long-term fatigue resistance (fatigue coefficient ≈ 0.46) and reduced compressive strength. Ultimately, these empirical findings confirm that structural discontinuities and print path quality are critical factors governing the mechanical performance of the samples.
Conclusions
The study demonstrated that both infill geometry and density play a crucial role in determining the mechanical and rheological properties of 3D-printed silicone structures produced via DIW technology. The results indicate that optimized partially infilled structures can achieve properties comparable to, and in some cases better than, those of solid samples while significantly reducing material usage. The linear geometry with 85% infill proved to be the most versatile configuration, reproducing the stiffness and strength of monolithic silicone in both tensile and compression tests while maintaining high structural stability under cyclic loading. The triangular geometry, although sensitive to changes in infill density, exhibited unique stiffness characteristics, indicating its suitability for applications requiring specific load-bearing capacities despite lower elastic recovery. In contrast, the honeycomb pattern showed an optimal infill range (70–85%), above which excessive compaction reduced the mechanical properties.
These results emphasize that thoughtful selection of geometry and infill density allows silicone structures to be tailored to specific functional requirements by balancing stiffness, flexibility, fatigue resistance, and material efficiency. The ability to achieve high mechanical performance with reduced material content underscores the potential of DIW technology for lightweight, cost-effective, and application-oriented silicone components. This work contributes to a greater understanding of the relationship between structure and properties of additively manufactured silicones and highlights the potential of DIW technology for advanced applications in biomedical devices, soft robotics, and flexible protective systems
Authors’ Contributions
E.R.-R. and R.E.P.: Conceptualization; E.R.-R.: Methodology; E.R.-R. and Ł.B., Software; R.E.P. and E.R.-R.: Validation; E.R.-R.: Formal analysis; J.H., Ł.B., D.Ł., and B.S.: Investigation; E.R.-R. and D.Ł.: Resources; E.R.-R.: Data curation; E.R.-R. and Ł.B.: Writing—original draft preparation; R.E.P., G.B., and B.S.: Writing—review and editing; E.R.-R., D.Ł., and Ł.B.: Visualization; R.E.P., E.R.-R., and G.B.: Supervision; E.R.-R.: Project administration; and E.R.-R.: Funding acquisition. All authors have read and agreed to the published version of the article.
Footnotes
Data Availability Statement
The original contributions presented in this study are included in the article. Further inquiries can be directed to the corresponding author.
Author Disclosure Statement
No competing financial interests exist.
Funding Information
This research was funded by the Ministry of Science and Higher Education of Poland with allocation to the Faculty of Mechanical Engineering, Bialystok University of Technology, for the WZ/WM-IIB/4/2023.