




Abstract
Abstract
Firms’ capital structure dynamics and ownership structure are two extensively studied subjects of research in corporate finance in recent years. This study combines these two branches of research and examines the impact of firms’ ownership structure on capital structure dynamics. More specifically, it examines the asymmetry in adjustment speed between group and stand-alone firms. The study uses data of 1,415 listed Indian manufacturing firms over the period of 2005–2013 (9 years) from ‘Capitaline Plus’ database. It specifies a partial adjustment model and uses the generalized method of moments (GMM) technique to estimate the adjustment speed. The results show that Indian manufacturing firms close about 30 percent of their leverage gap every year. For group firms, the annual speed of adjustment is about 20–29 percent whereas for stand-alone firms, it is about 38–41 percent. Lesser potential benefits or higher costs of adjustments may be responsible for slower adjustment speed of group firms than their stand-alone counterparts.
Keywords
Introduction
Do firms follow target leverage? What determines firms’ target level of leverage? At what speed firms approach toward their target leverage? What are the factors that determine firms’ adjustment speed toward the target leverage? Is there any asymmetry in adjustment speed between firms with different characteristics and firms working under different macroeconomic environments? These are some of the frequently asked research questions that constitute the recent trend in capital structure research. The concept of target leverage is originated from the trade-off theory which is one of the most important theories in capital structure that developed after the seminal work of Modigliani and Miller (1958). The static version of trade-off theory states that the presence of debt in the capital structure reduces firms’ tax liability (Modigliani & Miller, 1963) and agency cost related to equity and free cash flow (Jensen, 1986; Jensen & Meckling, 1976). On the contrary, it increases firms’ financial distress and bankruptcy risks (Karus & Litzenberger, 1973), generates shareholder–debtholder agency conflicts (Jensen & Meckling, 1976), and creates debt overhang and underinvestment problem (Myers, 1977). Therefore, firms maintain an optimal or target level of leverage, where the marginal benefits trade-off the marginal costs of using additional debts (Jensen, 1986; Jensen & Meckling, 1976; Karus & Litzenberger, 1973; Myers, 1977).
The dynamic version of trade-off theory, on the contrary, argues that market frictions such as information asymmetry between insiders and outsiders (Myers, 1984; Myers & Majluf, 1984) and capital market shocks (Baker & Wurgler, 2002) induce firms to deviate from target leverage. However, since deviation from target leverage is costly, any deviation leads to dynamic rebalancing in subsequent financing decisions. Nevertheless, since rebalancing also involves some costs, firms only make partial adjustment toward target leverage with a definite speed of adjustment (Banerjee, Heshmati, & Wihlborg, 2000; Byoun, 2008; Cook & Tang, 2010; Drobetz & Wanzenried, 2006; Fama & French, 2002; Flannery & Rangan, 2006; Getzmann, Lang, & Spremann, 2014; Haron, Ibrahim, Nor, & Ibrahim,., 2013; Huang & Ritter, 2009; Jalilvand & Harris, 1984; Kayhan & Titman, 2007; Leary & Roberts, 2005; Ozkan, 2001; Qian, Tian, & Wirjanto, 2009). Therefore, speed of adjustment depends on two important factors: first, the costs of adjustment and second, the potential benefits of making such adjustments (Fisher, Heinkel, & Zechner, 1989; Myers, 1984). Adjustments take place only when the potential benefits are higher than the costs of making such adjustments. Since costs and benefits of adjustment varies from firm to firm and situation to situation, many recent studies find evidence of asymmetry in adjustment speed for firms with different characteristics and operating under different macroeconomic conditions. For instance, Drobetz and Wanzenried (2006) observed higher speed of adjustment for firms with higher growth opportunities and larger deviation from target leverage. Qian et al. (2009) found that the adjustment speed is faster for larger firms than the smaller firms. Byoun (2008) documented higher speed of adjustment for over-levered firms with financing surplus and under-levered firms with financing deficit. Similarly, Faulkender, Flannery, Hankins, and Smith (2012) observed that firms with higher cash flow realizations (surplus or deficit) and higher leverage gap (above or below target) adjust faster than the firms with similar leverage gaps but smaller cash flow realizations. The study by Dang, Kim, and Shin (2012) showed that the adjustment speed is higher for firms with higher financing deficit, larger investment, and lower earnings volatility than their opposite counterparts. With regard to macroeconomic conditions, studies by Drobetz and Wanzenried (2006), Cook and Tang (2010), Dang, Kim, and Shin (2014), and Drobetz, Schilling, and Schroder (2015) documented higher speed of adjustment in favorable macroeconomic environments than in adverse environments.
Firms’ ownership structure, that is, whether the firm is a group firm or a stand-alone firm, is another important factor that can affect the costs and benefits of adjustment in capital structure, especially in emerging economies like India. Firms’ affiliation to business groups is common in many economies including India (Claessens, Djankov, & Lang, 2000; La Porta, Lopez-De-Silanes, & Shleifer, 1999; Masulis, Pham, & Zein, 2011). As per the existing literature, group firms have some unique benefits and costs which are different from stand-alone firms. Benefits of firms’ affiliation to business groups include the presence of internal capital market (Chang & Choi, 1988; Fier, McCullough, & Carson, 2013; Gonenc, Kan, & Karadagli, 2007), intra-group guarantee, and support from member firms while raising finance as well as in times of financial distress (Byun, Choi, Hwang, & Kim, 2013; Gopalan, Nanda, & Seru, 2007), better reputation in the external market (Ghemawat & Khanna, 1998), and lesser information asymmetry problems with the investors (Dewenter & Warther, 1998). All these benefits are expected to reduce group firms’ costs of financing and increase their accessibility in the financial market thus allowing them to make speedy adjustment toward target leverage than their stand-alone counterparts. On the contrary, the main drawback for group firms is the agency conflict between the controlling and minority shareholders which is also known as the horizontal or type-II agency problem. In pyramid style of ownership structure, the most common form of group structure (La Porta et al., 1999; Masulis et al., 2011), a single family enjoys control right over all other member firms irrespective of its cash flow right in the same. It allows the controlling family to engage into expropriation of minority shareholders by means of tunneling of resources (Bae, Kang, & Kim, 2002; Bertrand, Mehta, & Mullainathan, 2002). Therefore, group firms suffer from higher monitoring costs and credit risks than the stand-alone firms which ultimately increases their costs of financing and limits their accessibility in the market (Lin, Ma, Malatesta, & Xuan, 2011). This argument suggests a slower speed of adjustment for group firms relative to stand-alone firms. Therefore, the impact of group affiliation on firms’ capital structure adjustment speed is not straightforward and demands an empirical study to test the same.
At international level, there are a number of studies that examine firms’ speed of adjustment toward target leverage but not many on the impact of firms’ group affiliation on such speed. Two important studies in this context are Kim, Heshmati, and Aoun (2006), which showed higher speed of adjustment for chaebol (group) firms than the non-chaebol (stand-alone) firms in Korea, and Dewaelheyns and Hulle (2012), which found higher speed of adjustment for Belgian group affiliated firms than their stand-alone counterparts. In India, few studies are available on speed of adjustment toward target leverage (Basu, 2015; Mukherjee & Mahakud, 2010, 2012). Some studies are also available on impact of group affiliation on firm’s performance and level of debt (Khanna & Palepu, 2000; Khanna & Rivkin, 2000, 2001; Manos, Murinde, & Green, 2007), but there is no study that examines the asymmetry in adjustment speed between group and stand-alone firms. Therefore, the objective of this study is to examine the asymmetry in adjustment speed between group and stand-alone firms. The study is worth taking because of two important reasons: first, it will revalidate the findings of existing studies on capital structure adjustment speed in India and second, it will reveal the comparative relevance of trade-off theory for group firms’ vis-à-vis stand-alone firms.
The Empirical Model
Following prior works like Flannery and Rangan (2006), Huang and Ritter (2009), and Faulkender et al. (2012), the study specifies the following standard partial adjustment model to examine firms’ capital structure adjustment speed.


Description of Variables
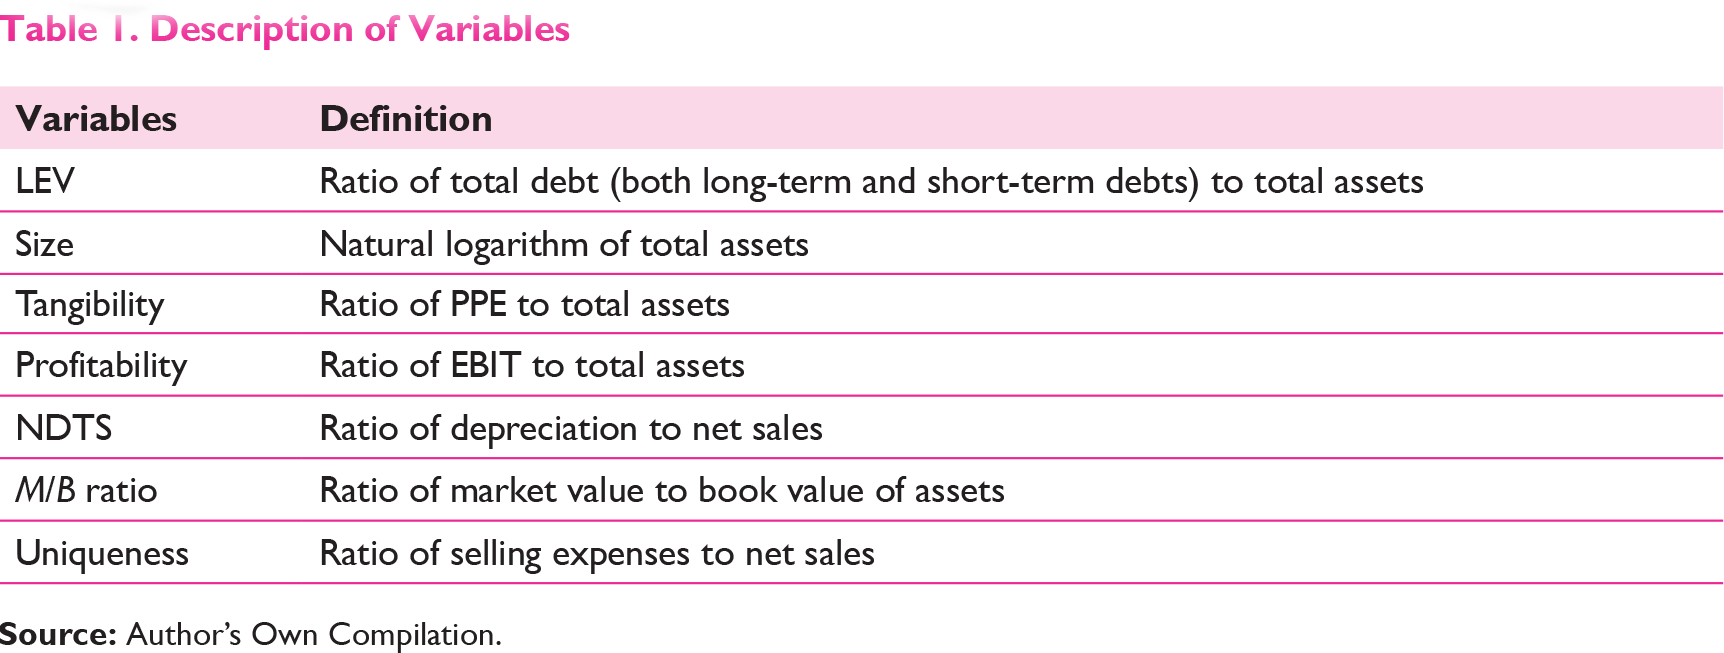
Substituting LEV*it in equation (1) by equation (2), we obtain


In equation (4), γ = (1 − α) and δ = αβ.
The dynamic panel model like equation (4) with lagged dependent variable as an explanatory variable involves some special estimation issues. Estimated coefficient of lagged dependent variable is biased upward in case of pooled ordinary least square (POLS) estimation ignoring firm fixed effects and is biased downward in case of fixed effect (FE) estimation (Huang & Ritter, 2009). Therefore, following prior studies (Drobetz & Wanzenried, 2006; Qian et al., 2009), the study uses the two-step generalized method of moments (GMM) estimation technique (Arellano & Bond, 1991; Arellano & Bover, 1995; Blundell & Bond, 1998) which provides efficient parameter estimates after controlling for firm-specific heterogeneity and endogeneity in explanatory variables.
In order to examine the asymmetry in adjustment speed between group and stand-alone firms, the study uses two approaches: (i) the sample splitting approach and (ii) the dummy variable approach. In the first approach, the study divides sample firms into two categories, that is, the group firms and the stand-alone firms, and estimates equation (4) separately in both the categories. One important limitation of this approach is that the statistical significance of difference in adjustment speed cannot be estimated. The second approach, that is, the dummy variable approach, overcomes this limitation. In this approach, the standard partial adjustment model is extended as follows:



In equation (7), γ1 = (1 − α1), δ1 = α1β, and δ2 = α2β.
Data Descriptions and Descriptive Statistics
The study covers all listed Indian firms available in ‘Capitaline Plus’ database over the period of 9 years from 2005 to 2013. Investigation is restricted to listed firms only so that keeping other things constant, every firm included in the sample has equal access to external capital market. Following prior studies, it excludes financial firms (Byoun, 2008; Dang et al., 2014; Ozkan, 2001; Rajan & Zingles, 1995), firms with non-positive total assets and net sales (Byoun, 2008), and firms with missing data of required variables (Ozkan, 2001; Shyam-Sunder & Myers, 1999) before arriving at the final testable dataset of 1,415 firms comprising 521 group affiliated firms and 894 stand-alone firms. The classification of group and stand-alone firms is based on the definition given in ‘Capitaline Plus’ database (George, Kabir, & Qian, 2011).
Descriptive Statistics

Correlation Matrix
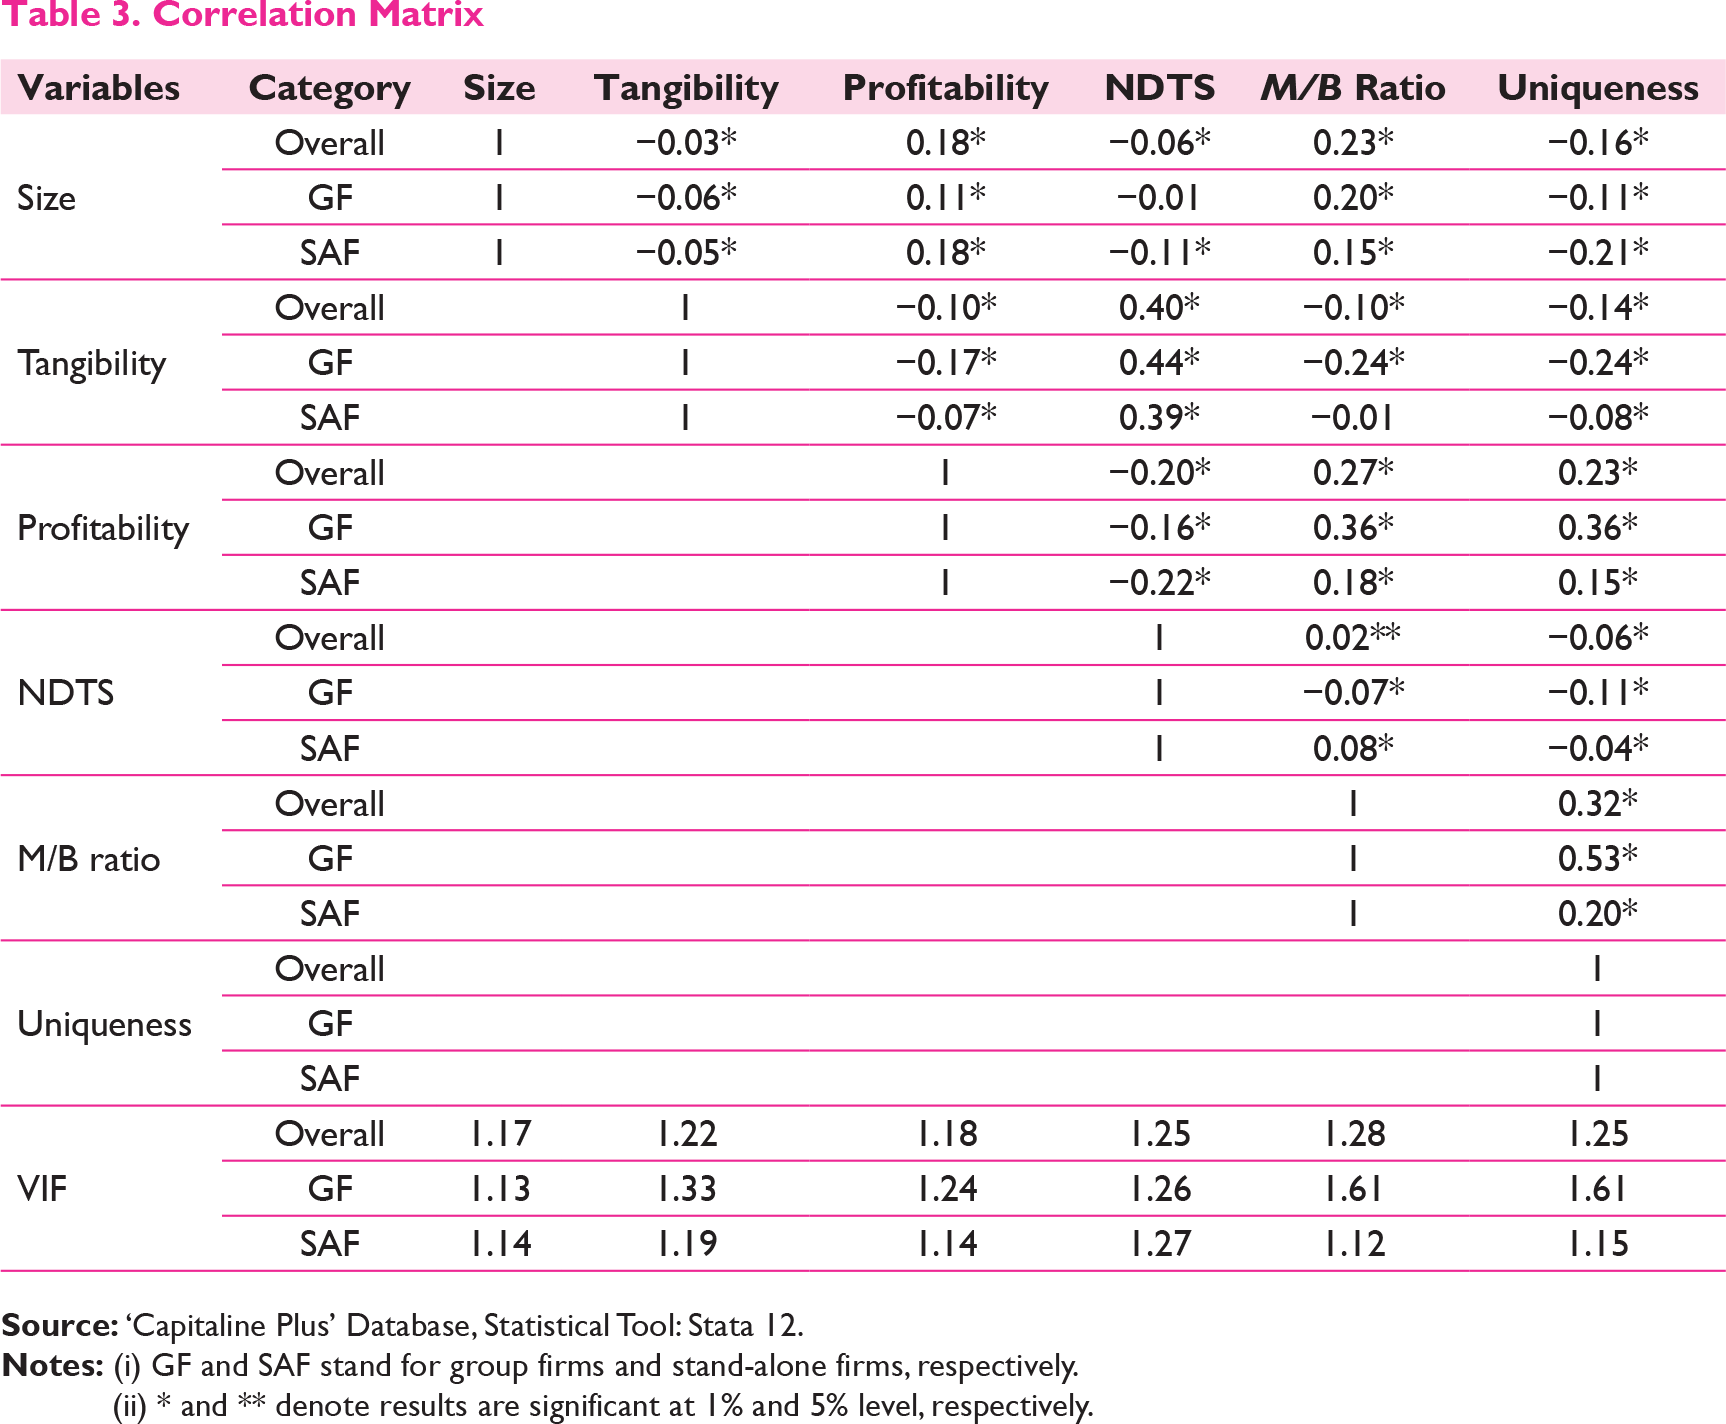
(ii) * and ** denote results are significant at 1% and 5% level, respectively.
Empirical Results
Sample Splitting Approach
POLS and FE Results

GMM Results

(ii) * and ** denote results are significant at 1% and 5% level, respectively.
(iii) Values corresponding to Wald tests, AR (2) test, and Sargan test are the probability values of their test statistics.
The study also discusses the results of GMM estimator which is regarded as the most efficient estimation technique for dynamic panel data models like equation (4), provided explanatory variables are jointly significant, instruments used are valid, and there is no second-order auto-correlation in residuals. The study conducts several post-estimation tests to examine the validity of the model. First, Wald tests (1) and (2), under the null hypothesis of zero joint significance of explanatory variables (except period dummies) and period dummies, respectively, show that they are jointly significant at 1 percent level in all three cases. Second, the AR (2) test, under the null hypothesis of no second-order auto-correlation in residuals, confirms the absence of second-order auto-correlation in the model as the results are not significant at 5 percent level in any case. Finally, the Sargan test of over-identifying restrictions, under the null hypothesis that the instruments used are valid, confirms validity of instruments as the results could not be rejected at 5 percent level of significance in any case.
Table 5 shows that the regression coefficient of lagged leverage ratio (γ) is 0.70 for the overall sample. It implies that the annual adjustment speed for Indian firms is 30 percent (α = 1 − γ) which would take around 3.3 years (1/α) for observed leverage to converge to target leverage. It establishes that Indian firms’ follow the trade-off theory in maintaining capital structure. The 30 percent adjustment speed is lower than the findings of Mukherjee and Mahakud (2010, 2012) who found 41–43 percent adjustment speed and Basu (2015) who found 37 percent adjustment speed for Indian firms. The difference in results can be due to sample firms and period covered under the study. Comparison with international findings suggests that the adjustment speed in India is moderate. Countries with comparatively faster adjustment speed include UK with 59 percent (Ozkan, 2001), Spain with 80 percent (Miguel & Pindado, 2001), France with 39 percent (Antoniou, Guney, & Paudyal, 2008), Malaysia with 57 percent (Haron, Ibrahim, Nor, & Ibrahim, 2013), and Canada with 35 percent (Drobetz et al., 2015). On the contrary, countries with relatively slower adjustment speed include Sweden with 8–16 percent (Loof, 2004), Switzerland with 11–21 percent (Gaud, Jani, Hoesli, & Bender, 2005), Korea with 17 percent (Kim et al., 2006), Germany with 24 percent (Antoniou, Guney, & Paudyal, 2008), Japan with 11 percent (Antoniou, Guney, & Paudyal, 2008), China with 19 percent (Qian et al., 2009), and Italy with 23 percent (Drobetz et al., 2015). The adjustment speed for Indian firms is comparable to that of US firms which, as documented by many recent studies (Antoniou, Guney, & Paudyal, 2008; Dang et al., 2014; Flannery & Rangan, 2006), is around 30 percent. Besides, it is very close to the average adjustment speed for Asian countries which is around 32 percent (Getzmann et al., 2014). The possible reason for variation in adjustment speed can be attributed to country-level differences in institutional framework and macroeconomic environment (Drobetz et al., 2015).
The splitting of sample into group and stand-alone firms reveals that the lagged leverage ratio (γ) has coefficients of 0.71 and 0.62, respectively, which means the adjustment speed for the former is much slower than that of the latter, that is, 29 and 38 percent, respectively. At this rate, the former would take around 3.5 years, whereas the latter would take only 2.6 years to make complete adjustment to target leverage. This indicates that stand-alone firms are more concerned about target leverage than group firms. This can be interpreted as the higher relevance of trade-off theory for stand-alone firms than group firms in India. The slower adjustment speed for group firms is against the findings in other countries. For Korea, Kim et al. (2006) found that chaebol firms adjust faster (i.e., 20 percent) than the non-chaebol counterparts (i.e., 16 percent). In case of Belgian firms, Dewaelheyns and Hulle (2012) estimated 48 percent adjustment speed for group-affiliated firms and 25 percent adjustment speed for stand-alone firms. The result, however, confirms the asymmetry in adjustment speed between group and stand-alone firms. The slower adjustment speed for group firms may indicate their higher adjustment costs than the stand-alone firms possibly due to expropriation of minority shareholders and other moral hazard activities by controlling shareholders. One should, however, be cautious in drawing conclusions as slower adjustment speed for group firms may also indicate their lesser costs of deviations and consequently lesser potential benefits of adjustment. For example, (i) alternative arrangements like political connections and lobbying power (Ghemawat & Khanna, 1998), diversification into businesses with low tax rate (Ferris, Kim, & Kitsabunnarat, 2003) to minimize tax liability, (ii) lesser owner–manager agency conflicts due to the presence of family members in top management (Claessens et al., 2000; La Porta et al., 1999; Masulis et al., 2011; Rajan & Zingales, 1995), (iii) lesser shareholder–debtholder agency conflicts due to managements’ incentive structure to maximize firm value (Anderson, Mansi, & Reeb, 2003), and (iv) intra-group guarantee and coinsurance while raising finance and support from member firms at the time of financial distress and bankruptcy (Byun et al., 2013; Gopalan et al., 2007) may reduce group firms’ incentives to make rapid adjustments in capital structure.
With regard to determinants of target leverage, size is positively related to leverage in all cases and is significant at 1 percent level of significance. This is consistent with the argument that larger firms maintain higher leverage as they are generally more diversified, has better access to external capital market, and are less prone to get bankrupt (Drobetz & Wanzenried, 2006; Qian et al., 2009). The coefficients of tangibility are insignificant in all the cases and therefore dropped from further discussions. The coefficient of profitability is consistently negative and significant in all cases. This is consistent with the argument of pecking order theory that firms with higher profitability use lesser level of debt. Such firms can meet their financing requirements from internally generated funds and their need to access external capital market is minimum (Drobetz & Wanzenried, 2006; Myers & Majluf, 1984). Non-debt tax shield is negatively related to leverage ratio in all cases which implies that firms with higher NDTS maintain lower level of debt as the former substitutes latter in reducing tax liability (DeAngelo & Masulis, 1980). M/B ratio is positively significant in all cases which is in line with the prediction of simple pecking order theory that firms with higher growth opportunities maintain more leverage as they are more in need of funds to capitalize their profitable investment opportunities. The positive relationship of growth with leverage is consistent with the findings of Banerjee et al. (2000), Loof (2004), and Bhaduri (2002). Finally, uniqueness is negatively related to leverage ratio which is consistent with the theoretical predictions that firms dealing with unique and specialized products maintain lesser debt (Titman & Wessels, 1988).
Dummy Variable Approach
GMM Results
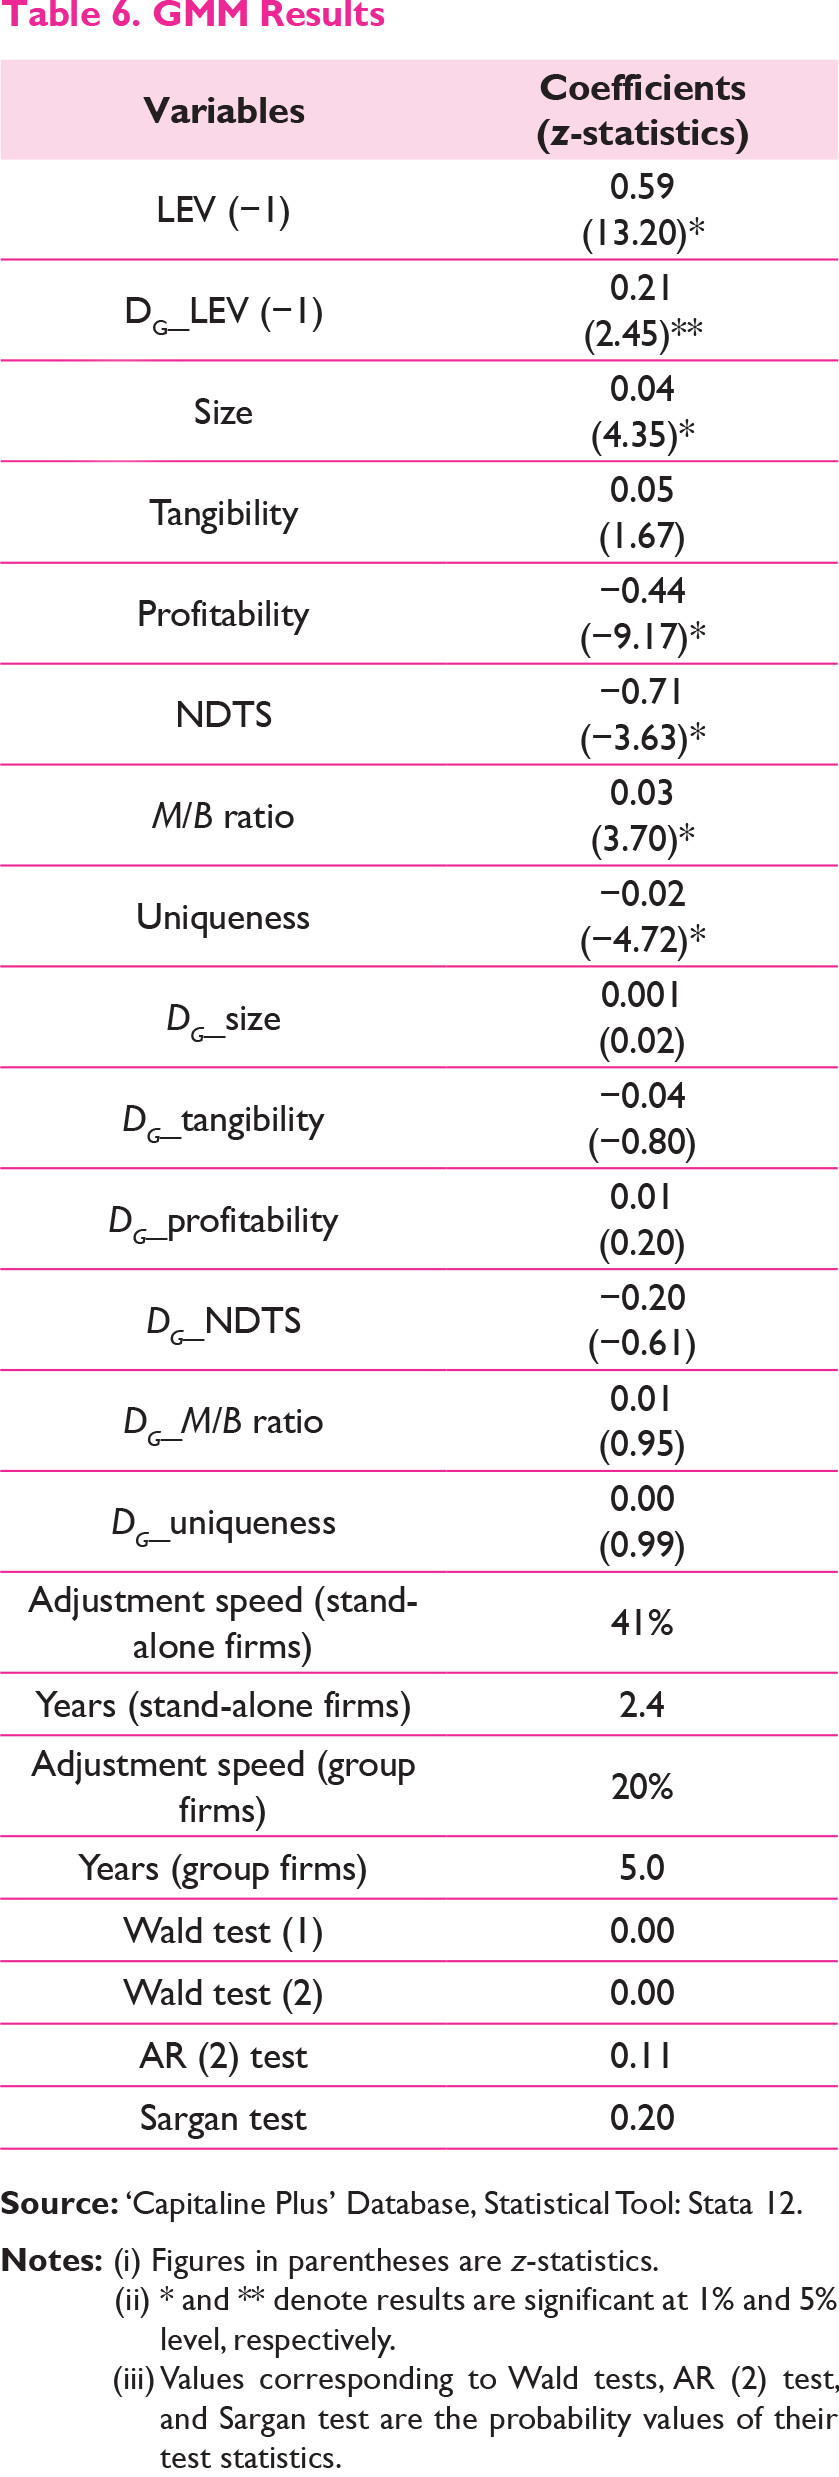
(ii)
* and ** denote results are significant at 1% and 5% level, respectively.
(iii)
Values corresponding to Wald tests, AR (2) test, and Sargan test are the probability values of their test statistics.
Summary of the Study
The study examines the impact of ownership structure on capital structure adjustment speed based on a dataset of 1,415 listed Indian manufacturing firms over the period of 2005–2013. In order to fulfill the purpose, it divides the sample firms into two categories on the basis of their ownership structure, namely, group-affiliated firms and stand-alone firms. It then uses the partial adjustment model and GMM estimation technique to estimate the adjustment speed for the overall sample as well as separately for group and stand-alone firms. The results reveal that Indian manufacturing firms adjust about 30 percent of their leverage gap annually and takes around 3.3 years for complete convergence to target leverage. The comparison with international studies indicates that the adjustment speed in India is moderate and is close to the average adjustment speed in Asian countries. The separation of group and stand-alone firms shows that there is asymmetry in adjustment speed between two sets of firms. The adjustment speed of group firms is much slower (20–29 percent) than that of stand-alone firms (38–41 percent). The average time required for achieving the target level of leverage is 3.5–5 years for group firms and 2.4–2.6 years for stand-alone firms. Lesser potential benefits or higher costs of adjustments may be responsible for slower adjustment speed for group firms than their stand-alone counterparts.
Implications of the Study
The findings of the study have not only practical implications for financial managers but also implications for future empirical research on the relationship between ownership structure and capital structure dynamics. First, it shows impacts of different firm characteristics on target capital structure by using recent dataset of large number of publicly listed firms. Second, it revalidates the findings of existing studies that Indian firms approach toward target capital structure with a definite speed and therefore their financing decisions are influenced by trade-off theory. Third, by using interactions of group dummy and firm characteristics, it shows that the impact of firm characteristics on target capital structure remains unchanged irrespective of firms’ affiliation status to business groups. Fourth, it reveals that relevance of trade-off theory or the tendency to converge to target leverage is relatively higher for stand-alone firms than group firms. Finally, this study, as per author’s knowledge, is the sole attempt to examine the impact of ownership structure on firms’ capital structure dynamics in emerging economies in general and India in particular. Hence, it is a useful contribution to the extant literature. Further, the study can be extended in future by investigating the cause of slower adjustment speed for group firms than stand-alone firms, that is, whether group firms have high costs of adjustment or their costs of deviation from target leverage are low. For that matter, examining the asymmetry in adjustment speed between the two sets of firms considering their nature of deviation (over-levered versus under-levered) and extent of deviation (highly deviated versus slightly deviated) from the target leverage may be helpful.
Footnotes
Author’s Biography