
Abstract
Integrating a diverse set of land use types within a neighborhood is a central tenet of smart growth policy. Over a generation of urban planning research has heralded the transportation, land use, and public health benefits arising from a balanced supply of local land uses, including the improved feasibility for pedestrian travel. However, land use mixing has largely remained a transportation-land use planning goal without a conceptually valid set of environmental indicators quantifying this multifaceted spatial phenomenon. In this study, we incorporated activity-based transportation planning and landscape ecology theory within a confirmatory factor analysis framework to introduce a land use mix construct indicative of the paired landscape pattern aspects of composition and configuration. We found that our activity-related land use mix measure, and not the commonly adopted entropy-based index, predicted walk mode choice and home-based walk trip frequency when operationalized at three geographic scales.
Introduction
The sustained popularity for transportation-land use interactions investigation over the past three decades has fundamentally shaped modern planning scholarship (Boarnet, 2011). Attraction for research in this sub-discipline emerges from a prospect for planners to moderate travel behavior by physically altering the urban landscape (Ewing and Cervero, 2010). Studies into this central principle of the transportation-land use connection generally accept that a compact neighborhood characterized by a diversity of activity destinations and traditional street network design supports pedestrian travel (Cervero and Kockelman, 1997). A recognition evidenced by the growing adoption of transportation-land use strategies by local, regional, and state agencies; whose guiding visions and programs emphasize the many purported transportation, land use, and public health benefits related to neighborhood land use mixing.
From a transportation perspective, smart growth policies intended to increase local land use mixing bring functional origins and destinations closer; therefore, decreasing trip distances and making walking competitive with faster travel modes (Clifton et al., 2008). Land use mixing is also viewed as a strategy for balancing travel demand uniformly across the day (Cervero, 1996), promoting trip chaining (Maat and Timmermans, 2006), and reducing vehicle distance traveled, mode selection, and ownership (Cervero, 1989; Kockelman, 1997). Viewed through a land use planning lens, policies aimed at siting diverse land uses in a compact setting provide a visibly interesting built environment conducive to walking (Forsyth et al., 2008; Reilly and Landis, 2003). Stimulating mixed use development also provides a policy instrument to encourage urban revitalization and slow rural land consumption (Downs, 2005).
Public health researchers investigating the link between chronic disease risk factors and the built environment also exude the benefits of smart growth policies (Christian et al., 2011; Wineman et al., 2014). An intermixing of complementary land use types provides neighborhood residents and visitors a diversity in destination types that facilitates walking and physical activity (Brownson et al., 2009; Forsyth et al., 2008). Other physical health benefits such as reduced vehicle emissions exposure through congestion mitigation (Frank et al., 2008) and mental health-related benefits such as increased neighborly communication or an improved sense of place (Manaugh and Kreider, 2013; Song et al., 2013) are also attributed to mixed use landscapes.
Ultimately, multidisciplinary research has heralded land use mix as a planning goal that policymakers must realize to form neighborhoods favorable to active, healthy lifestyles (Duncan et al., 2010). However, this connection between land use mix and pedestrian travel remains complicated by the many measures chosen by researchers to objectively illustrate this intangible environmental construct (Manaugh and Kreider, 2013). A division between research and practice resulting in the provision of measures with imperfect theoretical foundations, which likely hinders the implementation of land use mix as a performance metric in practice (Gehrke and Clifton, 2016).
This article critiques current practice and introduces a land use mix measure reflecting the composition and configuration of local land uses. Specifically, this study depicts mix as a latent construct in which the ideal composition of local land use types is guided by observed activity distributions and their spatial arrangement is explicitly expressed. Statistically significant associations are found between the proposed land use mix construct and pedestrian travel behaviors. Planners who wish to promote walking may benefit from our conceptualization of land use mix.
Land use mix measurement and pedestrian travel
Land use mix is aptly defined as the level of integration among different land use types in a neighborhood (Saelens et al., 2003). A succinct description that presents a challenging array of choices to quantify the mixing of neighborhood land uses (Brown et al., 2009). Given this challenge and a recognition that mixed use settings improve active transport viability (Handy, 2005), land use mix has become the most frequently evaluated built environment determinant of physical activity (Brownson et al., 2009). With this in mind, planners must be cognizant of how this environmental phenomenon is operationalized to ensure that policy and practice are guided by empirical evidence originating from proposed theory (Frank, 2000).
The theory supporting land use mix and the measurement of an ideal level of integration among different land use types will likely vary based on the outcome of interest. In this study of pedestrian travel outcomes, we are interested in operationalizing land use mix as a construct grounded in travel behavior theory. The following subsections, organized by the quantification of land use mix as a distance, intensity, or pattern measure (Song and Rodriguez, 2005), offer a transportation-related conceptual basis for adopting a measurement type and a review of pedestrian travel studies exploring each dimension.
Distance measures
Accessibility is the ease of an individual to reach an opportunity from a given activity location (Kwan and Weber, 2008). Operationalized as a mix measure, the opportunity and activity locations are presented function-related land use designations, while the ease of travel between locations is customarily conveyed as distance. A resulting metric quantifies the spatial arrangement of two land uses as the relative burden of traveling between them (Clifton et al., 2008). By reducing the distance between locations, walking’s feasibility increases and the competitive edge of faster travel modes diminishes.
Studying this connection between distance-based accessibility and walking, Krizek and Johnson (2006) found individuals living within 200 m of a retail establishment were more likely to walk than residents living at least three times farther from a similar land use. Conversely, Lee and Moudon (2006) modeled a negative association between proximity of mixed use neighborhood centers and the likelihood to walk; whereas Reilly and Landis (2003) found a positive link between access to commercial uses and this outcome. In a study of walk frequency, Shay et al. (2006) discovered a shortened distance to a commercial center positively impacted utilitarian travel. Other studies have noted the positive connection between grocery store proximity and walk trip frequency (Handy and Clifton, 2001; Cao et al., 2006; Handy et al., 2006).
In general, studies of distance-based accessibility and walking support the hypothesized transportation-land use connection. However, while quantifying mix as a distance-based measure is conceptually simple, its adoption as an area-based summary is empirically limited (Brownson et al., 2009). Distance measures provide insufficient detail by only measuring the spatial proximity of two activity locations, solely providing a summary calculation for the origin, and failing to quantify the quality of the described link.
Intensity measures
Intensity measures quantify the frequency or percent of activity locations in a landscape dedicated to a specific land use type (Brownson et al., 2009; Song et al., 2013). A count of land use types is a proxy for how many potential trip origins or destinations exist within a neighborhood (Hess et al., 2001), while a percent explains the scarcity or dominance of an activity type (Song et al., 2013). Both the frequency and size of activity locations, or land uses, contribute to neighborhood accessibility and the increased willingness of an individual to walk for activity fulfillment (Handy, 1993).
Studying the environmental determinants of physical activity, Hoehner et al. (2005) discovered that residents with a high intensity of nonresidential destinations within a quarter-mile of their home had an increased propensity for walking. Specifying a single activity type, Frank et al. (2007) and Boarnet et al. (2011) found an increased intensity in recreational spaces and retail stores, respectively, increased this likelihood to walk. Kerr et al. (2007) noted the nearby presence of a recreational or commercial land use impacted youth walk mode choice. Exploring its connection to time spent walking, past studies found an increased intensity of grocery stores, offices, retail shops, and schools (McConnville et al., 2010; Lee and Moudon, 2006) and commercial establishments (Nagel et al., 2008) increased pedestrian travel. In a study of 10 metro regions, Boer et al. (2007) operationalized mix as the count of unique business types within a neighborhood and discovered a positive relationship with distance walked. Meanwhile, Forsyth et al. (2008) found the percent of area devoted to a social land use positively predicted distance and time spent walking for subsistence and maintenance trips.
Despite variation in the nonresidential land uses analyzed, a higher intensity of out-of-home activity locations was commonly connected to increased pedestrian travel. The conceptual link is straightforward: a greater intensity of nonresidential land uses near an individual’s residence enhances the practicality of walking to daily life activities by reducing travel distance (Handy et al., 2002). However, mix as an intensity measure is limited by its inability to summarize the count or percentage of multiple land uses as a single value and sensitivity to spatial scale selection (Song et al., 2013).
Pattern measures
A final measurement category quantifies mix as the composition and configuration of local land use types. In transportation-land use study, land use mix as a pattern measure has exclusively been measured as the composition, or distribution, of different land use types in a neighborhood (Frank and Pivo, 1994). A neighborhood with a mixture of both residential and nonresidential land uses influences travel demand by inducing internal walk trips that substitute for prospective out-of-neighborhood motorized trips (Cervero and Kockelman, 1997). Regularly, a version of the land use entropy index, introduced to planning research by Cervero (1989), has summarized the degree of mixing in an area.
Analyzing the built environment determinants of travel in 15 regions, Ewing et al. (2015) found an increase in the entropy score of three land use types (residential, commercial, and public) within a quarter-mile of the traveler’s residence positively predicted walk mode choice. Earlier, Zhang and Kukadia (2005) discovered the balance of residential, commercial, and industrial land uses near a residence became a stronger predictor of walking as the spatial extent of operationalization increased. Summarizing the evenness among these same three land uses, Wineman et al. (2014) discovered a negative link with time spent walking; whereas Rajamani et al. (2003) modeled a positive link with walk mode choice for nonwork travel when a fourth class reflecting all other land uses was incorporated. Frank et al. (2008) echoed this latter finding in a Seattle-based study associating the entropy score of residential, office, retail, and entertainment land uses with walk mode choice. A previous study (Frank et al., 2004) summarizing the balance of residential, office, commercial, and institutional land uses in Atlanta neighborhoods found increased evenness predicted distance walked. Studying active travel in San Francisco, Cervero and Duncan (2003) generated a land use diversity factor indicated by residential, office, retail, and industrial balance at the trip origin and found the factor positively predicted the decision to walk.
This evidence and prior reviews (Brownson et al., 2009; Saelens and Handy, 2008) mostly support a positive relationship between entropy-based indices and pedestrian travel. However, evenness is often depicted as land use mix despite only summarizing a landscape’s composition of land use types and not their spatial arrangement. As a result, neighborhoods with considerably different configurations of land use types can produce identical entropy scores (Hess et al., 2001; Manaugh and Kreider, 2013). Further, a neighborhood with an entropy score of one is assumed to embody an ideal level of land use mixing for travel; yet, no theoretical foundation links an equal balance of all land use types with demand (Rodriguez et al., 2009; Song et al., 2013). Since land use mix is intrinsically a spatial phenomenon, an apt depiction must not only measure the diversity of land use types in a neighborhood but also convey the configuration of these parcels. Relatedly, entropy indices typically fail to consider the functional complementarity among the assessed land use types. A consequence of these oversights has been the adoption of theoretically flawed measures of composition and inattention to the other pattern aspect of configuration. By measuring land use mix based on composition and configuration, a more robust investigation of this environmental phenomenon and its theorized link to pedestrian travel will be achieved (Hess et al., 2001).
Land use composition and configuration
Spatial heterogeneity describes the complexity in composition and configuration of landscape patches. In landscape ecology, composition is the number of land use patches or proportion of each type, while configuration reflects the spatial arrangement, shape, and dissimilarity of landscape patches (Li and Reynolds, 1994; Turner, 2005). The field is founded on the notion that these paired pattern aspects comprise landscape structure, which in turn strongly impact behavioral processes (McGarigal and McComb, 1995). Rather than defining urban development patterns, the motivation of landscape ecology research has centered on understanding how these aspects inform environmental protection and resource conservation (Clifton et al., 2008). Consequently, interest in the quantification of spatial heterogeneity has accompanied technological advancements to offer researchers with myriad measures to assess landscape change in the name of environmental stewardship (Gustafson, 1998).
However, examining the composition and configuration of natural environments may also offer insight into how different land use patterns influence travel. Particularly, how complexity of each pattern aspect can be better understood to produce a more rounded depiction of land use mix and its connection to pedestrian travel. Figure 1 is a schematic of how increased complexity in composition and configuration is more characteristic of a neighborhood with greater land use mixing. We reason that Landscape D exhibits the spatial heterogeneity exemplified in traditional downtown settings celebrated for their intermingling of diverse activity locations (Cervero, 1989), which best supports walking.
Landscape representations of complexity in the pattern aspects of land use composition and configuration.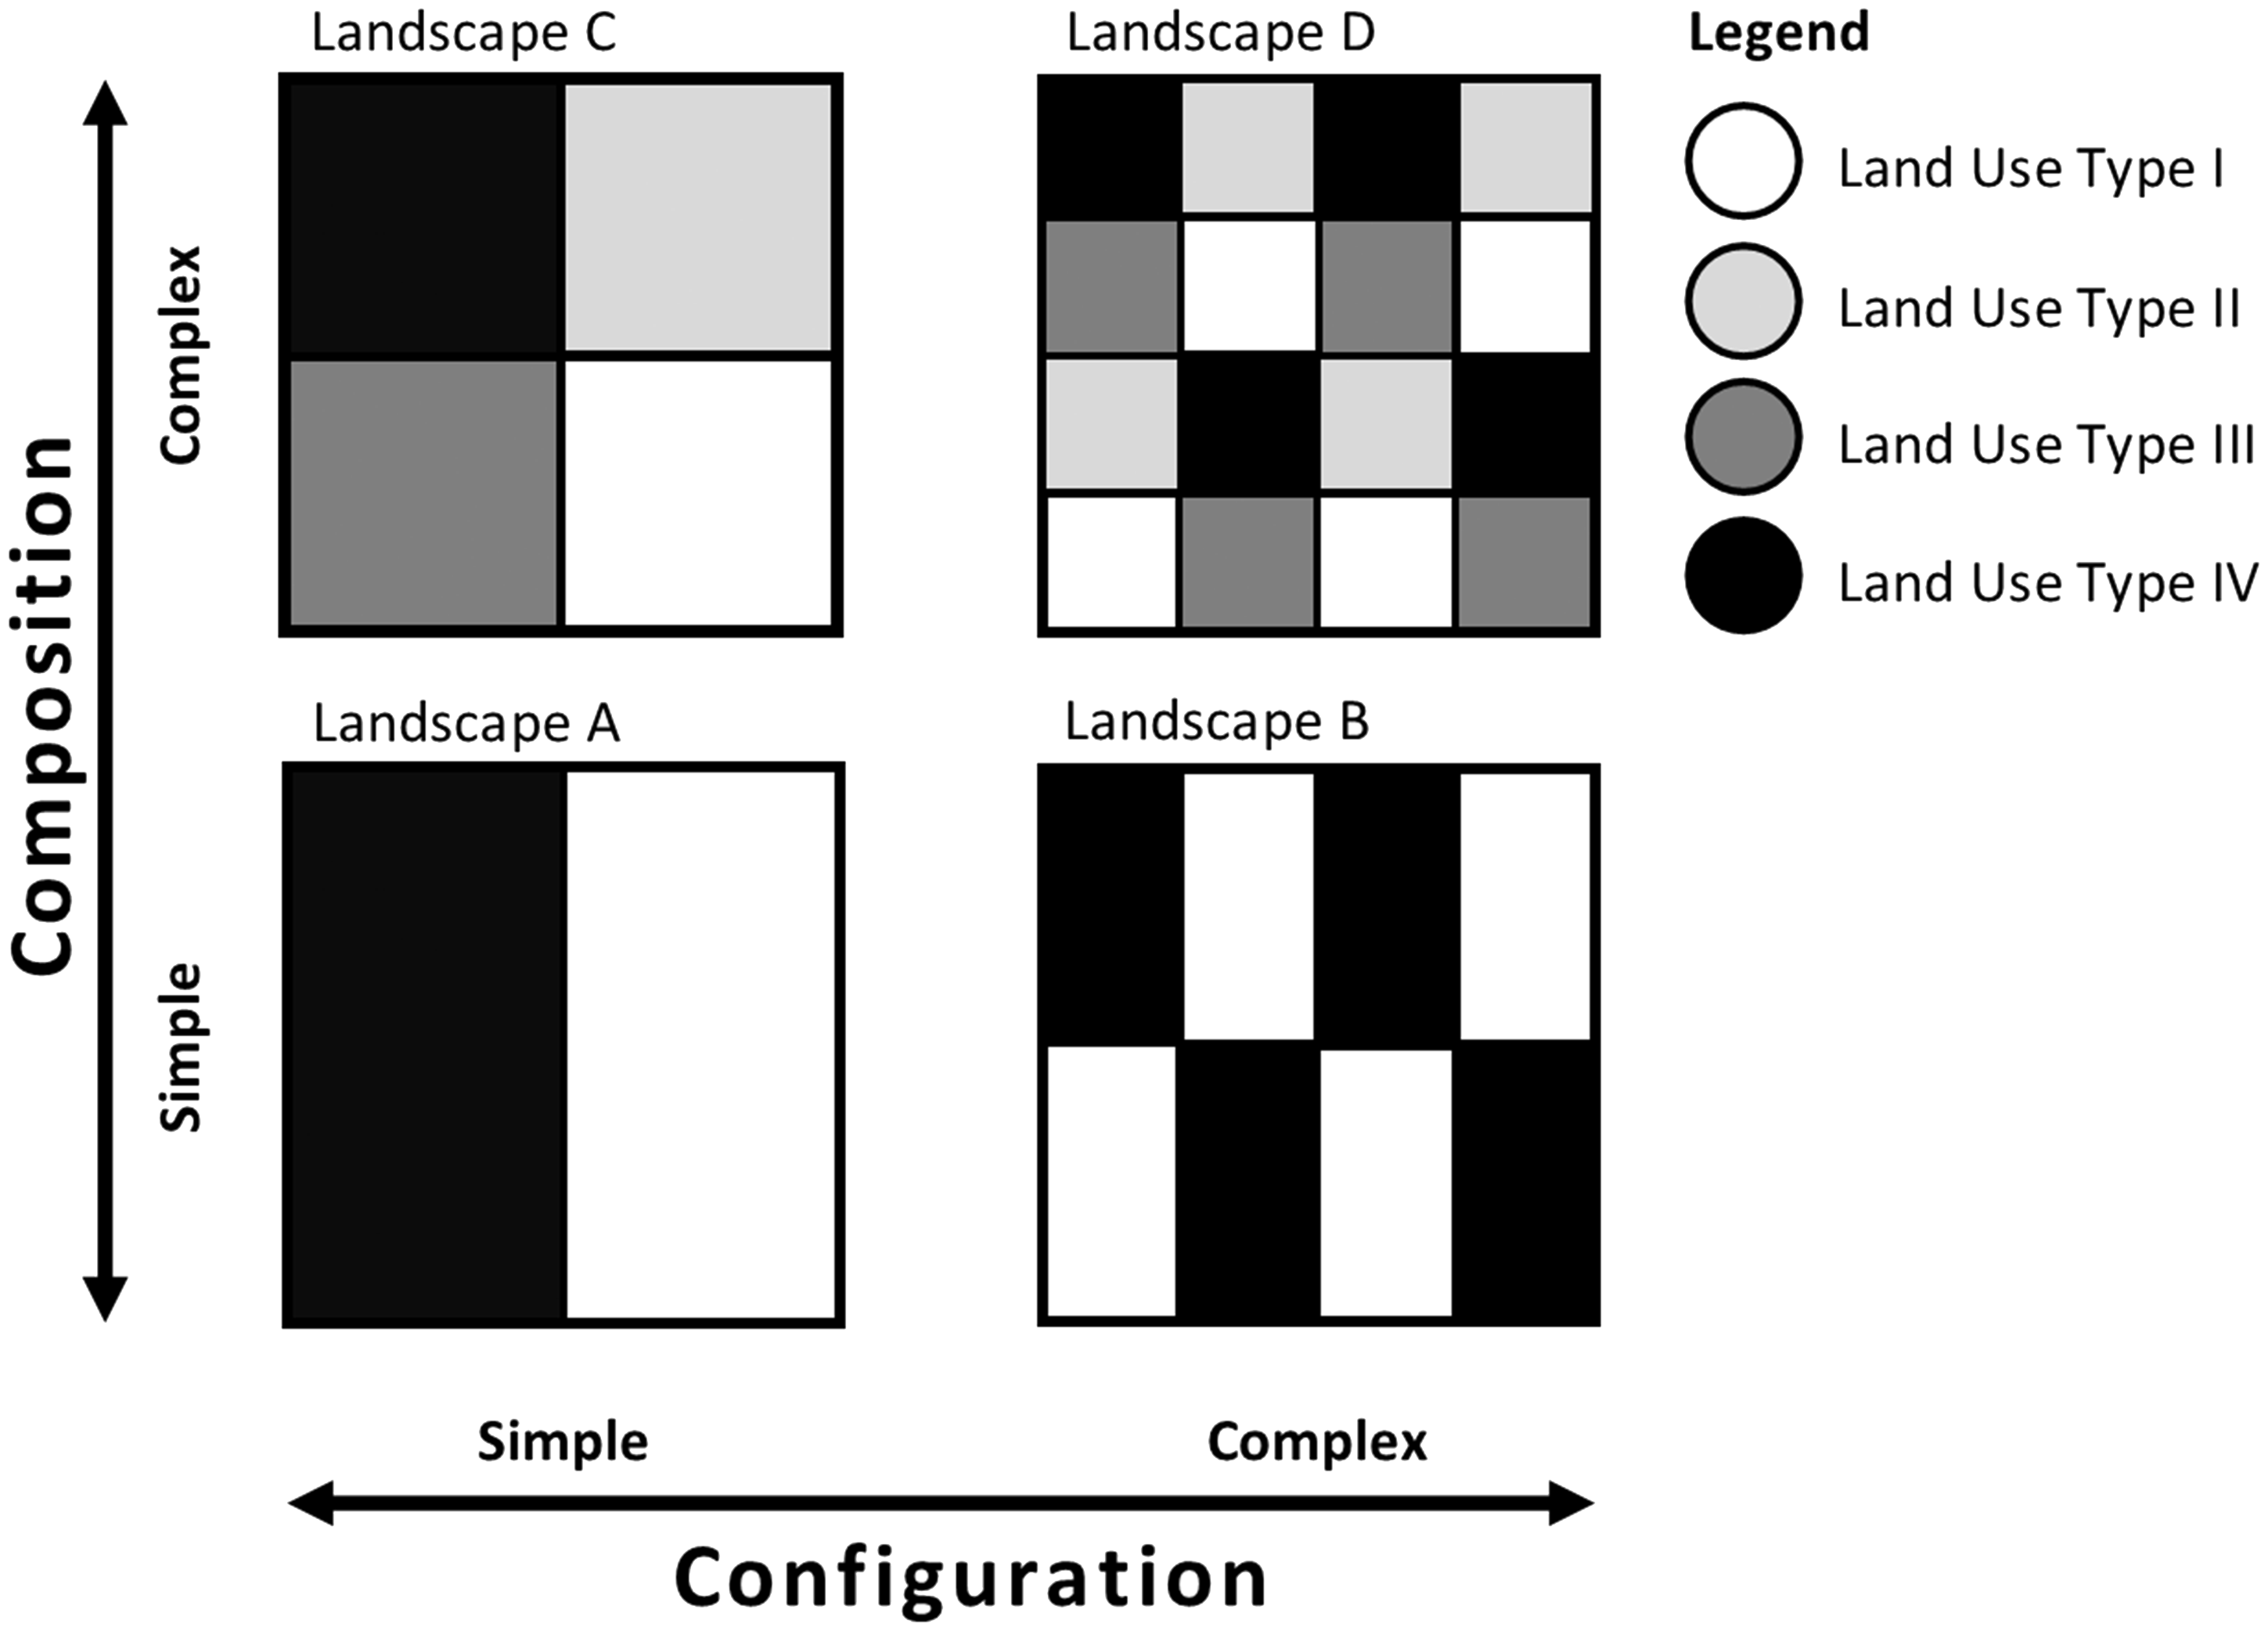
To date, planning research has almost entirely studied the travel outcomes of mixed use development patterns by employing measures insensitive to spatial arrangement. An unintended result has been the implementation of mix measures that imperfectly reflect the increased intensity, diversity, and integration of land use types described by urban form theory as sustainable land development (Grant, 2002). In response, our study aims to (a) provide planners with a land use mix measure quantifying land use composition and configuration, and (b) demonstrate the link between this multifaceted construct and pedestrian travel.
Study area and land use data
This study examines the interactions between landscape pattern and walking within six counties located in Oregon’s Willamette River Valley. An expansive area was chosen to capture variations in landscape and travel patterns found across the three metro regions of Portland, Salem, and Eugene. Portland is the population and economic hub of the study area with a metro region reaching into Multnomah, Washington, and Clackamas counties. Salem is the state capitol located in Marion and Polk counties, and Eugene is located entirely in Lane County. Each urbanized area is enclosed by a state mandated growth boundary controlling expansion and promoting efficient development patterns.
Distribution of parcels categorized with the LBCS.
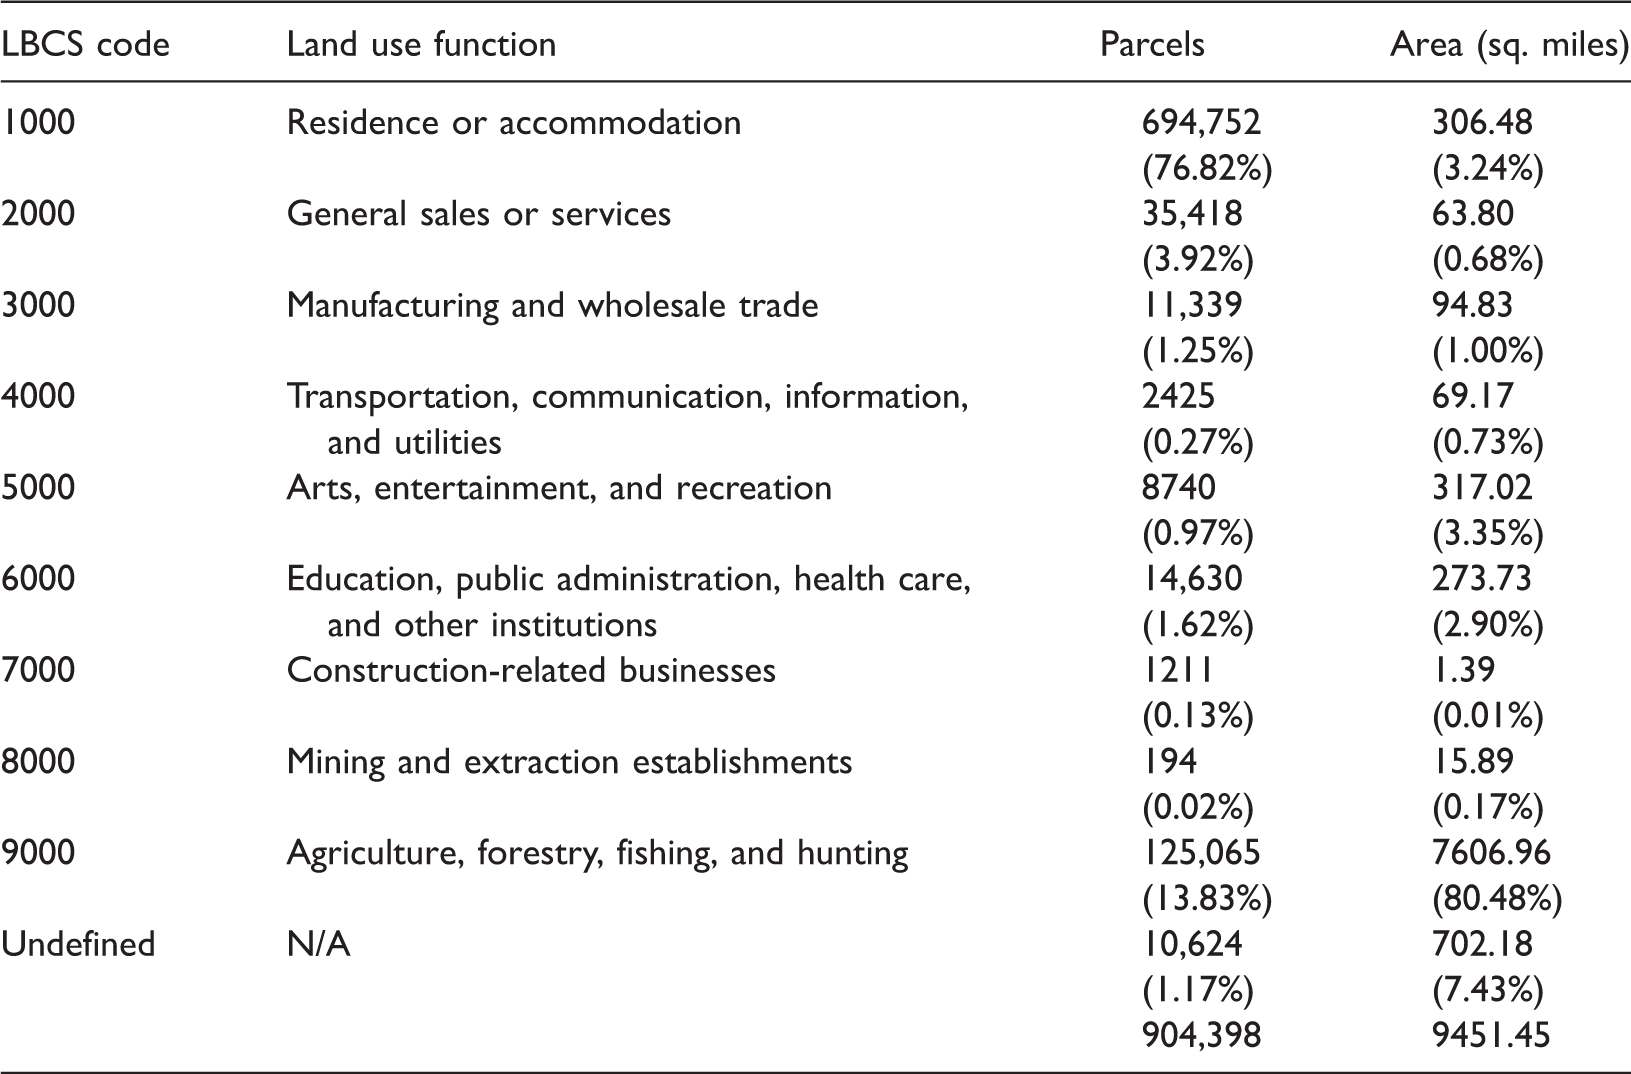
LBCS: Land-Based Classification Standard.
Land use mix indicators and construct measurement
A set of land use mix indicators centered on the aforementioned theoretic principles of composition and configuration were calculated using these land use data. Each indicator was operationalized at a one-quarter, one-half, and one-mile grid cell extent to help understand variation in the neighborhood effects of land use mixing. A land use mix construct was then measured using the resulting indicators.
Land use mix indicators
Land use composition
A core set of composition metrics assess the number of land use categories, relative proportion of each category, and diversity among chosen categories (Gustafson, 1998). Translated to a planning context, the first two sets of metrics assess the count or percent of parcels in a neighborhood dedicated to a particular land use type; whereas diversity is a function of both the intensity and distribution of land use types in a landscape. To ensure composition was reflected in our land use mix construct, two indicators of diversity, grounded in planning theory, were calculated.
First, an indicator of the number of contiguous patches of either residential or retail land uses was calculated. This land use composition measure reflected the intensity in residential and nonresidential activity concentrations, normalized by the number of patches distributed in the landscape. The patch frequency for these two land use types was jointly captured to account for the interspersion of localized retail centers and residential pockets; both hallmark smart growth features.
Second, a land use diversity metric was developed to account for the distribution of all land use types in a landscape. This indicator describes activity-related complementarity (ARC) or localized land use balance based on derived travel demand rather than spatial equilibrium.
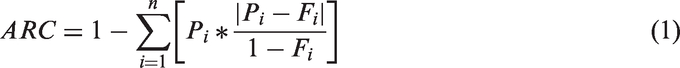
In equation (1), n is the number of land use types, Pi is the proportion of area dedicated to land use type i, and Fi is an activity factor associated with each land use type in a landscape. If land use types serve as proxies for trip ends, then a land use mix indicator should measure the degree of complementarity among those land uses that derive travel demand (Hess et al., 2001). Hence, these activity factors measure the percent of sampled trip ends terminating at one of nine land use types.
1
For instance, in the study sample, 31% of all trips terminated at a location providing general sales or services. The term
Akin to an entropy index score, this pattern metric ranges in value from zero to one. A score of zero indicates a landscape dominated by a single land use type; whereas a score of one indicates a landscape where the spatial allocation of all land use types perfectly matches the observed attraction for activities. As such, a landscape with a high proportion of residences and retail stores scores higher than a landscape with a high proportion of land dedicated to agriculture or manufacturing.
Land use configuration
In complement to these composition measures are those spatial heterogeneity measures of a landscape using patch- or pixel-based land use configuration indices (Gustafson, 1998). A maximum patch size measure was calculated by determining the largest area of adjoining parcels of a single land use and then normalizing this calculation by overall landscape area. This indicator identified landscapes with high patch aggregation or isolation, independent of the land use types in a landscape.
Finally, a pixel-based metric of patch disaggregation and interspersion specific to all land use types was calculated. Landscape ecologists commonly apply a contagion index (Li and Reynolds, 1994; O’Neill et al., 1988) to differentiate landscapes with a small number of contiguous patches from those with an intermixing of dissimilar patch types, which characterizes a landscape with a high level of land use integration (Clifton et al., 2008).

The numerator in equation (2) is the entropy index adopted from information sciences (Shannon and Weaver, 1949), where
Descriptive statistics and zero-order correlation matrix of indicators at three geographic scales.
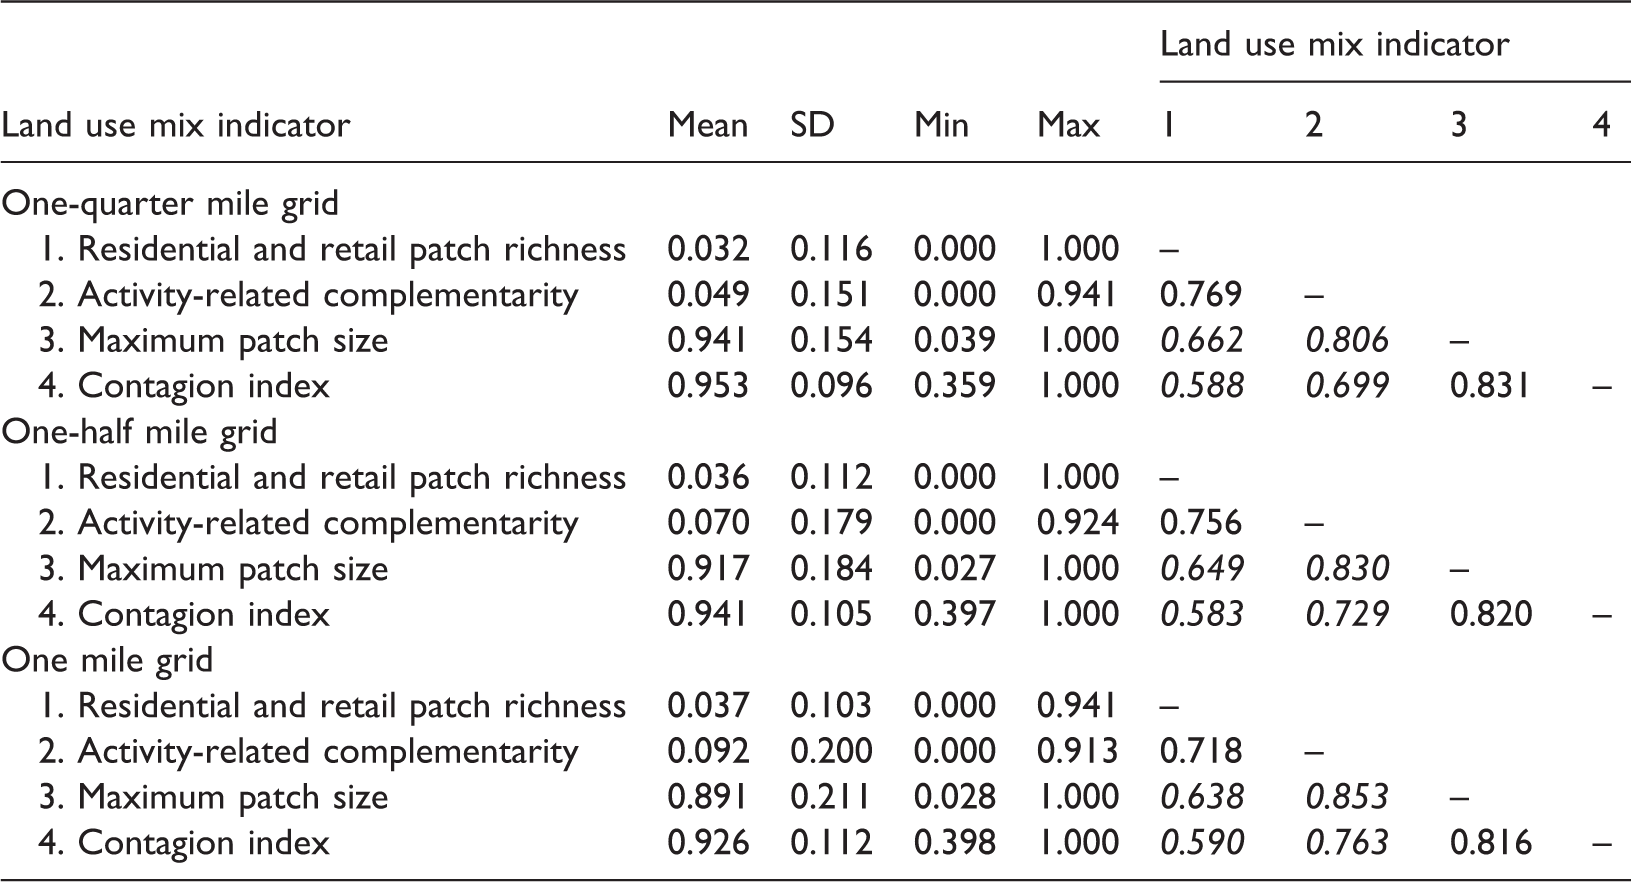
Note: An italicized value indicates a negative Spearman correlation value.
Land use mix measurement
Confirmatory factor analyses of land use mix operationalized at three geographic scales.
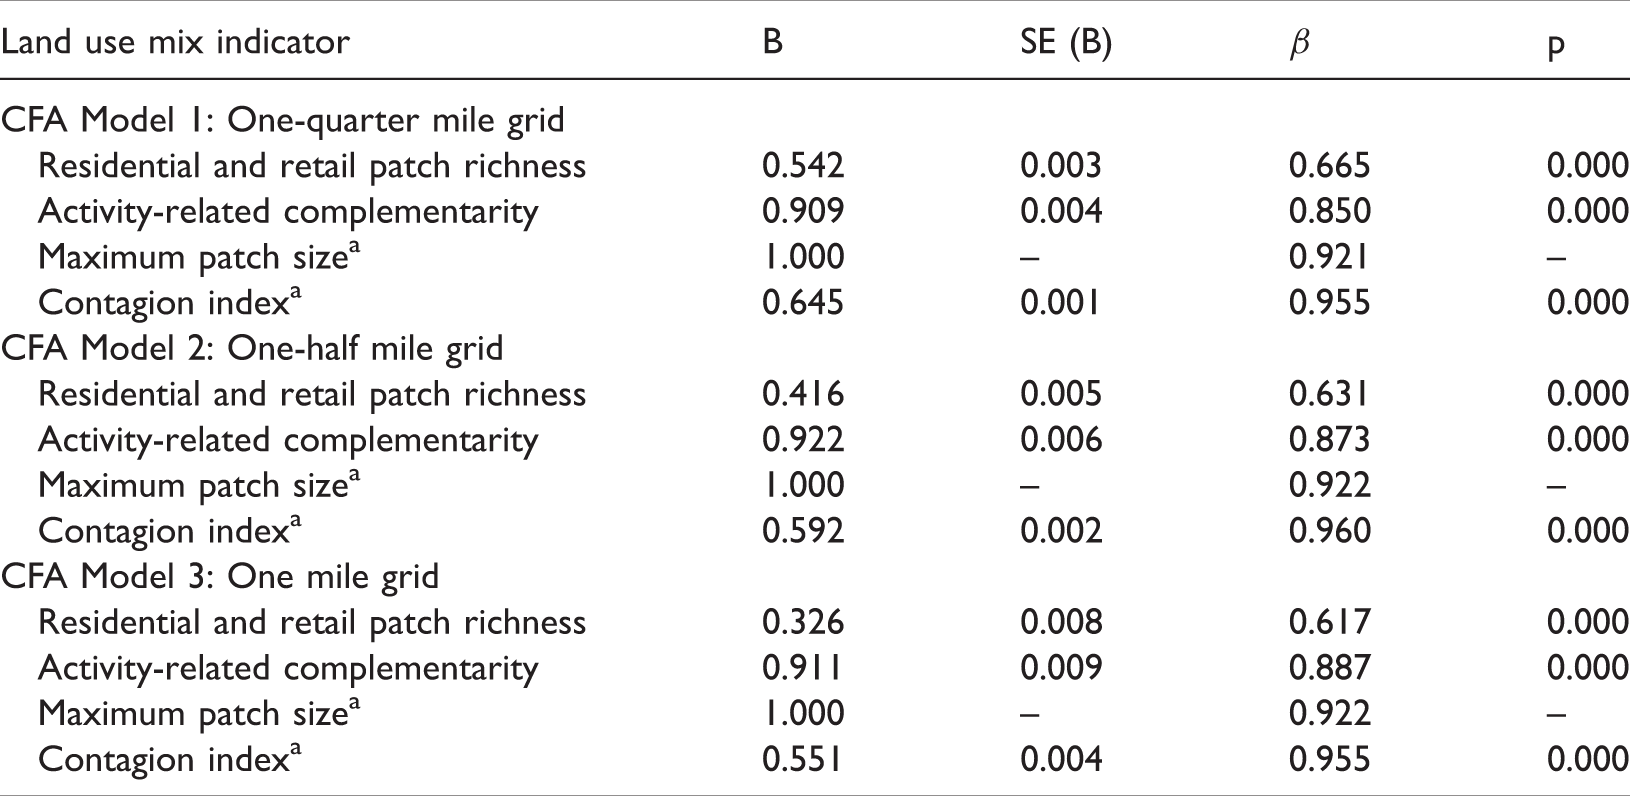
Note: Dashes (–) indicate standard error was not estimated.
Model 1: χ2 (2) = 139.621, p = 0.000. CFI = 0.999, TLI = 0.996, RMSEA = 0.021, and n = 163,280.
Model 2: χ2 (2) = 282.127, p = 0.000. CFI = 0.993, TLI = 0.979, RMSEA = 0.059, and n = 40,820.
Model 3: χ2 (2) = 149.182, p = 0.000. CFI = 0.987, TLI = 0.960, RMSEA = 0.085, and n = 10,205.
Measure was reverse-coded.
Findings from the CFA models provided compelling evidence of convergent validity since the latent construct was indicated by four strongly correlated metrics of land use composition and configuration. Although each model chi-square was significant and the root mean square error of approximation (RMSEA) for the one-mile measurement model was above 0.06; both the comparative fit (CFI) and Tucker–Lewis indices (TLI) were above 0.95, supporting acceptable model fit to the sampled datasets. Measurement at three spatial extents had the twofold benefit of describing the variation of the spatial phenomenon and confirming that the construct was predictive of the chosen indicators. The four land use mix indicators for each common factor model had strong standardized loadings (
Bartlett factor scores representing linear combinations of the observed indicators were then predicted for landscapes at each grid size. Prediction of factor scores permitted the estimation of the mix construct in behavioral models of pedestrian travel. The mean centered scores denoted land use mixing levels across the Oregon Willamette River Valley, where positive factor scores described an above-average complexity in land use composition and configuration. These predicted scores ranged in value from −0.07 to 0.86 for landscapes measured with one-quarter mile grid cells, −0.09 to 0.90 for one-half mile landscapes, and −0.12 to 0.88 for those at one mile. Figure 2 provides a map of these predicted factor scores at the smallest grid cell extent for the three metropolitan regions within the study area. Land use mix tended to be greater in the city centers with lower mixing levels found near the urban growth boundaries.
Map of predicted scores of land use mix construct at one-quarter mile grid cells for sample of metropolitan regions in Oregon Willamette River Valley.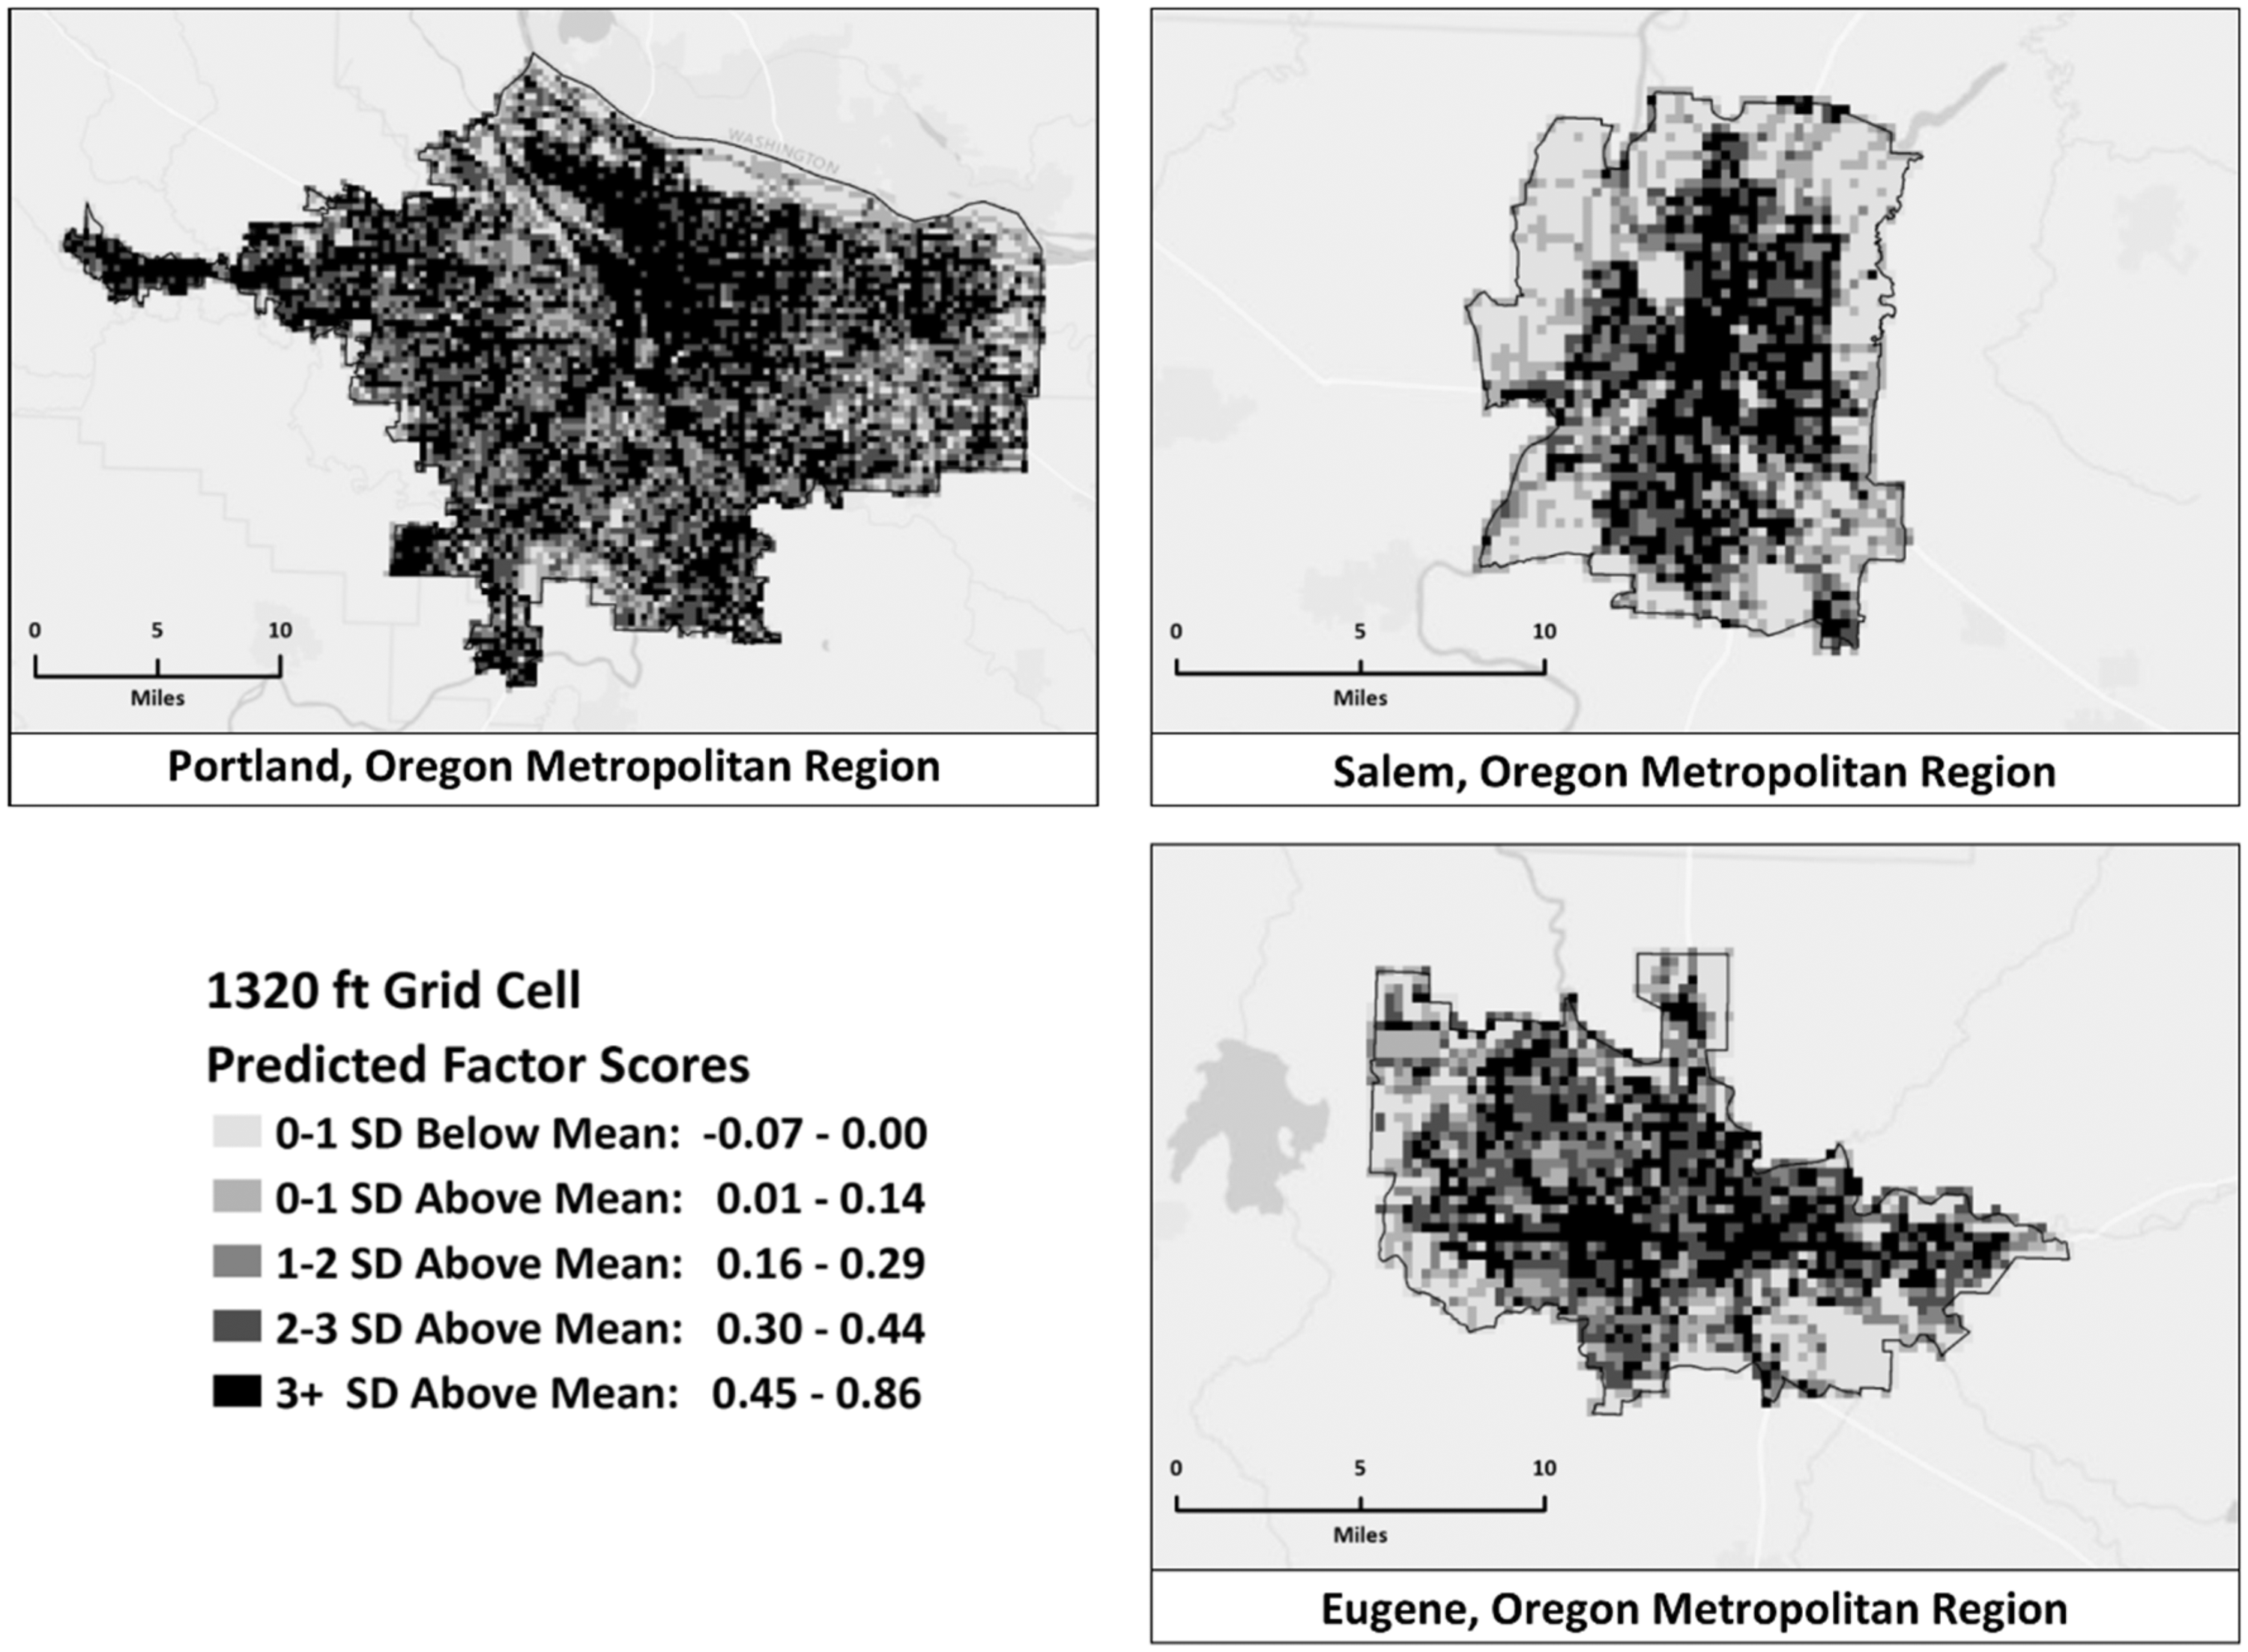
Connecting land use mix to pedestrian travel
A second study objective was to establish a direct connection between the land use mix construct and pedestrian travel. Data from the Oregon Household Activity Survey, a statewide household survey noting weekday travel and activity patterns of 46,414 individuals from 19,932 randomly sampled households between 2009 and 2012, were analyzed. All participants completed a one-day travel diary providing information about their activity locations, trip purposes, trip distances, and modal decisions as well as self-reported sociodemographic and economic information about themselves and household members. A subsample of 14,264 adults from 8,725 households residing in the study area was used to estimate the impact of the latent land use mix construct on walk mode choice and home-based walk trip frequency.
Walk mode choice
Binary logistic model estimation results of trip-level walk mode choice (n = 29,198).
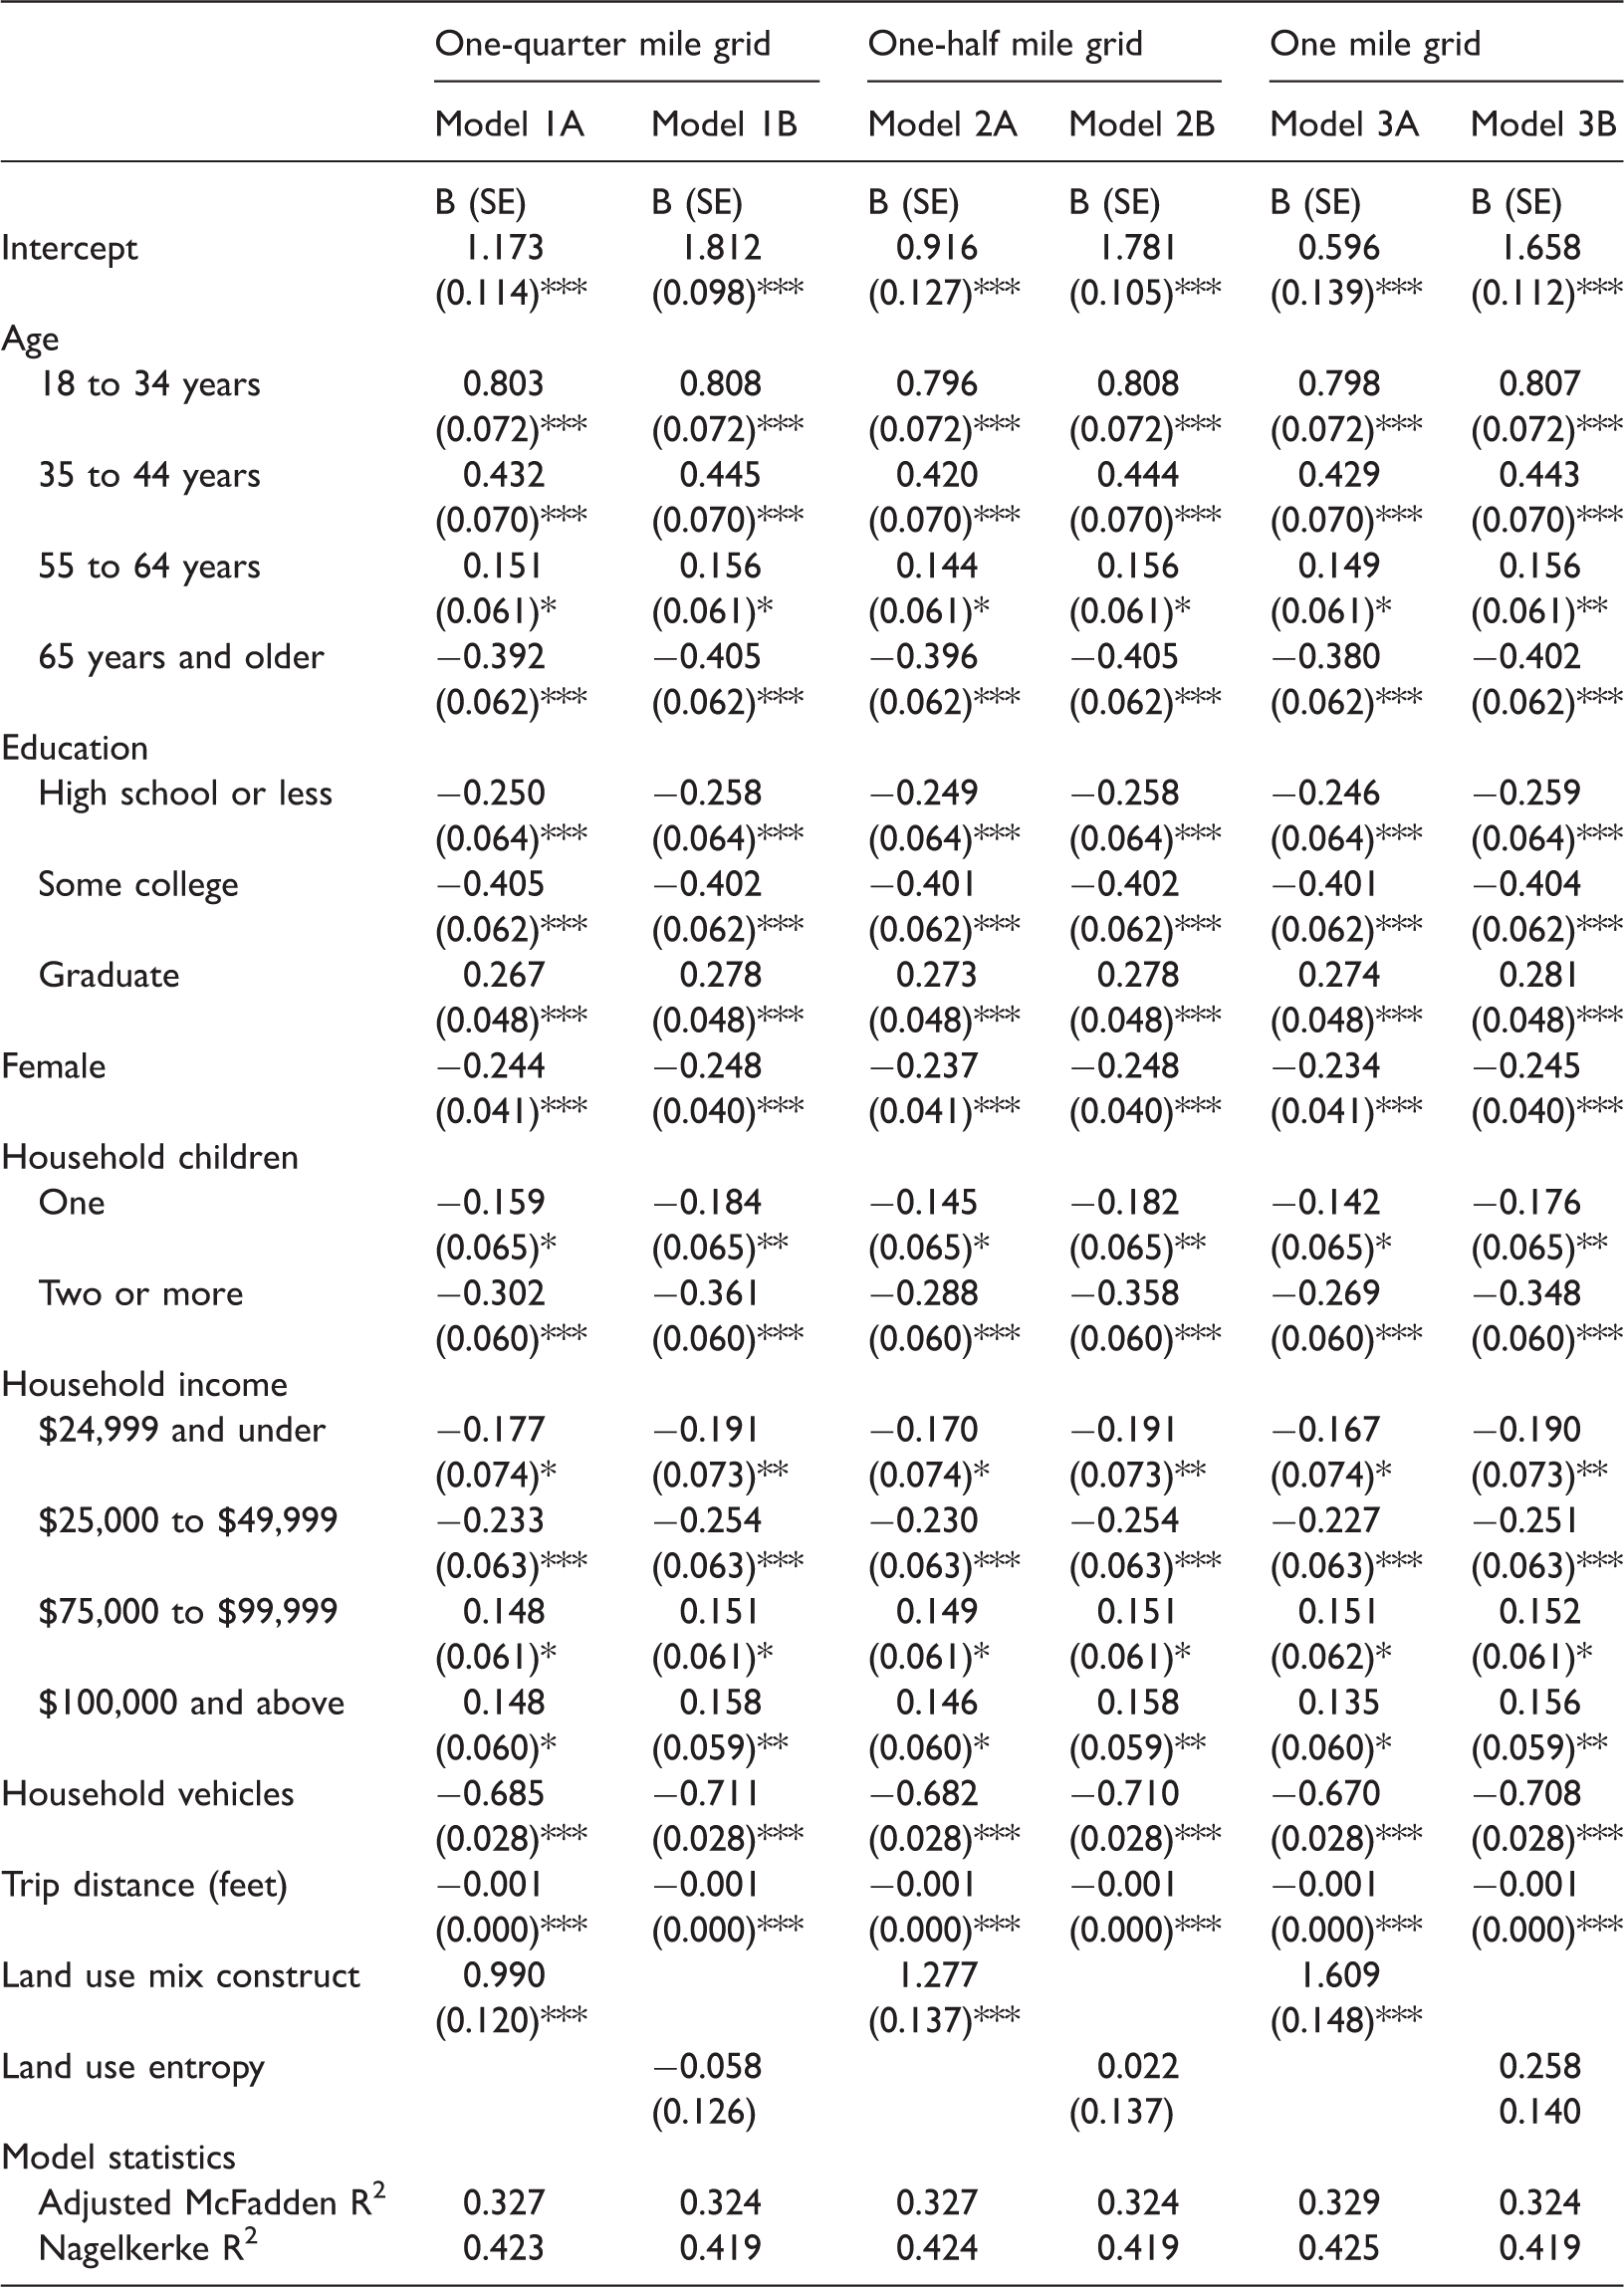
p < 0.05; **p < 0.01; ***p < 0.001.
In all, the land use mix construct had a significant and positive association with the decision to walk for all travel when measured at a one-quarter (Model 1A), one-half (Model 2A), and one mile (Model 3A) grid cell incorporating the trip origin. The overall fit of these models was similar, with the likelihood ratio test of the one-mile grid model (χ2(1) = 125.79, p < 0.001) revealing the greatest improvement in goodness of fit over the reduced model. An increase in land use mix measured at this one-mile scale was positively associated with pedestrian travel, with a one standard deviation increase in the mean land use mix score translating to a fivefold increase in the odds of walking (B = 1.609, SE = 0.148, p < 0.001, odds ratio (OR) = 5.00, confidence interval (CI) = 3.75–6.69). Although the magnitude of this link declined as the scale of measurement decreased, a one standard deviation increase in land use mixing within a quarter-mile of the origin resulted in a person being over two times as likely to walk (B = 0.990, SE = 0.120, p < 0.001, OR = 2.69, CI = 2.13–3.40). Accordingly, travelers originating from a landscape with a heightened complexity in the composition and configuration of local land uses are more likely to walk than individuals traveling from a less mixed landscape.
In contrast, while past studies have concluded that an increase in the evenness of land use types has a strong positive connection to pedestrian activity (see Brownson et al., 2009), our findings show otherwise. The addition of a land use entropy measure, operationalized at any of three scales incorporating the trip origin, to the reduced specification produced no significant contribution to the modeled decision to walk. In fact, land use diversity measured at the most localized neighborhood scale (Model 1B) had a counterintuitive, but nonsignificant, association with the likelihood to walk. Increasing the geographic extent corrected this theoretical mismatch; however, an increased land use entropy at a one-mile landscape (Model 3B) had only a marginally significant relationship with an individual’s likelihood to walk (B = 0.258, SE = 0.140, p = 0.066). In general, travelers originating from a landscape characterized by an equal balance of nearby land uses were no more likely to walk than those travelers departing from a spatially unbalanced landscape.
Walk trip frequency
Negative binomial model estimation results of individual-level home-based trip counts (n = 13,386).
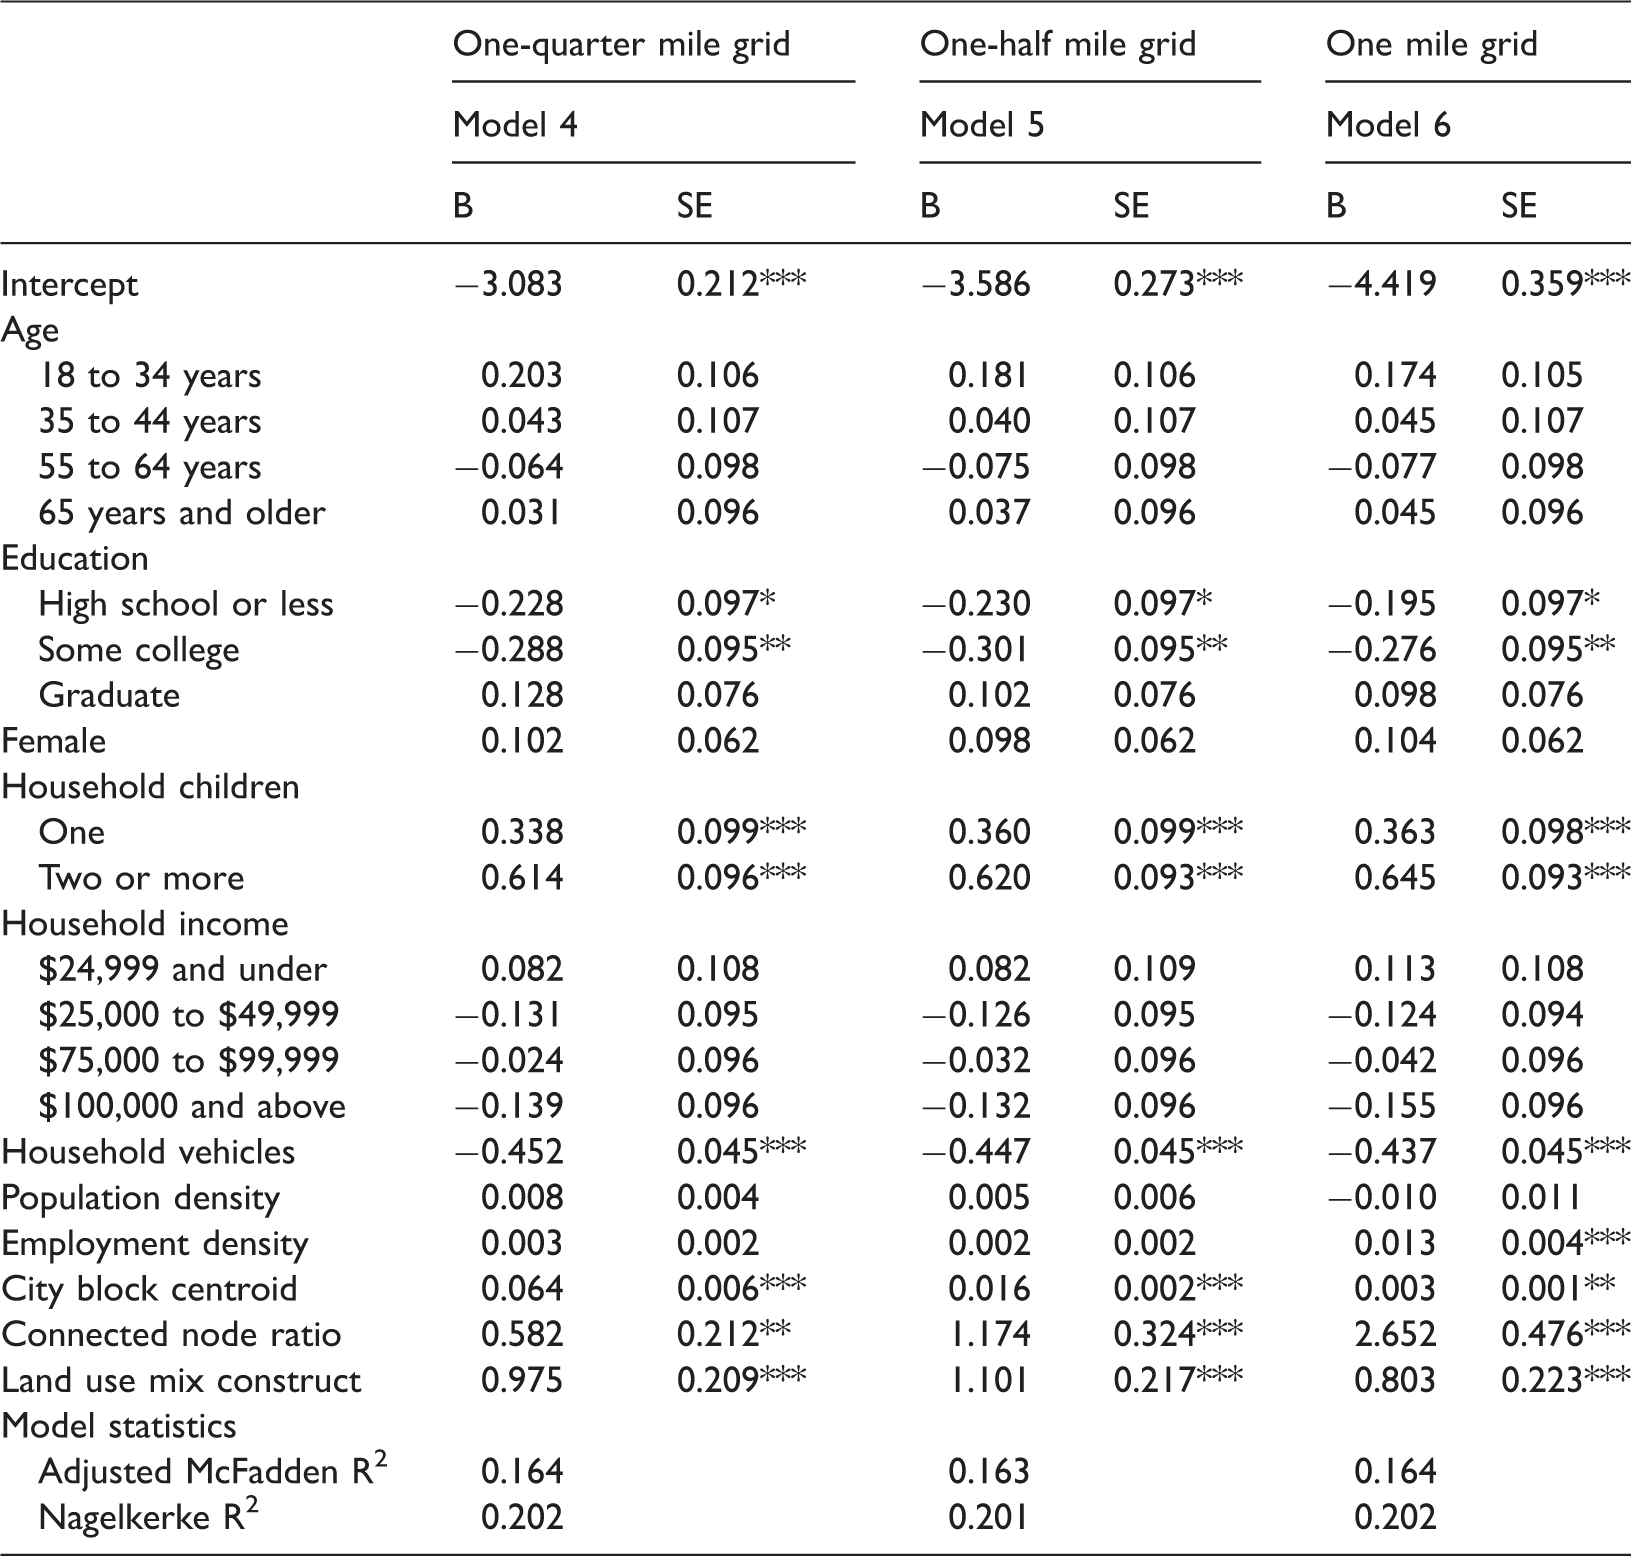
p < 0.05; **p < 0.01; ***p < 0.001.
In general, individuals residing in neighborhoods with a complex land use pattern and traditional street design conducted more home-based daily walk trips than their counterparts. In terms of street design, an increase in the ratio of three- and four-way intersections to all nodes as well as the number of city blocks in a grid cell significantly predicted greater walk trip frequency. Similarly, increased land use mixing had a strong impact on the number of home-based trips. This connection was strongest when the mix construct was operationalized at a one-half mile grid cell (Model 5), where a one standard deviation increase in the land use mix near a residence contributed to over one additional home-based walk trip (B = 1.101, SE = 0.217, p < 0.001). Surprisingly, increased population density was not significantly predictive of more walk trips; while increased employment density only predicted increased walk frequency when measured at a one-mile grid (Model 6).
Limitations
Future extensions of this study should address its limitations. A full structural equation framework would allow retention of the latent construct in the measurement model and offer a more complete behavioral depiction of the transportation-land use connection. Adoption of a CFA measurement strategy aided the creation of a multifaceted land use mix construct with composition and configuration indicators; however, the value of a single measure of each pattern aspect warrants further investigation. The specification of separate configuration and composition measures, while likely to be interrelated, may produce different statistical associations with the tested behaviors since one aspect may be a stronger determinant of walking than the other. Also, while the ARC composition measure is a novel way to provide theoretical support for quantifying land use balance, other possibilities for relating functional complementarity to travel behavior remain.
Moreover, the inherent relationship between spatial scale choice and built environment measurement merits closer attention. In this study, each indicator was operationalized at three grid cell sizes to offer insight into the sensitivity of scale choice on land use mix measurement. CFA results support construct stability across multiple spatial scales; yet, further work is needed to examine the impact of capturing land use mix with areal or network buffers. Finally, the validity of our measure should be studied in other contexts to identify its transferability to settings with weaker growth management policies.
Conclusions
Planning research has long pointed to the transportation benefits of land use mixing; however, this link has been commonly analyzed using insufficient measures. This study introduces a land use mix measurement of the composition and configuration of local land use types and demonstrates the construct’s link to pedestrian travel. Planning literature has portrayed land use mix as an environmental phenomenon describing the access to diverse activity locations, intensity of these opportunities, and spatial integration of those land use types affiliated with these activities. Accordingly, our findings suggest that complexity in this spatial construct is best expressed as a set of indicators portraying these multiple aspects.
Study contributions are both conceptual and methodological. Presenting a mix indicator based on the activity-related complementarity of land use types may help redirect how we measure ideal compositional balance. By evaluating the area-based balance of all land use types, entropy indices offer limited guidance for directing smart growth policies. Our application of a land use mix indicator based on the observed compatibility of activity-related travel may better direct policies intended to produce greater transportation efficiencies by closely locating synergistic land uses. The introduced construct also reflects the spatial heterogeneity of land use types by accounting for the overall maximum patch size and intermixing of dissimilar landscape patches. By not explicitly measuring configuration, commonly adopted pattern measures (e.g. entropy index) are insensitive to any spatial integration. Attention to configuration, while nascent, may provide planners further understanding into the development patterns that best achieve land use efficiencies. Our use of a CFA modeling framework enabled the construction of an activity-related mix measure that accounts for both composition and configuration.
If adopted by planning researchers and practitioners, a refined measure of land use mix incorporating these unique theoretical components of landscape pattern may also reveal richer insight into the influence of local land use mixing on pedestrian trip-making. In this study, the proposed latent construct had a stronger association with walk mode choice than the atheoretical entropy index. Additionally, our construct was significantly linked to the frequency of home-based walk trips when tested in a behavioral model controlling for other features of the traveler’s home built environment. Of particular interest, population and employment density had no significant impact at the more localized scales when controlling for the mix construct as a co-determinant of walking. Such findings may shift future land development discussions away from contentious debates on neighborhood densification and toward a dialogue of how development may be spatially configured to promote local accessibility and physical activity. Overall, the authors believe this work provides valuable insight into the measurement of land use mix as a multifaceted construct with clear positive connections to pedestrian travel.
Footnotes
Acknowledgements
The authors would like to thank the editor and anonymous referees for their reviews and valuable comments, which significantly improved the paper.
Declaration of conflicting interests
The author(s) declared no potential conflicts of interest with respect to the research, authorship, and/or publication of this article.
Funding
The author(s) disclosed receipt of the following financial support for the research, authorship, and/or publication of this article: This research was funded by a Doctoral Dissertation Research Fellowship from the National Institute for Transportation and Communities.