



Abstract
In this study, we examine how different features of the built environment—density, diversity of land uses, and design—have consequences for personal networks. We also consider whether different features of the built environment have consequences for the spatial location of persons to whom one is tied by considering their distribution in local area, broader city region, and a more macro spatial scale. We test these ideas with a large sample of the Western United States for three different types of ties. Our findings suggest that the built environment is crucial for personal network structure, both in the number of social ties and where they are located.
Classic studies from the urban sociology literature posit that the spatial distribution of persons to whom local residents have social ties may depend on the spatial distribution of the population and the content of the ties (Fischer, 1975; Hunter, 1985; Wirth, 1938). Different features of the built environment therefore may result in residents having alters at varying spatial scales with some in the local neighborhood, some in the metropolitan region, or some outside the region. 1 For example, friendship alters may be constrained to a micro spatial area nearby residents’ homes, while other types of ties (e.g. kin) may have a much broader spatial pattern that is not necessarily tied to one metropolitan area. Although residents’ number of ties (i.e. “degree”) is typically the sole focus in this literature, more recently social networks researchers have called attention to space as an organizing aspect of personal relationships (Faust and Lovasi, 2012). An ongoing challenge for this literature is considering how space matters for personal network structure, and in this paper we suggest that the built environment may have consequences for personal networks and their spatial location.
In this project, we posit that different features of the built environment play a role in forming and maintaining social ties. We examine the consequences of several features of the built environment—including population density, parks, bars, restaurants, and street networks—for the number of three types of ties. We test whether different features of the built environment have consequences for the number and spatial distribution of alters within residents’ personal networks using data from a large egocentric network sample of the entire Western United States. Moreover, most research is unable to distinguish between different contents of relationships and only focuses on one type of tie (for an exception see Boessen et al., 2014). A strength of the current study is that we test our ideas using three relationships, and as noted earlier, we expect them to exhibit different spatial patterns. These relationships are: 1) socializing friendship ties, which are likely to exhibit the most spatially compact pattern, 2) core ties for discussing important matters, which we expect to be less spatially compact compared to socializing ties, and 3) kin ties, whose spatial patterning is most uncertain (see Boessen et al., 2014; Fischer, 1982; Freeman, 2001; Smith et al., 2014 for examples using these relationships). Before turning to the methods, we briefly review the literature on the built environment and social networks.
The built environment and personal social networks
In this paper, we examine how personal network structure is affected by features of the built environment. Conceptualizing the “built environment” is in ongoing challenge, and we follow prior research by focusing on the “three D’s” (Cervero and Kockelman, 1997; Ewing and Cervero, 2010): 1) population density and urban and rural settlement patterns, 2) the diversity of land uses, and 3) the physical design through street connectivity and the presence of single-family housing units.
As a first feature of the built environment, the spatial distribution of settlement patterns may affect degree, and this may occur through differences in 1) the population density surrounding ego’s home and 2) whether ego is located in an urban or rural area (i.e. the larger spatial scale around ego’s home). When considering population density, some research in the planning literature has found that it is not related to degree (Freeman, 2001), but the social networks literature has shown evidence that the spatial distribution of the population is key for network structure (Butts et al., 2012; Fischer et al., 1977). In this view, population density is fundamentally linked to the opportunity pool of potential contacts. A challenge for this literature is considering the spatial area of interest for this potential pool of contacts. For instance, population density may have distinctly different consequences depending on whether it is considered in reference to the spatial area of the neighborhood or the broader city environment of a person’s activity space, but research has yet to test this possibility.
A closely related point regarding population density is whether ego is located in an urban or rural area, and how this affects opportunities to form and maintain social ties, resulting in degree differences. These differences in broader population density settlement patterns stem from work in urban sociology arguing that urban residents are distinct from rural residents in their ability to form ties (Fischer, 1975, 1978), but the evidence for this proposition has largely been mixed. Scholars have posited that rural areas have less opportunities for tie formation because of the spatial spread of houses and the decreased frequency for chance interaction, and thus rural residents may have fewer ties (Entwisle et al., 2007; Kowald et al., 2015). In contrast, early scholars posited that urban areas are socially isolating (Wirth, 1938), resulting in fewer ties in urban areas compared to rural areas, but more recent work has argued that urban areas actually provide more opportunities for forming ties (Fischer et al., 1977). Yet another perspective is that community size is not related to personal network structure (Richardson et al., 1979). Thus, there are competing explanations for whether and how urban settlement patterns affect personal network structure.
As a second feature of the built environment, the presence of certain types of land uses may also play a role in residents’ degree. For example, parks are spaces where ties are formed and maintained through unplanned interaction, implying that residents living near them may have more ties (Lund, 2003). This idea is conceptually similar to simulation work linking the spatial pattern of personal networks and activity patterns (Arentze and Timmermans, 2008; Kowald et al., 2015). Through festivities, art exhibits, picnics, exercise/physical activities, pet walking, and other recreational events happening in parks, residents may be more likely to engage with their neighbors and obtain more ties. Prior work has also shown that parks are associated with more collective efficacy (Cohen et al., 2008), implying more social ties for residents who live near parks. On the other hand, parks may hinder tie formation given that they are “holes” in the built environment (Hipp et al., 2014; Taylor and Harrell, 1996). In other words, parks are breaks in the population density of urban areas where no one lives, and thus there will be fewer persons within a particular radius around residents’ homes, implying fewer tie opportunities and perhaps fewer social ties. Thus, there are competing perspectives on the consequences of parks for social ties. Somewhat similar to parks, bars, restaurants, and retail areas may serve as “third places” where ties are formed and maintained (Oldenburg, 1999; Svendsen, 2010). The presence of these kinds of land uses may also provide more opportunities for social events. In this case, the presence of these features would be associated with higher degree.
As a third feature of the built environment, the design of the built environment may shape personal network structure. The physical layout of the city may therefore have consequences for degree, and we focus on two key features of design: 1) street connectivity and 2) the spatial distribution of single-family housing units. First, street network connectivity may influence patterns of social ties by influencing the possibility for passive and informal contacts with others in the local area (Grannis, 2009). The extant research on social networks and street connectivity has focused on urban areas, and in this study we extend these ideas to rural areas, where the street connectivity structure is likely much more sparse. Although we would expect street connectivity to have few consequences for social ties in rural areas, no research has tested this possibility. Second, the presence of single family housing units may increase degree. This may occur because residents in such areas are more likely to feel an attachment to the area and get to know fellow residents by walking in the area. One study examining land uses and crime found that residential units are protective against neighborhood crime when compared to other land uses (Boessen and Hipp, 2015); this may be because their presence is associated with more social ties. In this paper, we test this idea directly by examining whether a high proportion of nearby single family units are associated with personal network structure.
A final key piece of this study asks whether these various features of the built environment impact the spatial distributions of alters. For example, a person’s relationships in their neighborhood may not necessarily represent their broader web of relationships in the city or even more extensive spatial scales. Whereas research often does not examine the spatial location of alters and implicitly assumes that they are all equally useful and spatially accessible, scholars have increasingly suggested that distance to people matters for forming ties (i.e. a propinquity effect) (Festinger et al., 1950; Hipp and Perrin, 2009; Kowald et al., 2015; Verdery et al., 2012). Although most studies simply test a linear or log linear effect by focusing on “average distance”, we unpack the “average distance” to alters effect by examining the number of ties at: 1) the micro neighborhood scale, 2) a meso city scale, and 3) a broader macro scale. This idea stems from work in urban sociology noting that residents have ties to their local neighborhood and the broader city (Hunter, 1985). Classic work in developmental psychology and human ecology on the differing scales of a person’s environment implies that exploring the spatial scales of personal networks may be important (Bronfenbrenner, 1977). Similarly, many planning problems involve coordination among different levels of analysis (i.e. the local area and the city) (Dempwolf and Lyles, 2011). An implication of this idea is that the spatial scale for various types of relationships may differ. Moreover, the three features of the built environment noted earlier (i.e. density, diversity of land uses, and design) are unevenly spread across the spatial landscape, and there likely exists differences in the activity patterns of people attracted to and affected by various built environment features (Arentze and Timmermans, 2008). Taken together, these considerations suggest differences in the structure of personal networks at different spatial scales. In this paper, we explicitly test this idea by examining different features of the built environment and their consequences for the structure of personal networks at varying spatial scales.
Data and methods
We utilize several data sources to address our research questions. First, the primary data come from the American Social Fabric Project (ASFP), a large-scale egocentric network study (N = 3637). The ASFP is a population sample of Los Angeles, a population sample of two communities in Southern California, a spatially stratified sample of the Southern California region, and another spatially stratified sample of the Western United States conducted in 2012. Comparisons of the demographic composition of the sample with Census data of these locations show good overall agreement (for more extensive details on data collection see Butts et al., 2014; Smith et al., 2014). 2 Second, we capture land uses with the ReferenceUSA data from Infogroup. Third, we measure parks with data from the Environmental Systems Research Institute’s (ESRI) 2010 StreetMap data. Fourth, we use 2010 road data from the Census Tigerline shapefiles to capture street connectivity. Finally, we also incorporate data from the American Community Survey (ACS) 5-year estimates from 2007 to 2011.
Dependent variables
Summary statistics.

Independent variables
We created several measures of the built environment utilized in the planning and geography literatures (Brownson et al., 2009; Ewing and Cervero, 2010; Handy et al., 2002). First, given that the opportunity for forming ties is impacted in part by the uneven spread of the population settlement pattern (Butts et al., 2012), we include a measure of population density of the census block group. Second, we include a population measure within the 20 miles surrounding ego to capture the residential population of a person’s meso environment (Hipp and Roussell, 2013). Third, with information from the Census, we measured the percent of the block group housing that is single family units to assess if this urban form impacts degree. Fourth, we capture the street connectivity by including a measure of intersection density (Dill, 2004), which is the number of intersections in a census tract divided by the area. Finally, we capture several different types of land uses by creating buffers around ego’s home with an inverse distance decay function within a ¼ mile, ½ mile, and ¾ of a mile. Using establishment-level data from Reference USA, we computed the number of 1) total employees, 2) retail employees, 3) restaurant employees, and 4) bar employees within the buffer around ego’s home. With data from ESRI, we computed the total land area in the buffer that is park space.
We include several control variables for individuals from the ASFS data, including age, sex, whether ego was black, Asian, Latino, white, or other race/ethnicity, whether ego was married, whether ego has children, education level, 3 household income, 4 and residential tenure in the neighborhood (in years). We also include several neighborhood measures from the Census using the block group of ego’s home: average income, ethnic/racial heterogeneity (Herfindahl Index), % black, % Latino, % other race/ethnicity, and average length of residential tenure.
Methods
Our analytical strategy uses negative binomial regression models with standard errors adjusted for the very moderate nesting of respondents in block groups. To assess differences between urban and rural areas, we split the sample based on whether a respondent had more than 50,000 people within 20 miles. We used a population cutoff of 50,000 within 20 miles because the United States Census defines this as the minimum city population size for the central city of a metropolitan area, and as the total maximum population for a micropolitan area. 5
Results
Socializing ties
Predicting number of socializing alters within 0–5, 5–50, and more than 50 miles. Splitting sample based on urban and rural locations.
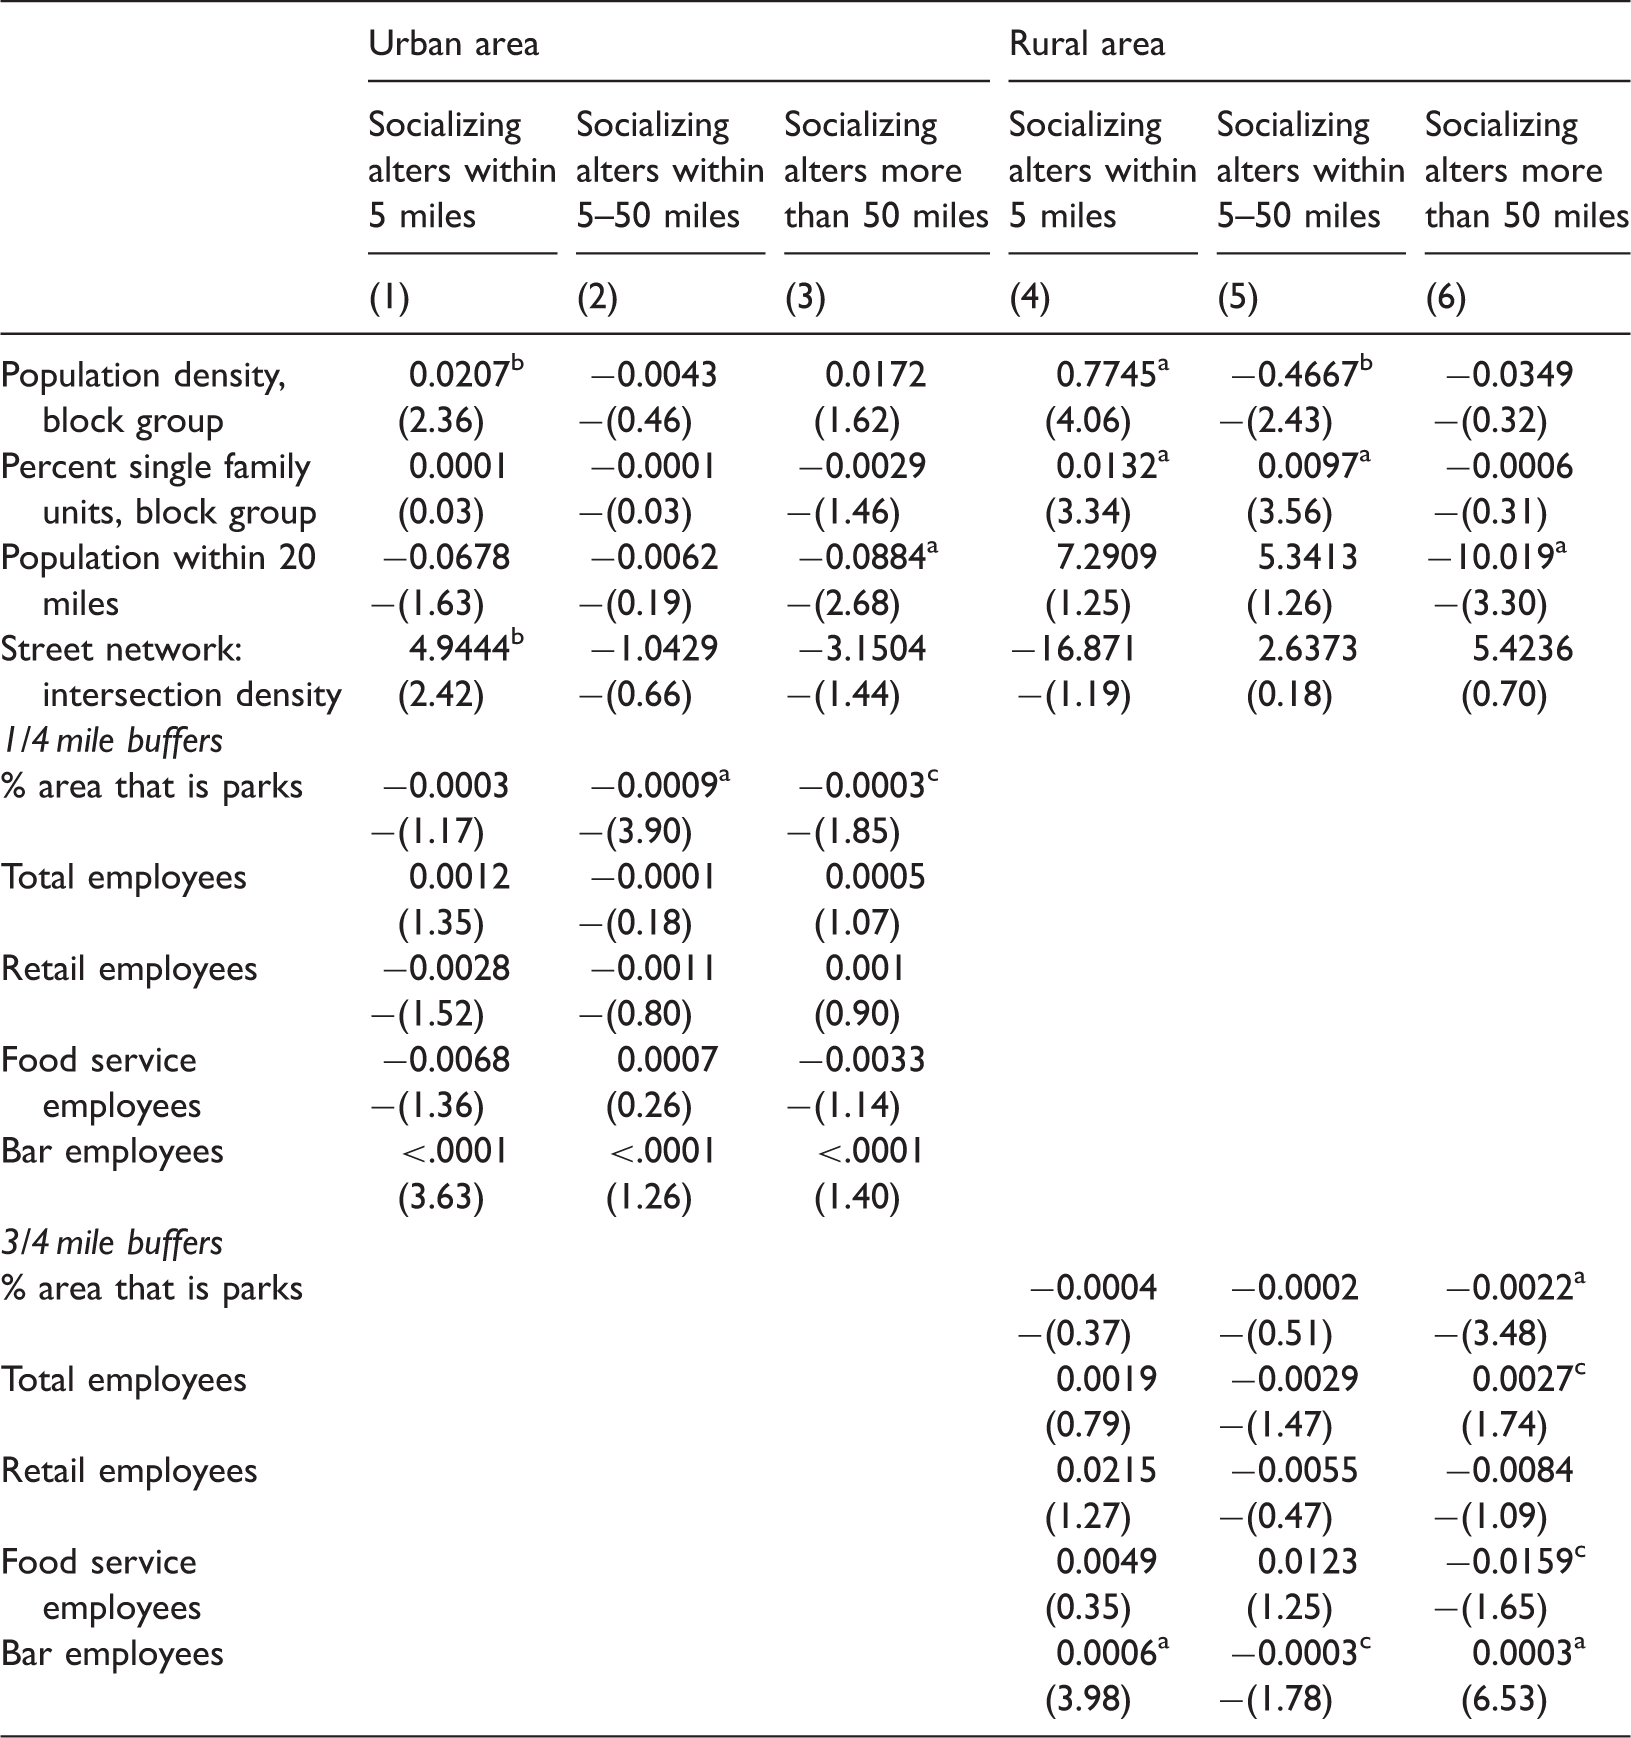
T-values in parentheses. N = 1417 persons in urban areas, and 2220 persons in rural areas.
Note: Unstandardized coefficients with T-statistics underneath in parentheses. Control variables omitted from the table to save space.
p < .01(two-tail test), bp < .05 (two-tail test), cp < .05 (one-tail test).
Our two measures of the physical design of the local environment—the street network and the type of housing stock—exhibit different effects in urban versus rural environments. The street network density is only significant for socializing alters in urban environments. As hypothesized, a greater intersection density in the local street network is associated with 21% more nearby socializing alters in an urban environment. This is consistent with the idea that such locations are pedestrian friendly, and therefore foster more local socializing ties. As expected, street network density is not related to the number of mid-range or long-distance socializing alters. And it is not related to the number of socializing ties in a rural environment, which is expected given that this measure has more meaning in an urban environment. On the other hand, the percentage of single family units is not associated with the number of socializing alters in an urban environment, but is important in a rural environment. Residents living in a rural block group with a higher percentage of single family units report 26% more nearby and 18% more mid-range socializing alters.
Turning to the effect of different land uses in the built environment, one observation is that the spatial scale at which these operate is much smaller in an urban environment than in a rural environment. This is not necessarily surprising, as we find that the optimal model fit occurs when we aggregate these measures to a ¼ mile inverse distance decay buffer in an urban environment, but to a ¾ mile inverse distance decay buffer in a rural environment. 6 In both environments, there is no evidence that the presence of more park space nearby is associated with more socializing ties. In fact, urban residents with more nearby park space report 13% fewer mid-range socializing alters and somewhat fewer long-distance socializing alters. Rural residents with more nearby park space also report 13% fewer long-distance socializing alters. This all suggests that when parks are nearby, the park may serve to focus social activities nearby the home. In this case, this may reduce the time and energy otherwise available to cultivate or form more distant relationships.
Regarding nearby businesses, we find no evidence that more retail opportunities, food opportunities, or even total employment opportunities impact the number of socializing ties for residents in urban or rural environments. However, the presence of nearby bars has a significant effect. In an urban environment, a person with more nearby bar opportunities reports more nearby socializing alters. Rural residents with more nearby bar opportunities in the ¾ mile surrounding area report more nearby socializing alters and somewhat fewer mid-range alters; somewhat surprisingly, they also report more long-distance socializing alters.
Core ties
Predicting number of core alters within 0–5, 5–50, and more than 50 miles. Splitting sample based on urban and rural locations.
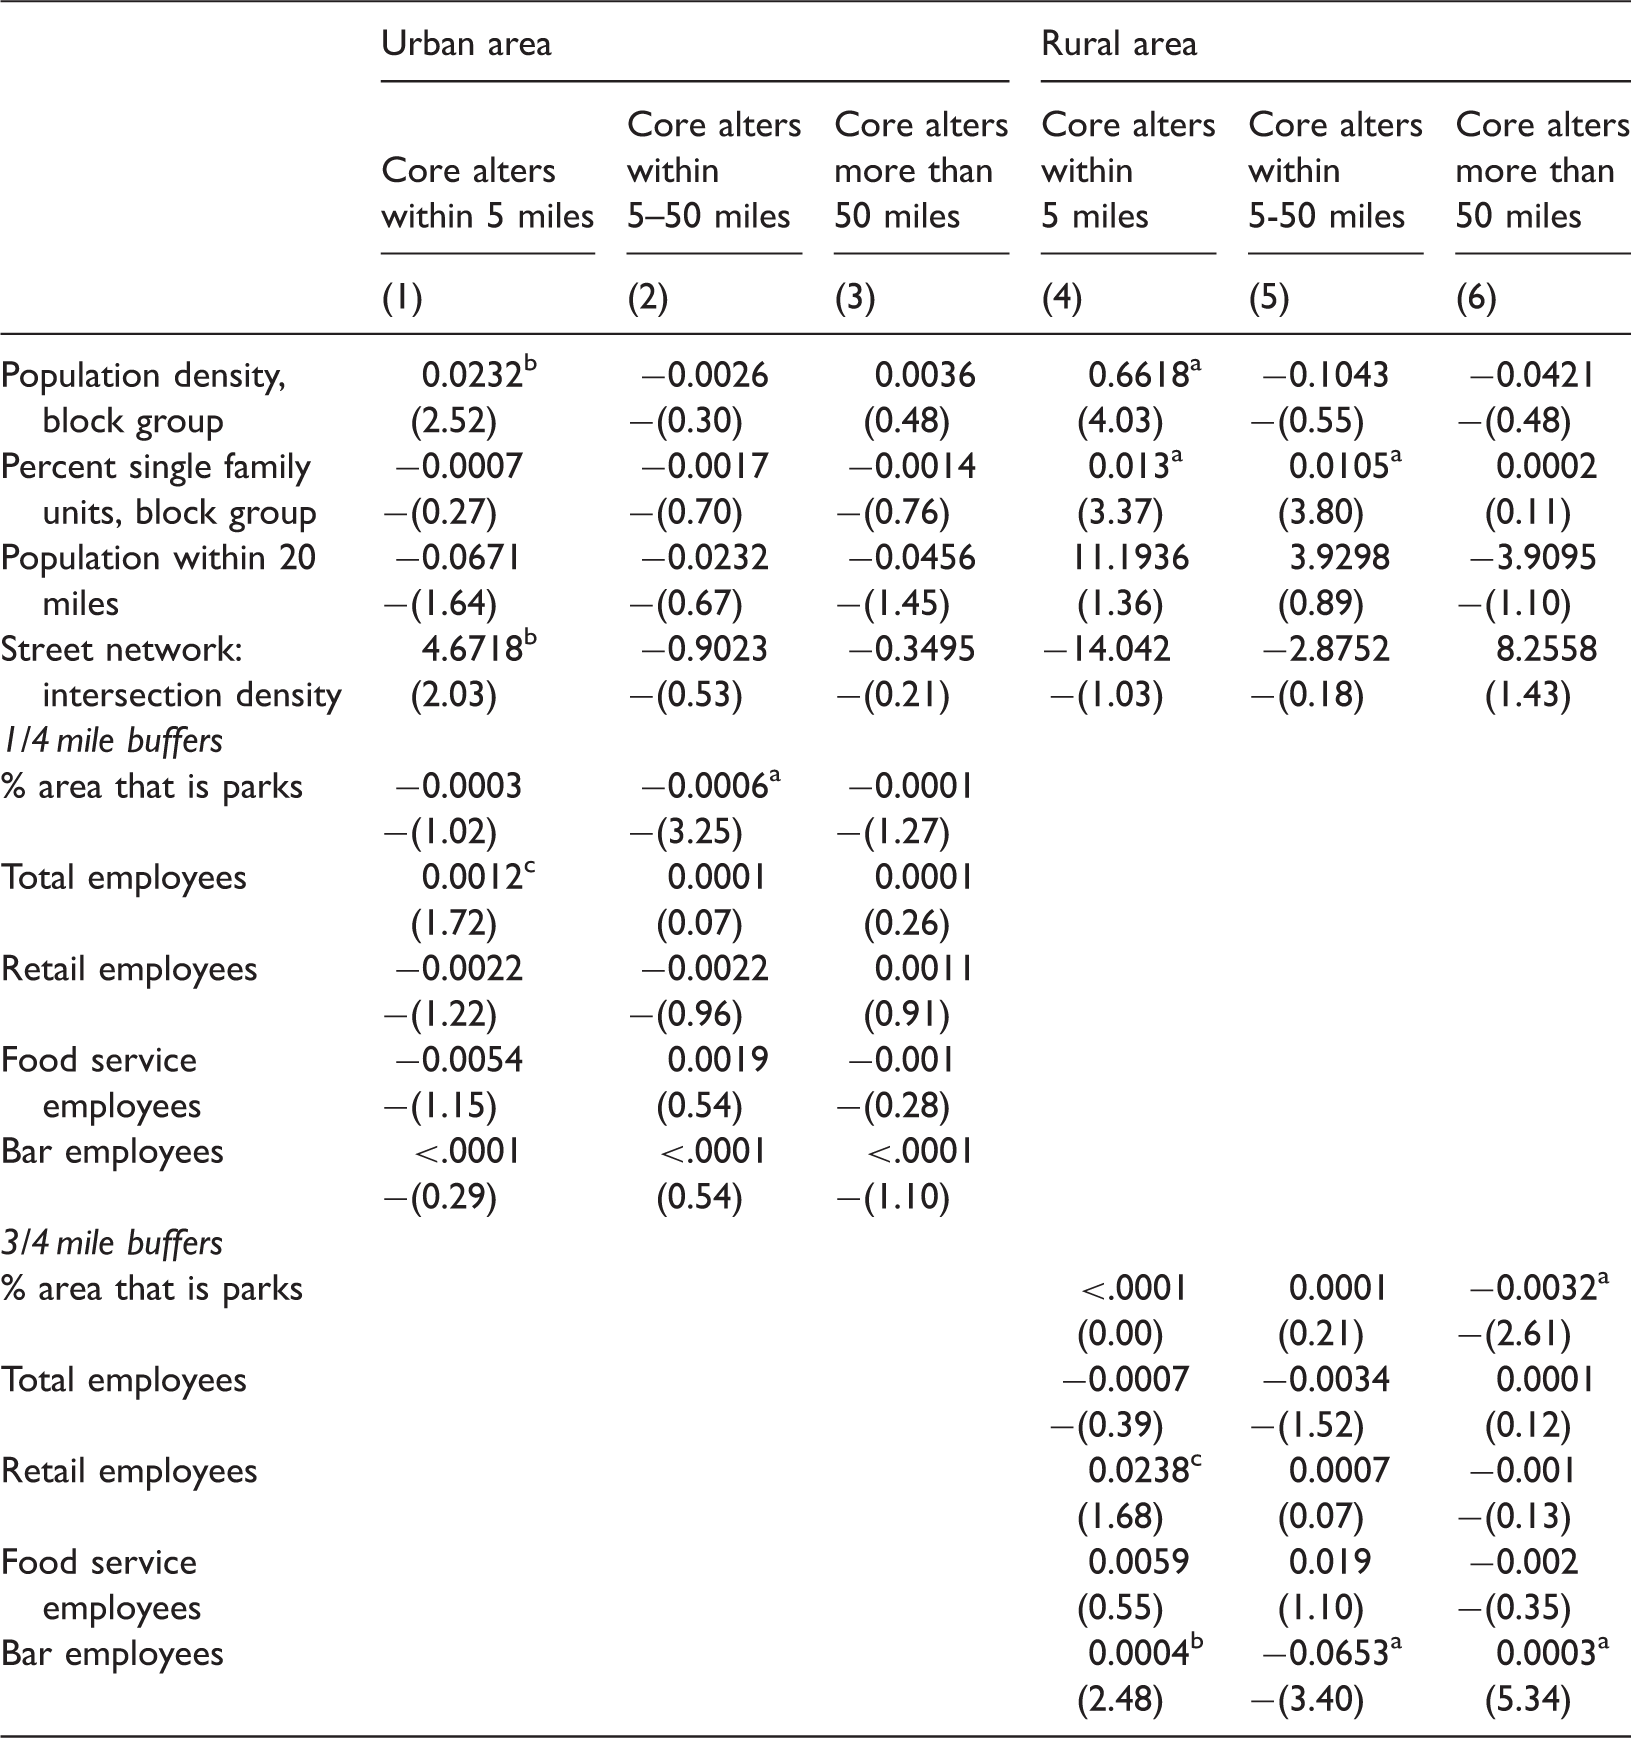
T-values in parentheses. N = 1417 persons in urban areas, and 2220 persons in rural areas.
Note: Unstandardized coefficients with T-statistics underneath in parentheses. Control variables omitted from the table to save space.
p < .01(two-tail test), bp < .05 (two-tail test), cp < .05 (one-tail test).
Regarding land use, we find that nearby parks are associated with 9% fewer mid-range core alters in urban areas, similar to the relationship for socializing ties. And the presence of nearby parks for rural residents is associated with 18% fewer long-distance core alters. Whereas the presence of more nearby bars showed a positive relationship with the number of local socializing alters for urban residents, no such relationship exists for core ties. On the other hand, the presence of nearby bars is particularly important for the number of core ties for rural residents: residents in areas with more bars nearby report more local and long-distance core alters, but report fewer mid-range core alters.
Kin ties
Predicting number of kin alters within 0–5, 5–50, and more than 50 miles. Splitting sample based on urban and rural locations.
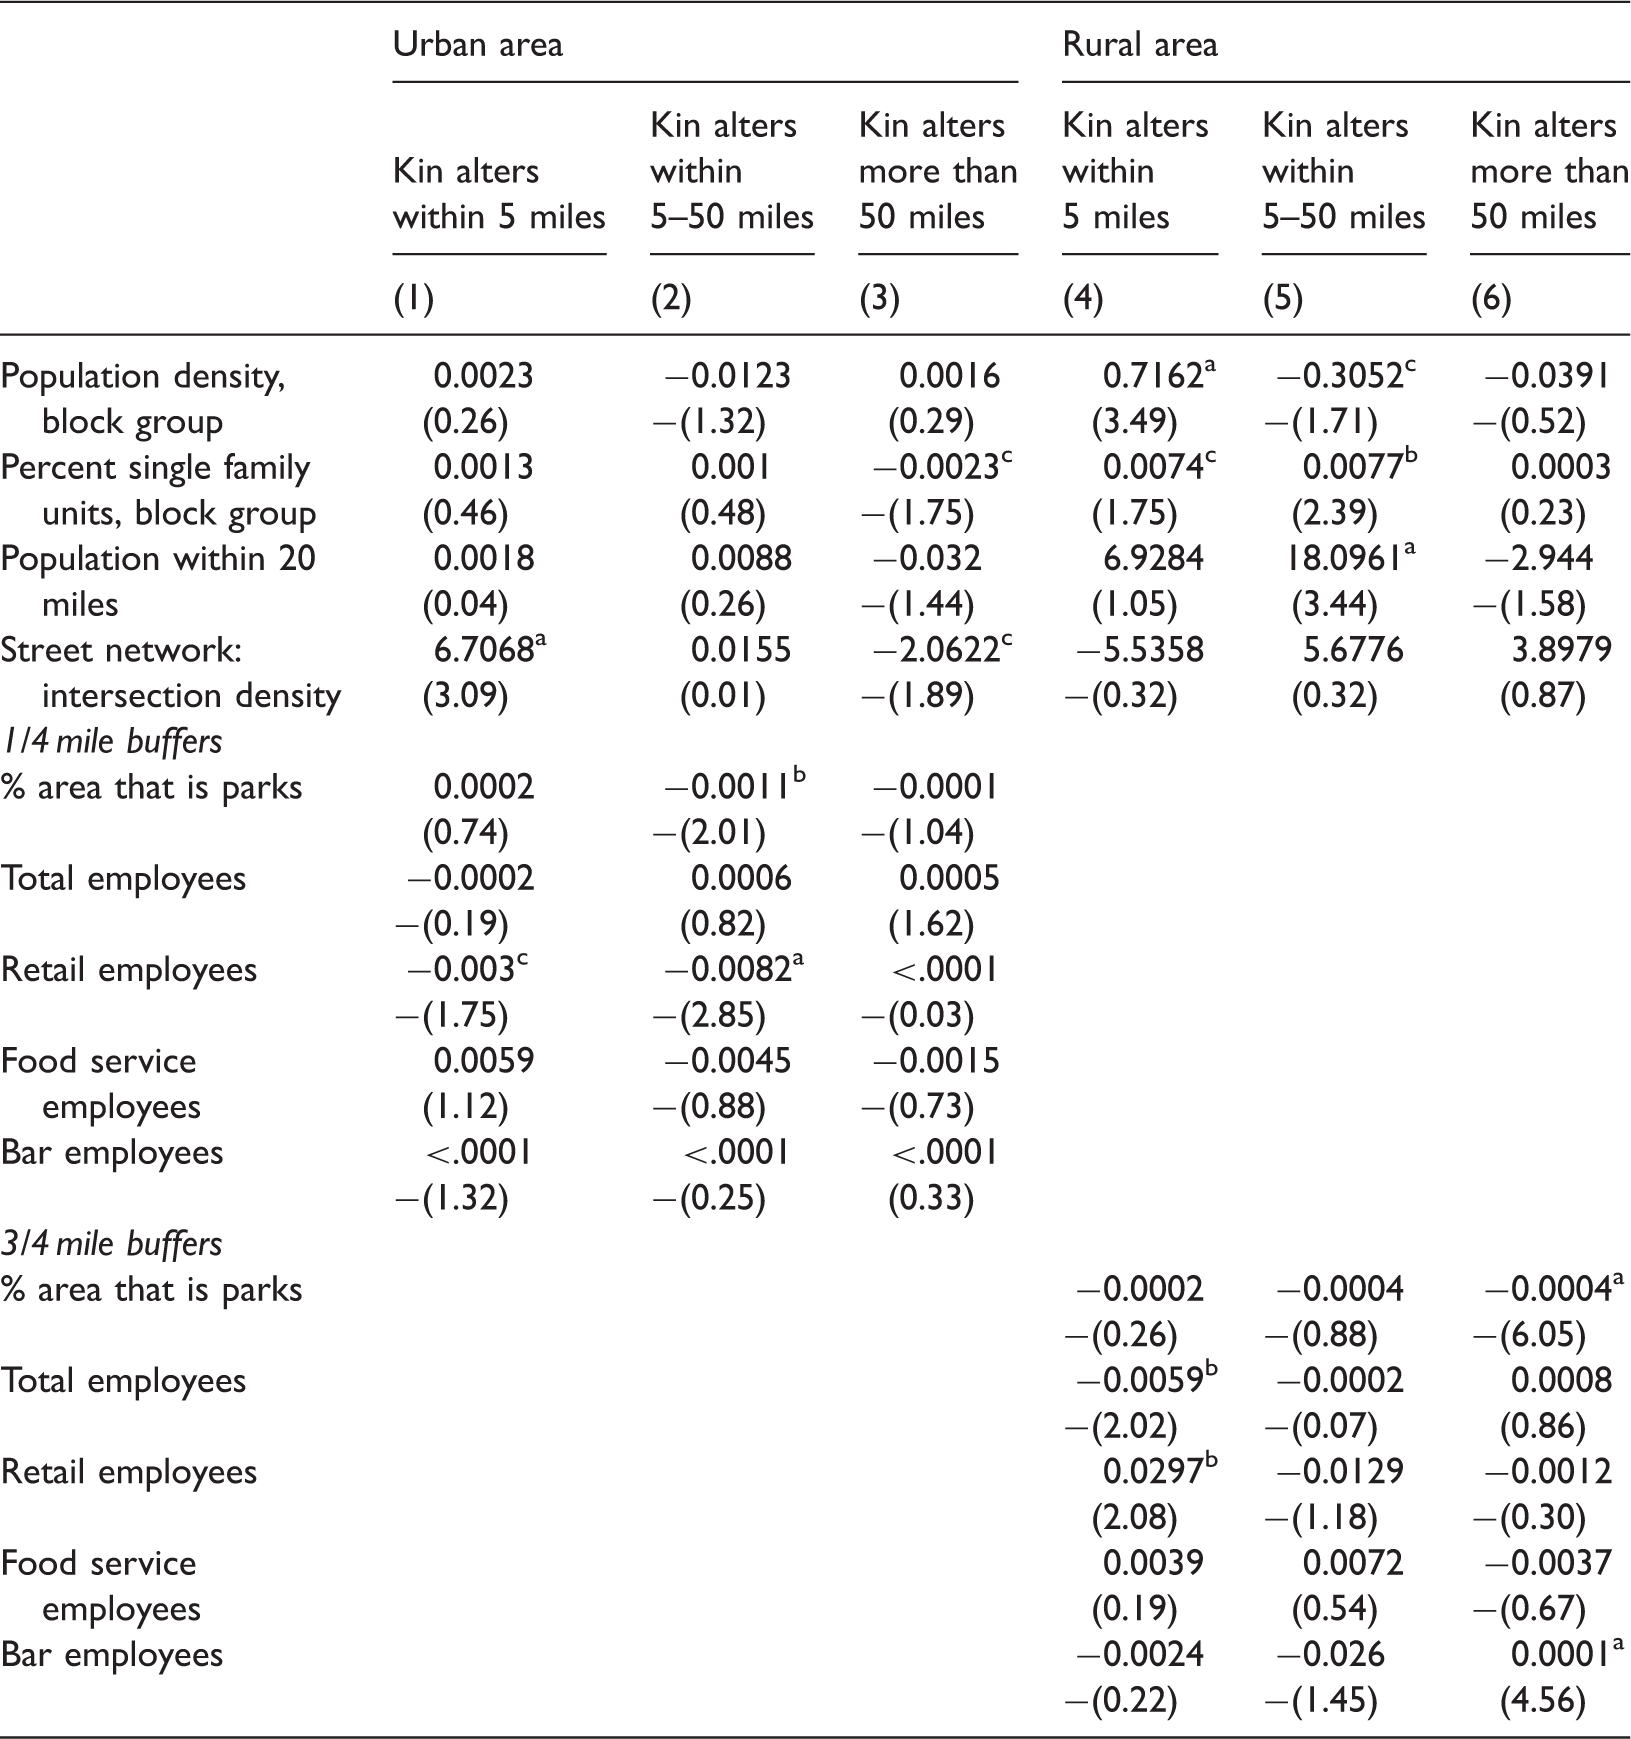
T-values in parentheses. N = 1417 persons in urban areas, and 2220 persons in rural areas.
Note: Unstandardized coefficients with T-statistics underneath in parentheses. Control variables omitted from the table to save space.
p < .01(two-tail test), bp < .05 (two-tail test), cp < .05 (one-tail test).
The relationship of nearby land use with kin ties differs somewhat from the other tie types. On the one hand, the presence of nearby parks has similar consequences, as urban residents with more nearby parks report 16% fewer mid-range kin alters and rural residents with more nearby parks report fewer long-distance kin alters. On the other hand, urban residents in areas with more nearby retail opportunities report 12% and 29% fewer local and mid-range kin alters, respectively. And whereas more nearby bars were associated with more local socializing alters for urban residents, no such relationship exists for kin alters. For rural residents, whereas the presence of more nearby jobs of all types is associated with 14% fewer local kin alters, more nearby retail opportunities are associated with 9% more local kin alters. Furthermore, the impact of bars in rural environments is much weaker for kin compared to the other two types of ties, as there is no relationship with local or mid-range kin alters.
Discussion
Using data from a large egocentric network sample of the Western United States, we found evidence that the built environment has consequences for the spatial distribution of personal social networks for three types of relationships: socializing friendship ties, core discussion ties, and kin ties. We assessed these relationships at three differing spatial scales: in the nearby micro neighborhood (less than 5 miles), a mid-range meso scale (5–50 miles), and a long-range macro scale (more than 50 miles). Our results show that different features of the built environment have consequences for the number of social ties and the spatial scale of those ties.
A key finding from our study is that population density has consequences for degree at different spatial scales. Prior work utilizing simulations along with the underlying census demography predicted such a relationship (Butts et al., 2012), and indeed we detected here that more population density in ego’s neighborhood was associated with more local alters (within 5 miles) for nearly all of the different relationships and different spatial locations. There was also evidence of a distance decay effect as greater neighborhood population density was associated with fewer mid-range ties, and a larger population within 20 miles was associated with fewer long-range socializing ties. This latter result implies that a larger population in the general region reduces the likelihood of maintaining long-distance ties. The opportunity to form ties appears dependent in part on the pool of potential contacts within the local area and this association differs as the pool extends to a broader spatial area. When living in a dense environment, residents may be more likely to restrict the geographic footprint of their ties to their local neighborhood.
We saw a similar pattern to population density when considering the role of parks for personal network structure. For the three tie contents, parks were associated with fewer meso alters in urban areas and fewer macro alters in rural areas, and there was no evidence of a local boost in urban or rural areas. While some research suggests that nearby parks decrease local neighboring (Hipp et al., 2014), we find a different association: parks in the neighborhood are associated with fewer meso and macro scale ties. Residents may be spending more time in the local area when a park is present, and therefore spending less time with their more spatially distant contacts. The presence of the park is associated with a cost of a more spatially diminished personal network.
Another pattern that likely stems in part from population density was the urban/rural distinction for certain features of the built environment, particularly features associated with “design”. Street network connectivity was only associated with more alters in urban areas and within the local 5 mile area. Yet, single family housing units were only associated with more alters in rural areas at the local and meso level. These findings have implications for planning because they remind us that some principals from urban planning may not operate universally the same way in urban and rural environments. For example, the growing interest in mixed use areas as suggested by Jacobs (1961) may not apply equally well in rural areas with less foot traffic. Future research might extend these findings by examining how other features of the built environment may or may not apply well to urban or rural areas, and examine patterns in the urban fringe in suburban areas.
A final key finding is that certain land uses have consequences at different spatial scales, and this pattern appeared to depend in part on the particular content of the tie. While there was little evidence of restaurant, retail, or businesses more generally impacting degree, there was evidence that the presence of bars in the neighborhood are related to residents’ degree. Local bars were associated with more local socializing friendship ties within 5 miles for urban and rural respondents, consistent with the idea that these are spaces for strengthening ties and meeting others in the local community (Oldenburg, 1999). An unexpected finding was that for rural respondents, a local bar is associated with having more long-distance alters. This broader spatial pattern suggests a different activity pattern for residents in rural areas, and future research may want to examine heterogeneity in the different land uses and activities ongoing in the features themselves (e.g. particular kinds of bars; programs in parks; and availability of social events), and the consequences of these for tie formation and maintenance. Future research may also want to extend these findings by exploring other locations that might serve as magnets for building relationships, including schools, coffee shops, and recreational areas.
While our study has shed light on the relationship between the built environment and personal network structure, it does have some limitations. One limitation is that although the cut points for micro, meso, and macro spatial scales are informed from theory, other cut-points might also be plausible. Future research might explore this issue by estimating the spatial interaction function for tie formation (Butts, Forthcoming). A second limitation is that scholars have suggested destination accessibility and distance to transit as other crucial features of the built environment (Ewing and Cervero, 2010). While we may have implicitly accounted for these approaches with our models of personal networks at differing spatial scales and our buffers around different features of the built environment, future research will want to more explicitly capture these ideas. A final limitation is that we cannot directly capture the personality types (e.g. introvert vs. extrovert) of our respondents. While we have no reason to suspect that these differences would explain the key findings shown in the paper, future research may want to test this possibility.
Our findings suggest that the built environment, particularly density, diversity of land uses, and design, are crucial for personal network structure, both in the number of social ties and where they are located. On the one hand, certain features showed different relationships for urban versus rural residents. For example, the spatial layout of streets in the form of high street intersection density was associated with more personal network ties in urban environments, but not in rural environments. On the other hand, several features showed robust patterns for both urban and rural residents. Residents living in higher population density neighborhoods report more nearby socializing and core discussion ties, regardless if they live in an urban or rural environment, but this density does not impact the number of more spatially dispersed ties. Likewise, the presence of more bars nearby is associated with more nearby socializing ties, highlighting the role that the physical environment might play in fostering the formation of social ties.
Taken as a whole, one planning implication of our study is that more consideration is needed for the spatial scale of the built environment. An ongoing challenge in the spatial literature is defining “nearby” (often as a weighting matrix—“The W matrix”). Given that we show that different features of the built environment affect personal networks at differing scales, a key implication from our study is that the built environment can influence patterns at micro, meso, and macro spatial scales. Thus, when considering the spatial extent of the built environment, we have evidence of a broader spatial process not contained to one particular area or even simply the nearby area. This suggests a need to consider differing representations of the “spatial influence/extent” of various features of the built environment.
Footnotes
Declaration of conflicting interests
The author(s) declared no potential conflicts of interest with respect to the research, authorship, and/or publication of this article.
Funding
The author(s) disclosed receipt of the following financial support for the research, authorship, and/or publication of this article: This research is supported in part by NSF grants BCS-0827027 and IIS-1526736, and by ARO award W911NF-14-1-0552.