
Abstract
The increasing availability of urban trajectory data from the GPS-enabled devices has provided scholars with opportunities to study urban dynamics at a finer spatiotemporal scale. Yet given the multi-dimensionality of urban trajectory dynamics, current research faces challenges of systematically uncovering spatiotemporal and societal implications of human movement patterns. Particularly, a data-driven policy-making process may need to use data from various sources with varying resolutions, analyze data at different levels, and compare the results with different scenarios. As such, a synthesis of varying spatiotemporal and network methods is needed to provide researchers and planning specialists a foundation for studying complex social and spatial processes. In this paper, we propose a framework that combines various spatiotemporal and network analysis units. By customizing the combination of analysis units, the researcher can employ trajectory data to evaluate urban built environment dynamically and comparatively. Two case studies of Chinese cities are carried out to evaluate the usefulness of proposed conceptual framework. Our results suggest that the proposed framework can comprehensively quantify the variation of urban trajectory across various scales and dimensions.
Introduction
Advancements in sensing and computing technologies have created urban trajectory datasets of human and vehicle movement at an unprecedented scale and speed. For example, the prevalence of GPS, Wi-Fi, Cellular, and RFID devices has enabled human dynamics to be recorded through the movement of taxis, fleets, public transits, and mobile phones at the individual level. Understanding and analyzing human dynamics can help assess transportation infrastructure and urban planning policies, and further inform better strategies to optimize urban and transportation planning, improve human life quality, and amend city operations.
Gong et al. (2015) studied the intra-urban daily human mobility using taxi trajectory data in Shanghai. Online check-in data recorded mostly by GPS-enabled mobile devices, can also be good indicators of human activities. To enable data-driven urban studies using these increasingly rich trajectory data and facilitate better decision-making for domain experts and policy-makers, the following two issues need to be addressed. First, trajectory data sets are often collected with diverse formats and at various scales and second, it is often challenging to incorporate social connection data with geographic analysis (Andris, 2016).
Existing methods and frameworks mostly focus on analyzing human dynamics at a specified scale (e.g. individual level, intra-urban level, or inter-urban level), instead of comparing human movement patterns across various scales. Such comparative studies are particularly needed in the urban planning context, given that assessment and comparisons of different planning scenarios are important for decision-making. Taxi trajectory data can be used to investigate urban functional zones at different scales (Zhao et al., 2017). They may be studied at an individual level to identify human movement patterns, or aggregated by officially-defined boundaries or trajectory similarities to compare administrative spatial layout with human-demarcated community structures and explore gaps between public’s transportation needs and current state of transportation planning scenarios (Li et al., 2017). Experiments with different analysis units are often needed as well in that researchers or planning specialists may critically examine the effects of aggregation, both spatially and temporally, to identify the proper analysis unit (Ye and Rey, 2013).
Trajectory data contain rich information about both spatial and social processes within urban environments, and the analytical methods vary drastically from spatiotemporal analysis to network analysis at various scales. In this regard, we propose a framework that can accommodate various analysis needs by considering different combinations of space, time, and networks for analyzing trajectory data. Although there are no one-size-fits-all solutions for analyzing trajectory data, the proposed framework aims to provide researchers and planners a foundation to customize their analysis. The synthesis of various analysis scales and dimension allows users to uncover spatiotemporal and societal implications of human activity patterns dynamically and comparatively. In the rest of the paper, we first provide a comprehensive literature review on theoretical foundations for developing the proposed framework, following by an elaboration of the framework. Two case studies are then presented to showcase the feasibility of the suggested framework. The paper concludes with a discussion on potential applications of the framework and future research directions.
Literature review
Socio-spatial studies of built environment have a long history in human ecology and urban geography (Lee, 1968). Burgess’s well-known concentric zonal hypothesis is one of the earliest work of recognizing “natural areas” by delineating urban areas based on their physical attributes and associated human activities. This method has since been widely adopted to study the social and spatial dimensions of urban built environment and examine issues such as social polarization, segregation, and reconfiguration of social areas. Along this line, a number of studies have used census data to explore socio-spatial structures of cities. Spielman and Thill (2008) studied social areas of New York City by linking physical space with social attributes. They suggested that this method could shed light on the geographic proximity as well as the social similarities among census tracts and thus provide valuable insight into the complex social landscape of the city. Yao and Zhang (2014), similarly, investigated the structural change of Beijing’s socio-spatial configuration using sub-district level census data. They found that the mosaic of physical and social landscape could effectively capture the formation of more disaggregated urban structure as well as the emergence of new types of social areas.
While these census data-based studies demonstrate the value of incorporating population characteristics with geographies of physical landscape, they are limited to static datasets that can only capture the spatial patterns of residential- or work-based activities. In addition, census surveys are usually implemented every several years, which presents challenges for researchers to investigate the dynamics of socio-spatial areas at a finer temporal resolution. Recent developments in location-aware technologies have provided researchers with opportunities to probe into socio-spatial patterns of the built environment at the finer spatial and temporal resolutions and to extend the analysis to recreational activities through various types of digital footprints and user-generated contents. Cranshaw et al. (2012) presented an exemplar work of delineating human-demarcated areas using online check-in data. Venues are clustered based on their spatial proximity as well as the social proximity with one another. In particular, the spatial proximity is calculated according to the geographic coordinates, while the social proximity is measured by the characteristics of people checking-in at the location. As a result, dynamic units that are subject to human activities are able to be identified. The richness of contextual information embedded in user-generated content has also allowed researchers to study the semantic meanings of places in terms of how place is used and perceived by people. Hollenstein and Purves (2010) argued that the tagging behavior on social media has implications on collective perceptions of urban places and thus shed light on social landscape of the built environment. Although a number of studies have pointed out the biased representation of such user-generated data in terms of the biased demographics and uneven geography within and across the city (Luo et al., 2015; Robertson and Feick, 2015), the increasing amounts of data about human activities provide opportunities to advance our spatiotemporal understanding of the built environment.
According to Newman (2003), there are four “loose categories” of network analysis, namely social networks, information networks, technological networks, and biological networks. While these networks encompass multiple domains, they are modeled using similar relational structure that is composed of nodes and ties, and are analyzed based on a set of mathematical methods grounded in graph theory (Newman, 2003). For example, a city can be considered as a network system whose edges are defined by streets and nodes by the edge intersections or landmarks (Agryzkov et al., 2016; She et al., 2016), while a social relationship graph can be accounted for a network with people as its nodes and the physical contacts among people as its edges. Network analysis is considered as a useful approach for many scientific research as it provides both a theoretical framework that conceputalizes the relationships among individual actors and a set of analytic approaches that model and analyze these relationships. Social network analysis (SNA), in particular, has its theoretical roots in interaction among individuals and provide insights into various social networks, whether be it the interaction among people in the physical world to the virtual connections established in the digital world, through analytic approaches (Dempwolf and Lyles, 2012).
While SNA primarily focuses on social aspects of people’s interaction, Andris (2016) called for a need to combine such analysis with GIS to advance our understanding of geographies underlying various social processes. Luo and MacEachren (2014) proposed a conceptual framework to study geo-social relationships, suggesting that the First Law of Geography can potentially be extended to account for both geographical and social network distance, relationship, and interaction. Such an integration is particularly useful to facilitate studies of built environment as it considers both social and spatial aspects of human behaviors. For example, while built environment has been considered as closely related to public health, SNA often considers the impacts of surrounding population while spatial analysis may primarily focus on the accessibility of physical infrastructure (Andris, 2016).
Integrating these two distinct yet related perspectives allows us to examine cities as not only the physical layout but also the composition of multiple social network layers. Human mobility is one example of these social networks, where the mobility trajectories form the edges of the network and the origins and destinations form the nodes. A range of studies have suggested the usefulness of applying network analysis to human mobility data to understand urban layout, discover functional regions within the city, and explore spatial interactions of places within and across the cities (Huang and Wong, 2016; Liu et al., 2014; Yuan et al., 2012). While each of these studies represents a significant effort towards the understanding of the city at a particular spatial scale (individual, city, inter-regional), a more comprehensive framework can advance our understanding of the built environment from a systematic perspective.
Studies of built environment have long been considered as an important component for urban planning as it is closely related to people’s physical activities and is thus essential to urban design and transportation planning (Handy et al., 2002). For example, a number of studies have found that certain characteristics of built environment, such as mixed land use, better street connectivity, and high population density, have positive impacts on people’s participation in physical activities and health outcomes (Harvey and Aultman-Hall, 2016; Troped et al., 2010). Studying human mobility through an integrated spatiotemporal and network analysis provides planners with a lens to understand the geographic landscape of various social processes. For example, Luo and MacEachren (2014) developed a geosocial visual analytics tool which can identify human interaction patterns, as well as design and evaluate the efficacy of different infectious disease control measures.
In our paper, we propose a comprehensive framework that can systematically measure and visualize spatial social network of built environment. In addition, this framework will be applied to different data sources (taxi and cell phone) and various urban settings (Beijing and Chongqing).
A framework for spatial-social network analytics
The framework for spatial-social network analytics.
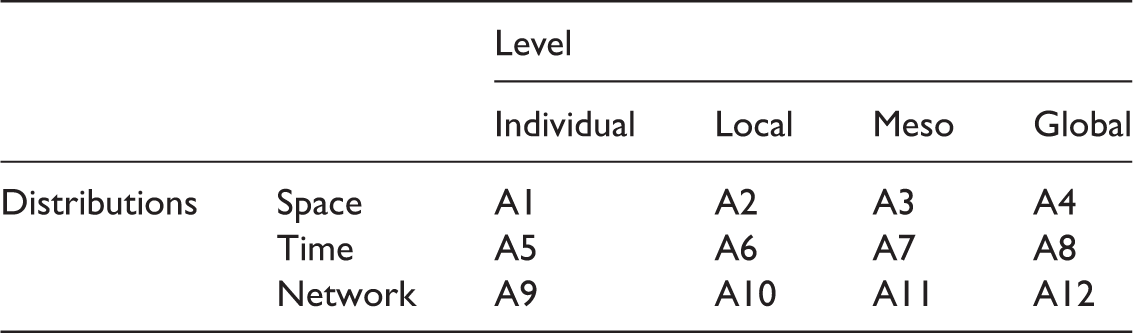
The analysis unit at the individual scale signifies the geographical location of an attribute (A1, Table 1), the temporal label of an attribute (A5, Table 1), or a single trajectory that connects two places (A9, Table 1).
The analysis unit at the local scale explores a group of units formed by the focal observation and its neighboring observations. A focal area and its neighboring areas, for example, can be considered as the unit of analysis from the perspective of the spatial dimension (distribution) at the local scale (A2, Table 1) (Al-Dohuki et al., 2017). The specific time such as a focal hour, an hour before, and the hour after can be considered as the unit of analysis from the perspective of the temporal dimension at the local scale (A6, Table 1) (Huang X et al., 2016). A local network can be considered as how a focal community is connected to its related area (A10, Table 1). For example, how a shopping center is connected to its related communities through various transportation means (Wang et al., 2016a).
A meso-scale analysis studies a group of entities which shares similar features in space, time or network. The spatial distribution of areas with certain features can be treated as the meso-scale (A3, Table 1). The time period after an event or policy can also be considered as the meso-scale (A7, Table 1) (Wang et al., 2016b). Meso-level networks depict connections among a group of similar communities (A11, Table 1) (Al-Dohuki et al., 2017).
The analysis at the global scale examines distributions of all spatial entities, times, or trajectories. Spatial distribution of all spatial entities, for example, can be considered as the global scale from the perspective of the spatial dimension (distribution) (A4, Table 1) (Li et al., 2017). The entire study period can be considered as the global scale from a temporal point of view (A8, Table 1) (Wang et al., 2016b). Global-scale network takes into account all the trajectories and their associated places (A12, Table 1) (Huang L et al., 2016). Limiting attention to only one of these dimensions or scales may result in a misguided or partial understanding of urban dynamics.
The framework developed based on Table 1 leads to a general task topology for analyzing the built environment by integrating spatial, temporal, and network distributions at individual, local, meso, and global scales. It allows the behavior of a dynamic system to be reconstructed from a group of analysis units. The key aspect of this framework is to integrate the three dimensions of urban trajectory dataset in a four-scale environment. In total, 64 possible combinations of space and time, space and network, time and network can be derived from the task design.
Spatiotemporal movement patterns at the individual level can adopt some methods from time geography, such as space–time prisms and choice set of individual’s activities (Chen and Kwan, 2012; Kuijpers et al., 2010; Miller, 2005). At the local scale, we can examine how a focal agent interacts with others (Winter and Raubal, 2006), and whether two moving objects have physically met (Kuijpers et al., 2011). The meso-scale analysis includes clustering and generalization of trajectories toward studying the community structures and social proximity among places (Andrienko et al., 2011; Guo et al., 2012a; Murray et al., 2012). The global scale considers the overall pattern, such as the social interaction potential in a city and predictions of future movements (Farber et al., 2012; Horner et al., 2012; Song et al., 2010).
Case studies
Study area
Trip flows reflect human mobility patterns and social flows (Andris, 2016). These flows can be captured by various sources including GPS traces (e.g. Liu et al., 2010), pedestrian activities (e.g. Girardin et al., 2008), mobile phone records (e.g. Woodard et al., 2017), and subway cards (e.g. Lathia and Capra, 2011). In the following section, we present case studies in Beijing and Chongqing, two large metropolitan areas in China, to showcase the proposed conceptual framework. Cell phone and taxi trajectory data are used for Chongqing and Beijing respectively to derive trip flows.
Methodology
Data source
Cell phone signaling data. The mobile phone signaling data from GSM (Global System for Mobile Communication) network operated by China Unicom takes up approximately 20% of the market share in China. The data used in this paper were collected from the A and E interface in GSM network. Each record is generated when a mobile device connects to the cellular network in the following instances:
– when a call is placed or received (both at the beginning and end of a call); – when a short message is sent or received; – when a location update occurs; – when handover occurs;
Every record includes seven fields, including the IMSI (International Mobile Subscriber Identification Number), timestamp, location area code, base station ID, MSC (Mobile Switching Center) id and BSC (Base Station Controller) ID, event type (including random location update, periodic location update procedure, connect management service request, paging response, BSC handover and so on).
The data used in the case study of Chongqing were generated from 4.7 million mobile phones over one month in 2013. It consists of 140 millions of records per day, and covers 38 counties of 82,400 km2 in Chongqing, with an average of 30 records per device.
Taxi GPS data. The mobile devices equipped with a GPS receiver chip can collect information about the movement of people, vehicles, and other mobile objects. The taxi GPS data used for the case study of Beijing were collected from GPS devices installed in taxis, a current wide-used floating car technology to track traffic conditions. According to the report from the Beijing Traffic Bureau, taxis accounted for 12% of Beijing’s total ground traffic (Yuan et al., 2012), therefore the taxi datasets can well reflect people’s activities and reveal the urban functional structure.
Trip flow matrix estimation based on cell phone signaling data
The methodologies for trip flow matrix estimation comprise five steps including: data pre-processing, trajectory cluster and spurious points filtering, trip identification, commuting identification and trip flow aggregate.
Data pre-processing. Data pre-processing includes scanning records one by one to remove those fail to track IMSI number, grouping records by users, and sorting every user’s records in chronological order to get each user’s daily activities trajectory.
The base station positioning technology was adopted here. Phone users are geo-located by combining their current base station ID with the station’s coordinates. In urban areas where base stations are densely distributed, the accuracy of geo-locating is about 200–800 meters. In rural areas where base stations are sparse, the accuracy of geo-locating differs from a few hundreds to a few thousands meters.
Users’ daily trajectory is presented in an ordered sequence Space–time trajectory for user’s activities. Extracting space–time stable points from user’s multi-day trajectory.

The enter time
The departure time
It is assumed that:


Mobile phone signaling records are sparse and irregular, in that users’ displacements (consecutive non-identical locations) are often observed with long travel intervals. For example, the first location may be observed at 8:00 and next location may be observed after an hour or more. Therefore, we can only approximate when a user enters or leaves a base station, and estimate errors in calculating enter time and departure time. The max error of enter time or departure time is
The stay time
Trajectory cluster and spurious points filtering. In practice, the base station that provides service for a user is not necessarily the one nearest to the user and may be constantly changing in spite of no actual displacement. This is because the operator often balances call traffic among adjacent towers by allocating a new call (or shifting an ongoing call) to the tower that is handling lower call volumes at that moment. To reduce the number of false displacements, we therefore take the following measures.
We first analyze two consecutive trajectory points; if the linear distance of two points is less than the threshold, trajectory point mi and 
After this measure, duplicate trajectory points and trajectory points nearby will be merged into one point. The short distance trip (trip distance less than the threshold) will also be eliminated. Therefore, the total number of trips will reduce.
The fact that base stations a user connected to for communication may vary in a wide range makes the illusion that a user moved a long distance in a short period of time. To diminish this effect, we then analyze three consecutive trajectory points successively. If the following three conditions are met at the same time, trajectory points mi, 


This measure can effectively eliminate the false displacements of single drift phenomenon of base station. However, we may lose some quick return trips in this process. That is, when a user makes a short stop at the destination and return to the origin quickly, the total time cost of the trip may be less than the time threshold.
When execute the fusion of trajectory points, the former point mi will be reserved and the second point 

After this process, all points left in the sequence are spatial dispersed.
Trip identification. The stop points can be identified based on stay time that is greater than a time threshold, which is determined by the area size of analysis and the time interval between consecutive records.
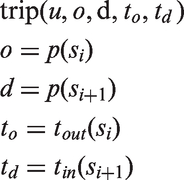
A user’s trajectory can be cut into several consecutive trips by stop points. The stop point becomes the destination of last trip as well as the origin of next trip like
Each trip for a user u can be characterized by an origin o, a destination d, departure time to and arrival time td as follows:
In this chapter, the basic analysis units are counties, whose area ranging from tens to hundreds of square kilometers. We only care for the long distance trips that cross the county. So we can simplify the methodology to calculate the total stay time in each county instead of the base station. The location measurement in one county can be fused together and their stay time can be added together to get user’s total stay time in that county. Stay time for county R can be calculated as follows:

According to the length of stay time, we can determine whether the user stopped in the county for an activity or not. If the stay time surpasses the threshold, which was 2 hours in our case, the county can be regarded as a stop point, which becomes a trip origin or destination. Otherwise, users are considered to be through traffic or make a temporary stop (e.g. stops for car fuel or driver rest).
Commuting identification
Most people have regular daily activity patterns that can be extracted through long-term observation (González et al., 2008). To extract users’ movement patterns, we first identify candidate home and workplace locations using a Location Stability Index (LSI) similar to what presented by Hao et al. (2010). Commuting trips between user’s home and work places can then be identified accordingly (Figure 2).
We first divide each day into 48 time windows, with each covering 30 minutes. For each stop, the time window that first overlaps the stay period 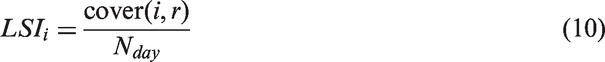
The stay points with max LSI and is no less than the minimum threshold (value of 0.6 is suggested) was chosen as the multi-weekdays stay point in that time window (Figure 2). A fusion action will be taken if the linear distance of two multi-weekday points in adjacent time windows is less than the spatial threshold, which can refer to equations (7) and (8) in this section.
We consider points with the longest stay time at night (22:00–7:00) as users’ home locations and points with longest stay time in the day (7:00–22:00) as workplaces. The cumulative stay time of home or workplace needs to be more than the minimum threshold (i.e. 2 hours) to be considered as valid.
Trip flow matrix of mobile phone users. All trips are then aggregated by their origin and destination to form a trip flow matrix. For each time window 
The spatial statistical unit for trip flow, estimated by trajectory mobile phone users should not be too small. The static results error will increase sharply with the unit size reduction because of base station positioning errors. It is recommended that the size for statistical unit is no smaller than four square kilometers.
Taxi trajectory extracting and visualization based on taxi GPS data
Taxi trajectory data are also pre-processed given its unstructured nature. The processing steps include:
Taxis can only can reflect people’s purposeful activities and commuting in a city when they carry passengers. Therefore, trajectories of taxis carrying passengers are obtained according to the traveling state. According to the trajectories of taxis that carry passengers, data on starting points, arrival points, and time of each trajectory is acquired. The starting area, arrival area, and time (hours) are attained by plotting each point on the map, getting the area which the coordinates are in, and dividing time by hour.
As a result, this section basically achieves the identification and spatialization of the taxi GPS data-based origin (O) points, destination (D) points, and the corresponding time (T), with a total of 2,253,626 O points and 2,253,551 D points.
Framework implementation
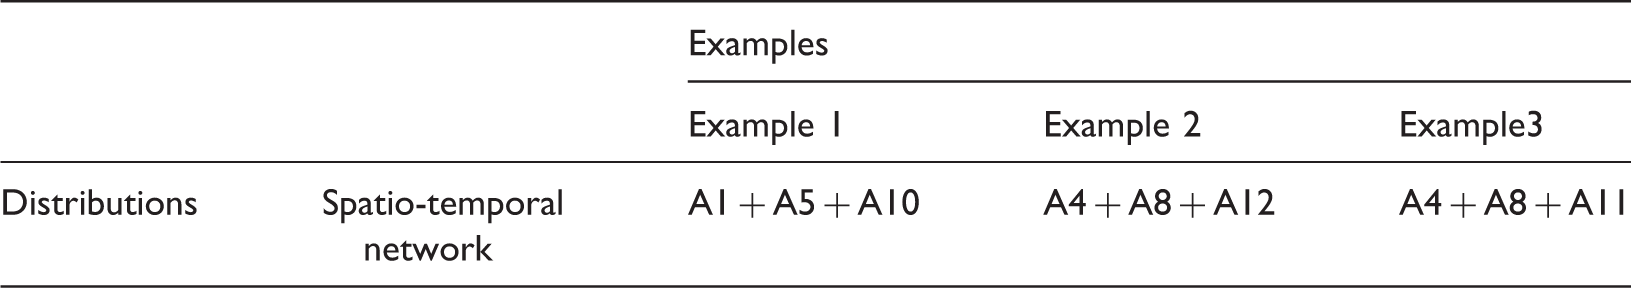
Examples for unit of analysis framework (spatio-temporal dynamic of urban trajectory).

Taxi trajectories in Financial Street area of Beijing from 7 a.m. to 8 a.m. 27 February 2013.

Counts of OD trips within Beijing in 2011.
The example 3 is represented using cellphone data from Chongqing. Cell phone data are aggregated at county level (example 3 in Table 2) to examine the connectedness of the city. Although similar county-level OD data can be derived from railway or bus records, they are limited to certain types of transportation modes. Moreover, the high cost makes this data less accessible to researchers. Estimating trip volumes from cell phone data provides an additional channel to examine travel patterns within the city and may also supplement to less-frequently collected transportation census data. Figure 5(a) shows that counties adjacent to the main city have the maximum amount of trip volume (more than 40 thousands per day) and the highest share (more than 50%). This indicates that these counties have very close relationship with the main city. The county of Qijiang and Fulin also have significant amounts of trips related to the main city, but with a lower share (less than 35%). This contrast may result from the fact that these two counties are economically independent from each other. Counties in the northeast or southeast have very few trip flows to or from the main city because of long distance and inconvenience of travel.
Trip flow distribution in Chongqing City within one day. (a) Trip flow distribution between the main city and suburban counties. (b) Trip flow distribution between suburban counties.
Figure 5(b) (example 3 in Table 2) takes each county’s external trip flow volume (except these trips related to the main city) as an indicator to measure its regional dominance. High dominance means strong economic impacts, attraction to circumjacent counties, and more trips to or from external areas. The results indicate that in the northeast of Chongqing, Wanzhou showed a very significant regional dominance, and can be taken as the regional center. Yongchuan and Fulin, similarly, can be considered as the regional center on the west and east of the main city. However, in the southeast, there is no significant regional center, though Qianjiang has been defined as the regional center in the previous master plan. Jiangjin, Bishan, Hechuan have lost their regional dominance and no longer need to be defined as a regional center. Instead, they become integrated parts of the main city.
As discussed above, cellular phone and taxi trajectory data can reflect human activity and thus form networks of human movement patterns. In our case studies, we extracted human movement patterns and incorporate them with the analysis of urban built environment through an integrated spatiotemporal network analysis framework. The results suggest that social network of activities can help us understand urban functions (e.g. traffic demanding areas and domain regions) at different scales. Such an understanding can be used to help with better planning strategies.
Summary
With the fast growth of urban trajectory data, new opportunities are emerging for researchers to study urban built environment through real-time human activities. Nevertheless, how the dataset with unprecedented breadth and depth may facilitate the studies of built environment and further support effective urban planning requires new spatiotemporally explicit framework and methods that have not been fully addressed in current scholarships. This paper aims to bridge this gap by suggesting a framework that considers different spatiotemporal and network scales through the notion of analysis units. By combining different analysis units, researchers can answer questions about built environment through the exploration and comparison of the spatiotemporal patterns of human activities and interactions across various scales and dimensions. The case studies indicate how such combination can help answering questions about spatiotemporal social network dimension in mixed scales of units. Specifically, the presented examples demonstrate the advantage of analysis unit in that it provides both flexibility for analyzing data with different resolutions and comprehensiveness of understanding urban dynamics at various scales. Researchers can adopt similar approaches and develop their own combination of units according to the purpose of analysis.
Secondly, the proposed framework has its root in spatiotemporal analysis and network analysis. Researchers can combine methods from these two fast-growing domains and develop integrated approaches to address their research needs. Thirdly, the framework of multi-scale spatiotemporal network analysis enables access to a much wider thinking which addresses the role of dimensions and scales at different stages of urban dynamics for more in-depth study. In other words, the current work is mainly from an exploratory perspective, which can motivate urban scientists to design a series of tasks and formulate new hypotheses from theoretical and policy perspectives. This space–time work provides an important contribution to the current spatial science and urban studies literature, which lack frameworks of addressing integrated spatiotemporal network analysis. Although the proposed framework arose in the analysis of human activities and interactions, it can also be applied to a wide set of socioeconomic processes with geo-referenced data measured over time.
This paper notes that the multi-scale and multi-dimension methods can expose some hidden patterns and trends that otherwise would be very difficult to detect. This research presents a general framework for pattern discovery and hypothesis exploration in urban trajectory datasets. On this basis, this framework and specific domain could benefit from each other in the following procedures: First, the analyst has the specific reason for investigating issues related to urban built environment, which can be expressed as a general question or a set of general questions. Second, this nature of the investigation is checked against the task topology of the dataset. Third, the analyst carries out the matched tasks and detects something both interesting and relevant to this investigation. Fourth, new, more specific questions might appear, motivating the analyst to look for more details. These questions affect what details will be viewed and in what ways. Lastly, the general questions in step 1 are revised and the investigator goes through the procedures again. As such, explanations of various urban dynamics can be provided based on rigorous analysis, and policy interventions are then proposed in light of the understanding of the space–time-network dataset, which will open up a rich empirical context for social sciences (Ye et al., 2016).
Footnotes
Acknowledgements
The authors acknowledge the contribution of Dr. Jingyuan Wang and Dr. Jianhui Lai for providing necessary data support.
Authors' note
Zhenjiang Shen is also affiliated with theFuzhou University, China.
Declaration of conflicting interests
The author(s) declared no potential conflicts of interest with respect to the research, authorship, and/or publication of this article.
Funding
The author(s) disclosed receipt of the following financial support for the research, authorship, and/or publication of this article: The research study was supported by the National Natural Science Foundation of China (No. 41501181).