
Abstract
Urban sprawl is a phenomenon observed in most cities around the globe and especially in Latin America, where it is associated to socioeconomic segregation. In the case of Chile, sprawl has been generally based on large real estate projects. Developers target their projects to different types of consumers, which translates into submarkets with a broad range of housing-unit’s characteristics, but also different location strategies. This heterogeneity has been analyzed and measured in the literature, but quantitative studies have used exogenous or sequential methods to identify submarkets, leading to potential bias in the segmentation. In this paper, we propose an econometric model to measure location drivers for different types of real estate projects that fills this gap. The modeling framework is based on discrete-choice and latent-class models, allowing us to simultaneously identify market segmentations, and their particular location choice preferences, without the need of arbitrary or ex-ante definitions of submarkets. The model is applied to the city of Santiago, Chile. The results reveal two clearly different approaches taken by developers to produce housing, with one submarket of “exclusive” and more sprawling projects, and another submarket of “massive” and more density driven projects. Location strategies are very different between submarkets, reproducing the socio-spatial segregation already observed in the consolidated city.
Introduction
The horizontal growth of some contemporary cities, based on scattered private projects of single-family detached houses, has been a trend observed not only in Anglo-Saxon countries, with a long suburban tradition, but also in Latin American metropolitan areas in the last decades (Borsdorf et al., 2007; Webster et al., 2002). This pattern in Latin American cities is the latest stage of the evolution from an originally compact shape, to a sectorial distribution in the last century and, finally, to a fragmented structure in recent decades (Borsdorf, 2003). In this scenario, most residential projects in expansion areas are built as “gated communities,” with emphasis on vigilance/security, social homogeneity, and marketing campaigns based on the image of a suburban, high-standard lifestyle (Coy and Pöhler, 2002). As we will present later, the Chilean case (especially in Santiago) is no exception to this trend, although amplified by the existence of some market-oriented land use policies.
Originally, private projects in expansion areas of Chilean cities were associated to high income groups searching for a “garden city” life-style, but recent works (Borsdorf et al., 2007, 2016) have pointed out the broad spectrum of households locating in these projects, from high-income to low-income groups, with each project being targeted to specific segments. While some authors have studied how the location of these projects produce accessibility and environmental conditions that often imply a burden to middle- and low-income households living in them (Cáceres-Seguel, 2015, 2017; Gainza and Livert, 2013; Romero et al., 2012), there has not been much attention paid to understanding the heterogeneity in this market, especially in terms of location strategies. Although these authors have described the location of projects in terms of accessibility, spatial and geographical variables, the analysis is generally case-oriented and there has not been a systematic effort to measure differences in location drivers among different types of projects.
This real estate development pattern seems to be consistent with the existence of housing submarkets (Palm, 1978; Schnare and Struyk, 1976), although defined not only by product similarity (units) but also by spatial attributes, as proposed by Watkins (2001). Identifying and characterizing these submarkets is relevant to understanding the logic behind the production of built space and the emergence of spatial and structural (i.e. housing characteristics) segmentations in expansion areas of the city, which can be one of the causes of fragmented urban sprawl and residential segregation (Massey and Denton, 1988).
This paper proposes a model to understand location choice patterns of residential projects and their membership to different housing submarket. The modeling approach, based on latent class models (Kamakura and Russell, 1989) and location choice models (McFadden, 1978), allows for identification of housing submarkets from the observed location data of residential projects through simultaneous estimation of location choice and market segmentation parameters. This is a contribution to the housing submarkets literature, where the problem has been generally analyzed following a two-step fashion, with market segments being defined prior to the estimation of location preferences or hedonic price parameters (Bourassa et al., 1999; Rosmera and Lizam, 2016; Schnare and Struyk, 1976).
To our knowledge, the model presented here is the first housing supply location choice model using latent classes to segment real estate projects according to their characteristics and location choice. Latent class models have been used before in location choice, but mostly to segment households according to their characteristics (Ettema, 2010; Liao et al., 2014; Lu et al., 2014; Olaru et al., 2011; Walker and Li, 2007).
While the model can be applied to understand location choices in any part of the territory, we believe it can be particularly useful to understand location strategies in areas where submarkets are not already well defined, such as expansion areas. Therefore, the proposed modeling approach is applied to the case of Santiago, Chile using data describing all new real estate projects built in expansion areas between years 2004 and 2013 (accounting for 1,833 projects and 89,422 units). Estimation results confirm very clear market segmentation, with significantly different housing location preferences between submarkets of projects. We argue this reflects social segregation, which clearly manifests spatially in consolidated areas of Santiago, and is now replicated in the sprawl.
The paper is structured as follows. Section “Housing submarkets and location choice models” provides an overview of the literature in the field of housing submarkets, location choice, and agent heterogeneity. Section “A model for endogenous segmentation of housing submarkets” presents the proposed model. Section “Santiago case study: Project-based expansion” presents the model implementation, introducing Santiago as a case study, describing the data assembly and showing the estimation results. Finally, the “Conclusion” section concludes the paper.
Housing submarkets and location choice models
Housing markets are different from other markets for several reasons (Galster, 1996; O’Sullivan, 2012). In particular, they deal with heterogeneous quasi-unique goods (housing units) that usually have very high transaction costs. As most markets, they can be subdivided into submarkets, but there are some key differences that are relevant to this work.
Because of demographic, spatial, and production factors, new housing products are heterogeneous but can be grouped in clusters or subgroups of nearly similar products with some internal variance, which has been studied as housing submarkets (Adair et al., 1996; Galster, 1996; Goodman and Thibodeau, 1998; Rosmera and Lizam, 2016; Schnare and Struyk, 1976; Watkins, 2001, inter alia).
These submarkets can be correlated with social segregation patterns (Daniels, 1975; Hwang, 2015) by contributing to the emergence of homogenous neighborhoods. While spatial segregation, understood as the physical separation of two or more groups of agents into different areas of the city (Massey and Denton, 1988) is the result of individual location preferences with respect to the location of other groups or types of agents (Clark, 1991; Schelling, 1978), most theoretical and applied approaches trying to measure or describe segregation are based on exogenous definitions of types or groups of agents. While this makes these approaches intuitive and easily transferred to public policy, exogenous and/or fixed definition of groups has been criticized in the literature since this is clearly a complex process that depends on multiple variables (Wright, 2000). This is also the case in the discussion about segregation in Latin America and particularly in Chile (Ruiz-Tagle and López-Morales, 2014). We believe that the use of latent submarkets, as proposed in this paper, can help to tackle this issue by using an endogenous segmentation process that helps not only to identify groups that tend to agglomerate (or segregate from each other) but also to measure their location preferences and, therefore, the drivers of segregation.
Addressing submarkets through heterogeneity in location choice models
McFadden (1978) proposed modeling the residential location as a discrete decision, in which each household is a decision maker facing a set of locations (dwellings) as alternatives. Each alternative reports a utility to the household, which is a function of location attributes, dwelling price, and household preferences. Alternatives with higher utility have a higher probability of being chosen (stochasticity is given by a random error term accounting for unobserved attributes and idiosyncratic behavior).
In location choice models, heterogeneity is the explicit differentiation of preference parameters by type of decision maker. This differentiation is usually defined exogenously, based on decision maker characteristics, such as income, car ownership, and households’ size (for a review, see Schirmer et al., 2014). Models for the location of residential supply considering heterogeneity of the developers are reviewed by Haider and Miller (2004) and Zöllig and Axhausen (2015).
Exogenous definitions of types of agents (and hence heterogeneity) cannot ensure an adequate and representative clustering of decision makers with similar preferences. To tackle this problem, endogenous segmentation techniques can be used. The most common approach for endogenous segmentation in location choice models is latent class modeling (Kamakura and Russell, 1989). These models estimate the probability of belonging to a certain class of decision maker as a function of her characteristics, while simultaneously estimating the preference parameters for each of the classes considered in the model. This approach is explained with more detail in Section “A model for endogenous segmentation of housing submarkets”.
Latent class models have been used to account for heterogeneity in residential location choice (Ettema, 2010; Glumac et al., 2014; Ibraimovic and Hess, 2017; Liao et al., 2014; Lu et al., 2014; Smith and Olaru, 2013; Tu et al., 2016; Walker and Li, 2007), allowing for a better characterization of behavior. Latent class models applied to the problem of location choice for residential supply are not reported in the literature, to the extent of our knowledge.
A model for endogenous segmentation of housing submarkets
We propose a model where the decision makers are real estate developers. We assume each developer produces one project with given characteristics. Each developer chooses where to locate their project from all feasible locations in the study area, and their location preferences vary depending on the project characteristics (i.e. the submarket it targets).
In our model, submarkets are endogenously identified as a function of the project characteristics and location patterns. We assume each submarket targets a different type of consumer, whose willingness to pay for a dwelling in a specific location defines the price. Similar to households maximizing utility in standard location choice models as proposed by McFadden (1978), real estate developers are profit maximizers. Therefore, developers attempt to maximize their profit by choosing the best location for each project, depending on the submarket the project belongs to. However, submarket segmentation is not explicit and must be identified. We do this by assuming submarkets can be treated as latent classes, with each project belonging to a “latent submarket” with a probability, which is a function of its characteristics. The set of possible submarkets (
We model the profit of a project

The expected selling price (

The estimated selling price, as well as development and land costs, may be subject to uncertainties derived from imperfect information, unobserved attributes, or non-rational behavior. According to random utility theory (Domenich and McFadden, 1975), we can account for these uncertainties if we assume that the profit associated to each location alternative has a random error following an IID Gumbel distribution, and treating the decision process under a stochastic approach. This assumption, which renders a multinomial logit model (MNL), is frequently used in the location choice literature (see for example Hurtubia and Bierlaire, 2014; Martínez and Henríquez, 2007; McFadden, 1978; Walker and Li, 2007). A reason for this is the “Independence of Irrelevant Alternatives” property of the MNL, which allows to estimate a model using a sample of alternatives instead of the complete choice set, usually very large in this type of problem (Antoniou and Picard, 2015). Additionally, the MNL has the advantage of having a closed form, something that is particularly convenient for models with a latent class structure, and therefore computationally expensive to estimate, such as the one proposed in this work.
Therefore, the probability that a location alternative i reports the maximum profit among all alternatives, conditional to a particular submarket
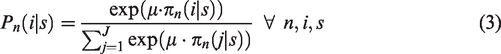

With some algebra, we can see that terms that are not specific to the location (number of units, development costs, and the project characteristics in the expected price) can be cancelled out

Therefore, as development costs are not part of the profit function in the location choice, any economies of scale due to number of units in the project are not relevant for modeling this particular decision. Economies of scale could be considered when defining the size of projects, but this decision is previous and exogenous to this model. It should also be noticed that development costs could have some variation across the city for the same project, but for modeling purposes we assume this variable to be constant across space.
The location probability of (5) is conditional to submarket

Using equation (7), parameters
The estimation results allow the modeler to label each class according to the magnitudes and signs of parameters
Santiago case study: Project-based expansion
In order to test our model, we propose as a case study the development of residential projects in the expansion areas of Santiago, Chile. With 6,123,000 habitants (INE, 2018), Santiago is by a large extent the main city of Chile, concentrating administrative power, services, and commerce.
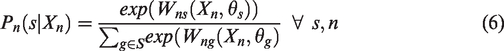
In this case study, we will focus on private residential projects built in suburban and expansion areas (outside the outer ring road) from 2004 to 2013. During this period, several urban highways were built, facilitating the development in areas that were previously hard to reach. Figure 1 shows the “centrifugal” evolution through time of the location of new real estate projects in the outskirts of the city, and how this correlates with the construction of urban highways.
Location of residential projects (left) and distance to the outer ring road (right). Highways are highlighted in black on the left side map and their names and construction year are displayed in red on the right.
These projects were regulated under a policy called “conditioned urban development zones” 1 which, from 1997 to present day, allows developers to urbanize rural areas, if certain basic requirements of connectivity and amenities are met. This means that real estate location is more the outcome of the developers’ decisions than of discretional regulations, making this case study particularly suitable to be approached through econometric models.
Model implementation and data
We applied the model described in Section “A model for endogenous segmentation of housing submarkets” to a database of residential projects in expansion areas. The class membership function
We divided the study area into a 175 × 175 grid, resulting in 30,625 cells of 500 by 500 m. Each cell is a valid alternative in the location decision process but, because estimating a logit model with such a large choice-set (30,625 alternatives) would be inefficient and too expensive in computational terms, a sampling strategy was used following McFadden (1978). We use the observed location of the project as the chosen alternative while nine unchosen alternatives were randomly sampled from all locations that were feasible.
Project data come from a private cadaster of all residential developments built in Santiago’s expansion areas (out of the main ring of the city, Americo Vespucio) from 2004 to 2013.
2
This database describes 1,833 residential projects accounting for a total of 89,422 new housing units. These projects represent approximately 26% of the total new housing supply in this period, according to own calculations based on intercensus growth (INE, 2002, 2018). Demographic attributes of the cells are obtained from the National Census (INE, 2002) and a socioeconomics segmentation provided by GFK Adimark (2000). Land cost is available at an aggregate spatial zoning for year 2014.
3
A road network topology, obtained from Open Street Map, was used to compute accessibility measures. Travel time is obtained through cost surface analysis (see Leusen, 1997). All variables describing location attributes (
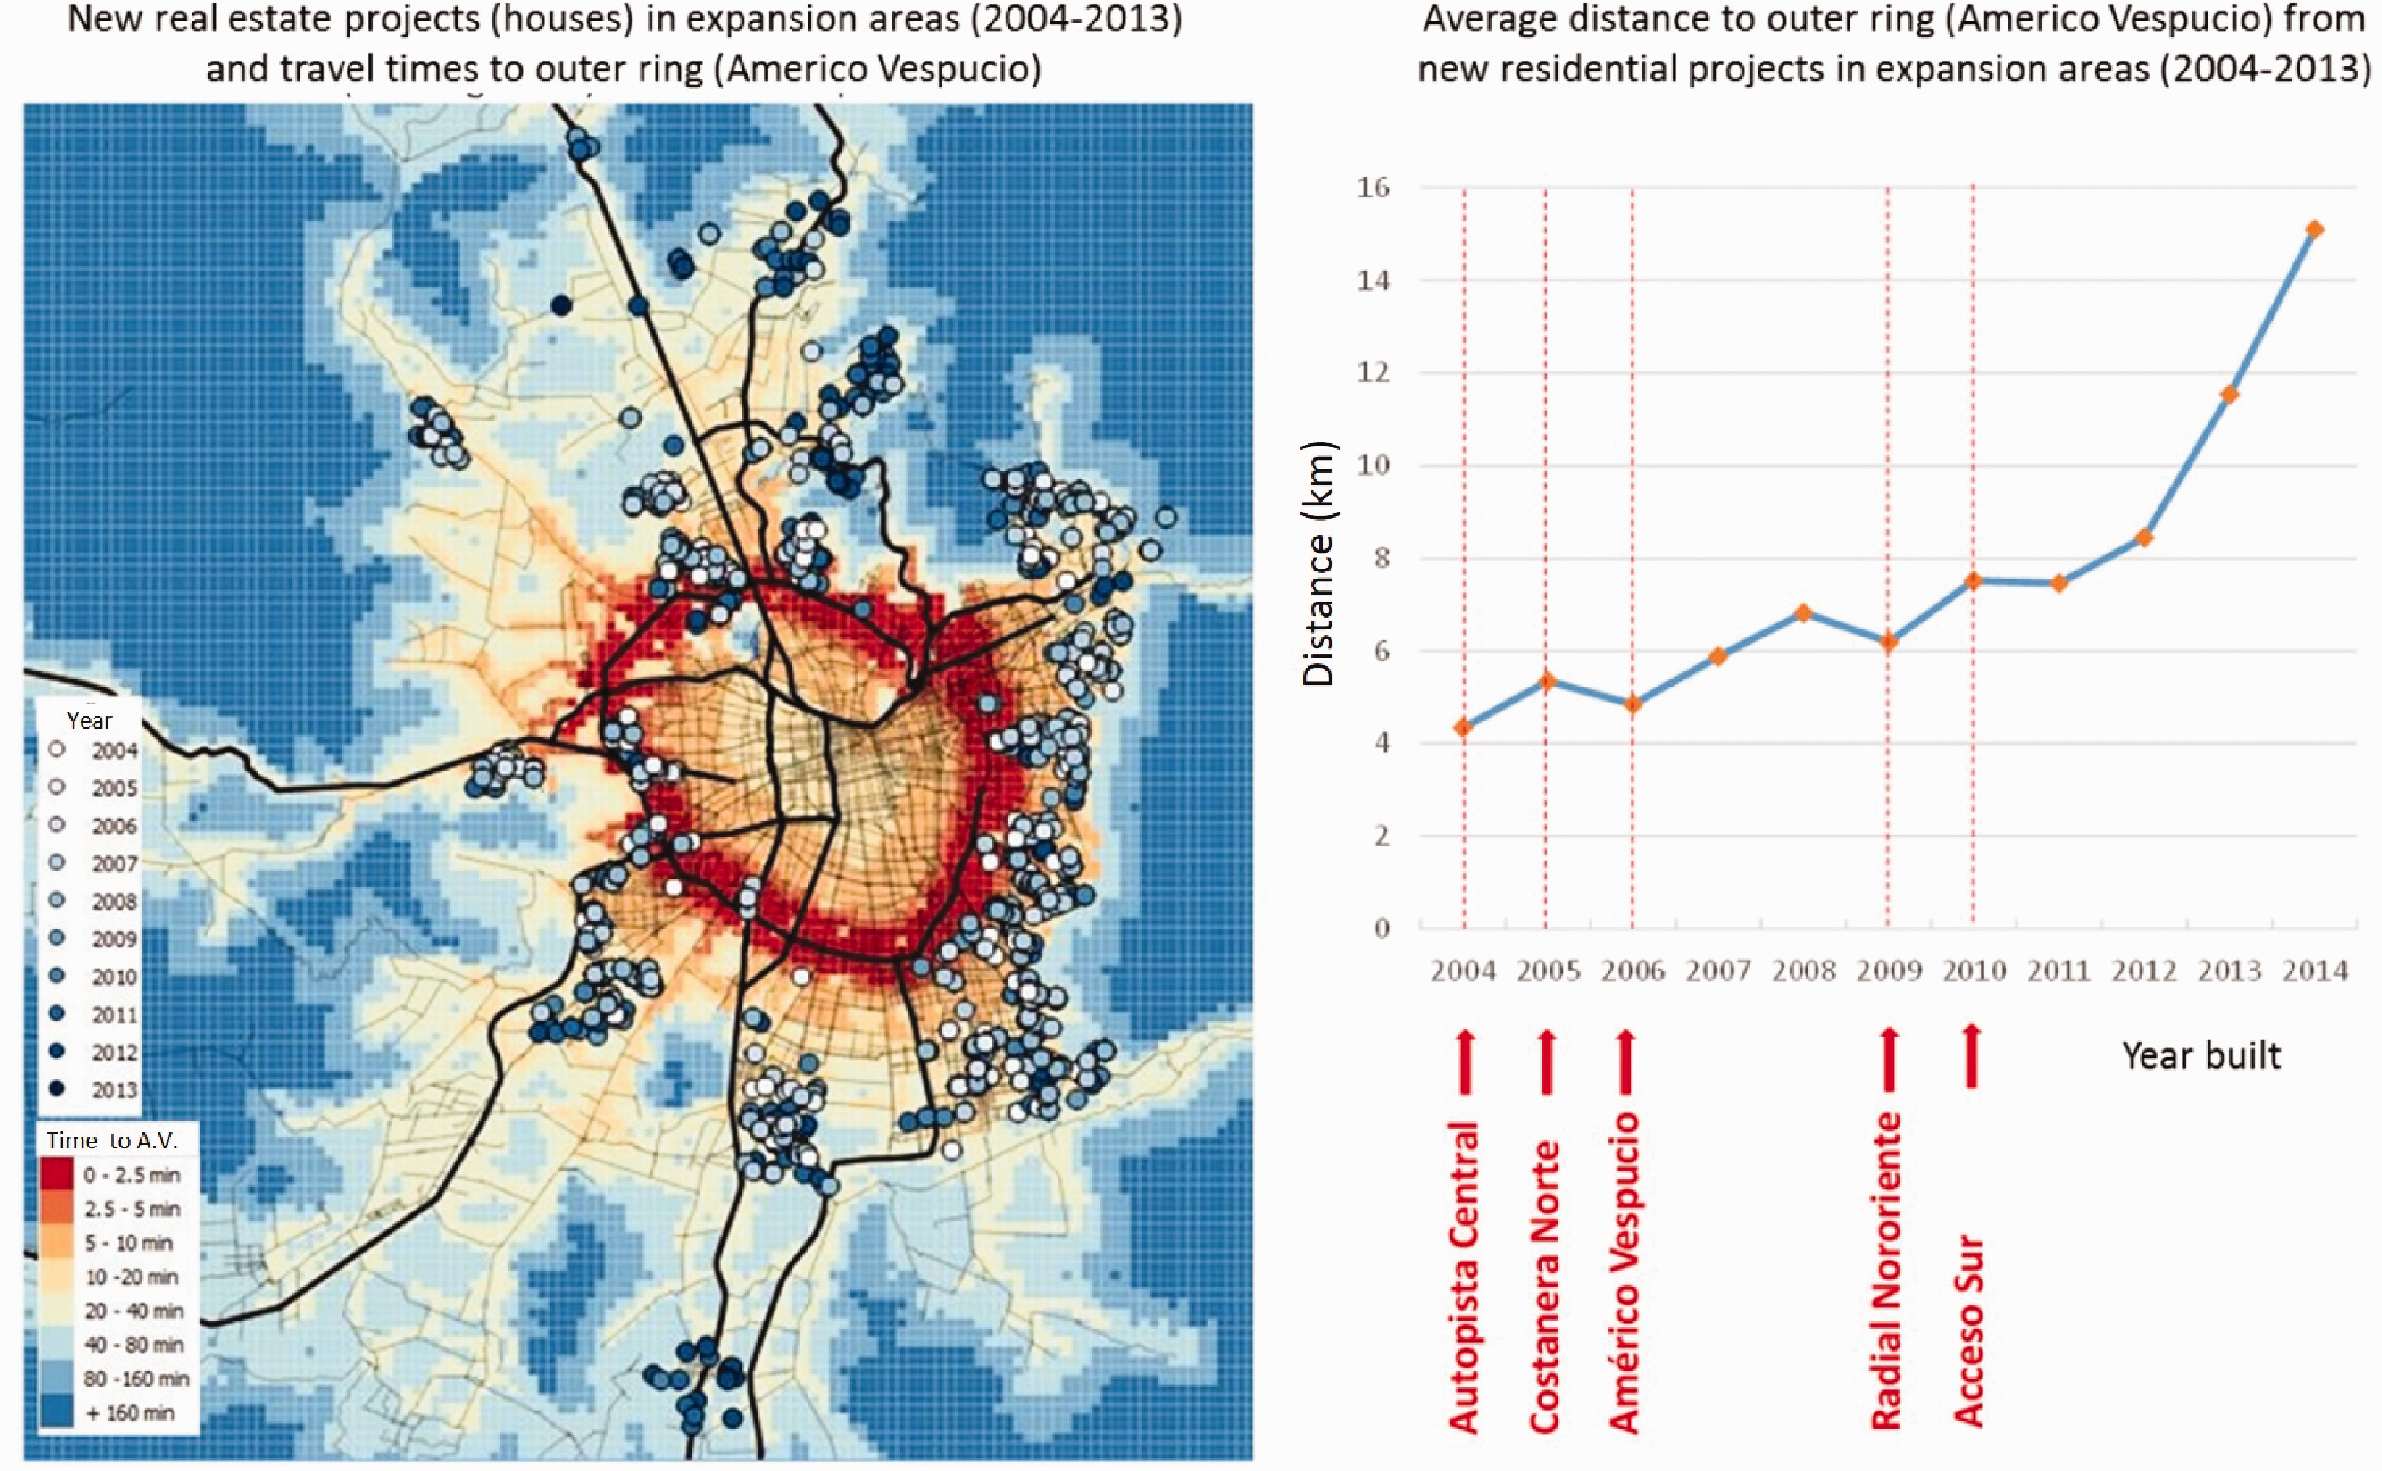
Attributes used in proposed models.

aSantiago Metropolitan Region has 541 censal districts. This index is based on a stratification methodology by GFK Adimark (2000), where households are divided in five classes (ABC1, C2, C3, D, and E) according to education and material belongings.
bUnidad de Fomento (UF) is a monetary unit that is re-adjustable according to inflation, which is equivalent to 42 dollars (August 2017).
Estimation results
The model described in Section “A model for endogenous segmentation of housing submarkets” is estimated using the statistical software Biogeme (Bierlaire, 2003) and considering two classes. Models with more classes were estimated, but the parameters were not significant, which can be interpreted as evidence of this market being polarized into two well-defined submarkets. For comparison purposes, a base model with no latent classes (i.e. all projects have the same location preferences) was also estimated. Results are shown in Table 2.
Estimation results.
aNot significant at 95%.
bNot significant at 90%.
In both models, most parameters were significant to 95% certainty, and signs and magnitudes are as expected, with a few exceptions that will be analyzed later. The latent class model considerably outperforms the basic model in terms of fit.
The class membership model (bottom of Table 2) shows parameters that affect the probability of belonging to class 1. By interpreting the signs of these parameters, class 1 can be labeled as a submarket of more “massive” projects, as they have a lower asking price, 4 with smaller plot size and a higher number of units in the project. In contrast, class 2 projects can be labeled as belonging to a more “exclusive” submarket.
Several parameters in the latent class model change significantly with respect to the basic one. This is because the class-specific parameters are describing a much more coherent behavior. For example, travel time to low price projects, to the CBD, and to the nearest satellite are all negative in the basic model but become positive for class 2 (exclusive projects) and remain negative for class 1 (massive projects) in the latent class model. A similar change is observed for density and distance to hillsides.
The interpretation of the parameters becomes much more intuitive in the latent class model. For example, both massive and exclusive projects prefer to locate near high price projects, but this is much more important for the exclusive projects while, at the same time, the exclusive projects try to locate as far as possible from low price projects (which is not the case for the massive ones). The case of the distance to hillsides variable is interesting, showing that high income households prefer to locate in enclosed or “protected” places, which can be interpreted as an extension in a topographic scale of the typology of gated communities (Borsdorf and Hidalgo, 2008; Webster et al., 2002), but in this case instead of crime, protecting themselves against new “undesirable” projects locating nearby. Travel time to CBD is significant for massive projects, which seem to prefer locations with good accessibility to employment centers. However, this variable becomes irrelevant for exclusive projects, which is consistent with the observed trend where this type of development (usually associated to households with higher car ownership) tends to locate farther away from the consolidated city.
Although both classes value to have low travel times to certain amenities or desirable opportunities (e.g. high income projects, industry, CBD), which clearly benefit from the presence of highways connecting them, they also prefer locations far from the highways themselves. This, although seems to be contradictory, reflects how urban highways provide benefit to peripheral locations (by increasing their accessibility) but, simultaneously, are not desirable from a public space and externalities perspective.
Although the parameter for land acquisition cost is the scale parameter, following equation (5), it cannot be confidently interpreted as such since the available data only provides a very coarse approximation for this attribute. Due to several unknown factors, such as the amount of time passed between the purchase of land and the construction of the project, or the interest rates involved in the transactions, the land cost attribute can be only interpreted as a proxy of the opportunity cost of developing that parcel.
Spatial distribution of sub-markets
Using the class membership parameters (

Map with location of projects and segmentation according to probability of membership to “exclusive” submarket. Most projects have a probability of 0.95 or higher of belonging to either exclusive or massive class, showing an extreme polarization of the housing market.
The histogram in Figure 3 (top) shows the empirical membership probability distribution for exclusive projects. Most of the projects can be clearly classified in one of the two submarkets. Forty-seven percent of the projects fall in the 0 to 0.05 range of probability of being classified as exclusive (so they can be labeled as massive), 36% in the range of 0.95 to 1 (clearly exclusive), and only 17% are in the wide intermediate range of 0.05 to 0.95 (yellow dots in Figure 2). This pattern shows that there is not a smooth transition from the exclusive to the massive submarkets, and that real estate decision makers strongly divide their location choices according to these two submarkets. This pattern is coherent with the strong social segregation and inequality observed in Chilean society (PNUD, 2017).
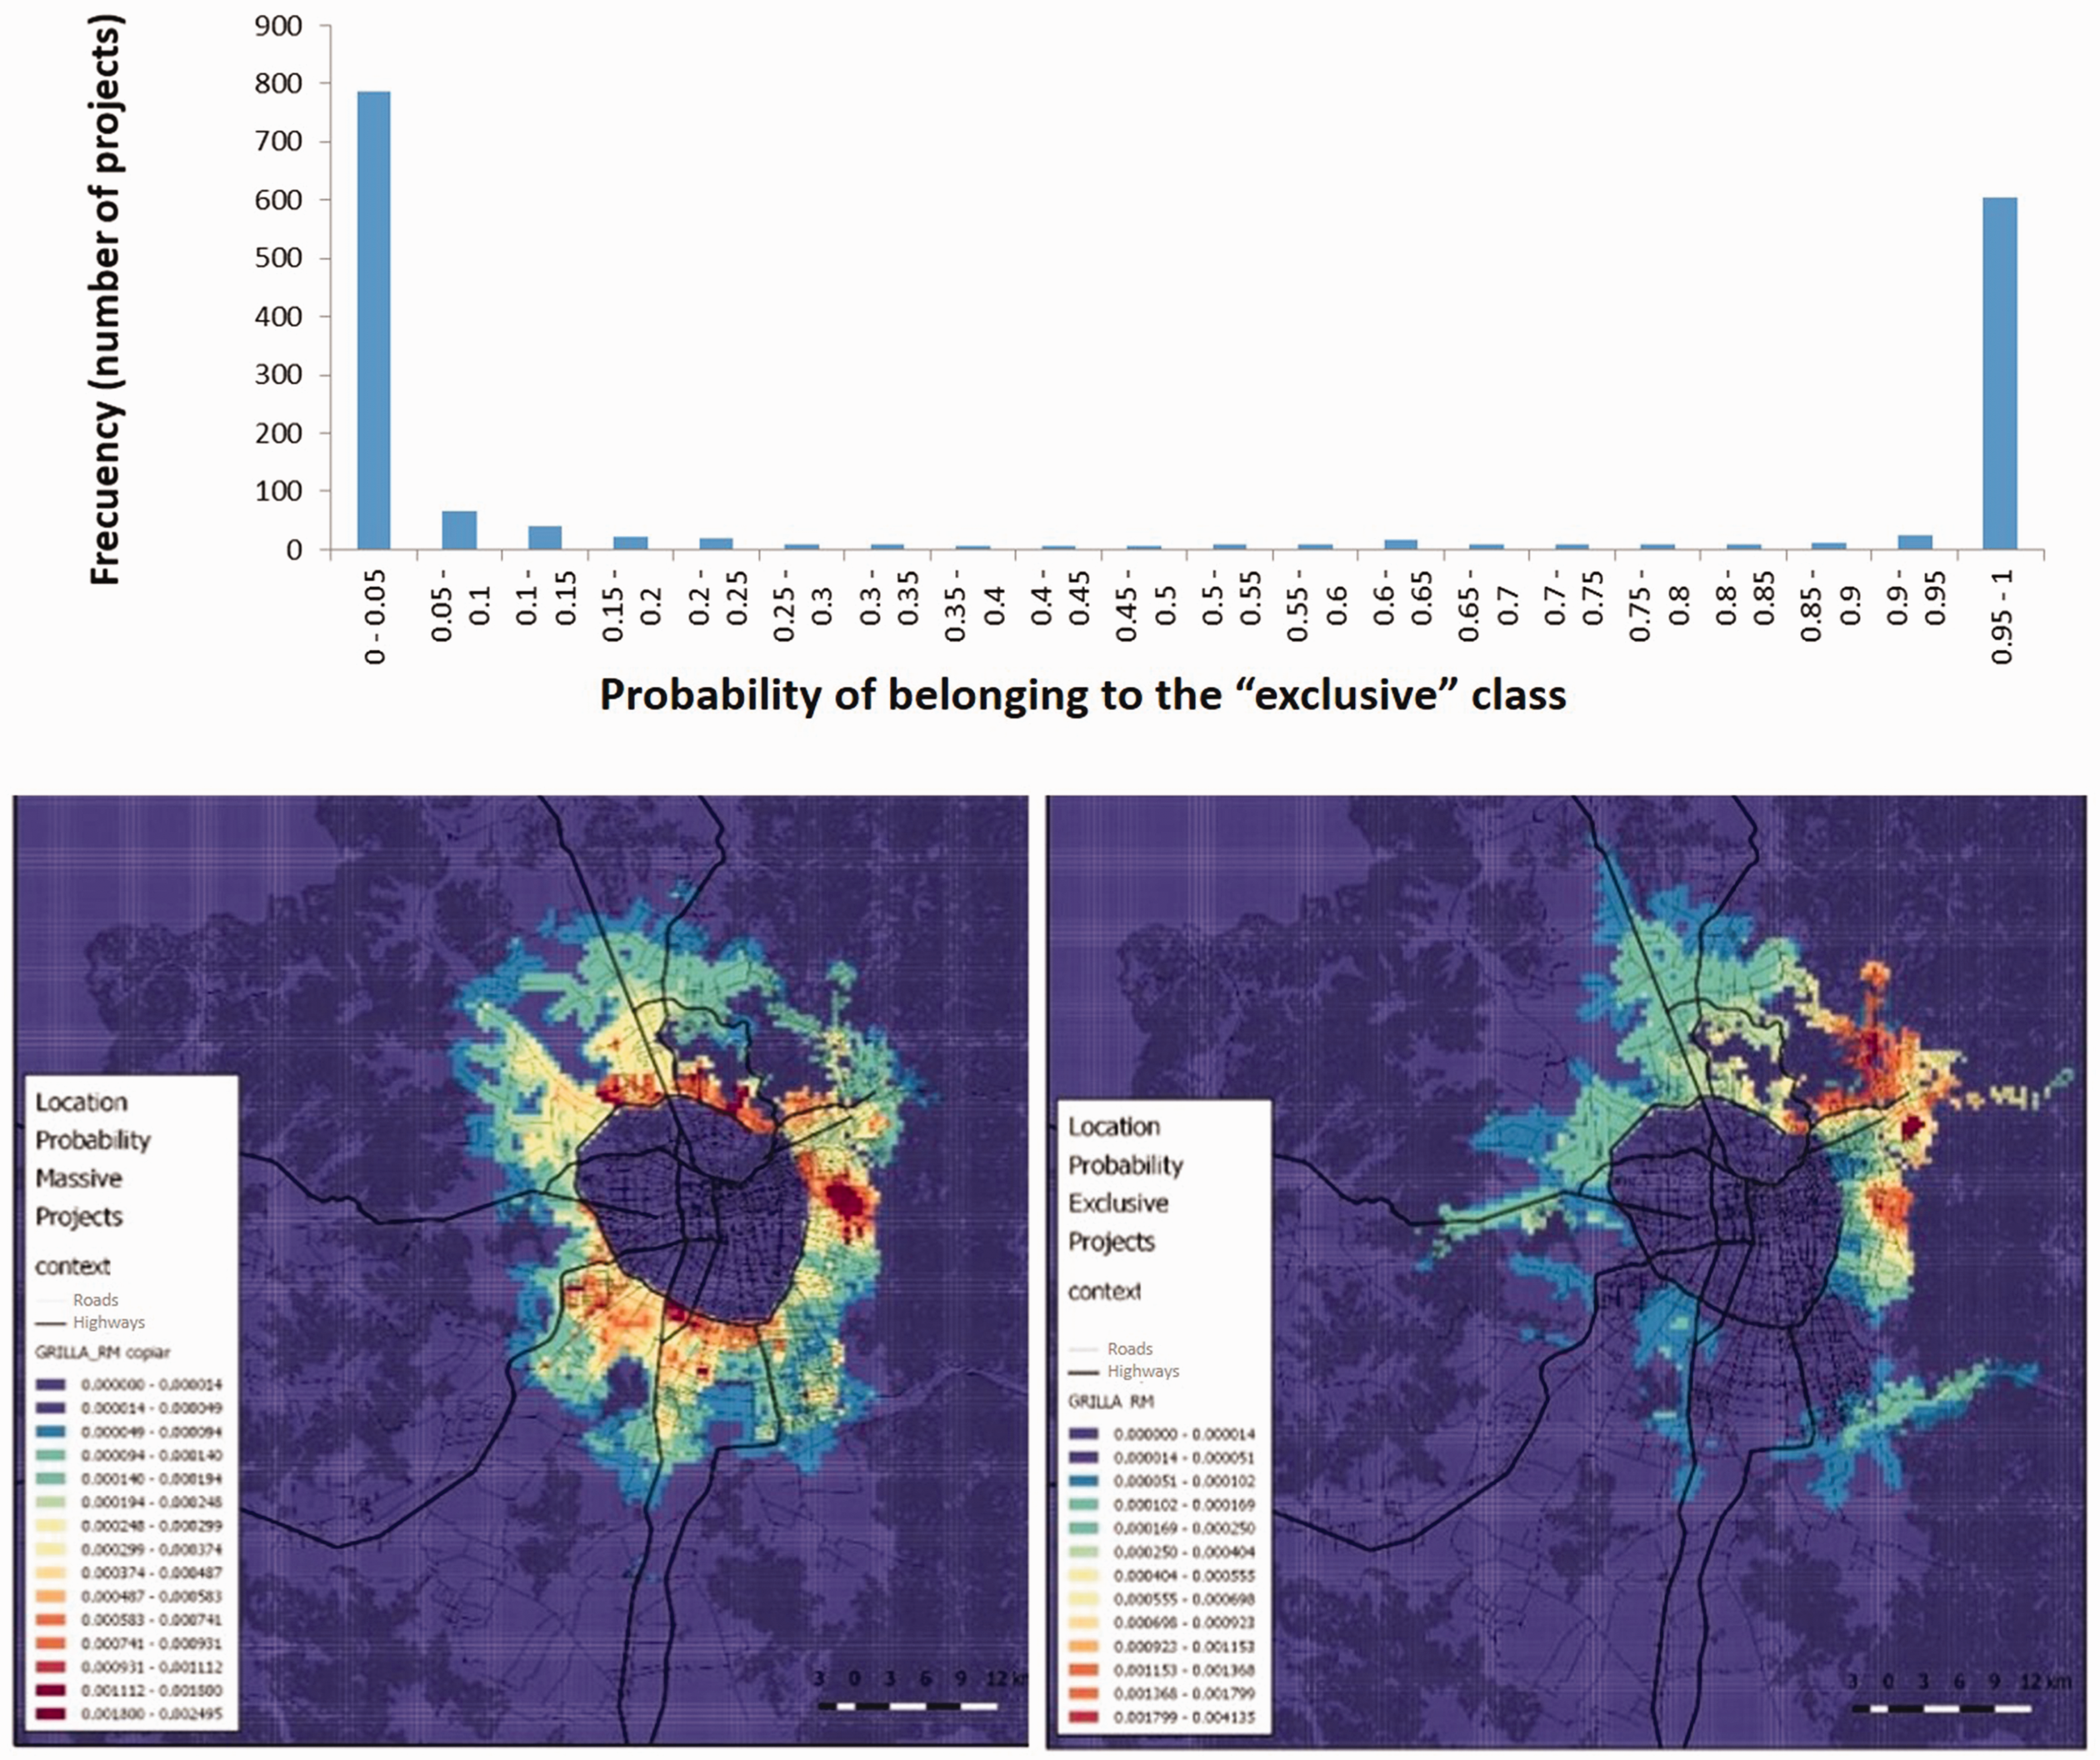
Histogram (top) with number of projects in each range of probability of membership to “exclusive” submarket. Spatial distribution of location probabilities for Massive (bottom left) and Exclusive (bottom right) projects.
The extreme segmentation of projects into submarkets, with very different location strategies, is a clear result of deregulation and market-oriented land use policies implemented in Santiago, something well discussed in previous literature (Borsdorf and Hidalgo, 2008; Cox and Hurtubia, 2016; Heinrichs et al., 2009). Loose regulations allowed developers to produce housing targeted at very specific segments of the population, differentiating their products not only through unit or project characteristics, but also through location.
Location elasticities to urban elements
We calculate the aggregate elasticities for location choice probabilities with respect to each location attribute conditional to each project class. Depending on the sign and magnitude of the elasticities, shown in Figure 4, the attributes can be interpreted as “attractors” or “repellers” of location for each submarket. All the distance or travel time attributes are attractors if their sign is negative.
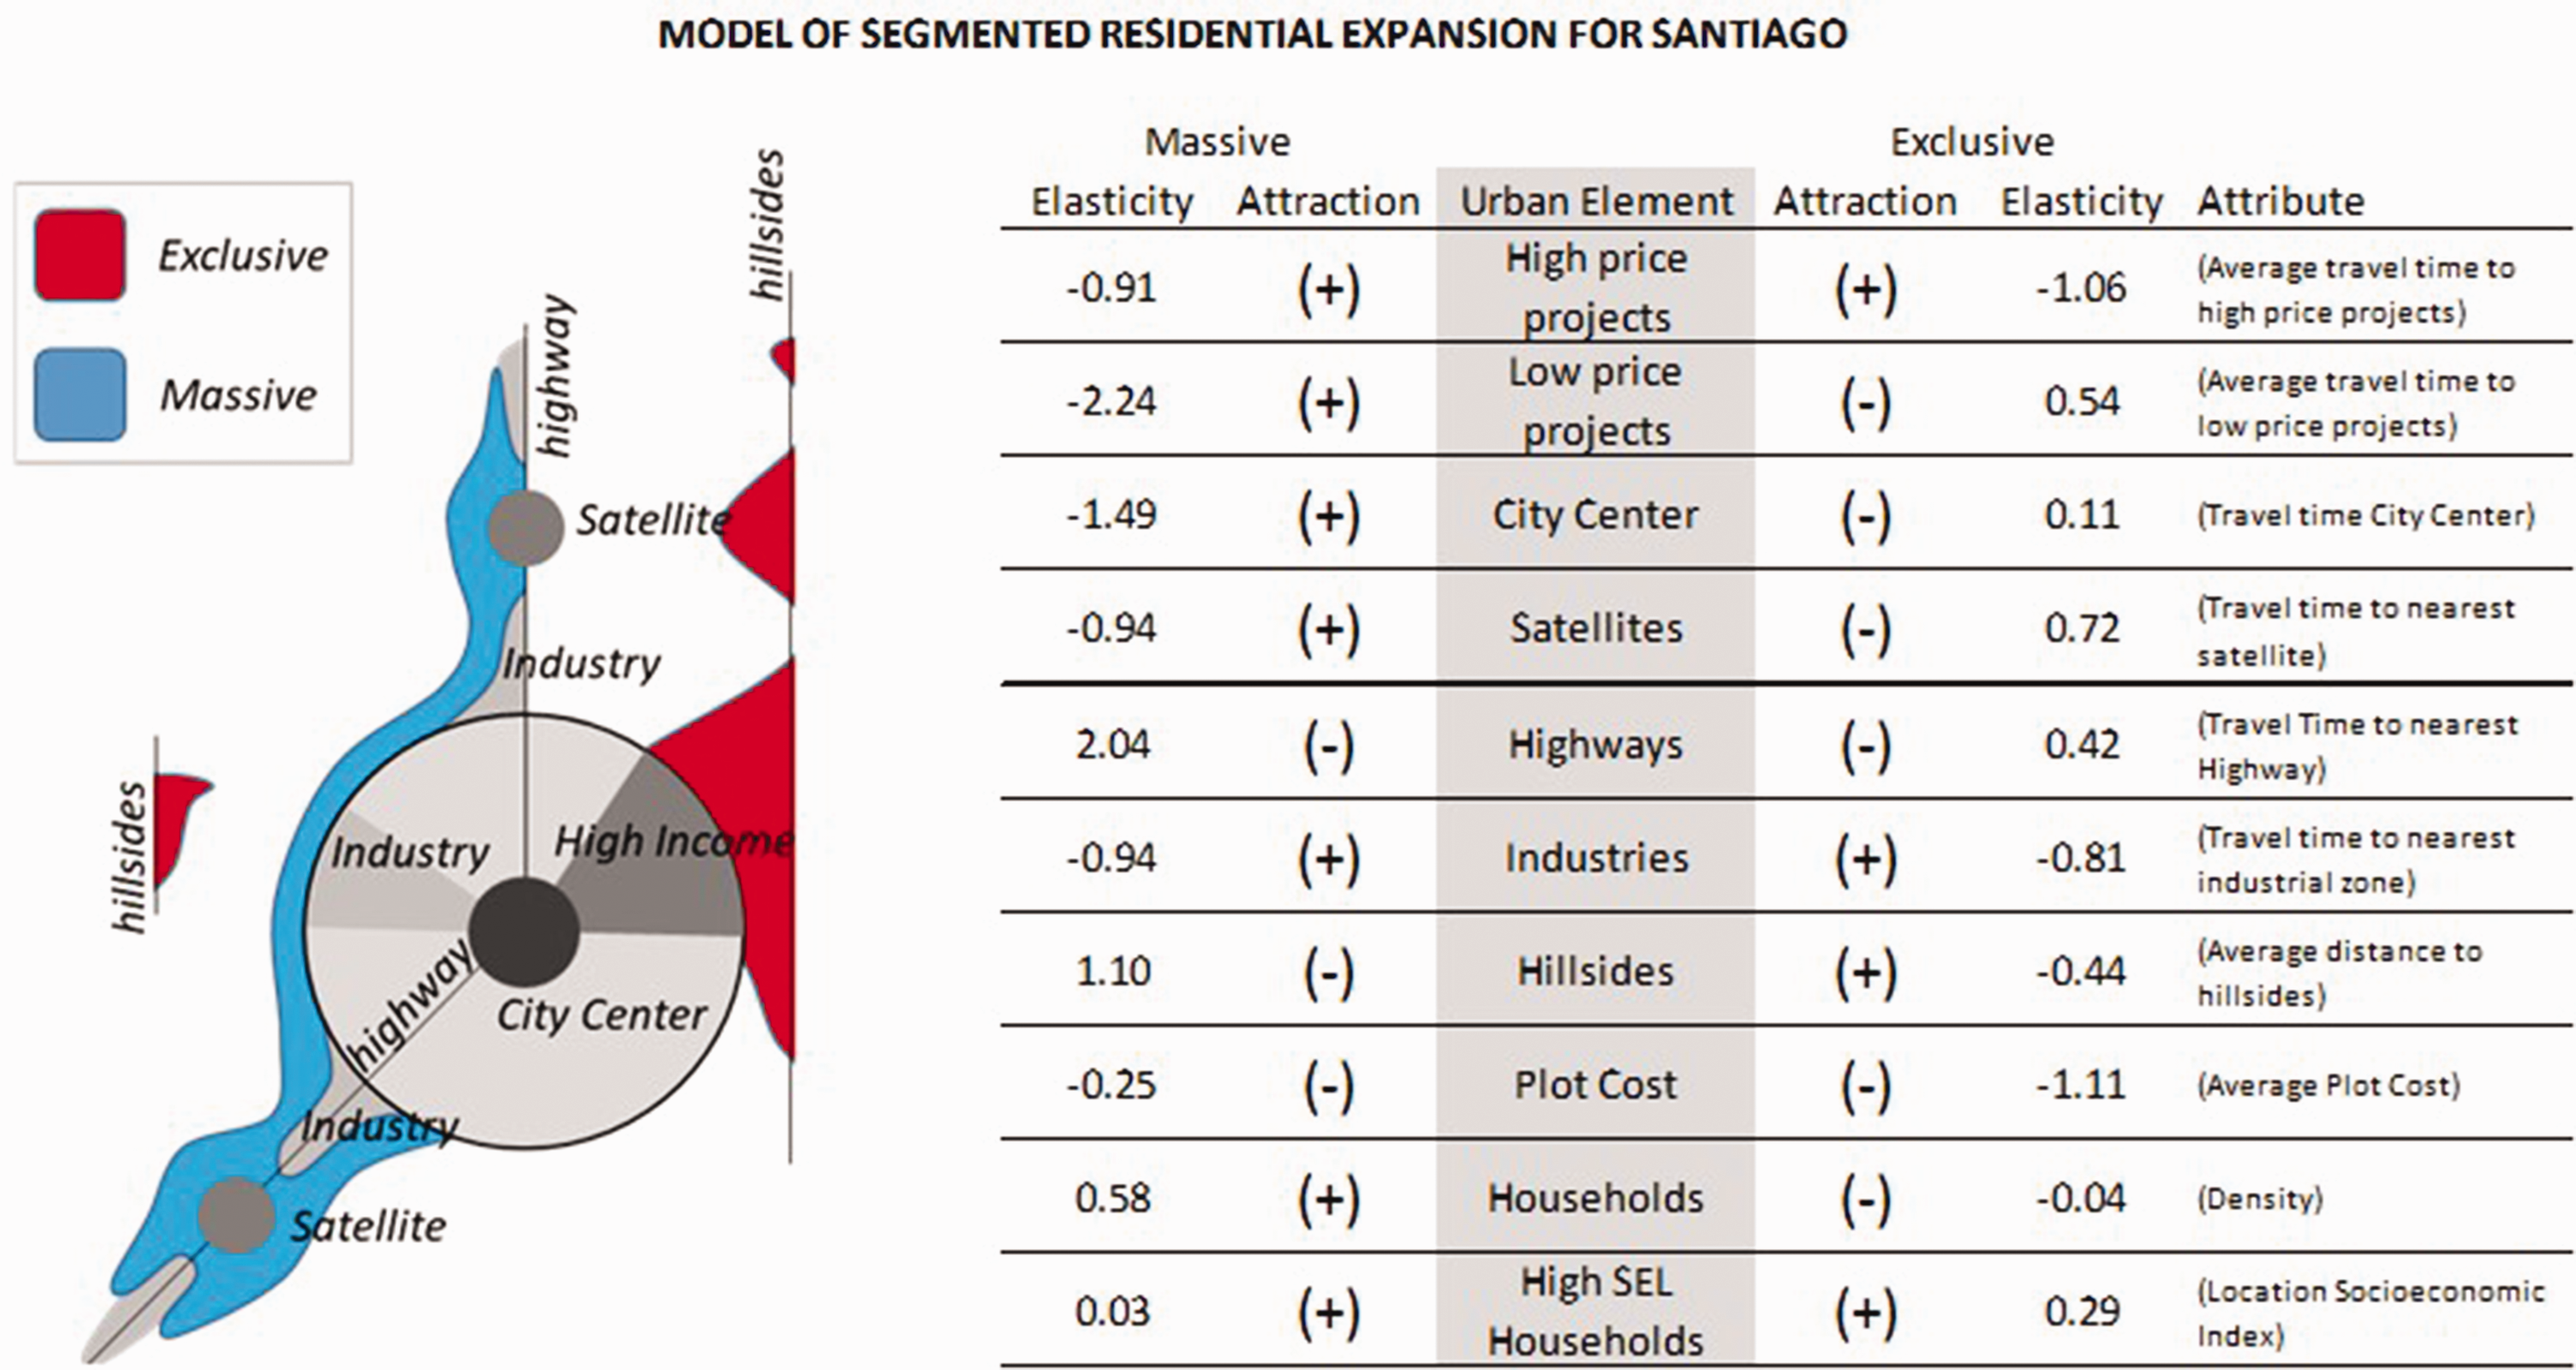
Diagram of location of projects according to attraction to urban elements (left), and related model elasticities (right).
The most relevant attributes attracting the location of “massive” projects are low travel times to similar projects, to the city center, and to industry areas. On the other hand, the most repulsive attributes for this submarket are low travel times to the nearest highway and closeness to hillsides. In the case of “exclusive” projects, the most relevant attractors are low travel times to similar projects and to industry areas. The most relevant attributes that make a location unattractive for this submarket are low travel times to satellite urban areas and high land costs.
In general, attributes related to accessibility play a much more relevant role in the location choice process than intrinsic attributes of the location itself (other than access). This quantification of “attraction and repulsion forces” for each type of project allows us to draw a schematic model of project-based urban expansion, which is shown to the left in Figure 4. This diagram represents two simplified location behaviors: while massive projects have a continuous and “attached” expansion from the city, exclusive projects expand mainly from the existing high income area in a “furtive” manner, or in isolated areas with their “backs against the slope”.
Conclusion
A model for location choice of real estate projects in expansion areas is proposed. The modeling framework makes it possible to simultaneously identify the parameters of a submarket classification function and the parameters of different expected price (and, therefore, profit) functions for each submarket, using a location decision model with latent class structure and, therefore, not requiring ex-ante definitions of market segments (although, the characteristics that are submarkets classifiers must be exogenously defined by the analyst). Thanks to a better representation of heterogeneity in the developers’ preferences, the proposed model outperforms a basic location choice model in terms of fit, simultaneously allowing for a better understanding of urban growth drivers.
Estimation results confirm there are two clearly different classes of projects in expansion areas of Santiago de Chile, according to their characteristics and location preferences. This reveals an inherent link between the spatial (location) and structural (unit characteristics) segmentation that emerges in the housing production process, given a developer that tries to find the most profitable location for a project of certain characteristics. This is consistent with the submarket definition proposed by Watkins (2001), which asserts that structural and spatial attributes are both relevant dimensions in the market segmentation of housing.
Among the main findings is the clear distinction between expected price/profit (and therefore location preferences) for both submarkets. The polarization of the market is also a relevant finding, showing that the great majority of projects (83%) belong to one of the two market classes with more than 95% probability. This seems to reflect segregation and inequality patterns observed in many other aspects of Chilean society, and it is mostly the product of deregulation and market-oriented land use policies (such as the “conditioned urban development zones” or ZODUC) which permit developers to target submarkets with large differences on their valuation of urban externalities and willingness to pay for spatial attributes.
Footnotes
Acknowledgements
The authors would like to acknowledge the support provided by CEDEUS (ANID/FONDAP 15110020), ISCI (ANID PIA/BASAL AFB180003), FONDECYT (project N°1180605), and the ANID PhD Scholarship for the corresponding author (2015–2019). The authors would like to thank Marcelo Bauzá from Inciti, and Transsa Consulting, for providing important data for this research.
Declaration of conflicting interests
The author(s) declared no potential conflicts of interest with respect to the research, authorship, and/or publication of this article.
Funding
The author(s) disclosed receipt of the following financial support for the research, authorship, and/or publication of this article: The authors would like to acknowledge the support provided by the Center for Sustainable Urban Development (CEDEUS, (CONICYTANID/FONDAP 15110020), the Complex Engineering Systems Institute, ISCI (CONICYTANID PIA/BASAL AFB180003), FONDECYT (project N°1180605), and the CONICYT ANID PhD Scholarship for the corresponding author (2015–2019).