



Abstract
Switzerland’s widely adopted spatial policy rejects the use of new land in favour of promoting the densification of existing buildings or brownfield developments. However, to date there has not been an assessment of the volumetric building reserves that are still available within the current building regulatory framework. This paper addresses this lacuna using a case study of the agglomeration of Lausanne. An automated spatial policy model with particular focus on building density and its volume in residential and mixed-use areas allows for building policy to be quantified, assessed and evaluated on a countrywide scale since it takes the location of the building lot into consideration and cross-references it with the correct building regulation. Three-dimensional comparison allows us to identify whether the maximum volume permitted under the building regulation is greater than the current existing building volume. For the test case, spatial policy model identified 38 hectares of available square metres for densification (‘building surplus’ in the context of existing buildings, either in the form of extending existing buildings or infill development) and 93 hectares of square metres available for new developments (brownfield development of vacant or derelict open land) of residential and mixed-use buildings. At the same time, almost all areas are allocated beyond Lausanne’s inner-city boundaries.
Keywords
Introduction
In Switzerland, the current population of eight million inhabitants is expected to increase to ten million by 2050 (Swiss Federal Office for Statistics, 2015b). Switzerland’s current building stock and the maximum building volume are not expected to be sufficient to accommodate the increased population (Rat für Raumordnung, 2019). Thus, three parallel routes of (i) urban densification of existing buildings, (ii) brownfield redevelopment and/or (iii) reconfiguration of zoning regulations to ensure adequate access to public transportation infrastructure are being promoted for the development of new buildings (Federal Council of Switzerland, 2019). This paper focuses in particular on the strategies of (i) and (ii), since strategy (iii) entails a longer procedure involving political instances and public participation, and where the outcome is by no means guaranteed. In the cases considered here, (i) is the horizontal and vertical extension of existing buildings as well as infill development (separate new buildings within such lots), and (ii) means the use of areas that have been designated as building land for housing, within the boundaries of both the current building and zoning regulations. Each of Switzerland’s 2356 municipalities draws up its own building and zoning regulations with their own format and specification; these regulations need to be reassessed to be able to evaluate the maximum volume of (i) and (ii).
To conduct such an assessment as a governmental institution, each individual lot needs to be evaluated manually in terms of the maximum buildable surface and volume. In other words, the correct building regulation for the correct zone in the correct municipality for the correct individual lot needs to be identified and manually drawn in a CAD software 1 framework. Until now, this task has been tremendously time-consuming and was prone to errors since its data format and specifications are not homogenised across different municipalities, nor is it automated and thus requires meticulous manual work to look up the correct policy documents, especially for a large-scale multi-municipal context. The output produced mostly relates to just one municipality or one specific zone. It is also not visualised as a three-dimensional (3D) representation, but rather remains a two-dimensional plan drawing, or indeed merely a simple figure of potential square metres available for the given lot. 2
The first objective of this paper is to develop an automated spatial policy model (SPM) within a dynamic framework that is capable of simulating the maximum building volume of a large number of building policy requirements within a reasonable computing time, to superimpose and identify municipal and cantonal locations of building lots with regulatory zoning requirements over a large geographic extent (ranging from a single building lot to a whole agglomeration), in a 3D spatial visualisation framework, and compare this to the existing building stock in 3D. This method is allowing for quantification of the impact of spatial policies on the build environment. Due to Switzerland’s current migration trend, particular focus has been placed on residential and mixed-use surfaces within (i) and (ii). In short, the novel method allows for country-scale building policy analysis and evaluation, since it takes the location of the building lot into consideration and cross-references it with the correct building regulation.
As a second objective of this paper, the multi-municipal agglomeration of Lausanne was chosen to test the model being developed. This specific agglomeration was chosen because it is one of the main urban centres and one of the biggest urban areas in Switzerland. This is especially apparent in the city of Lausanne, which has experienced a population growth of 17% over the last 10 years (2007 to 2017) (Swiss Federal Office for Statistics, 2018). Compared to other Swiss cities, this is the highest relative population growth during this period. By 2030, the agglomeration of Lausanne predicts official population growth of 20,000 inhabitants for the city centre and 80,000 inhabitants for the agglomeration as a whole (Service du Développement Territorial – SDT, 2016). The current building volume of the city of Lausanne will reach its capacity by 2022 (Marini et al., 2019), meaning that the current building stock of the agglomeration of Lausanne will not be able to accommodate the population growth of 80,000 inhabitants by 2030. This initial situation requires a revaluation of the potential additional building volume and capacity in residential and mixed-use zones within (i) and (ii) scenarios to identify its location and quantify its surface area and volume.
A cost-benefit comparison is made between the proposed SPM methodology and a classical approach used by planners and their tools from the field of Geographical Information Systems (GIS), see Table S1 in the Supplemental material. This analysis shows in particular the need for a 3D SPM and the capabilities that differ in both methods; similar costs such as the manual digitalisation of building regulations as well as similar benefits such as country-scale assessment are not mentioned.
Literature review
Building regulations are defining building densities within the Swiss context. To be able to quantify density, Angel et al. (2016) and Narro et al. (2020) suggest breaking up its components into crowding, building height and residential coverage. In the case of the building volume for residential surfaces, particular focus has to be given to the building height (building volume) and the residential coverage (available residential surfaces). At the same time, the roof geometry and its volume are missing in this definition. The crowding aspect (ratio of the number of people occupying a residential surface) is used by Marini et al. (2018, 2019), who deploy a SPM as input.
Dewi et al. (2015) and Zhang and Schnabel (2017) show an initial simplified and micro-scale approach to automating the calculation of certain building regulations in the context of the consolidation of multiple building plots and developments. Kim (2014) has developed an extended automated building-regulation model, which, however, remains very much on the micro-scale and evaluates each individual building lot. Gilgen and Walczak (2017) used a Swiss context to visualise the different impacts of policy changes on the built environment in one specific Swiss municipality, and Schaller (2018) showed the complexity, the potential and the replicability of the use of parametric building regulation models in a small-scale Swiss context, albeit with just one specific municipality and one chosen building regulation. De Monchaux (2010) uses a large-scale assessment of building lots not from the regulatory perspective, but rather from the site specifications and qualities including soil type, microclimate, crime and slope.
The classical approach to modelling the impact of spatial policies on the built environment relies on focusing on one specific municipality (Gilgen and Walczak, 2017; Schaller, 2018), one specific building zone (Dewi et al., 2015; Zhang and Schnabel, 2017), one specific building typology/shape grammar (Kunze et al., 2012), the more intensive use of existing buildings (Bibby et al., 2020), or the total number of potential inhabitants on a building lot without considering the building form/design guidelines (Efthymiou et al., 2013). All of these models addressed one specific set of policy requirements and are standalone models that are not integrated into a wider holistic framework. The classical approach for using parametric models in urban planning is very much focused on the automation of large-scale plan layouts based on a few density indicators (Beirão et al., 2012). Despite this, the startup ‘Spacewalk’ (Spacewalk, 2019) developed an online interface called ‘Landbook’ (Landbook, 2019). This interface shows an initial approach to large-scale simplified building-regulation implementation focusing on the real-estate market development in the context of the city of Seoul. Simplified building regulations here means the basic design of the building with the area/footprint and height allowed within the building code (Wook, 2018). Since Korea is one of the first countries to be harmonising all of its spatial policies into a machine-readable format (Lee et al., 2015), technology automation such as ‘Landbook’ (Landbook, 2019) or automated building permit systems (Kim and Lee, 2016) are being developed.
To date, 3D city models have predominantly been used for visualisation purposes. Their potential is now being increasingly exploited across different domains and for a large range of tasks beyond visualisation (Biljecki et al., 2015). However, 3D models in general are still rarely used in spatial planning and have not yet been fully explored in the research community (Bieda et al., 2020; Bydłosz et al., 2018). Nevertheless, the technique could have huge potential for studies such as view/visibility, flooding, ventilation and air quality analyses, or public participation in the creation of planning documents (Bieda et al., 2020). This conclusively demonstrates the insufficiency of the traditional approach to spatial planning in 2D (Bydłosz et al., 2018). Ahmed (2017) points in particular to the increased efficiency the use of 3D models affords spatial planners: certain buildings that critically exceed the regulatory framework could be identified more quickly. 3D models could even support a more immediate analysis of the results and the impacts of transformations on urban environments (Morosini and Zucaro, 2019).
The novelty of this current approach is the automated large-scale multi-municipal assessment of multiple complex building policies within residential and mixed-use zones. It does not cover zones that are exclusively dedicated either to services, retail, offices, or industry. The output can either be quantitative in the form of three-dimensional maximum square/cubic metres, comparative to the current Swiss building stock; and also qualitative in the form of 3D visualisations of building form within its context.
Methodology
Case study
Lausanne was chosen as the case study since it is the fastest growing urban agglomeration and one of the biggest cities in Switzerland. It has experienced a relative population growth of 17% over the last 10 years (2007–2017) (Swiss Federal Office for Statistics, 2018) and is ranked fourth compared to the population size of other Swiss cities (Swiss Federal Office for Statistics, 2018). Lausanne is in the Swiss canton of Vaud on the shores of Lake Geneva. It is significant that in its current regulatory framework the city of Lausanne has only left itself resources for additional building volume until the year 2022 – based on current migration trends (Marini et al., 2019). It can be observed that the canton of Vaud’s regulatory frameworks for the built environment is especially complex compared to other Swiss municipalities. Furthermore, Lausanne and its agglomeration expect future growth of 100,000 inhabitants by 2030. Comparing absolute population growth between 2007 and 2017, it is apparent that the governmental bodies are extrapolating past growth in a linear fashion up to the year 2030. In contrast to the official data, Marini et al. (2019) identified a population growth of approx. 55,000 by 2035 as the average of all three scenarios simulated in this study. The agglomeration of Lausanne is made up of 30 different communes including the city of Lausanne itself (see Figure 3). Where necessary, the city may be further distinguished from the agglomeration itself in the text.
Spatial policy model
In this work, the agent-based simulation framework ‘EnerPol’ is extended by an automated dynamic SPM (see Figure 1), which simulates the individual building regulations for each building lot in each municipality within each building zone on a nationwide scale. Particular focus is placed on residential surfaces, which does not exclude additional mixed-use functions such as services, retail, offices or industry (see all zones under consideration in Figure 3). ‘EnerPol’ has been in development since 2009 and is a bottom-up simulation framework that is used for scenario-based assessment to support decision-making for policy makers, developers of energy and transportation infrastructure and urban planners. More details of ‘EnerPol’ and the agent-based population model and the agent-based, multi-modal, queue-based traffic model with which this SPM is coupled can be found elsewhere, Marini et al. (2018, 2019) and Saprykin et al. (2019); however, for the sake of completeness, salient features of this population and traffic model are included where necessary.

Schematic of the dynamic spatial policy model that is integrated into the EnerPol framework.
Building regulations from the commune of Ecublens (VD): this specific example shows schematically the ‘Zone d'habitation moyenne densité’ (Medium density housing area) on the left and the ‘Zone du village’ (historical centre area) on the right and how the spatial policy model interprets this.
Since building regulations across Switzerland and their respective impact on the potential future building footprints vary substantially, it was necessary to implement an extended SPM within the ‘EnerPol’ framework. To calculate the maximum building footprint, planning documents such as the zoning plan, cadastral plan and municipal boundaries must be used. As the building regulatory data per commune is not standardised, this regulatory data must be manually standardised for use in the SPM as well as in the ‘EnerPol’ framework. Thus, for all lots of a given site for analysis, the extended SPM automatically: (a) identifies the location of a specific lot, the specific building zone in which the lot is situated, and the municipality associated with the lot; and (b) models the maximum building envelope in 3D with all key specifications with the correct building regulation for the specific commune and zone.
Data
In the following section, we describe the data sources required to perform such a spatial policy model: Cadastral data includes the precise geo-located geometry (polycurve) of each of the building lots and if applicable, its respective building footprint geometry in the Lausanne agglomeration (see Figure 3). Zoning regulation includes the precise geo-located geometry (polycurve) of each of the different building zones with its specification such as residential area (high, medium and low density), industrial area, historical centre, intermediate area, peripheral area, etc. (see Figure 3). Each of the different zones has a respective building regulation requirement that differs in each of the municipalities of the agglomeration of Lausanne. Building regulations are very complex, as shown and visualised by Grams (2015). In the case of Switzerland, building regulations are not homogenised, which means that each municipality has its own data format. Most of the data is not yet digitised or is merely provided as text and/or graphic descriptions in the form of a PDF file (see Figure S1 in the Supplemental material). Building regulations include information about the minimum distances from the lot border, maximum building heights, roof geometries, minimum building distances, building programme, maximum building length, maximum building footprint, floor area ratio (square metres of all floors of the particular building divided by the square metres of the corresponding building lot), distribution of residential surface area in mixed-use areas, etc. To be able to use this information in an automated manner, the data had to be manually converted and homogenised into a machine-readable format. A table with columns distinguishing all building regulatory requirements and corresponding rows with all communes and their zones was developed (see Table 1). Not all zones have the same specifications, in which case the cell is left empty. Since the output of the SPM is in 3D, it enables a detailed comparison of the current built environment with the potential future built environment provided by the SPM (see step 8 in Figure 2). The current building stock is represented using the building and apartments register from the Swiss Federal Office for Statistics (2015a) dataset. This dataset includes the current number of floors for each building footprint and its roof geometry. With this information, it is possible to derive the potential growth in cubic metres of building volume in the current building regulation in comparison to the existing building volume in cubic metres. Nevertheless, it is important to maintain that the square-metre indicator is as important as the cubic metres, especially when speaking about densification in residential and mixed-use areas. People measure living space in square metres rather than cubic metres, and some buildings have for example a rather high volume in cubic metres but low surface area in square metres because of high ceiling heights. Industrial areas might benefit from cubic metre measurements for example due to storage areas, etc.
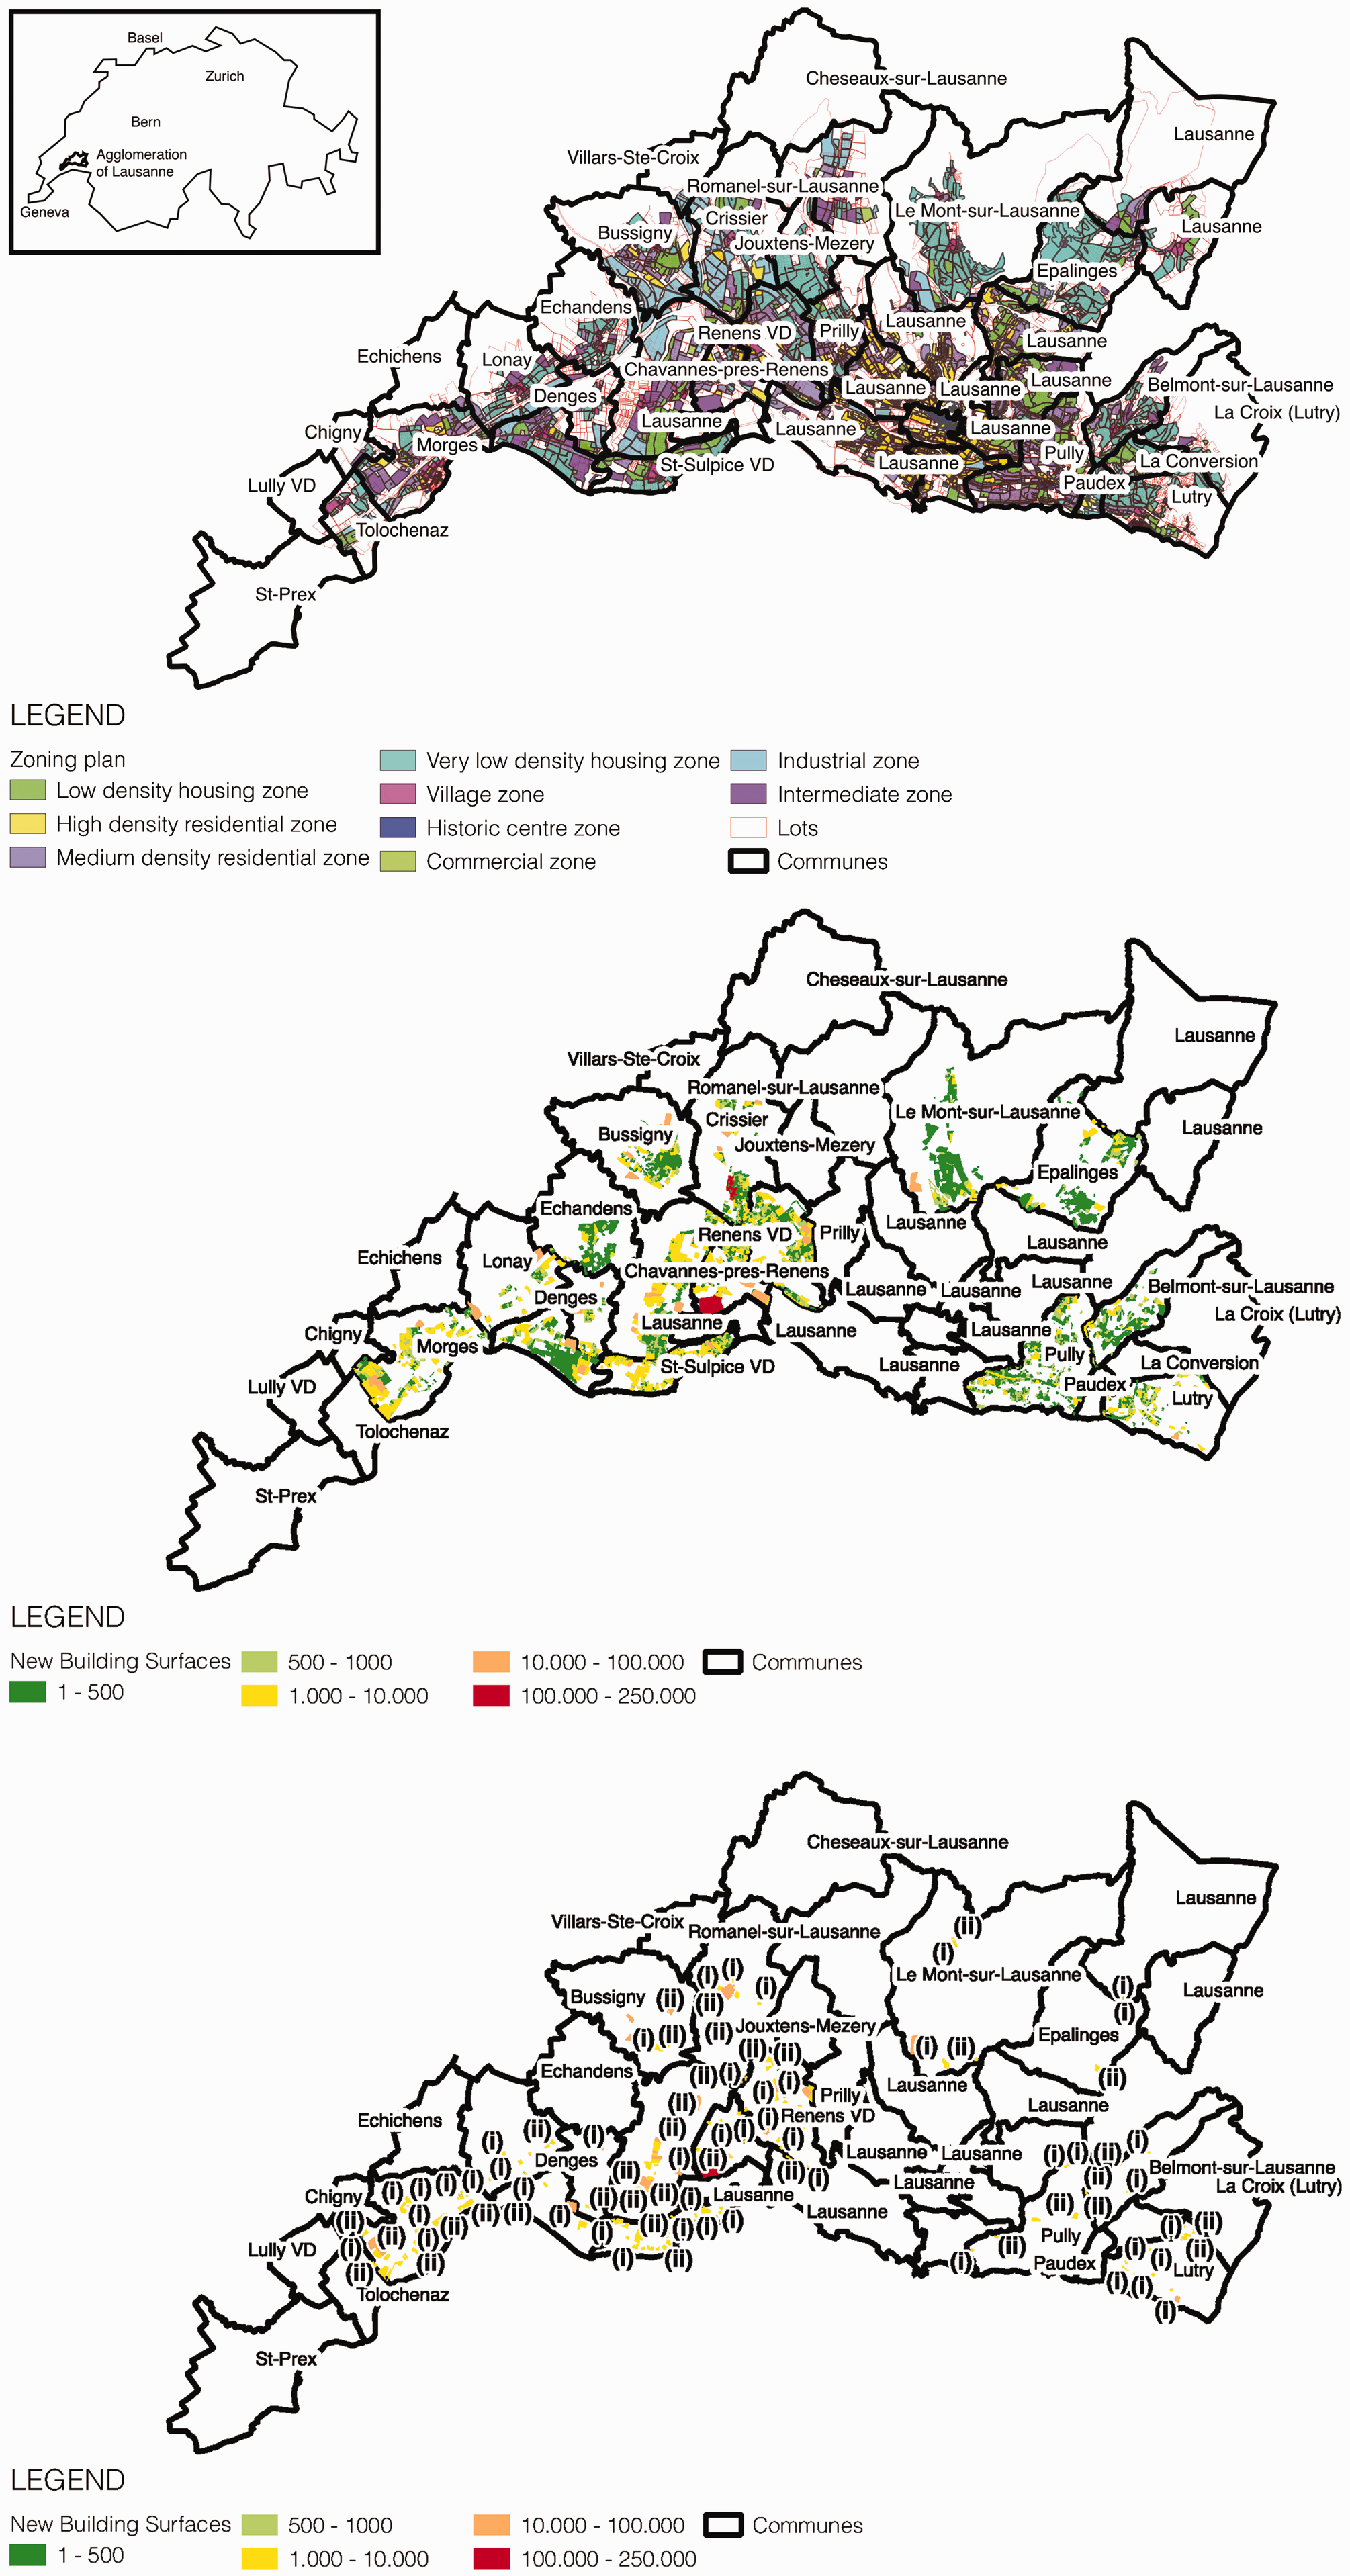
Top: All communes, lots and selected zones in the whole agglomeration of Lausanne (data provided by Administration Cantonale Vaudoise (2017, 2018)). Each individual lot has to be superimposed on the 30 different communes each with nine different zones to identify the correct building regulation. Center: All 7.945 identified building parcels and their respective size of development in m2 in residential and mixed-use zones. Bottom: Filter of 256 reasonable and meaningful building parcels, their respective size of development in m2, and development type (i) and (ii) in residential and mixed-use zones. The inset shows the location of the focus area in relation to Switzerland’s cities.
Sample table (machine readable conversion) of the building regulations from the commune of Ecublens (VD). The column in grey shows a sample of the translation from the original building regulatory document provided by the commune in the form of a PDF file, see Figure S1 in the Supplemental material.

Model
This research developed a ‘definition’ within the object-oriented programming and parametric software ‘Grasshopper 3D’ (Robert McNeel & Associates, 2017a, 2017b) for ‘Rhinoceros 3D’ (Robert McNeel & Associates, 2017c) since it allows for large-scale geometric data analysis and geometric calculation. The advantage of this framework is the automation, scalability and replicability of such analyses to other locations in contexts that provide the necessary data mentioned above and the direct application into architectural and urban planning frameworks. Since each commune has a variety of different zones that consider different building policies and regulations, the first step entails the matching and superimposition process. Before being able to compute the maximum building surface area according to the building regulation, each building lot is assessed within the zoning and commune boundaries in which this specific lot is allocated and cross-referenced with the respective building policy (see Figure 3), which for instance the method of Schaller (2018) did not take into account. This method enhances the ability to use this framework for any kind of Swiss context with the same data availability.
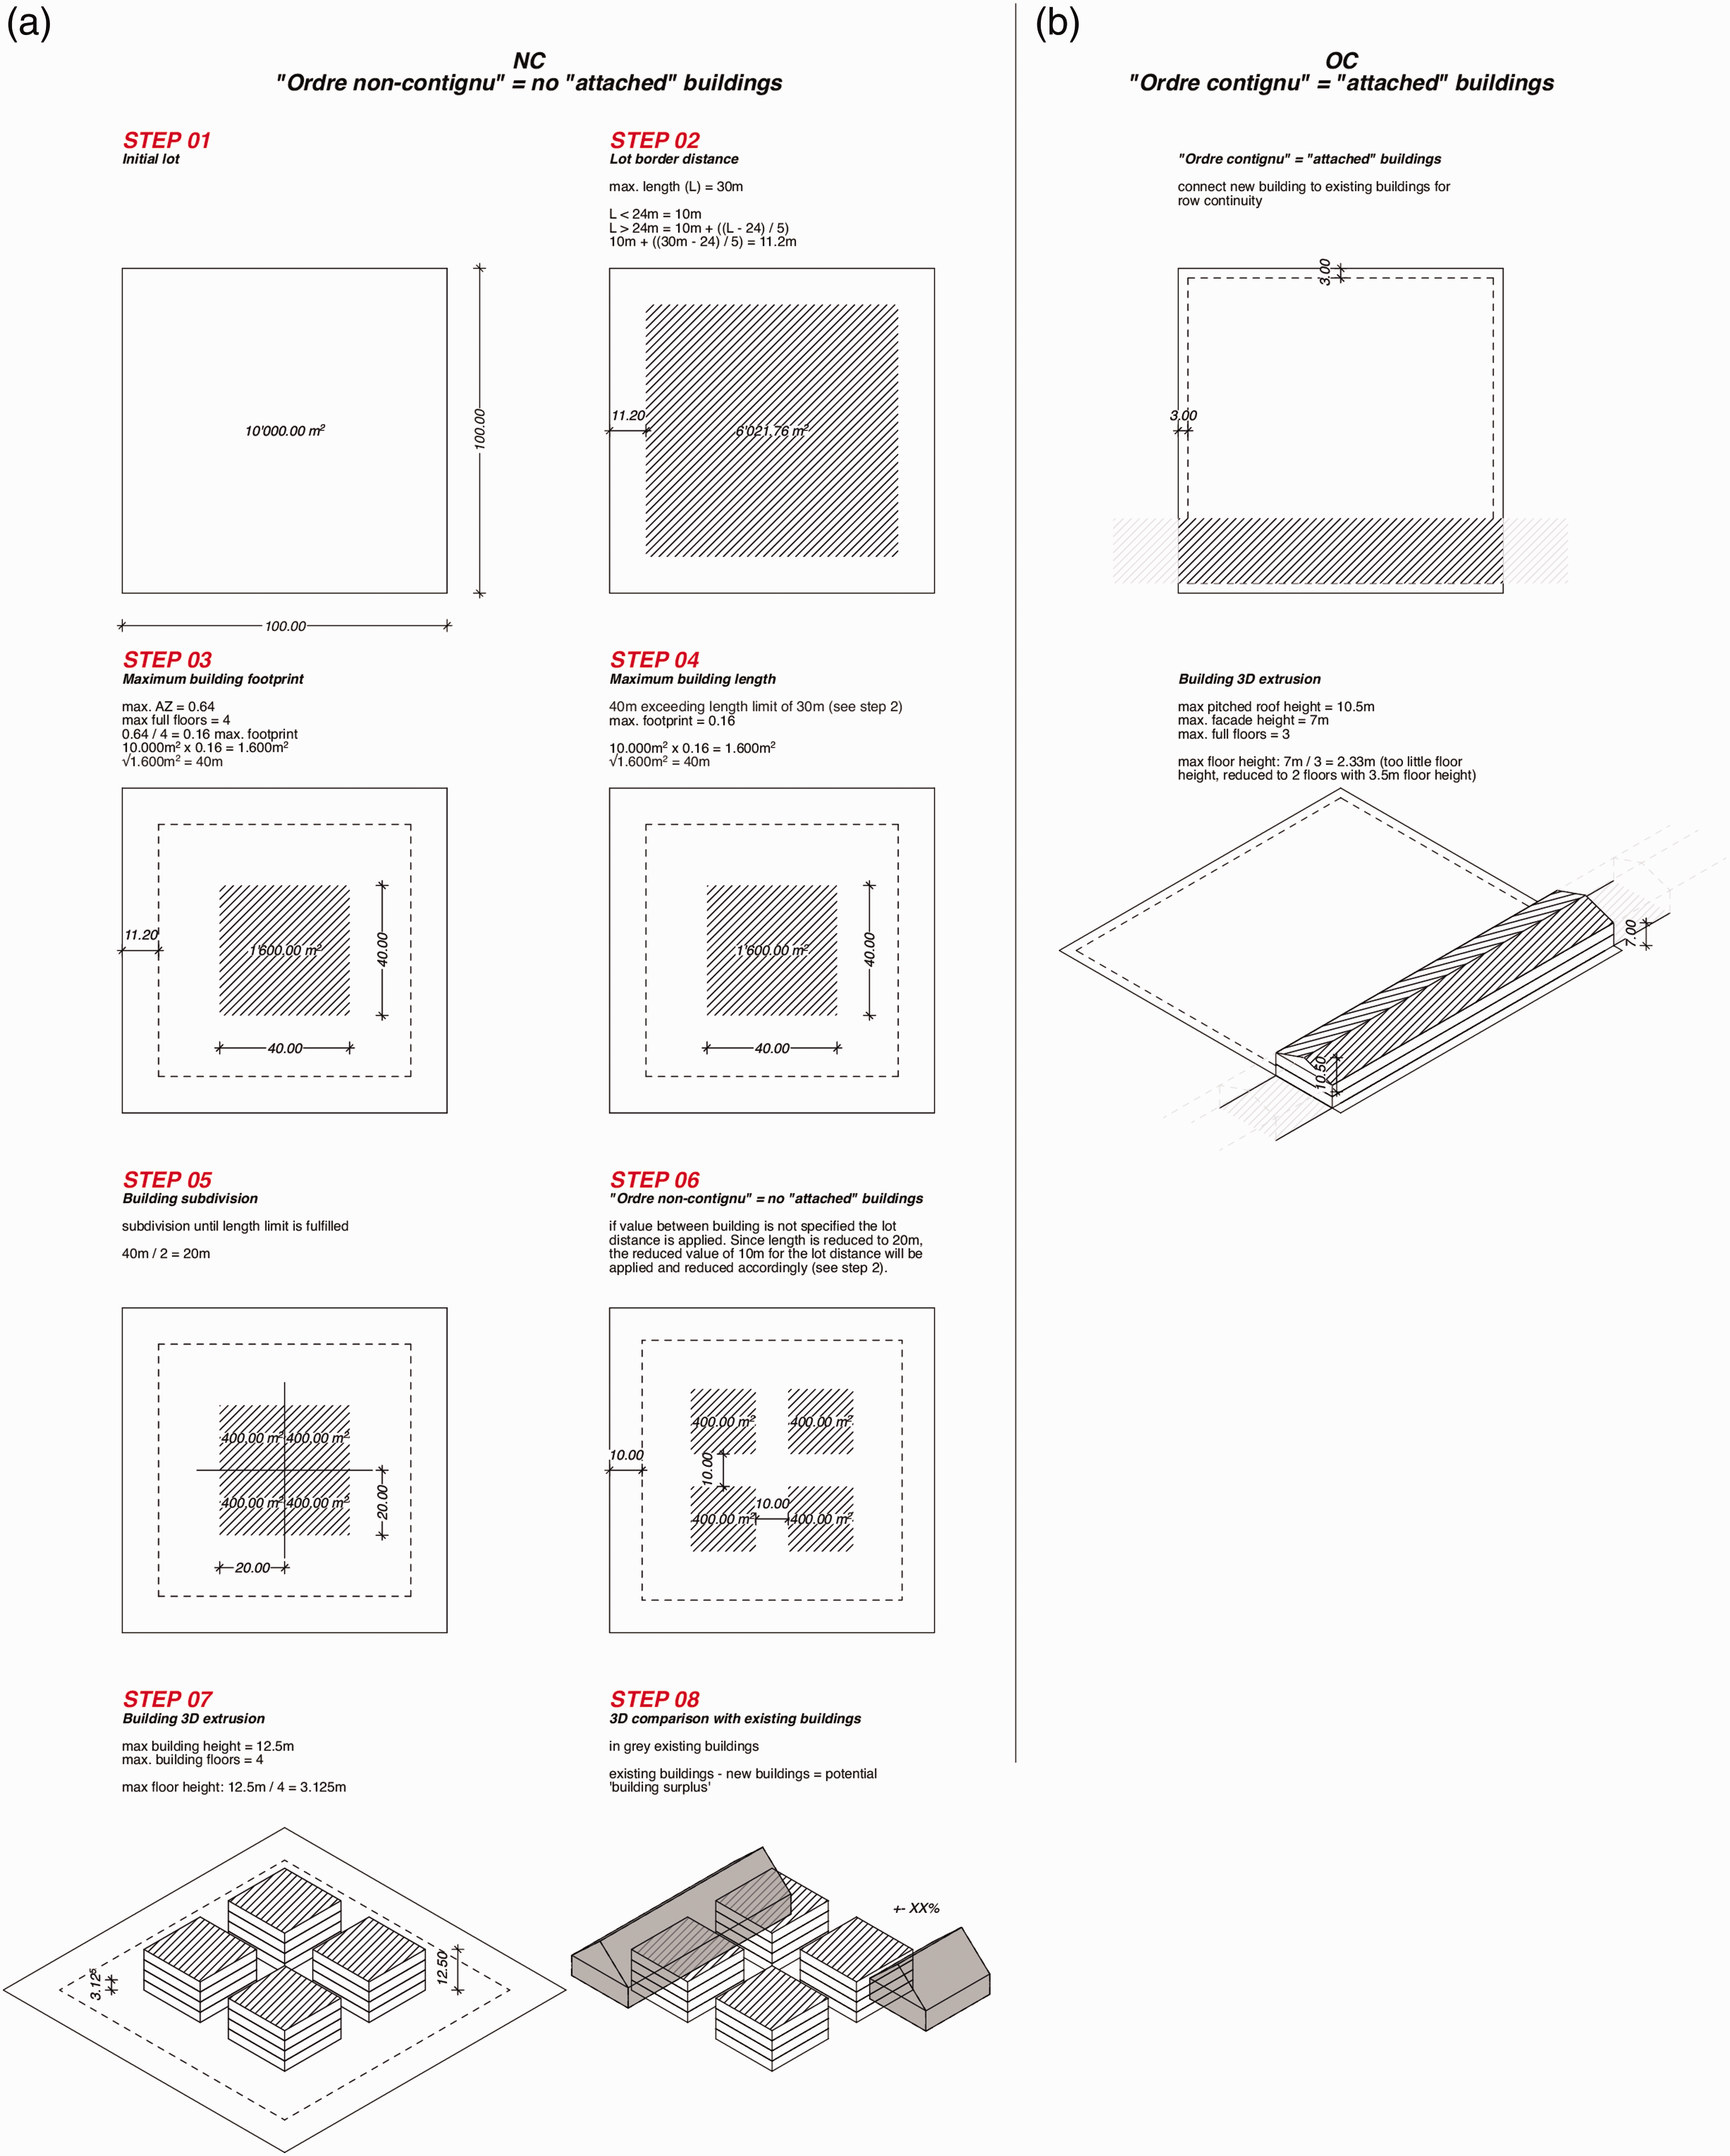
As soon as the correct building regulation for the building lot is identified, the model proceeds with the actual geometrical calculations. We need to bear in mind that the calculation of the final geometric solution for the specific lot (see step 1 in Figure 2) is designed in an iterative loop since many of the policy requirements are interlinked. Small changes in the building geometry can affect all policy requirements and so forth.
The initial stage is to determine the correct lot border distances, bd (see step 2 in Figure 2). Most of the building regulations distinguish between several values for the border distance. The first is the identification of the ‘long-distance’ border. The ‘long-distance’ border in most cases is determined on the one hand by the most southerly area of the lot, to provide high-quality outdoor spaces for the residents and to not cast shadow on neighbouring buildings (which also points to the necessity for a 3D representation of the building regulations). Depending on the building regulation, ‘long-distance’ border can also be determined using the longest edge in comparison to all the other building lot edges. In this case, it is important to measure each edge of the building lot to automatically assign the correct lot border. The ‘long-distance’ border is distinguished from the ‘short-distance’ border in that it is normally one-third longer than the ‘short distance’ border. Conversely, the ‘short-distance’ border is used for all other lot edges excluding where the ‘long-distance’ border was identified. The second significant factor for the border calculation depends on the maximum length, ml, of the building, which is normally specified in the building regulations. If not, it depends on the geometry of the building lot and its border distance calculation. The following two equations can be produced for the initial stage

The second stage involves the calculation of the maximum building footprint which must stay within the boundaries of the previously calculated lot borders (see step 3 in Figure 2). If the building regulations specify the floor area ratio,
3
az, then we need to take the amount of full floors, ff, into consideration (excluding underground floors and roof/attic surfaces). This will allow us to calculate the maximum footprint, mf, with which we can determine the length, l, of a potential volume
We can use the value l for an iterative comparison with the maximum building length value ml (see step 4 in Figure 2). If this value exceeds the value in the building regulation, the building length needs to be adjusted. Either the length needs to be decreased or the building mass needs to be subdivided into smaller building units (see step 5 in Figure 2). In the case of subdivision, the regulation requires a specific minimum distance between the buildings (see step 6 in Figure 2). Again, the smaller building units would need to stay within the boundaries of the computed lot borders. To extrude the buildings into the Z-axis, the building regulation offers the maximum building height, bh, and the maximum building floors, f, which will determine the floor height, fh (see step 7 in Figure 2)
The French-speaking part of Switzerland includes a unique parameter called ‘Ordre contignu’ (see ‘a’ in Figure 2) and ‘Ordre non-contignu’ (see ‘b’ in Figure 2), which literally means ‘attached’ and ‘detached’ buildings. The ‘attached’ buildings policy allows existing buildings to be adhered to without considering the lot border distances. This case is especially apparent in zones of historic areas or city centres.
There are two options to consider with respect to the roof implantation: the attic or the pitched roof. The building regulation provides a setback value of the building footprint geometry for the attic roof. The regulation stipulates the roof ridge height and the maximum façade height for the pitched roof. These two values and an additional curve parallel to the long-sided edge of the building footprint – which is being extruded to the roof ridge height – can be used to compute the pitched roof geometry.
Results
Additional building surface of approx. 131 hectares available for housing development outside of Lausanne city boundaries
A total of 29,914 parcels in 30 municipalities within the whole agglomeration of Lausanne were processed by the SPM. A total of 7945 building parcels were identified within residential and mixed-use zones, with a sum of approx. 600 hectares (6,095,368 m2) of potentially developed building surface (see Figure 3), in order to identify and filter 256 reasonable and meaningful building lots for future development (see Figure 3). Filtering in this case meant considering the aspect of feasibility in architectural terms, i.e. very narrow building lot and/or building volume is exactly the same or less than the current building volume on this specific building lot. This results in an additional densification of 381,034 m2 in (i) and 933,114 m2 in (ii) (see Table 2). The additional densification is calculated by subtracting the current existing buildings from the maximum building surface within the building regulations identified by the SPM. The current building regulations for the whole agglomeration of Lausanne mean the acquisition of between one to a maximum of five floors. Nevertheless, the potential of additional densification of ∼38 hectares in (i) urban densification of existing buildings is still significant. In case of political decisions not to take greenfield or brownfield redevelopment into consideration, the potential is still significant.
Summary of processed building lots according to current building regulations. Results compared with the actual building volume in order to identify the additional densification potential in residential and mixed-use zones.

The City of Lausanne is already close to its maximum capacity. Almost no more new surfaces for development and/or densification can be built on under the current building policies in the absence of either re-zoning or conversion of industrial buildings – excluding refurbishment and/or optimisation of current residential layouts. The impact and potential for densification is more pronounced in the periphery of the agglomeration than in the city centre, which brings the agglomeration of Lausanne into the development spotlight. Exemplarily, 59 potential building lots were identified in the municipality of Morges that could be developed either for (i) or (ii). Eleven potential building lots were identified in the municipality of Pully. In contrast, a densification coefficient (ratio of the current existing buildings to the maximum surface that could be built on within the current regulatory framework: current state in m2 divided by the maximum m2 permitted under building regulations) of just 0.12 (see Table 3) was measured in Morges, whereas a higher densification ratio of 0.14 (see Table 3) was assessed in Pully. This is due to the reassessment of the building regulations of the municipality of Pully, which accounts for the need to accommodate the population increase in the coming years.
Comparison between the maximum building volume under the current building regulations and the current state of buildings for the municipalities of Morges and Pully in residential and mixed-use zones.

100-Fold improvement in speed
In any type of Swiss building development, each architect/planner is obliged to stay within the rules of the building regulations excluding the strategy (iii). This requires the careful study of these policies and a translation into a 3D geometrical representation of these regulations, similar to step 7 in Figure 2. Such a 3D representation allows the planner to compare the desired design with the requirements and to assess whether it matches. Exceptions from the regulatory framework can be made in rare cases, but in the case of Switzerland local communities and neighbours need to be engaged in to be approved. Such a process of translating the building regulations into a 3D geometrical representation takes approximately ten minutes for each building lot, depending on the size and complexity of the policy. If this time approximation were to be scaled up to the amount of building parcels analysed in this study, this would mean a total of approx. 1200 h compared to approx. 12 h for the method presented here: the automated framework yields computation that is up to two orders of magnitude faster.
Discussion and conclusion
An SPM that can simulate a large number of building policy requirements, superimpose and identify locations of building lots with regulatory zoning requirements over a large geographic extent in a 3D spatial visualisation framework and within a reasonable computing time is developed within a dynamic framework. This SPM is coupled with an agent-based population model developed by Marini et al. (2018) and an agent-based traffic model developed by Saprykin et al. (2019), so that the available surface areas for housing units can be used to assess scenarios of population dynamics. This dynamic simulation framework is optimised for the environment of architects and spatial planners and could be used in such processes.
This simulation shows that Lausanne and its agglomeration reaches its full building capacity at approx. 131 hectares. It is especially worth mentioning that almost no additional space can be realised within the city centre boundaries. This approx. 131 hectares are split into approx. 38 hectares for (i), meaning the extension of already existing buildings, and approx. 93 hectares for (ii). It highlights the need to revise the building regulations of each of the communes to allow for a more dense urban fabric – i.e. horizontally and/or vertically – to accommodate potential influx of new inhabitants, and it also shows the huge potential and asset within the current regulatory conditions.
Limitations of the current model need to be pointed out, especially in terms of the fact that it requires preparation time for non-digitised building regulation formats. Switzerland’s building policies are very fragmented and vary in definition, format and terminology in each of the 2356 individual Swiss municipalities. Since 2004 there has been an attempt to harmonise the terminologies within the spatial policies and transfer such regulatory frameworks to a digital format, which would enhance the workflow of the model significantly (The Federal Assembly – The Swiss Parliament 2004), but not all Swiss cantons joined that initiative (Bau-, Planungs und Umweltdirektoren-Konferenz, 2010). Switzerland currently does not have any common platform in which the policies could be accessed or viewed. Attempts are also being made to translate the conventional text- and numeric-based description of building regulations into a more visual figure-based representation (Schnabel et al., 2017), which would not tend to increase the machine readability.
Furthermore, the current objective of the work is to model the full densification potential within the current regulatory framework in each commune in the agglomeration of Lausanne. In reality, it is highly unlikely that such a full densification potential will be fully exploited. Nonetheless, it does show hotspots where densification potential is higher than elsewhere. Further research could explore such considerations in terms of a processual analysis. This model focuses particularly on spatial zones that allow for residential buildings. At the same time, this does not exclude mixed-use zones such as services, retail, offices or industrial buildings mixed with residential functions. The model could be further extended in future to also accommodate non-residential and non-mixed-use surfaces.
Compared to an evaluation of building regulations based on numeric calculation results, manual CAD drawings, or GIS evaluation, the SPM offers several additional opportunities for the assessment of policies in Switzerland: SPM allows for detailed 3D comparison of the current building volume with the maximum potential building volume within the regulatory framework (see step 8 in Figure 2). This comparison includes detailed roof geometries. The output of the SPM in form of 3D data can be used for visualisation and communication through for example customised game-engine technology (Epic Games, 2019) in a real-time virtual environment including data of the surrounding build environment (see Figure 4). Such visualisations would include materialisation and lighting. 3D visualisation could also allow such building regulatory changes to be understood in layman’s terms, which is especially important in Switzerland with its direct democracy. A more detailed explanation for another context can be found elsewhere, Kretzer and Walczak (2020). The detailed and realistic simulation of the current Swiss building regulatory framework could allow for iterative and hypothetic manipulation of such policies. This would allow instant viewing and inspection of its impact visually and in three dimensions. This could help decision-makers understand how decisions and changes in the building policies are manifested in physical space. The consequence could be large-scale efficiency and work-flow improvement through rapid policy feedback loops. As a further output, the 3D representation could be used for further analysis such as view axes towards a lake (see Figure 4), sunlight hours or wind studies (Walczak 2020). In Switzerland, the importance of the sunlight hour study must not be neglected. Some municipalities require an assessment of whether the building is not exposed to more than approx. 2 h of shadow in summer and approx. 3 h of shadow in winter; and/or does not cast such shadow on to other neighbouring buildings. The buildings have to be positioned in line with the ‘two/three-hour shadow’ regulation (Departements Bau, Verkehr und Umwelt, Kanton Aargau, 2017), which would also support the necessity for a 3D model.

Left image: Qualitative visualisation of building regulation in the agglomeration of Lausanne. Green roofs represent the reassessed buildings including its attic roof (see Figure S2 in the Supplemental material for further visualisations). Buildings with red roofs symbolise the existing building stock within the context. Right image: Quantitative visualisation of an exemplary selection of 11 building units and their view analysis in the direction of the lake, embedded within the Lausanne area. This analysis considers whether the view is obscured by any other building, topography, or vegetative element.
For the reasons stated above, the SPM appears to be a promising tool for the evaluation of the maximum buildable volume within complex policy regulatory frameworks in the Swiss context. It can quantify and geolocate the volumetric reserves within municipalities. The 3D feature allows the hypothetical building volume to be compared to the existing building stock. Furthermore, the output can be used not only in further quantitative studies such as for example view axes, sunlight or wind exposure (Walczak, 2020), but it can also be used for qualitative visualisations with materialisation and lighting (Kretzer and Walczak, 2020).
However, so far these are just theoretical considerations. Further empirical research would be required to test whether (and if so, to what degree) the SPM can be used within the context of policy-makers and spatial planners.
Supplemental Material
sj-pdf-1-epb-10.1177_2399808320985854 - Supplemental material for A multi-dimensional spatial policy model for large-scale multi-municipal Swiss contexts
Supplemental material, sj-pdf-1-epb-10.1177_2399808320985854 for A multi-dimensional spatial policy model for large-scale multi-municipal Swiss contexts by Michael Walczak in Environment and Planning B: Urban Analytics and City Science
Footnotes
Acknowledgements
The author would like to thank Dr. Ndaona Chokani, Prof. Hubert Klumpner and Prof. Dr. Reza S. Abhari from ETH Zurich as well as Prof. Anton Falkeis from the University of Applied Arts Vienna for their academic advice. The author acknowledges useful discussions with their colleague, Marcello Marini.
Declaration of conflicting interests
The author declared no potential conflicts of interest with respect to the research, authorship, and/or publication of this article.
Funding
The author(s) disclosed receipt of the following financial support for the research, authorship, and/or publication of this article: This work was supported by an ETH Zurich ISTP Research Incubator Grant.
Supplemental material
Supplemental material for this article is available online.
Notes
Author biography
References
Supplementary Material
Please find the following supplemental material available below.
For Open Access articles published under a Creative Commons License, all supplemental material carries the same license as the article it is associated with.
For non-Open Access articles published, all supplemental material carries a non-exclusive license, and permission requests for re-use of supplemental material or any part of supplemental material shall be sent directly to the copyright owner as specified in the copyright notice associated with the article.
