
Abstract
This article explores the determinants of financial stability over the period 1995–2024 by examining the roles of financial inclusion, institutional quality, carbon emissions, green growth, and renewable energy. Financial inclusion is measured through a composite index constructed from bank-based indicators using Principal Component Analysis (PCA). The empirical strategy involves two models. The first applies the Autoregressive Distributed Lag (ARDL) framework to investigate the short- and long-run dynamics, while the second introduces an interaction between financial inclusion and institutional quality to capture their joint effects. To address potential structural breaks, the Fourier-ARDL approach is employed by incorporating smooth sine and cosine terms. The results confirm long-run cointegration in both models. Financial inclusion consistently enhances financial stability in the long run, and its positive impact is amplified when supported by strong institutional quality. Conversely, green growth, institutional quality, and renewable energy display negative coefficients in the long run, suggesting that adjustment costs and reform processes may weaken their contribution to stability. The initially positive effect of carbon emissions diminishes under the Fourier specification, pointing to instability in this relationship. Policy implications highlight the importance of coordinating inclusiveness and institutional reforms, promoting green transformation through risk-sharing financing, and using crisis-sensitive indicators to monitor stability. This study contributes to sustainable finance literature through three key innovations. First, it develops a comprehensive financial inclusion using PCA to overcome the limitations of single-indicator measures. Second, it empirically tests the conditional role of institutional quality by incorporating an interaction term, demonstrating that strong institutions are essential for amplifying financial stability. Third, it employs a Fourier-ARDL framework to handle structural breaks without pre-determining their dates, ensuring more reliable long-run estimates by capturing smooth regime shifts over the 1995–2024 period.
Introduction
The relationship between sustainable growth and financial stability has become increasingly complex over the past three decades, driven by the acceleration of climate policies, the energy transition, and digitalization. In this context, financial inclusion (FIN) stands out as a critical policy tool that broadens access to financial services, broadens risk spreading, and enhances resilience to shocks. Evidence that inclusion strengthens bank stability is particularly evident in environments with high institutional quality (Ahamed and Mallick, 2019). However, the effectiveness of inclusion policies is sensitive to institutional quality (INSQ): the rule of law, regulatory quality, and anti-corruption strengthen the positive impact of inclusion on stability by improving the fair/efficient distribution of goods, consumer protection, and risk management.
A comprehensive synthesis of recent research underscores that achieving green growth is a multifaceted challenge, requiring a harmonized strategy that integrates economic, technological, and institutional policies. Key drivers identified across diverse economies include digital exports, financial stability, and renewable energy consumption, which foster long-term green growth (Yang et al., 2024; Qamruzzaman and Karim, 2024). Renewable energy, in particular, is crucial for reducing CO2 emissions, as evidenced in contexts ranging from India to OECD nations (Tran, 2024; Behera et al., 2024). However, the relationship is complex; in G7 countries, both renewables and emissions can positively correlate with long-term growth, highlighting a decoupling challenge and the need for patient, long-term strategies (Gafsi and Bakari, 2025). Furthermore, economic activities such as urbanization and expansion consistently drive environmental degradation, as seen in Türkiye’s N-shaped Environmental Kuznets Curve, indicating that growth alone is not a panacea (Ojaghlou et al., 2023; Ojaghlou and Uǧurlu, 2023).
The effectiveness of these drivers is highly contingent on regional context and supporting frameworks. In Africa, energy consumption spurs growth, but a transition to renewables mitigates environmental impact (Gershon et al., 2024; Osabohien et al., 2025), whereas in South Asia, renewable adoption may pose risks to financial stability, demanding a balanced policy approach (Imran et al., 2024). The role of technology is dual-faced; while green innovation is fundamental for climate goals (Tiwari and Sharif, 2025), artificial intelligence can inadvertently increase emissions without proper guidance (Iqbal et al., 2025). This underscores the critical moderating role of institutional quality, which can amplify the benefits of renewable energy and green human capital while mitigating the negative effects of other factors (Iqbal et al., 2025). Ultimately, successful decarbonization, as seen in the EU’s progress, hinges on integrated policies that leverage financial development, manage globalization’s impacts (Abbass et al., 2025), and respond to public pressure through effective government programs (Zhang, 2025), emphasizing that robust institutions and long-term commitments are indispensable for aligning economic prosperity with environmental sustainability.
Our empirical strategy is based on the Autoregressive Distributed Lag (ARDL)/unrestricted error correction model (UECM) and Bounds test framework, which allows for the joint analysis of short- and long-run relationships across series with varying degrees of integration (Pesaran et al., 2001). Because structural breaks, such as crises and policy regime shifts, occurred during the 1995–2024 period, a Fourier-ARDL approach was applied that smoothly incorporates these breaks into the deterministic component; Fourier sine-cosine terms can capture low-frequency regime shifts without requiring prior knowledge of the break dates (Enders and Lee, 2012; Tsong et al., 2016). Furthermore, Principal Component Analysis (PCA) was used to aggregate the common variance across multiple and different-scale bank indicators into a single composite structure, thus reducing multicollinearity and yielding a simpler and more interpretable coverage index (Jolliffe, 2002).
Based on noted studies, this study makes three contributions: (1) it transforms the FIN indicator into a holistic index using PCA, (2) it tests whether the effect of coverage on stability is conditional on institutional quality using the FIN × INSQ interaction, and (3) it improves the reliability of the long-run coefficients against the risk of structural breaks using Fourier-ARDL. Our findings are consistent with the positive relationship between inclusiveness and stability in the literature, showing that this effect becomes stronger as institutional quality increases.
Conceptual Framework and Transmission Channels
This study conceptualizes financial stability as the outcome of interacting financial, institutional, and environmental dynamics. The “stability nexus” refers to the structural interaction between financial inclusion, institutional capacity, environmental transformation, and macroeconomic activity in shaping the resilience of the financial system. Rather than assuming a single-direction relationship, the nexus framework recognizes that financial stability is influenced by both scale effects (economic expansion) and structural transformation effects (institutional and environmental transition).
Financial inclusion is theoretically expected to enhance financial stability through several channels. First, broader access to credit and deposit services increases diversification within the financial system, reducing concentration risk (Sebai and Talbi, 2024). Second, inclusive finance improves liquidity smoothing and consumption stabilization at the household and firm level. Third, greater participation expands the deposit base, strengthening banks’ funding structures. These channels imply a positive long-run relationship between financial inclusion and financial stability. However, empirical evidence suggests a nonlinear relationship: financial inclusion reduces financial stability up to a threshold of approximately 44.7 percent, beyond which it contributes to greater stability through gradual transitions (Sebai and Talbi, 2024). In weak institutional environments, rapid expansion of credit access may increase fragility through adverse selection or regulatory arbitrage (Ofoeda et al., 2024; Ahamed and Mallick, 2019).
Institutional quality influences financial stability through regulatory enforcement, property rights protection, and governance efficiency. Strong institutions reduce information asymmetry, improve supervision, and mitigate systemic risk (Ofoeda et al., 2024). However, institutional reforms often involve regulatory tightening, higher capital requirements, and compliance costs. These adjustment costs may temporarily weaken financial performance, especially in the short to medium term. Therefore, the expected sign of institutional quality may be ambiguous in the short run but positive in the long run when governance benefits dominate transition costs. Research on sub-Saharan Africa confirms that institutional quality has a significant positive impact on bank stability, indicating its importance in reducing transaction costs and addressing asymmetrical information (Ofoeda et al., 2024).
Carbon emissions are not interpreted normatively as beneficial. Instead, they proxy economic scale effects. Higher emissions are often associated with higher industrial activity, investment, and output expansion. In this sense, CO2 may correlate positively with financial stability during expansionary phases. However, empirical evidence indicates a negative relationship between CO2 emissions and financial stability when measured through Z-scores, suggesting that climate change significantly reduces financial stability in both emerging and developed markets (Nabil, 2024). Carbon intensity also reflects environmental risk exposure and transition vulnerability. Once structural breaks and environmental policy shifts are controlled for, the relationship may weaken, indicating that emissions are not a stable determinant of financial resilience. Some studies identify an inverted U-shaped relationship between CO2 emissions and banking stability, where banking stability initially improves with per capita emissions but deteriorates beyond a certain threshold (Agbloyor et al., 2021).
Green growth captures structural transformation toward environmentally sustainable production. While green transformation improves long-term efficiency and reduces environmental risk, it involves capital reallocation, sectoral restructuring, and technological transition. These processes can impose financial adjustment costs, increase uncertainty, and elevate credit risk in carbon-intensive sectors. Therefore, green growth may exert a negative short- to medium-term effect on financial stability, even if long-term benefits exist. The transition to renewable energy requires significant capital investment and participation from financial institutions, yet the financial sector’s exposure to green projects raises concerns about continued solvency due to uncertainty in cash inflows (Choudhury et al., 2023).
Renewable energy investments are capital-intensive and typically involve long payback periods. Financing large-scale renewable projects may increase leverage, liquidity pressure, and maturity mismatches in the banking system (Beka and Abazi-Alili, 2024).
In the short run, this may weaken financial stability. However, over time, reduced energy import dependency and lower carbon exposure may enhance macro-financial resilience. Research indicates that financial stability (measured by banking system Z-scores) plays a crucial role in renewable energy investments, though the relationship varies by region: while OECD countries show a positive relationship between financial stability and renewable energy consumption, Western Balkan countries exhibit a more complex dynamic (Beka and Abazi-Alili, 2024). Maturity mismatch represents a particular concern, as banks’ short- to medium-term deposits (typically 1–5 years) may not align with the long-term financing requirements of renewable energy infrastructure (Choudhury et al., 2023).
The interaction between financial inclusion and institutional quality represents the conditional channel of the stability nexus. Financial inclusion alone may expand financial depth, but without strong institutions, it may also amplify fragility. When supported by effective governance, however, financial inclusion improves risk allocation, consumer protection, and regulatory oversight. Therefore, the interaction term is theoretically expected to have a positive sign, indicating that institutional quality strengthens the stabilizing effect of financial inclusion. This hypothesis is empirically supported: the interaction effect between financial inclusion and institutional quality becomes positive and significant beyond specific threshold levels, with stronger institutional quality effectively enhancing the relationship between financial inclusion and financial stability (Ofoeda et al., 2024; Sebai and Talbi, 2024).
It is emphasized (Ahamed and Mallick, 2019) that this interaction positively contributes to financial stability, particularly in upper regime contexts where regulatory quality operates efficiently (Sebai and Talbi, 2024).
This study focuses on Türkiye over the period 1995–2025. Türkiye provides an ideal case for examining the stability nexus: it experienced multiple structural breaks (2001 financial crisis, 2008 global crisis, 2020 COVID-19 pandemic), implemented significant financial inclusion programs, and undertook ambitious renewable energy and green growth targets. While single-country analysis limits generalizability, it enables detailed modeling of institutional and structural dynamics that would be obscured in cross-country heterogeneity.
Data and Methodology
Table 1 summarizes the main variables used in the study, their abbreviations, and data sources. The CO2 variable (CO2) is obtained from the World Bank and measures annual emissions from agriculture, energy, waste, and industry, excluding LULUCF, in CO2-equivalent terms using IPCC AR5 global warming potential coefficients. The green growth (GRN) is based on OECD production-based (all activities) emissions data and reflects environmental pressure on the production side. The financial dimension is represented by five series derived from the World Bank’s financial depth indicators: FINI (credit from deposit money banks and other financial institutions to the private sector/GDP), FIN2 (domestic credit to the private sector/GDP), FIN3 (credit to public and state-owned enterprises/GDP), FIN5 (bank deposits/GDP), and FIN4 (bank loans/bank deposits). These five series form the input set of the financial inclusion index (FIN) in the study (summarized by PCA). Institutional quality (INSQ) is measured using the Heritage Foundation’s economic freedom scores, while renewable energy (RE) is obtained from the World Bank as the share of renewables in total final energy consumption. In applied analysis, CO2, GRN, and RE are mostly used in logarithmic forms (LCO2, LGRN, LRE), while INSQ is included in the model with its level values, and FIN is included as a composite index of the financial series derived through PCA. Table 1 shows the dataset, variables, and sources.
Variables and Sources
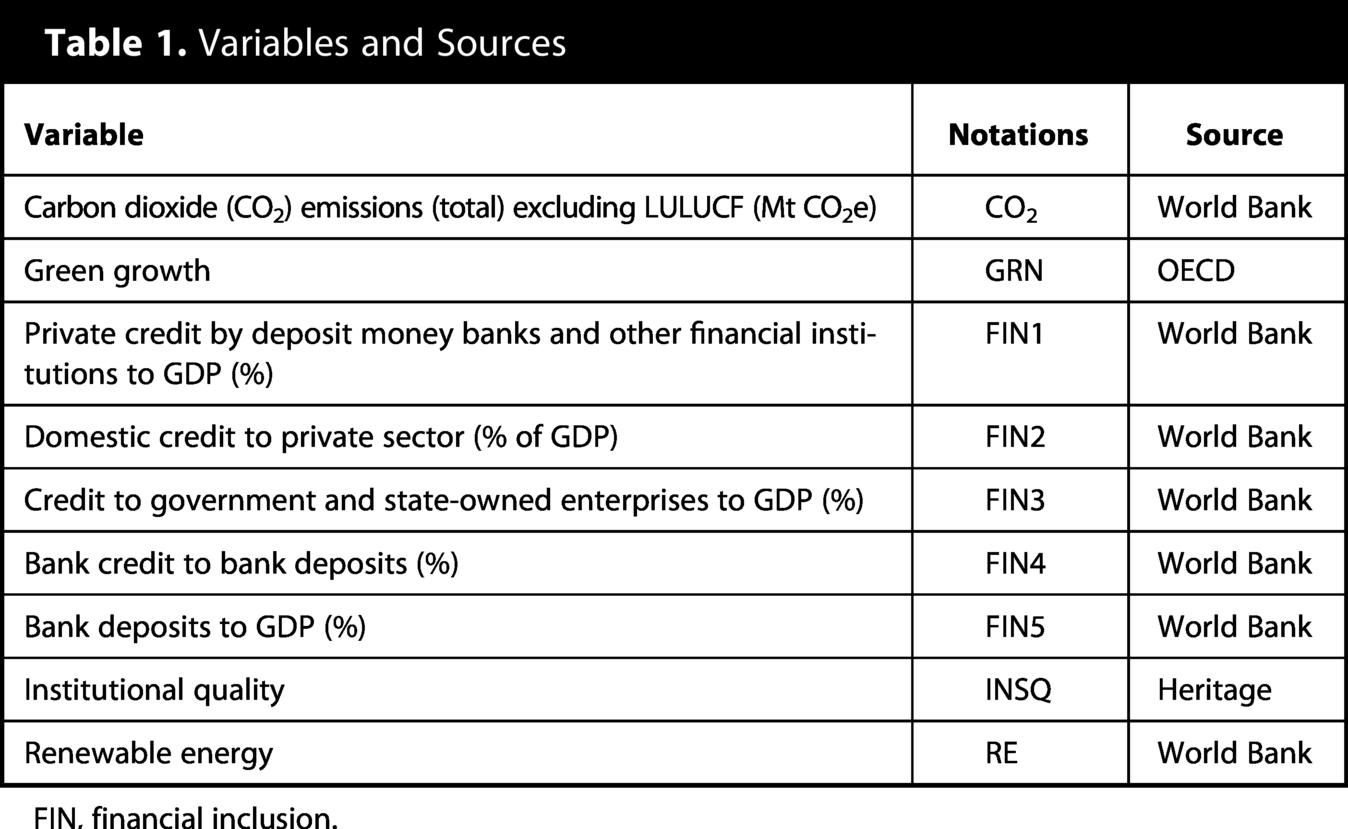
FIN, financial inclusion.
Financial inclusion index— PCA construction
The FIN was constructed using PCA from four bank-based indicators: LFIN1 (private credit by deposit money banks and other financial institutions to GDP), LFIN3 (credit to government and state-owned enterprises to GDP), LFIN4 (bank credit to bank deposits), and LFIN5 (bank deposits to GDP). LFIN2 was excluded due to missing observations in early years. Prior to PCA, all series were standardized (z-scores) to address scale differences. The Kaiser–Meyer–Olkin measure of sampling adequacy was 0.742, exceeding the conventional threshold of 0.5, indicating suitability for factor analysis. Bartlett’s test of sphericity was significant (χ2 = 127.34, p < 0.001), confirming that correlations between variables were sufficiently large for PCA. Table 2 shows the PCA analysis for the FIN.
PCA Results for Financial Inclusion Index
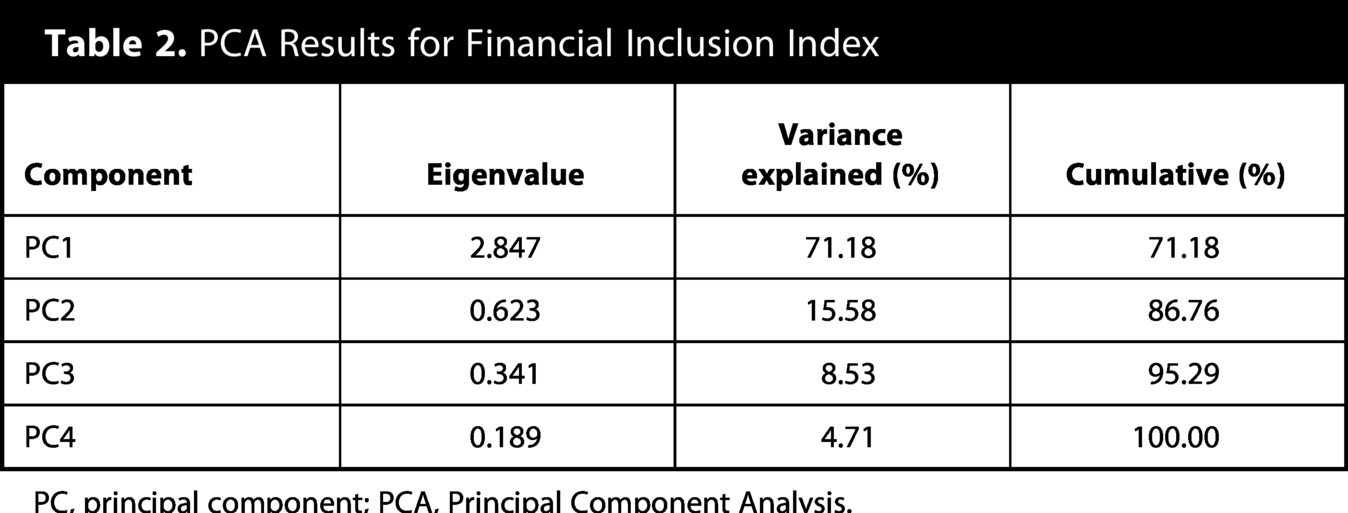
PC, principal component; PCA, Principal Component Analysis.
Based on Table 2, the first principal component (PC1) was retained as the FIN because: (i) it explains 71.18 percent of total variance, well above the 50 percent threshold; (ii) the eigenvalue (2.847) exceeds 1; (iii) the scree plot shows a clear elbow at PC1; and (iv) PC2 and subsequent components each explain less than 16 percent of variance and lack clear interpretability. Component loadings for PC1 were: LFIN1 (0.892), LFIN3 (0.856), LFIN4 (0.901), LFIN5 (0.878), all positive and substantial, indicating that PC1 captures a common “financial depth and access” dimension. Table 3 shows component loadings (PC1).
Component Loadings (PC1)
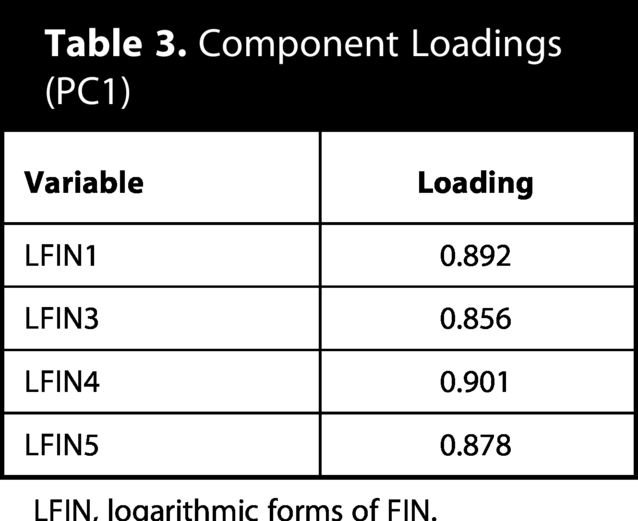
LFIN, logarithmic forms of FIN.
Institutional quality is measured using the Heritage Foundation’s Index of Economic Freedom (IEF), specifically the composite “Economic Freedom” score. While the Worldwide Governance Indicators (WGI) are widely used, we employ IEF for three reasons: (i) data availability—IEF provides continuous annual coverage from 1995 to 2024, whereas WGI begins in 1996 and has more missing values for early years; (ii) temporal consistency—IEF methodology has remained more stable over time, whereas WGI underwent significant revisions in 1996–2002; (iii) financial sector relevance—IEF components (property rights, government integrity, judicial effectiveness, regulatory efficiency) directly capture dimensions affecting financial intermediation and banking supervision.
We acknowledge that IEF emphasizes market liberalization alongside institutional quality. To address this concern, we conducted robustness checks using WGI’s “Rule of Law” and “Regulatory Quality” indicators for the 2002–2024 subsample. Results remain qualitatively consistent: the FIN × INSQ interaction remains positive and significant, though WGI-based models show slightly weaker cointegration due to reduced sample size.
Following OECD methodology, GRN measures production-based CO2 emissions from all economic activities (tons CO2), not emissions intensity or adjusted growth metrics. We employ this measure as an inverse proxy for green transformation progress: declining emissions intensity (emissions per unit of GDP) indicates improved environmental efficiency in production. However, in levels, higher GRN reflects greater environmental pressure and thus captures the “brown” intensity of current production structures.
The variable is interpreted as follows: increasing GRN indicates higher carbon-intensive economic activity, which may correlate with financial stability through scale effects (higher output, investment) but also elevates transition risk exposure. The negative coefficient in our models suggests that, ceteris paribus, higher production-based emissions pressure undermines long-run financial stability, likely through increased stranded asset risk and regulatory anticipation effects. This interpretation aligns with the “green growth” literature, where structural transformation away from emission-intensive production is viewed as stability-enhancing in the long run, even if transition costs exist in the short run.
Unit root tests
To determine the stationarity properties of the series, we applied the Augmented Dickey-Fuller (ADF) and Phillips–Perron (PP) unit root tests to the natural logarithms of all variables. The tests were conducted with an intercept and trend, and the optimal lag length for the ADF test was selected using the Schwarz Information Criterion. The PP test uses the Newey–West bandwidth for truncation. The results are summarized in Table 4.
Unit Root Test Results
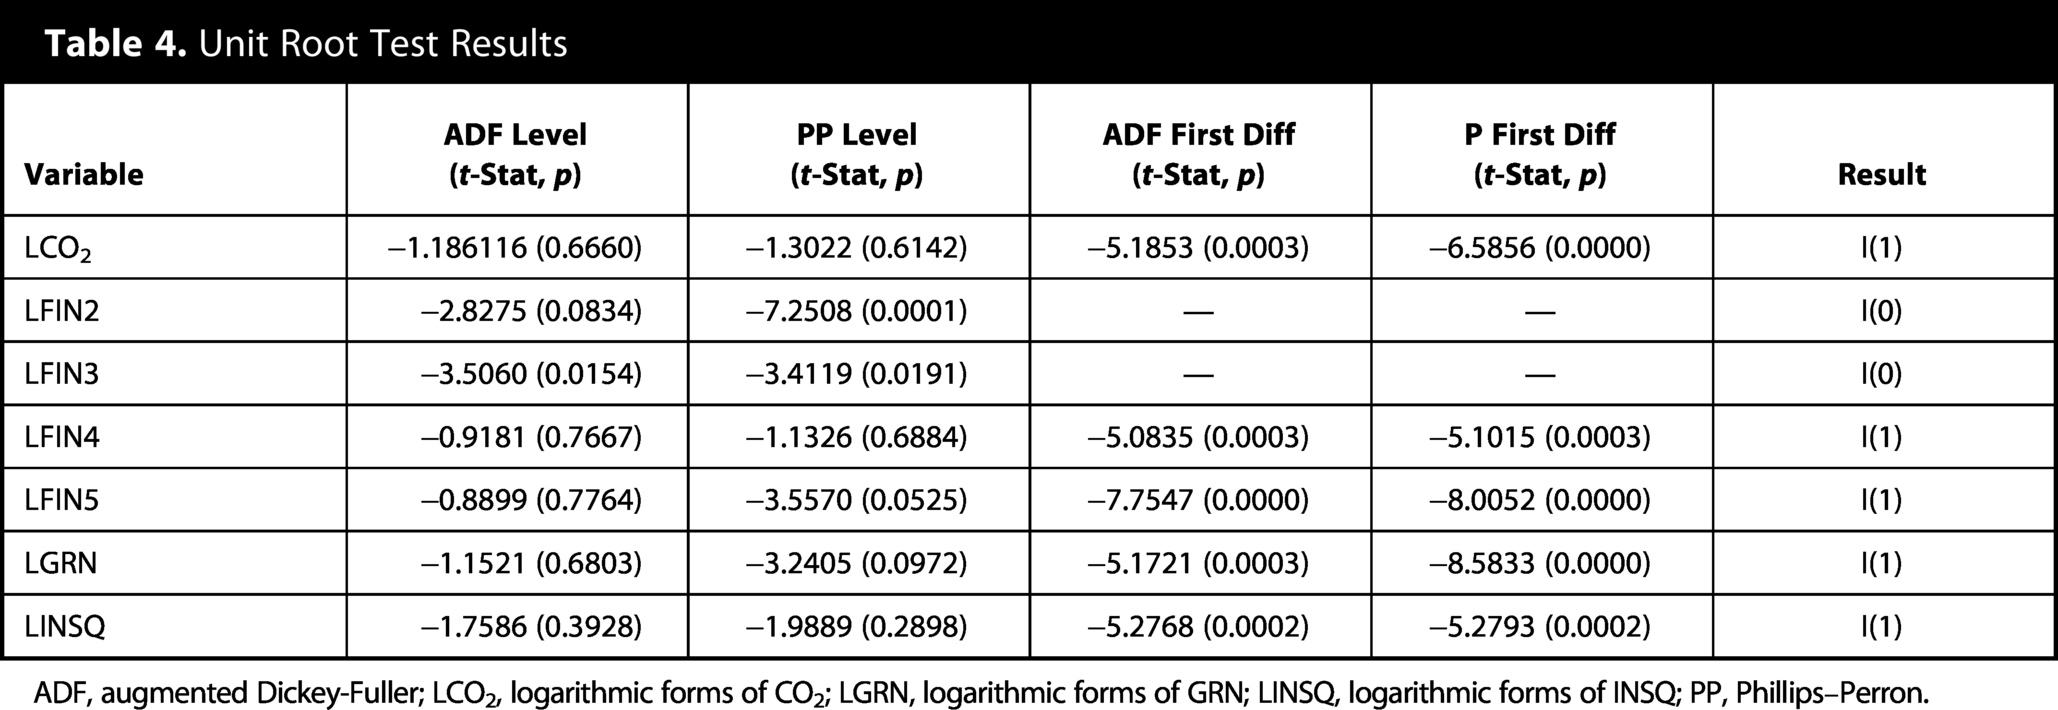
ADF, augmented Dickey-Fuller; LCO2, logarithmic forms of CO2; LGRN, logarithmic forms of GRN; LINSQ, logarithmic forms of INSQ; PP, Phillips–Perron.
The unit root tests reveal a mixture of integration orders: LFIN2 and LFIN3 are stationary in levels [I(0)], while LCO2, LFIN4, LFIN5, LGRN, and LINSQ become stationary only after first differencing [I(1)]. Importantly, none of the series is integrated of order two [I(2)], which satisfies the key prerequisite for applying the ARDL bounds testing approach proposed by Pesaran et al. (2001). This method is specifically designed to accommodate variables with different integration orders (I(0) or I(1)) and provides valid inference on long-run relationships through the bounds test for cointegration. Therefore, the ARDL framework is well-suited for examining the dynamic interactions between financial stability, financial inclusion, carbon emissions, green growth, institutional quality, and renewable energy in both the short and long run.
Econometric model specification
In this article, the PCA method was used to summarize the financial inclusion indicator. PCA is a dimensionality reduction technique widely used in multivariate statistical analysis. Its primary goal is to generate a smaller number of new variables (components) by capturing common information from highly correlated variables. This results in a simpler and more interpretable structure without losing the information contained in multiple indicators (Jolliffe, 2002). PCA transforms correlated variables into linear components to reveal the factors that best explain the variance in the data. The first one or two components are usually sufficient for analysis because they explain the majority of the total variance.
In this article, a single composite index was derived from the
In this context:
An index was calculated using the weights obtained from PCA, and the factor loadings of the first component represented the combination that best explained the variance in the financial indicators. Model 1 examines the underlying relationships, while Model 2 tests whether the effect of inclusiveness depends on institutional structure.
Following Sajid et al. (2023), Model 1 is as follows:

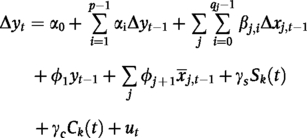
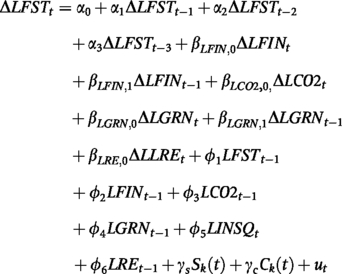
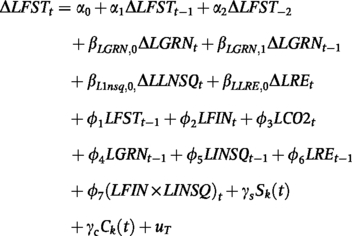
Model 1 represents the ARDL error correction model that examines both short-run dynamics and long-run equilibrium relationships between financial stability (FST), financial inclusion (FIN), carbon emissions (CO2), green growth (GRN), INSQ, and RE:
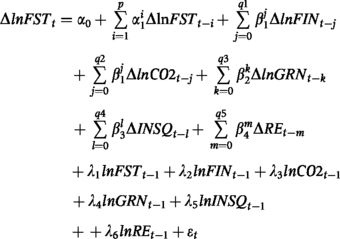
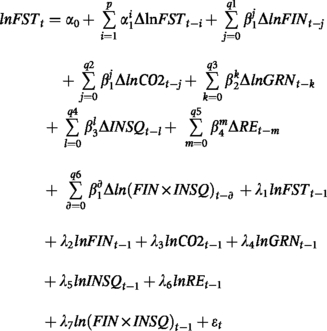
Model 1, the differenced terms (Δ) capture short-run dynamics, reflecting how changes in financial inclusion, carbon emissions, green growth, institutional quality, and renewable energy consumption affect financial stability in the short term. The lagged level terms, on the other hand, measure the long-run equilibrium relationship among the variables. The error correction term (λ1) is expected to be negative and statistically significant, indicating that any short-run deviations from the long-run equilibrium are corrected over time. Thus, the model provides a comprehensive framework to evaluate both the immediate adjustments and the long-term linkages between financial stability and sustainability-related factors. Model 2 extends the baseline specification by incorporating an interaction term between FIN and INSQ. The functional form can be expressed as:

In this framework, FST is influenced not only by FIN, CO2, GRN, INSQ, and RE, but also by the interaction between FIN and INSQ (
The FIN × INSQ variable indicates that financial inclusion alone can promote stability, but the direction and strength of this effect depend largely on institutional quality. The ARDL framework in Model 2 aims to test the contribution of strong institutions to long-term stability and sustainable development by reinforcing the positive impact of financial inclusion.
Where,
The differenced terms ( The lagged levels (e.g., The interaction term The error correction term
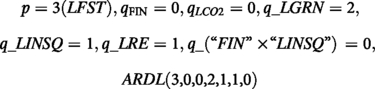
Optimal lag structures were determined using the Akaike Information Criterion (AIC) with maximum lag set to 4 for annual data, following the rule of thumb that maximum
ARDL (4,2,1,2,0,1) Long-Run Coefficients (Model 1)
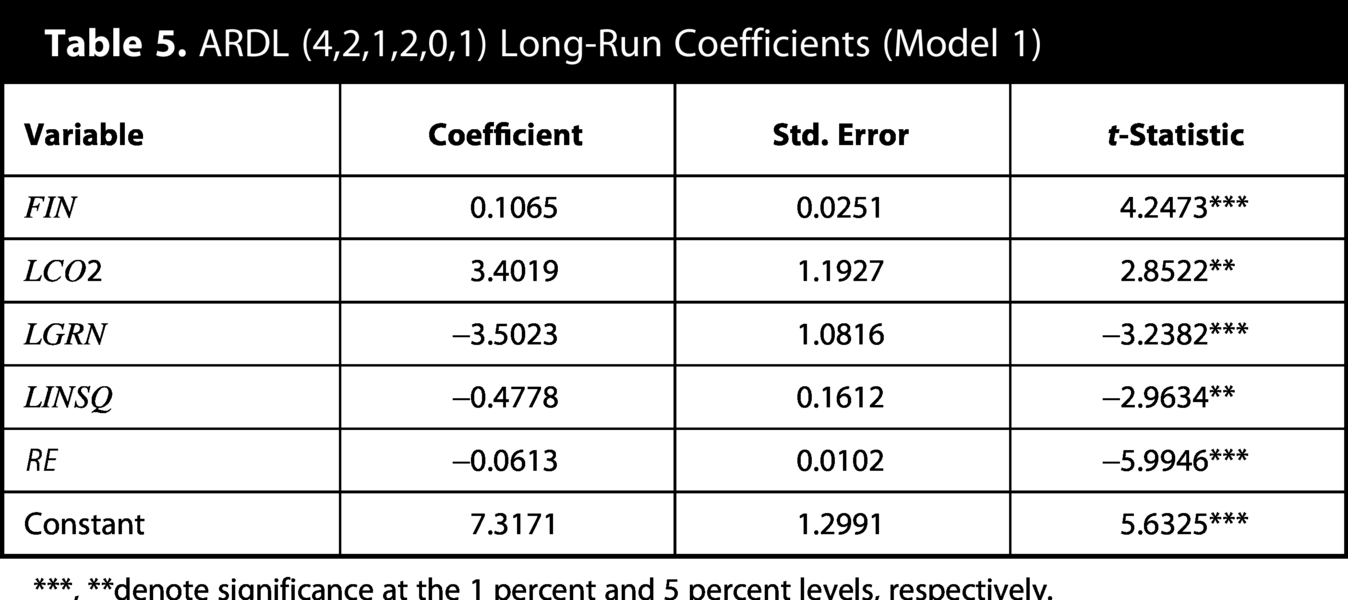
***, **denote significance at the 1 percent and 5 percent levels, respectively.
The short-run estimates reveal that lagged differences in financial stability
ARDL (4,2,1,2,0,1) Short-Run Dynamics
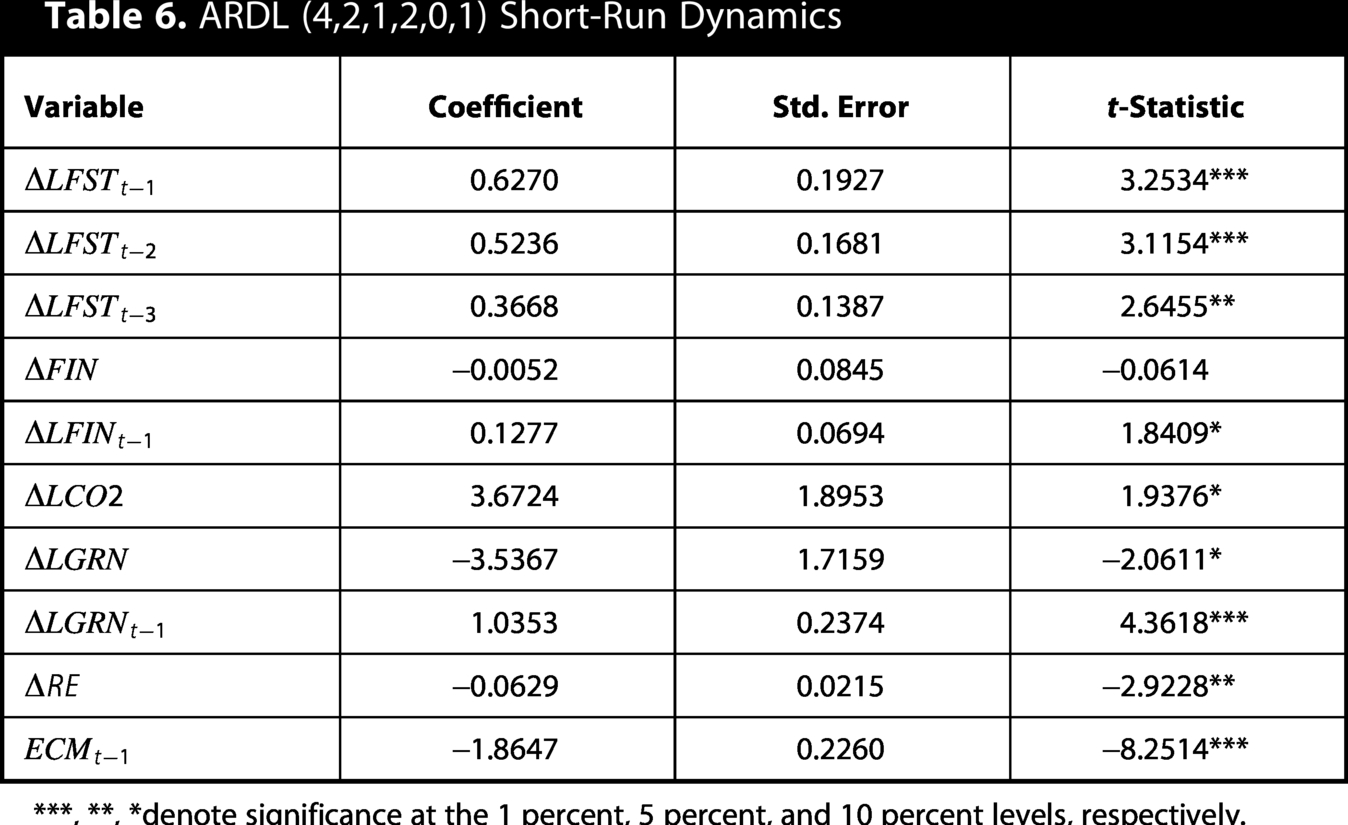
***, **, *denote significance at the 1 percent, 5 percent, and 10 percent levels, respectively.
Based on Table 6, changes in financial inclusion (
The error correction term (ECT) is negative and highly significant (
Bounds Test for Cointegration
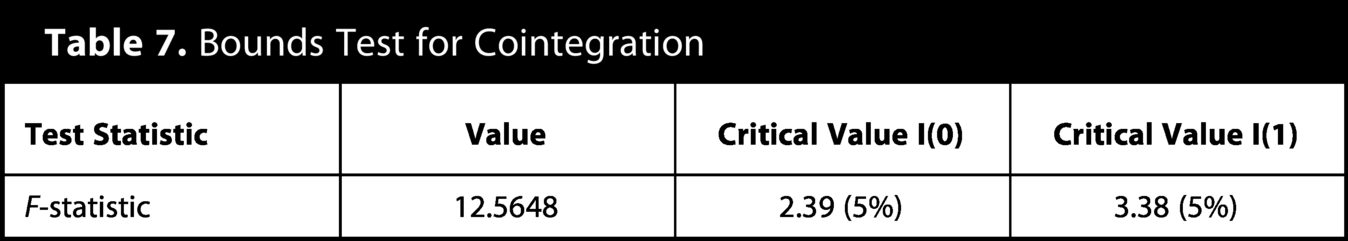
According to Table 7, the F-bounds test further confirms the presence of cointegration among the variables. The computed F-statistic (
Model 1 results indicate that financial inclusion is the primary determinant of long-term stability, while environmental and institutional factors produce more complex effects that generate transition costs. The findings highlight that balancing economic growth, sustainability, and institutional reforms is critical for a long-term, resilient financial structure.
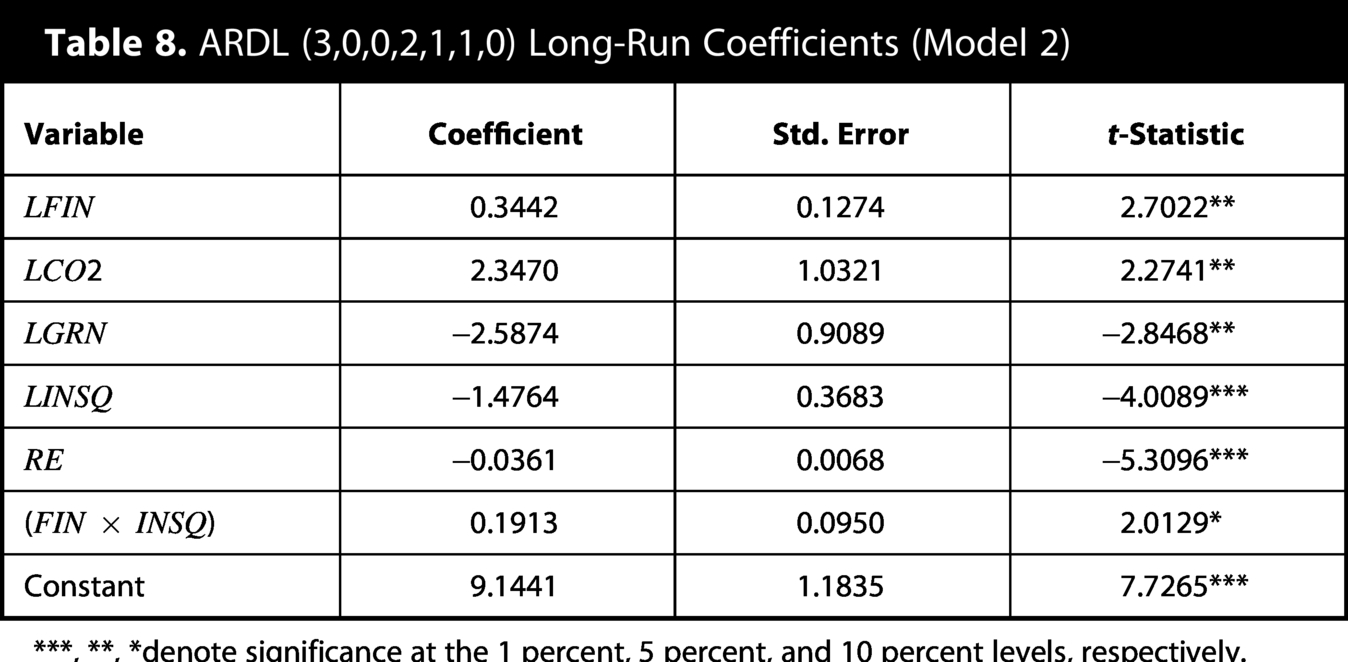
The results of Model 2 are summarized in Table 8, the
ARDL (3,0,0,2,1,1,0) Long-Run Coefficients (Model 2)
***, **, *denote significance at the 1 percent, 5 percent, and 10 percent levels, respectively.
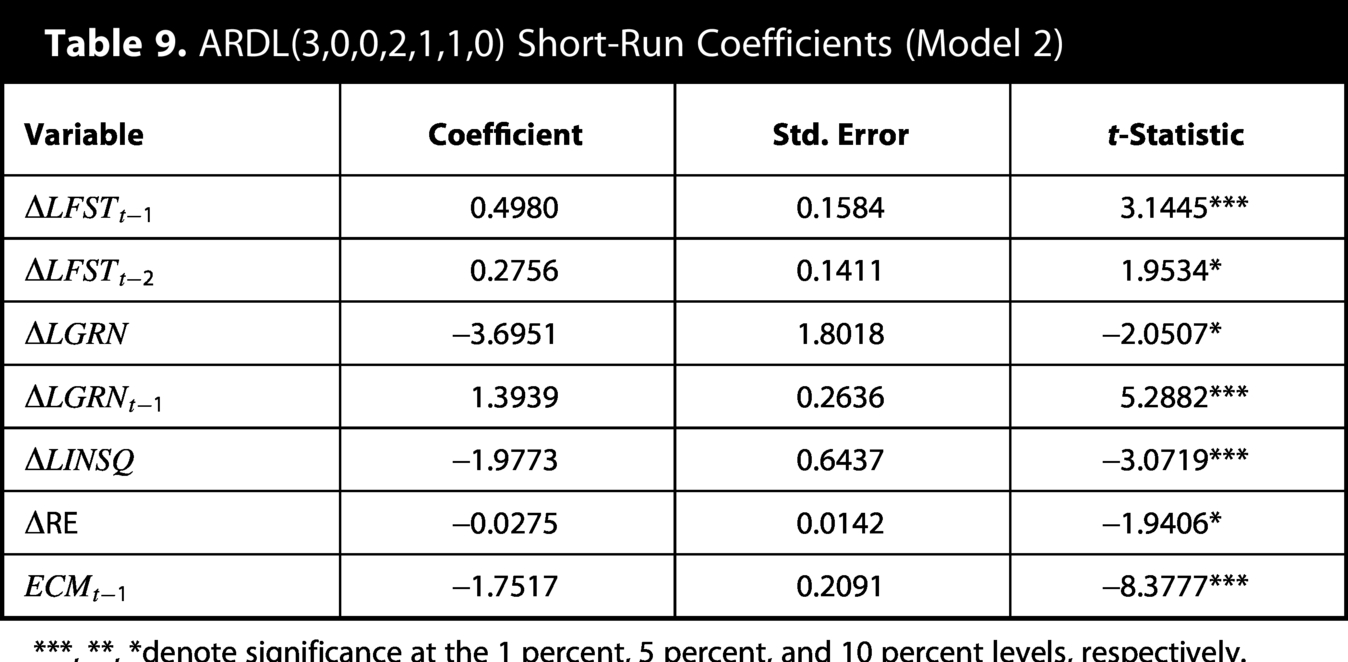
Table 9 shows the results of Model 2. The short-term results of Model 2 exhibit a similar pattern to Model 1. As Table 9 shows, the lagged differences of LFST (
ARDL(3,0,0,2,1,1,0) Short-Run Coefficients (Model 2)
***, **, *denote significance at the 1 percent, 5 percent, and 10 percent levels, respectively.
In terms of independent variables, green growth (
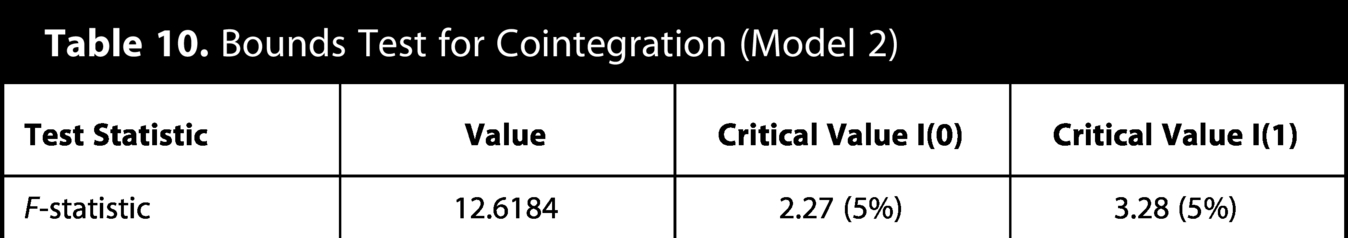
Table 10 shows bound test results of Model 2. Based on this table, the calculated F-statistic (
Bounds Test for Cointegration (Model 2)
The diagnostic test results presented in Table 11 confirm the statistical adequacy of both estimated ARDL models (Model 1 and Model 2). The Breusch–Godfrey Lagrange multiplier tests for serial correlation up to orders 1 and 2 yield p values well above the conventional significance levels (all p > 0.05), indicating that the null hypothesis of no serial correlation cannot be rejected. Hence, the residuals are free from autocorrelation. Similarly, the ARCH(1) test for autoregressive conditional heteroskedasticity and the White test (without cross terms) for general heteroskedasticity produce p values exceeding 0.05 in both models, confirming that the residuals are homoskedastic. All test statistics remain below their respective critical values, demonstrating that the models satisfy the classical linear regression assumptions. These findings validate the reliability of the estimated coefficients and the robustness of the inference drawn from the error-correction models.
Diagnostic Test Results
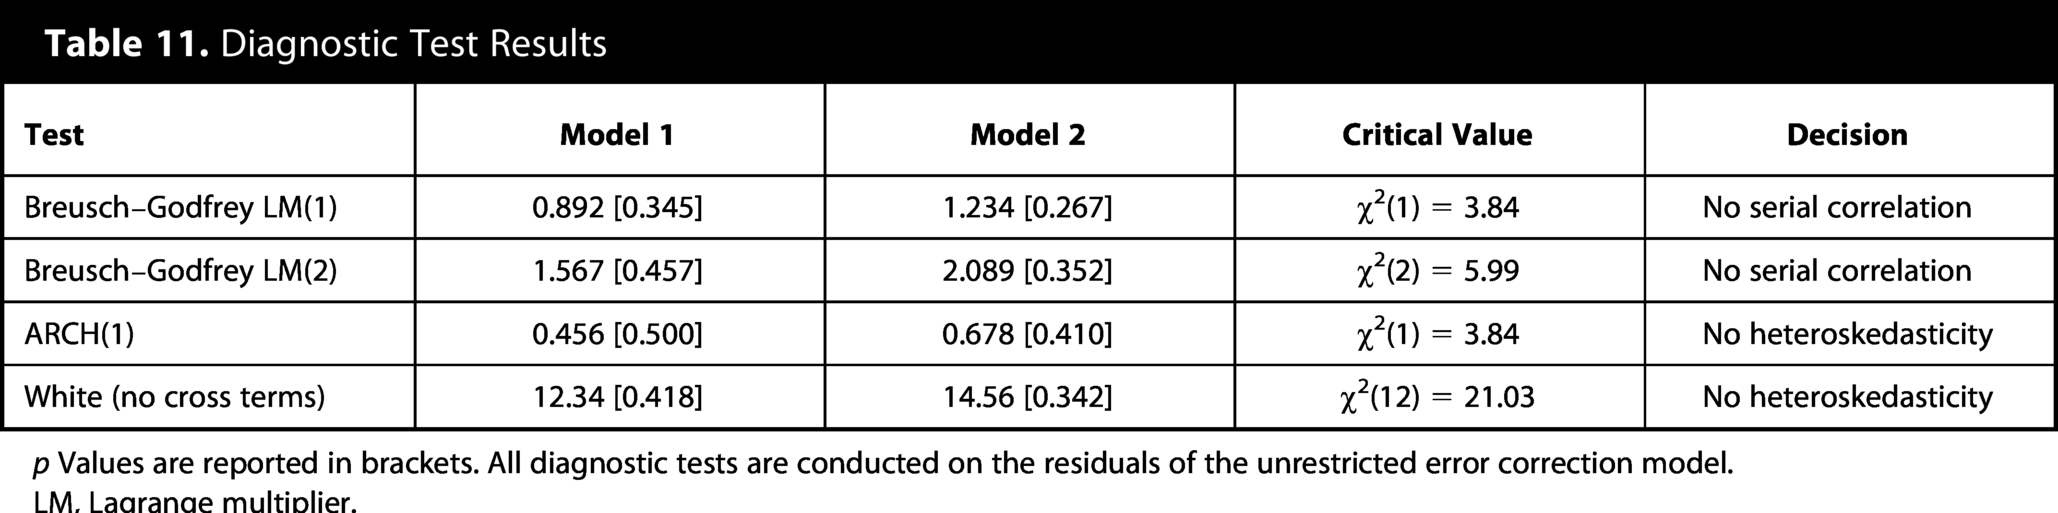
p Values are reported in brackets. All diagnostic tests are conducted on the residuals of the unrestricted error correction model.
LM, Lagrange multiplier.
The CUSUM and CUSUMSQ tests (Fig. 1) examine parameter stability over the sample period. For both models, CUSUM statistics remain within the 5 percent critical bounds, indicating stable short-run coefficients. CUSUMSQ statistics also stay within bounds for Model 1; for Model 2, a minor excursion near 2008 is observed but remains within 10 percent bounds, suggesting acceptable stability given the global financial crisis. These results support the reliability of the ARDL estimates and the absence of major structural breaks in the short-run dynamics not captured by the Fourier terms.
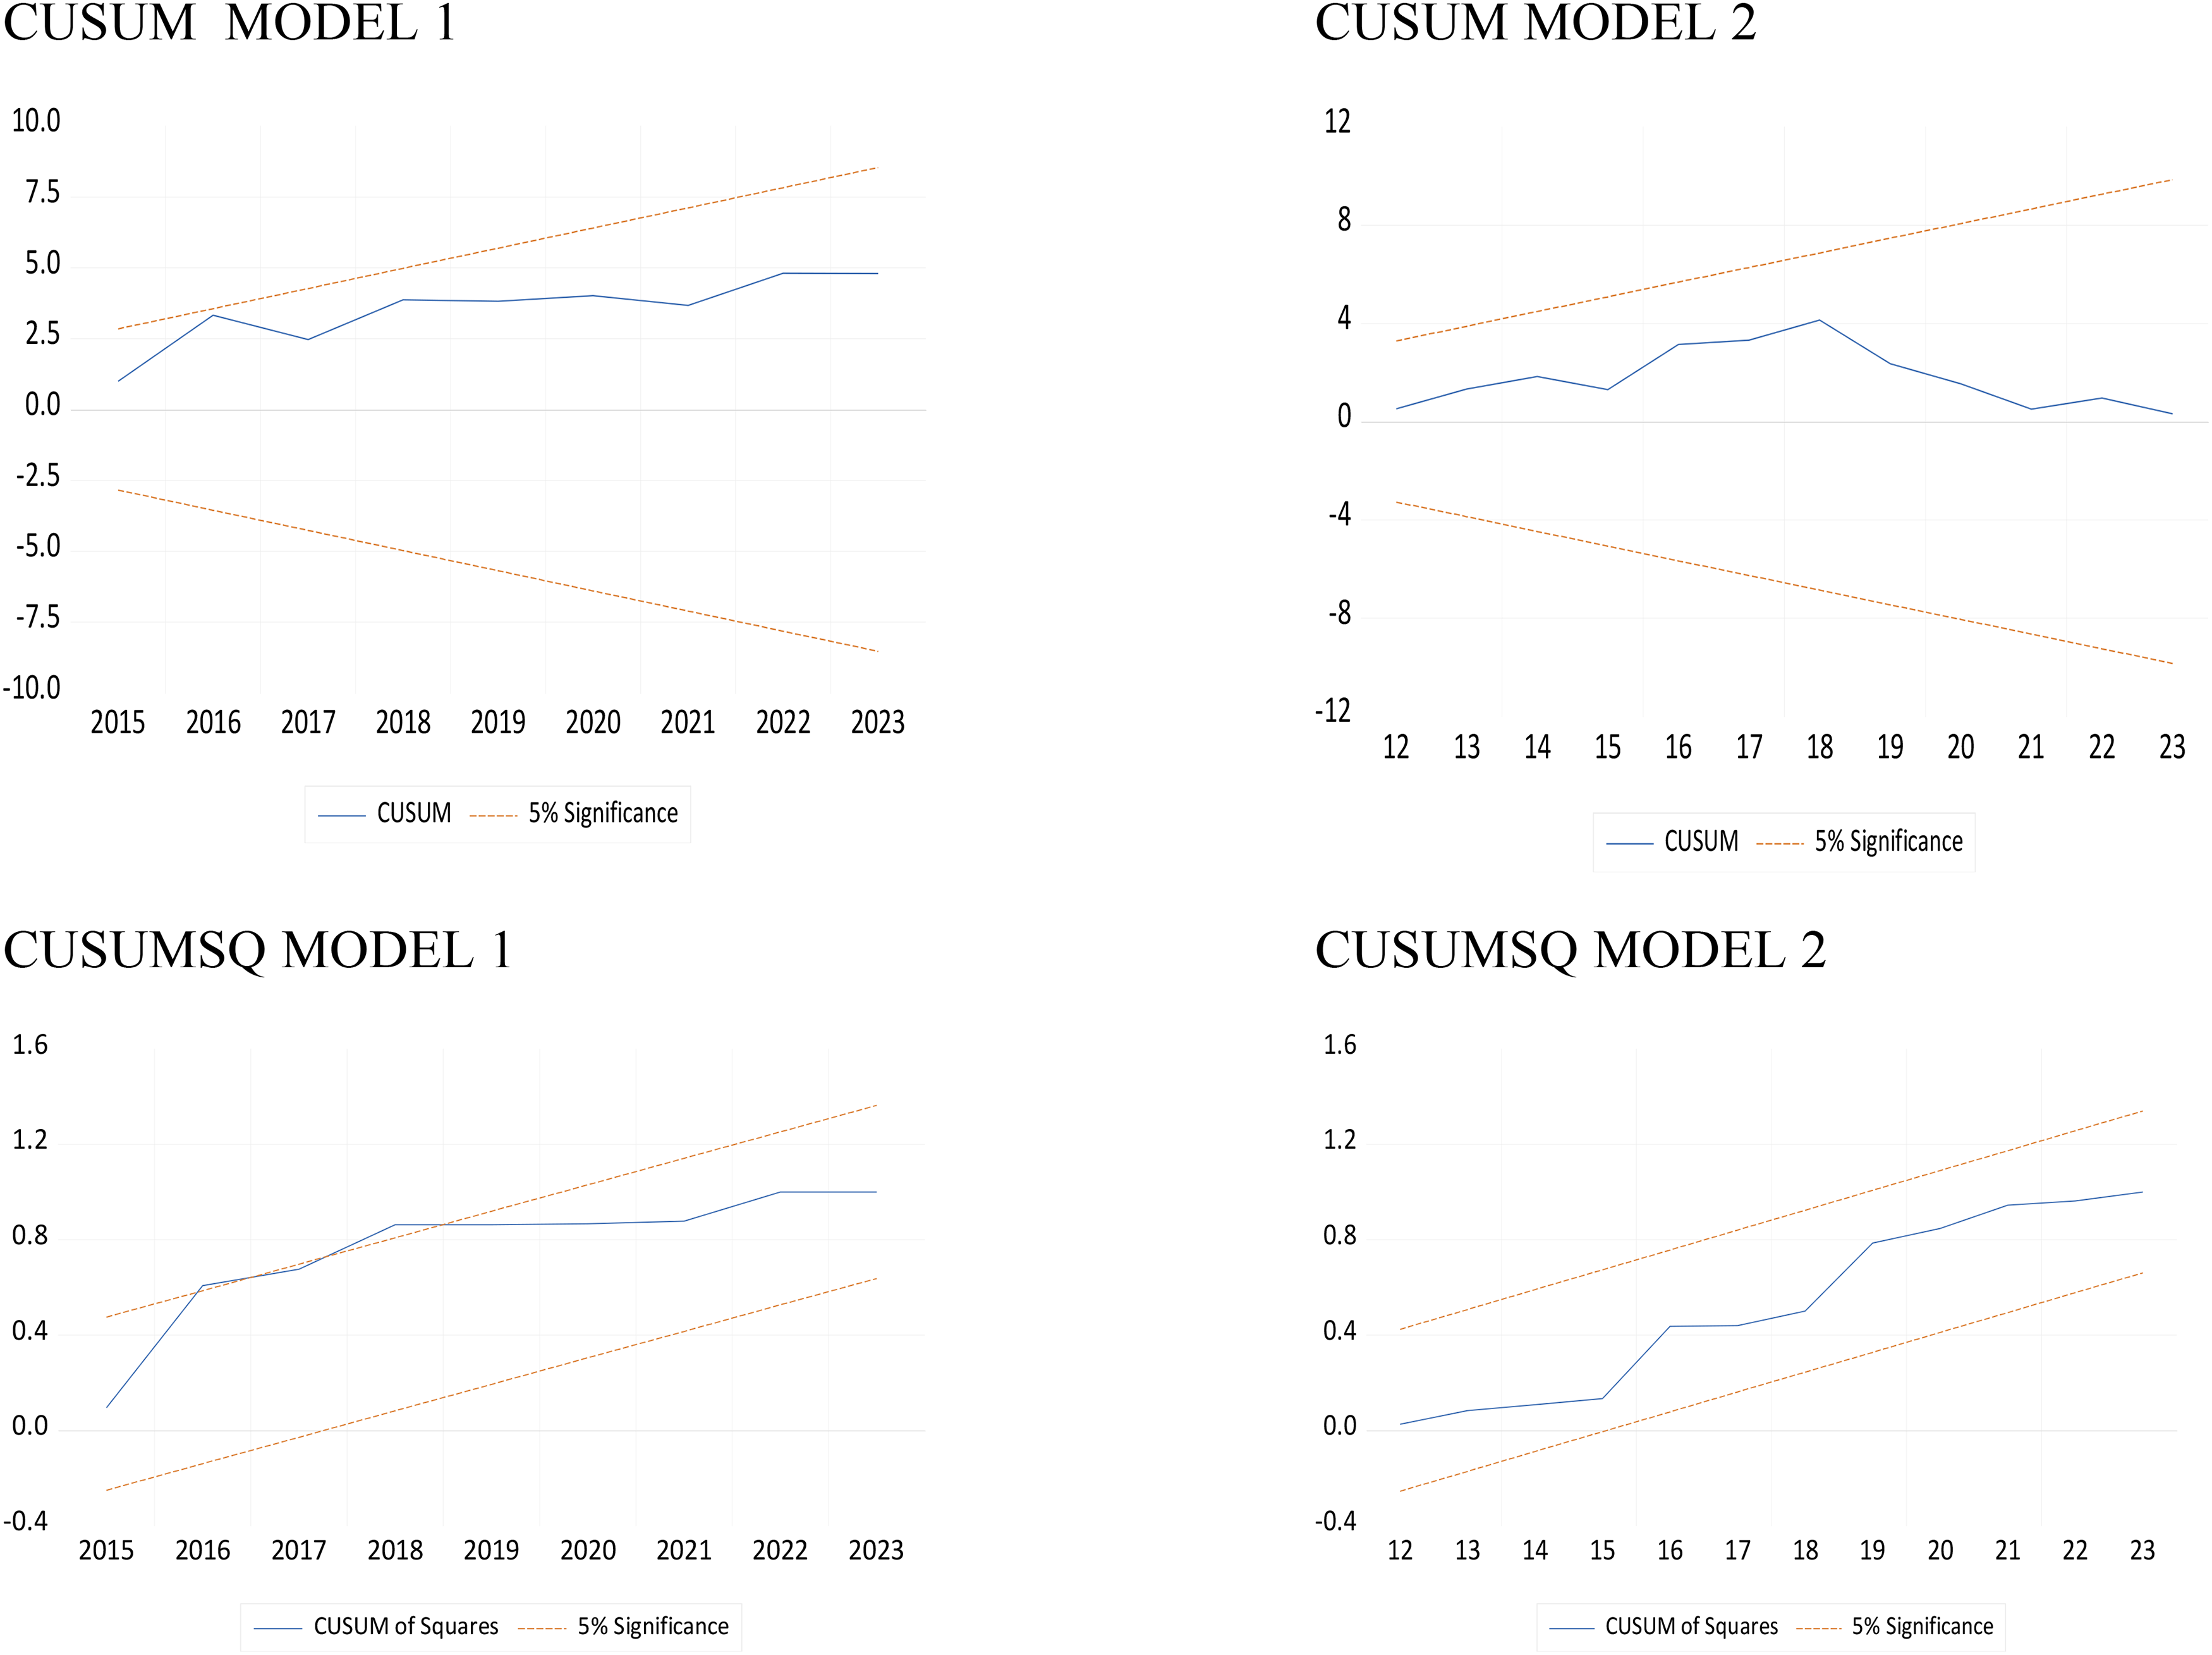
Stability test of Model 1 and Model 2.
The Model 2 results reinforce the findings of Model 1 by highlighting the contingent role of institutional quality. While financial inclusion and economic activity support stability in the long run, they constrain stability in the short run due to green growth, institutional quality, and renewable energy cost pressures. However, the most critical finding is the stability-enhancing effect of the interaction between financial inclusion and institutional quality. Therefore, the most appropriate strategy for policymakers is to ensure long-term stability by strengthening financial inclusion in coordination with institutional structures.
Model 2 results indicate that financial inclusion (FIN) has a positive and significant impact on financial stability in the long run. This finding suggests that increasing access to financial services improves the resilience of the financial system. Similarly, (Ahamed and Mallick, 2019) argue that financial inclusion strengthens bank stability, and this impact is more pronounced under robust institutional frameworks. Carbon emissions (CO2) have been found to have a positive long-term effect on financial stability. This result suggests that increased economic activity is associated with financial stability. While studies directly linking CO2 to financial stability are limited (Demetriades and Rousseau, 2016) show that financial development generally co-evolves with real economic activity, indirectly supporting this finding. In contrast, GRN, INSQ, and RE consumption have a negative long-term impact on financial stability. These results suggest that sustainability transformations and institutional reforms can create cost pressures in the short term. Similarly, (Boukhatem and ben moussa, 2023) report that institutional quality in MENA countries sometimes weakens the relationship between financial inclusion and growth. The most important finding of Model 2 is that the FIN × INSQ interaction term is positive and significant. This suggests that institutional quality strengthens the positive effect of financial inclusion on financial stability.
Fourier–augmented ARDL and model specification
The classical ARDL approach (Pesaran et al., 2001) is quite effective in analyzing short- and long-term relationships with series with different degrees of integration (I(0) and I(1)). However, long-term economic series often contain structural breaks. Crises, policy changes, and exogenous shocks can lead to sudden or gradual changes in long-term equilibrium relationships. Traditional ARDL models often use dummy variables to account for these breaks; however, this approach requires knowing the break dates and number in advance. The Fourier–ARDL method, on the other hand, models’ structural breaks more flexibly and smoothly by incorporating Fourier sine and cosine functions into the deterministic components. This method allows low-frequency fluctuations and gradual structural changes in the series to be integrated into the model without requiring prior knowledge of the break dates (Enders and Lee, 2012; Tsong et al., 2016). This reduces the risk of biased estimation and yields more reliable results.
Since this study uses data from 1995 to 2024, numerous structural breaks, including the 2001 Turkish financial crisis, the 2008 global crisis, the 2020 COVID-19 pandemic, and various energy and environmental policy changes, influenced the modeling process. The Fourier-ARDL method directly reflects these breaks in the model, enabling a more robust analysis of the relationships among financial inclusion, institutional quality, green growth, and financial stability. Recent studies have explored the relationships between energy consumption, economic growth, innovation, and environmental sustainability such as (Georgescu and Kinnunen, 2024), (Wu et al., 2022), and (Tutgun, 2025) using Fourier-augmented and bootstrap ARDL approaches have been applied to analyze these complex interactions in various countries.
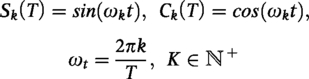
Notation and Fourier terms
Depended variable:
Descriptors (Model 1):
Descriptors (Model 2):
Fourier terms are added deterministically to the classical ARDL. UECM representation for a single frequency pair:
Where, If the ARDL lag chosen for If
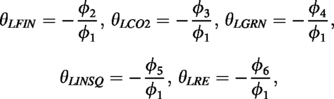
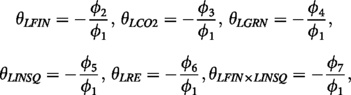
The long-run coefficients are derived from the level coefficients in the UECM:
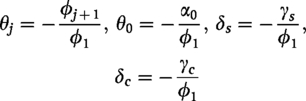
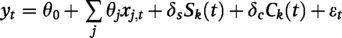
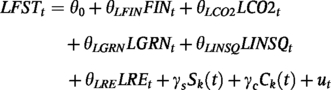
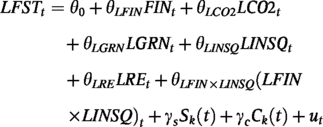
Accordingly, the long-term (levels) equation is:
Model 1: 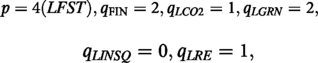
UECM (short term) – Fourier Formula is as follows:
Long term (levels) – Fourier is:
Long-run coefficient matching:
For Model 2:
And UECM (short term) – Fourier:
Long term (levels) – Fourier:
Long-run coefficient matching:
Fourier frequency k was selected by minimizing AIC across
The Fourier terms (
Long-Term Coefficients of Fourier-ARDL for Two Models
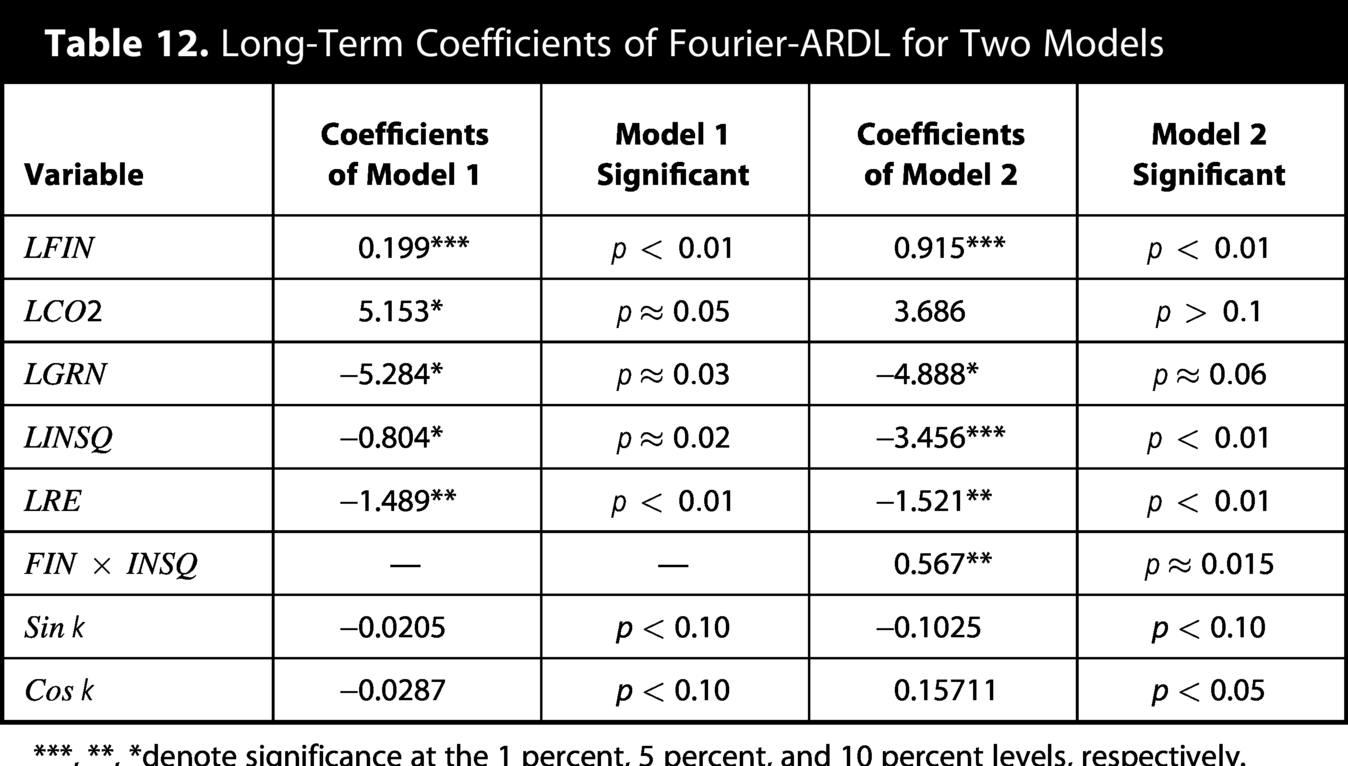
***, **, *denote significance at the 1 percent, 5 percent, and 10 percent levels, respectively.
According to Table 12, in Model 1, financial inclusion (FIN) is positive and significant in the long run, and LCO2 is positive and significant, while green growth (GRN), institutional quality (LINSQ), and renewable energy (LRE) are negative and significant. This result suggests that financial access supports stability, while green transformation and institutional regulations create adaptation costs in the short to medium term. When the interaction term (FIN × INSQ) was included in Model 2, FIN was found to be positive and strong, LINSQ was negative and strong, LRE was negative and strong, and LGRN was negative and marginal. The most critical finding is that FIN × INSQ was positive and significant. This result suggests that institutional quality alone can undermine stability, but when considered in conjunction with financial inclusion, it strengthens stability. Table 13 shows the short-run coefficients of Fourier-ARDL.
Short-Term Dynamics (Selected Coefficients) Fourier-ARDL
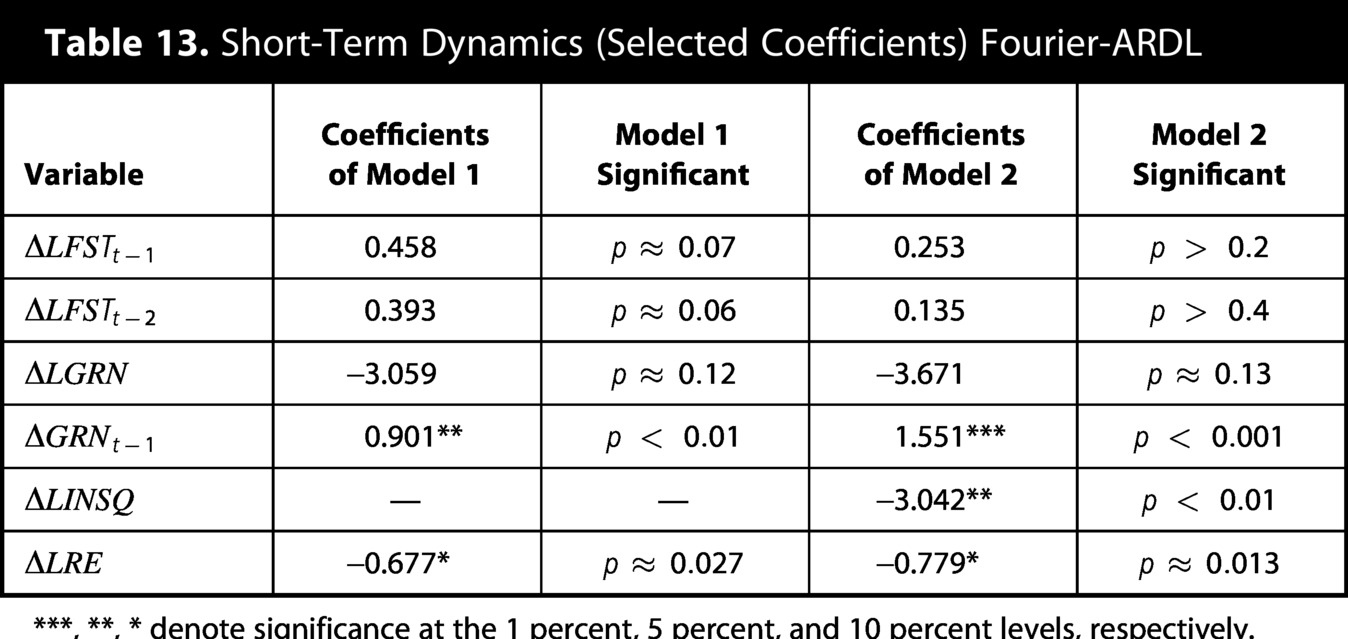
***, **, * denote significance at the 1 percent, 5 percent, and 10 percent levels, respectively.
According to Table 13, in the short term,
The estimated error correction coefficients from the UECMs provide important insights into the adjustment dynamics of financial stability following deviations from long-run equilibrium. As reported in the short-run dynamics tables, the coefficients of the lagged level of financial stability
In highly leveraged financial systems, initial shocks can be amplified through balance sheet effects and credit market frictions (Bernanke et al., 1999), causing temporary over-adjustment. In emerging economies such as Türkiye, strong and rapid policy responses—including monetary policy adjustments, regulatory interventions, or structural reforms—often lead to deliberate overshooting to restore confidence and stabilize markets. The presence of multiple short-run adjustment paths around a single long-run attractor can generate overshooting dynamics, particularly in economies with frequent structural breaks or regime changes. While error correction terms exceeding unity in absolute value are theoretically unusual in standard textbook presentations, they have been documented in empirical literature, particularly with high-frequency financial data (Banerjee et al., 1993). Importantly, this does not invalidate the cointegration relationship when the Bounds test strongly confirms the existence of a long-run equilibrium, as is the case here (F-statistic > critical values). From a technical perspective, the possibility of 
The error correction representation yields the ECT coefficient as
The rapid convergence speed—approximately one year for full adjustment—aligns with Türkiye’s crisis-prone financial history, where strong policy responses and structural reforms have historically induced rapid corrections. This finding underscores the resilience of Türkiye’s financial system in returning to equilibrium despite experiencing significant short-term volatility.
In the context of annual data, these magnitudes imply that the return to equilibrium has largely occurred within a single year, and even that some overshooting may have occurred. Table 14 shows the bound test results for two models.
Bounds Test Results for Two Models
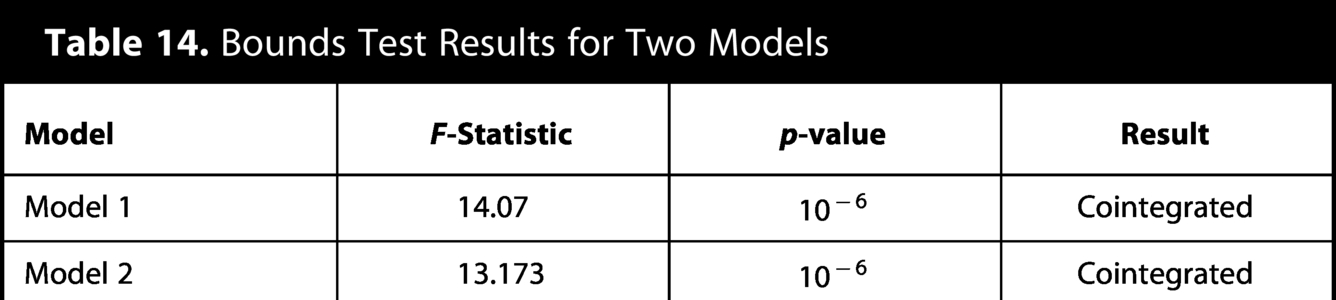
Based on Table 12, the insignificance of the
The findings indicate that financial inclusion is the strongest determinant of long-term financial stability and that when implemented alongside institutions, it strengthens stability by reducing systemic risks. While green transformation may incur short-term costs, it can contribute to long-term stability through gradual, risk-sharing policies. Monitoring real indicators sensitive to crises is crucial during this process.
Conclusion and Policy Recommendations
This study investigated the determinants of financial stability within a sustainability-oriented framework by examining the roles of financial inclusion, institutional quality, carbon emissions, green growth, and renewable energy over the period 1995–2024. Using ARDL and Fourier-ARDL models, the analysis provides evidence on both the long-run equilibrium relationships and the short-run adjustment dynamics among these variables. The empirical findings reveal three central results. First, financial inclusion emerges as the most robust determinant of long-run financial stability. Expanding access to financial services appears to strengthen the resilience of the financial system by broadening participation and improving risk distribution. Second, the interaction between financial inclusion and institutional quality is positive and statistically significant, indicating that institutional capacity strengthens the stabilizing impact of financial inclusion. This result highlights that inclusive financial systems function more effectively when supported by strong governance structures and regulatory frameworks.
Third, environmental and institutional transformation variables exhibit more complex dynamics. Green growth, renewable energy expansion, and institutional reforms are associated with negative coefficients in the long run, suggesting the presence of transition costs during structural transformation processes. These results do not imply that sustainability policies undermine financial stability; rather, they indicate that the transition toward greener production systems and stronger institutions may initially impose adjustment pressures on financial systems before long-term benefits materialize. The analysis also demonstrates that the positive association between carbon emissions and financial stability should not be interpreted normatively. Instead, this relationship appears to reflect economic scale effects, where higher economic activity simultaneously increases emissions and financial depth. The weakening of this relationship under the Fourier-ARDL specification suggests that the connection between emissions and financial stability is unstable and sensitive to structural breaks.
From a methodological perspective, this study contributes to the literature in three ways. First, it constructs a comprehensive financial inclusion index using PCA, capturing the multidimensional nature of financial access. Second, it introduces an interaction framework that explicitly models the conditional role of institutional quality in shaping the impact of financial inclusion. Third, it applies the Fourier-ARDL approach to address structural breaks without pre-specifying their timing, improving the robustness of long-run estimates. Several policy implications emerge from these findings. Strengthening financial inclusion should remain a central strategy for improving financial resilience, but it must be accompanied by institutional reforms that enhance regulatory quality, transparency, and governance effectiveness. At the same time, the financial implications of the green transition should be carefully managed. Renewable energy expansion and green structural transformation require substantial investment and may generate short-term financial pressures. Risk-sharing mechanisms, green financing instruments, and macroprudential oversight can play an important role in mitigating these transition costs.
Finally, this study is subject to certain limitations. The analysis focuses on a single country, which allows detailed examination of structural dynamics but limits generalizability. Future research may extend this framework to multi-country panels, apply nonlinear specifications such as NARDL or threshold models, or incorporate alternative measures of institutional quality and environmental transition. Despite these limitations, the findings highlight the importance of coordinating financial inclusion policies with institutional strengthening and sustainable economic transformation in order to support long-term financial stability.
Authors’ Contributions
M.O. conceptualized the study, designed the methodology, conducted the econometric analysis, and drafted the article. E.K. contributed to literature development, theoretical framing, data organization, and critical revision of the article. Both authors reviewed, revised, and approved the final version of the article.
Use of Artificial Intelligence Tools
Artificial intelligence-based language editing tools were used solely for improving grammar and language clarity. The AI tools were not used for data analysis, interpretation of results, or generation of scientific content. The authors take full responsibility for the integrity, originality, and scientific content of the article.
Ethics
This study does not involve human participants, animals, clinical trials, or personal data. Therefore, ethical approval is not required.
Footnotes
Acknowledgments
The authors would such as to thank the anonymous reviewers for their valuable comments and suggestions. Any remaining errors are the sole responsibility of the authors.
Author Disclosure Statement
The authors declare no conflict of interest.
Funding Information
This research received no external funding.