




Abstract
Background
Muscle hardening, including delayed onset muscle soreness, can be found after vigorous exercise. Some techniques for measuring muscle hardness have been proposed. Freehand ultrasound (US) elastography has been developed and applied to breast imaging.
Purpose
To evaluate the feasibility of US elastography for investigating changes in muscle hardness after eccentric exercise of the elbow flexor muscles.
Material and Methods
Six healthy male volunteers performed eccentric contractions of the elbow flexor muscles of their non-dominant arms. US elastography was performed by using 14-6 MHz linear array transducer combined with a stabilizer and a gel pack of reference agent. Color-coded elasticity images and the relative strain ratio of the biceps brachii muscle to the reference were obtained. To verify the US elastography measurements, a commercially available durometer was also employed. Both measurements were performed before, immediately after, and 1– 4 days after exercise. The mean scores of strain ratios of the US elastography and durometer measurements were examined using repeated-measures ANOVA.
Results
US elastography demonstrated significant muscle hardening and recovery after exercise (P < 0.01). Muscle hardness increased up immediately after the exercise and continued to increase, peaking on day 2 post-exercise, and then decreased until day 4. The durometer indicated similar changes to US elastography. The control arms did not demonstrate any significant change.
Conclusion
US elastography is feasible to measure muscle hardness and to produce a two-dimensional hardness map of the muscle.
Ultrasound (US) elastography is based on the fact that tissue compression produces strain within the tissue and that the stain is lower in harder tissue than in softer tissue (1). Therefore, tissue hardness can be estimated by measuring the tissue strain induced by compression. Tissue elasticity imaging with real-time freehand manipulation of the US probe has been developed (2). US elastography was developed and applied to breast imaging to differentiate benign lesions from malignant lesions (3, 4).
Muscle hardness changes after exercise. Various techniques for measuring muscle hardness have been proposed, including a hardness measuring device (5), and a pressure method (6). Delayed onset muscle soreness (DOMS) is known to occur after vigorous exercise and is characterized by an inflammatory response and muscle dysfunction (7–9). Magnetic resonance (MR) imaging has been employed to investigate the course and mechanism of exercise-induced muscle damage, using T2-weighted imaging including T2 relaxation time (10) and diffusion MR imaging (11, 12). Recently, MR elastography, a phase contrast-based method for observing shear waves propagating in a material to determine its stiffness, has been developed and employed to investigate muscle stiffness (13).
In this study, we investigated the feasibility of US elastography for determining muscle hardness after eccentric contraction.
Material and Methods
Subjects
Six healthy male volunteers, ranging in age from 21–36 years and weight from 50–65 kg, were recruited. They had not been involved in any previous resistance-training program and did not have any history of traumatic injuries or other arm impairments. They were instructed to refrain from participating in any physical exercise or therapeutic treatments during the course of this study.
This study was approved by our institutional review board, and written consent was obtained from all the participants. Before the examination, the participants were given brief descriptions about the purpose of the study, examination procedures, and the potential risks of the examinations.
Exercise model
The subjects performed eccentric contractions of the elbow flexor muscles of their non-dominant arm (the left arm in all six participants). They did not perform any exercise with their contra-lateral arm (right arm), which served as a control. The one repetition maximum was measured for the standing concentric arm curl, starting from full extension of the elbow and moving to full flexion at the side of the body. The subjects performed the eccentric arm curl exercise using a constant load (7–12 kg), which was equal to 120% of each subject's one repetition maximum. The forearm was forcibly extended from a flexed to an extended position in 5 seconds, an examiner removed the weight at full elbow extension, and the subject then returned the un-weighted arm to the flexed position, receiving the weight to begin the next repetition. This action was repeated 15 times, and three sets were performed with a 1-minute interval between each set.
Ultrasound elastography
Ultrasound imaging was performed using a US scanner (EUB 7500; Hitachi Medical Corporation, Tokyo, Japan) equipped with EUP-L65 linear array transducer (14–6 MHz image acquisition frequency, combined with high definition dynamic tissue harmonic imaging technique, high compound multidirectional overlapping imaging, and high resolution tissue adaptive filtering). To press evenly against a wide area of the upper arm, a stabilizer (elliptical shape with a surface area of 65 × 50 mm) was attached to the transducer (Fig. 1). A cooling agent gel packed within a plastic bag with a size of 60 × 50 × 7 mm was stuck on to the surface of the stabilizer-equipped transducer as a reference for elasticity (Fig. 1).

The stabilizer and the reference gel. The stabilizer (S) was attached to the transducer (T) in order to press evenly over a wide surface area. The reference gel (R) was attached to the surface of the stabilizer-equipped transducer
US elastography was performed in transverse (axial) section at the midpoint of the upper arm, where a line was drawn on the skin surface at the mid-length of the upper arm (at the midpoint from the axillary fossa to the olecranon). By monitoring B-mode US imaging, the transducer was positioned above the humerus bone so that it could serve as another landmark and efficiently press the flexor muscles. The transducer was oriented perpendicular to the skin surface and was pressed by free-hand manipulation with an up-and-down, cyclic motion of approximately 2 Hz. To obtain appropriate images for investigation, we applied the transducer with constant repeated pressure by monitoring the pressure indicator incorporated into the US scanner (Fig. 2). The pressure indicator displayed in a scale from 1 to 7 levels, detecting the mean changes in the strain within the region of interest (ROI) per every frame, i.e. differentiating strain from time. By monitoring the pressure indicator, we tried to ensure that the pressure applied to the surface remained constant between levels 3 to 4. As higher levels of pressure manifested a non-linear relationship between pressure and strain, we confined the pressure level slight enough for which the association between pressure and strain was essentially proportional.
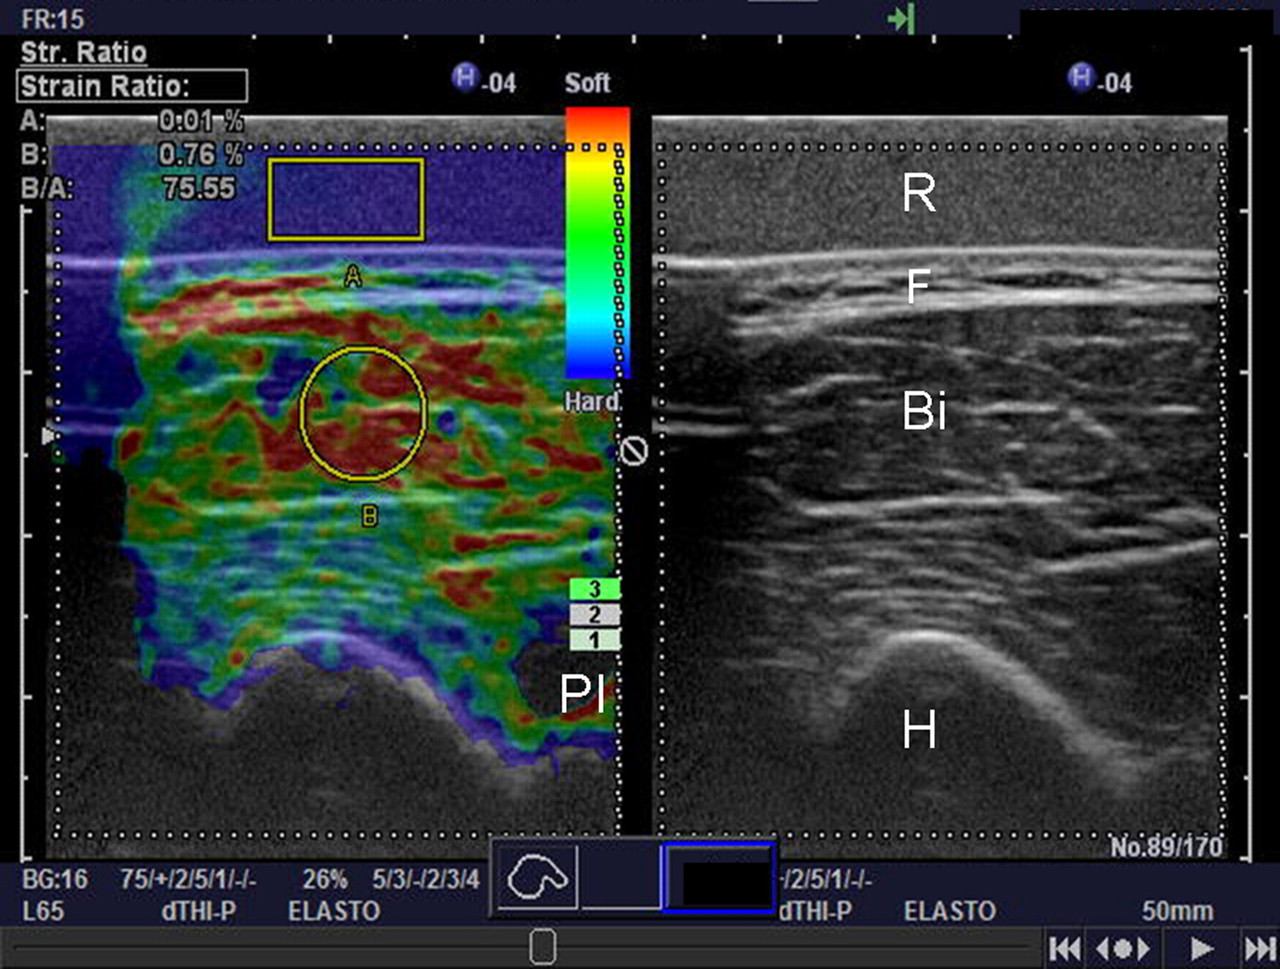
The US elastography display. US elastography image (left) is displayed beside the original B-mode sonogram (right). US elastography, in which the calculated strain image is superimposed onto the B-mode image, displays a color-coded map of elasticity, with harder tissue shown in blue and softer shown in red. A square ROI (A) was placed on the reference gel (R), and a circular ROI (B) was placed on the biceps brachii muscle (Bi), then the strain ratio was calculated as B/A. A pressure indicator (PI) displayed a scale of level 3 (maximum: 7). By monitoring the pressure indicator, a cyclic up-and-down motion was applied to the surface to deliver a constant pressure of between PI levels 3 and 4. F = subcutaneous fat, H = humerus
US elastography is color-coded imaging with a scale depending on the magnitude of strain displayed beside the original B-mode sonogram (Fig. 2). The scale ranges from blue for components with less strain (i.e. hardest components) to red for components with greatest strain (i.e. softest components). Green indicates average strain. Consecutive US elastography images were stored in the US scanner. The calculated strain image was superimposed onto the corresponding B-mode image. A square ROI of approximately 10 × 5 mm in size was placed onto the reference gel and a circular ROI with an approximate diameter of 8 mm was placed on the biceps brachii muscle. The relative elasticity of the muscle compared to that of the reference was indicated by a strain ratio, the ROI of the muscle divided by the ROI of the reference. By adjusting the ROI location on the biceps brachii muscle, the measurements were performed five times, and the mean and standard deviation (SD) were calculated. Edematous muscle swelling occurred just after the exercise and continued for a few days, and the location of the ROI on the biceps brachii muscle was carefully adjusted, after morphological assessment of the muscle using B-mode imaging.
The US elastography was performed on both arms, just before and just after the exercise, and also on the first, second, third, and fourth day after the exercise. The examinations were performed in a sitting position with the elbow placed on the examination bed. As maximal muscle hardness usually occurs in the first 2–3 days after exercise, the elbow was set at an angle of 20 degrees flexion throughout the survey period, in order to keep the tension affecting the biceps brachii muscle constant.
Durometer
Hardness of the arm was also measured using a durometer (ASKER Durometer Type FP; Kobunshi Keiki Corporation, Kyoko, Japan). Durometers measure the hardness of a specimen by pressing an indentor with specific shape onto the surface of the specimen (Fig. 3). The weight of the durometer (300 g) constitutes the pressure applied to the specimen. The durometer was vertically and gently applied to the surface of the arm. Applying a deforming force of a spring, reading the extent of protrusion of the tip of the indentor beyond the face of the foot gives on indication of the tissue hardness. Hardness was indicated on a scale from 0 (softer) to 100 (hardest) arbitrary unit. Measurements were performed five times, and the mean and SD were calculated. The durometer measurements were performed on both arms using identical settings (location and the occasion) as used for the US elastography.

The durometer. Placed on the surface of the arm and applying of the durometer weight, the extent of the indentor (arrow) protrusion beyond the face of the foot was used to indicate the hardness of the specimen
Statistical analysis
A repeated-measures ANOVA was used to assess the changes in the strain ratios produced by US elastography and durometer measurements. Statistical significance was set at P < 0.05.
Results
Serial US elastography of the exercised arm of one subject is demonstrated in Fig. 4. Before the exercise, the color within the ROI on the biceps brachii muscle appeared predominantly reddish, and the strain ratio (B/A) was 83.08. Immediately after the exercise, the ROI contained more green- or blue-colored region, and the ratio decreased to 78.71. Swelling of the muscular structures was noted, and the humerus shifted outside of the view. The ratio on 1 day after the exercise was 59.08, and the ratio continued to decrease to 52.15 on 2 days after the exercise. Then, the ratio increased from 67.61 to 75.10 on 3 days and 4 days after, respectively. The values of the US elastography (mean ± SD, n = 5), before, just after, 1 day, 2 days, 3 days, and 4 days after the exercise, were 83.3 ± 2.07, 68.4 ± 6.51, 62.7 ± 3.89, 50.2 ± 3.29, 70.2 ± 1.66, and 75.9 ± 2.39, respectively.
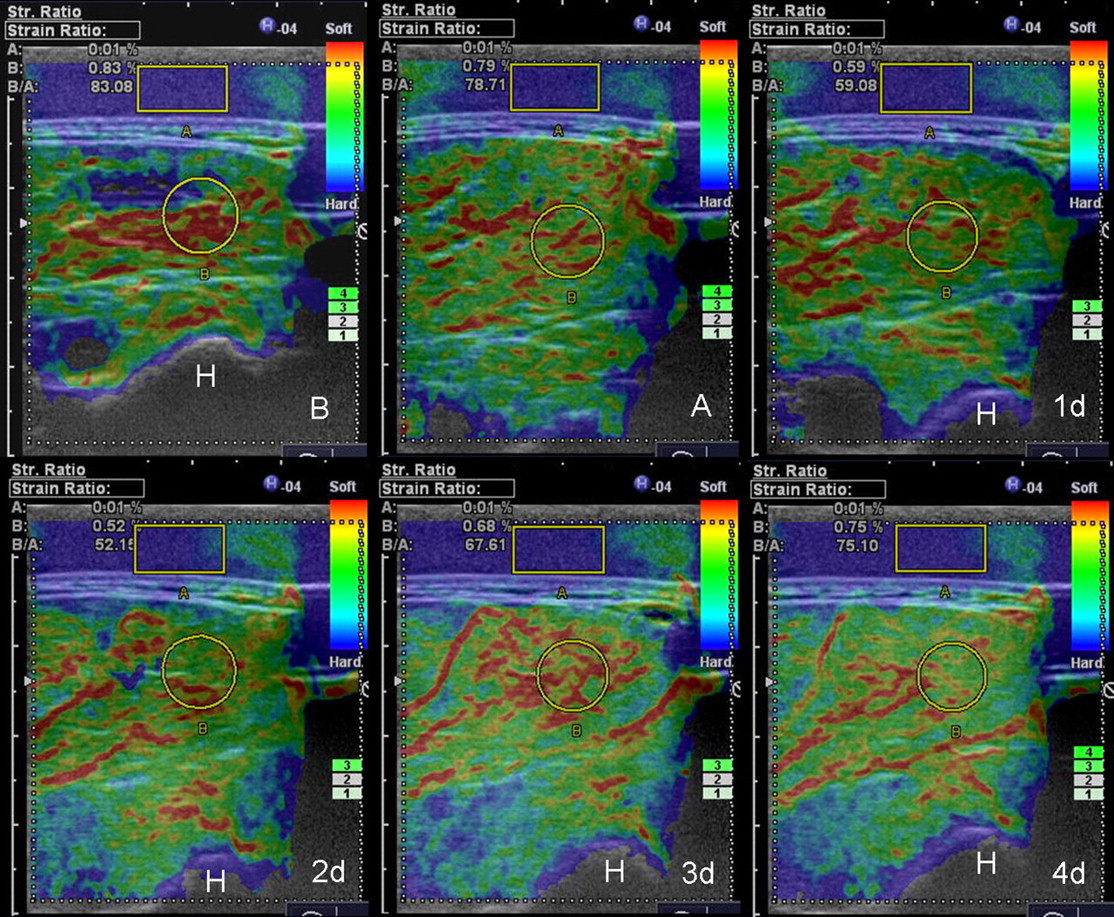
Serial examinations of US elastography of the exercised arm of one subject (subject A) before (upper left, B), just after (A), 1 day (1d), 2 days (2d), 3 days (3d), and 4 days (lower right, 4d) after the exercise. The strain ratio (B/A) is displayed on the upper-left corner of the elastogram. Before the exercise (B), the color within the ROI on the biceps brachii muscle was predominantly reddish. Immediately after the exercise (A), it turned green- or blue-colored, indicating increased hardness, and the muscular tissue swelled up. The strain ratio decreased toward 2 days after the exercise (2d) and recovered until 4 days after the exercise (4d). H = humerus
The values of the durometer measurements (mean ± SD, n = 5), before, just after, 1 day, 2 days, 3 days, and 4 days after the exercise, were 9.8 ± 0.83, 37.0 ± 0.71, 36.0 ± 1.00, 40.8 ± 0.84, 26.6 ± 0.89, and 22.8 ± 0.84, respectively. Both the US elastography and durometer values changed significantly (P < 0.01). Serial US elastography and durometer measurements of the exercised and control arms of the same subject are demonstrated in Fig. 5. As a decreased strain ratio implied increased hardness, a reversed scale was applied to the US elastography component in the combined graph of the US elastography and the durometer measurements (Fig. 5). US elastography values on the reverse scale and the durometer measurements of the exercised left arm indicated similar dynamics; i.e. both values increased immediately after the exercise and peaked at 2 days after. Then, both values decreased until 4 days after. On the other hand, the values of the non-exercised right arm did not change significantly (P > 0.05).
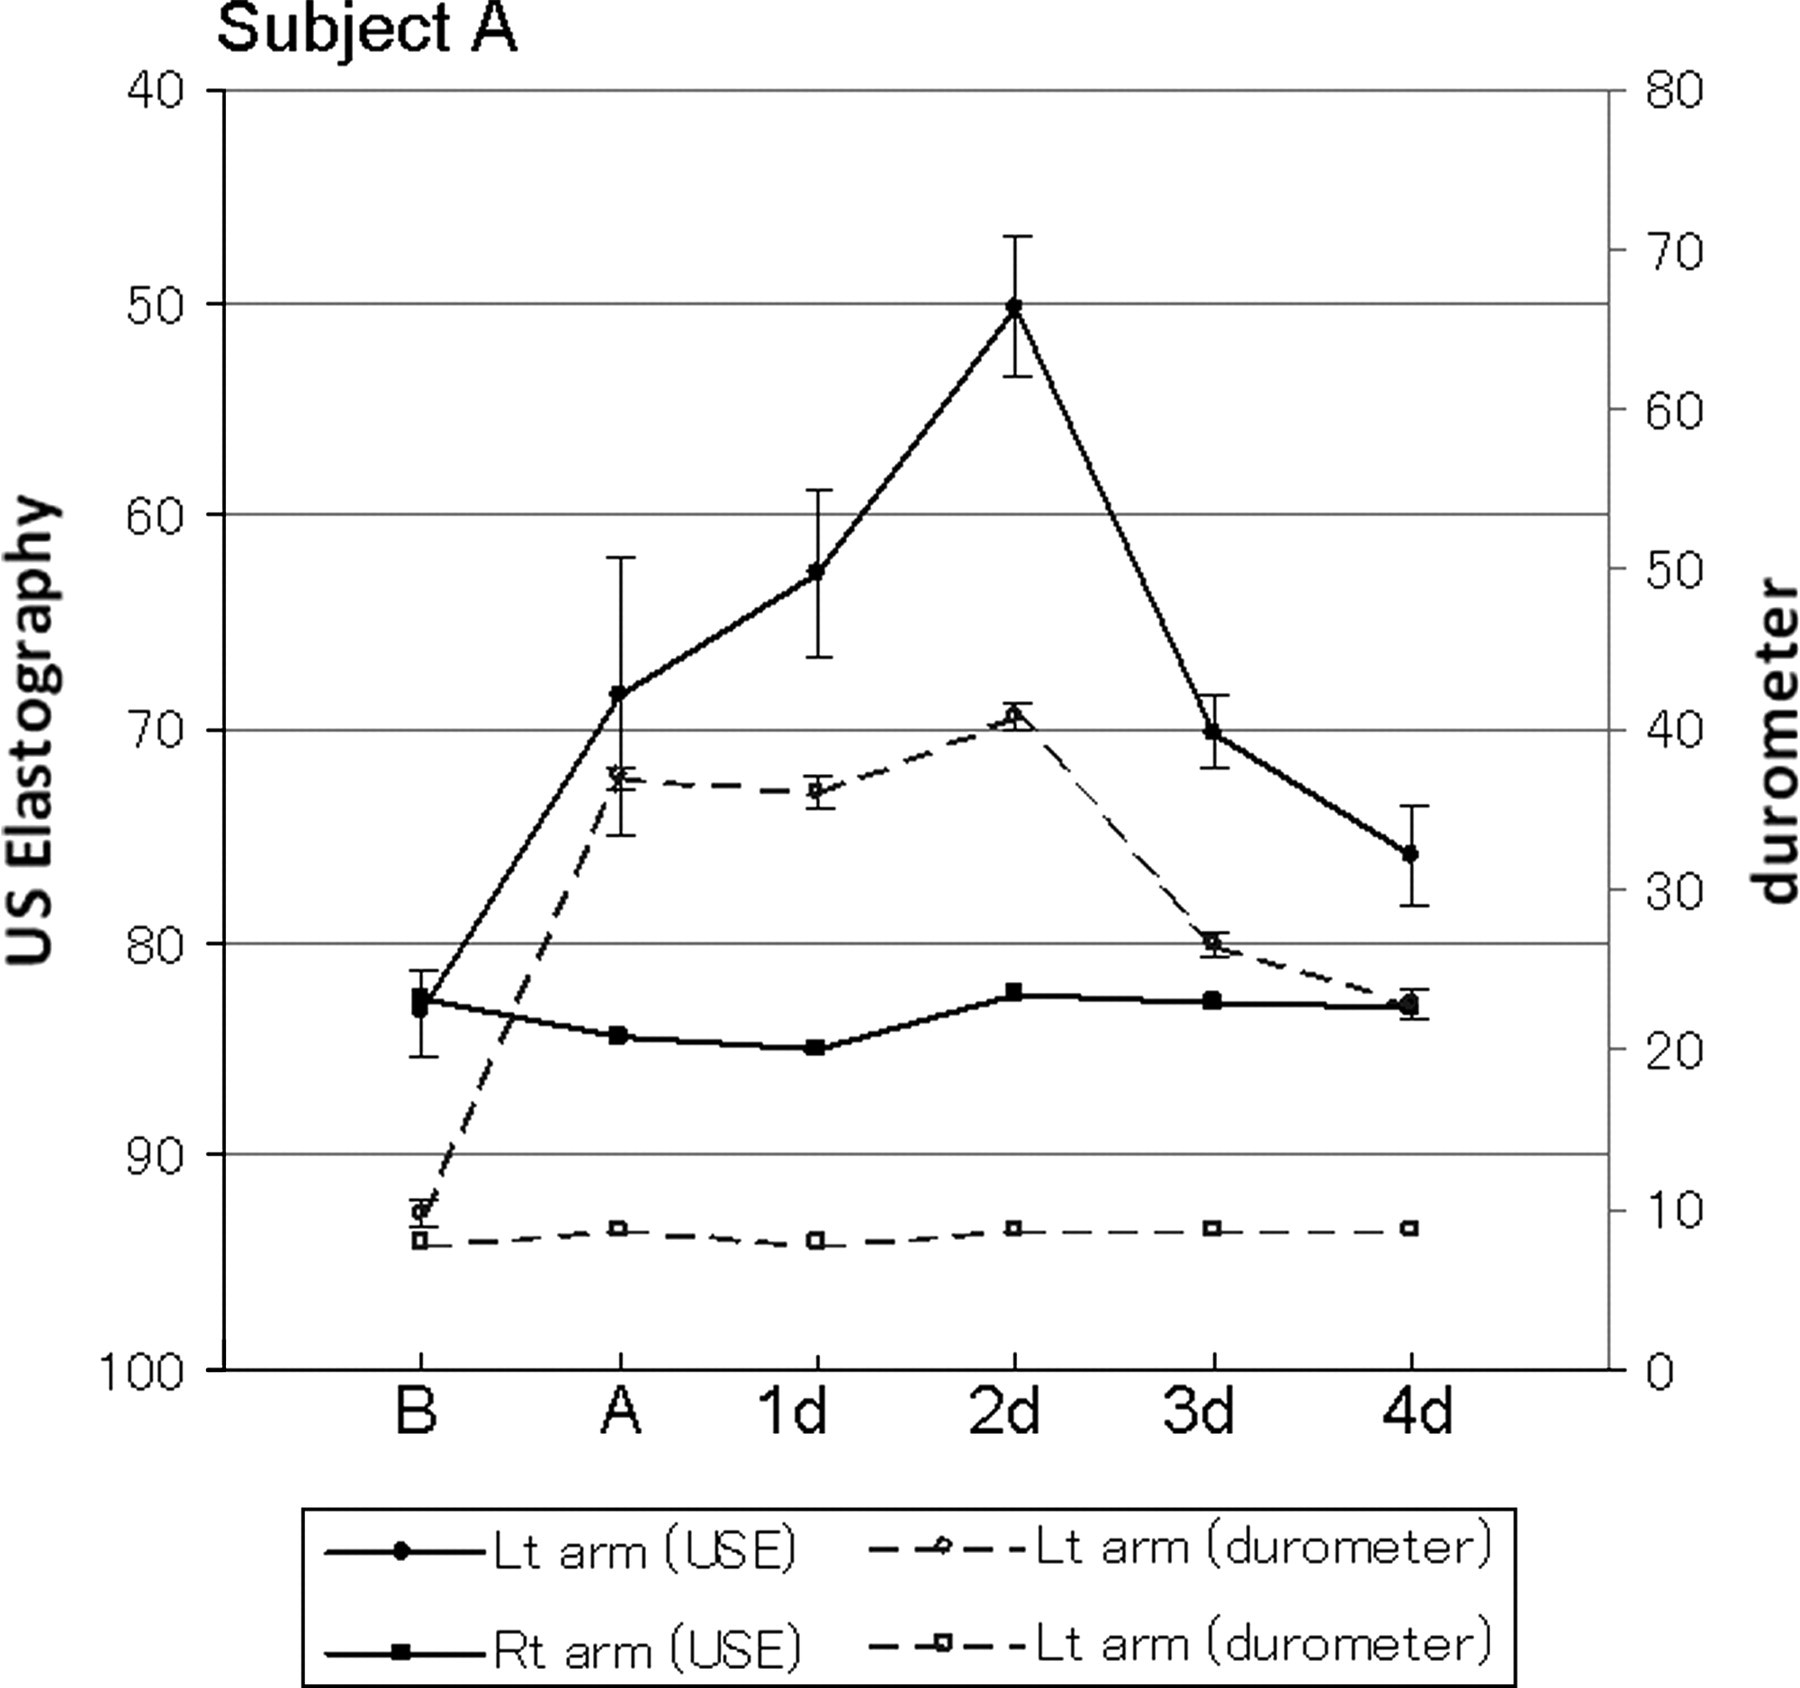
Serial changes of the strain ratio of the US elastography and the durometer measurements of the exercised (left) and the control (right) arms of the subject A. The scale for US elastography has been reversed so that it represent the same outcome as the durometer values; i.e. higher values indicate increased hardness. Compared to the initial value before the exercise (B), strain ratio and durometer values increased immediately after the exercise (A) and increased further until 2 days after exercise (2d). Then, both values decreased. There was no significant change on the contra-lateral, right arm. USE = US elastography
Fig. 6 shows a summary of US elastography and durometer measurements for all six subjects. The strain ratio of US elastography showed similar changes in all subjects; i.e. the values increased immediately after the exercise and continued to increase up to 2 days after, and then decreased. The changes in the durometer measurements were similar to those of the US elastography, except that two of the six subjects peaked at 1 day after, instead of 2 days after. In all subjects, none of the US elastography or durometer measurements for the control arm demonstrated significant changes (P > 0.05), except for the US elastography values of subject C (P < 0.01).
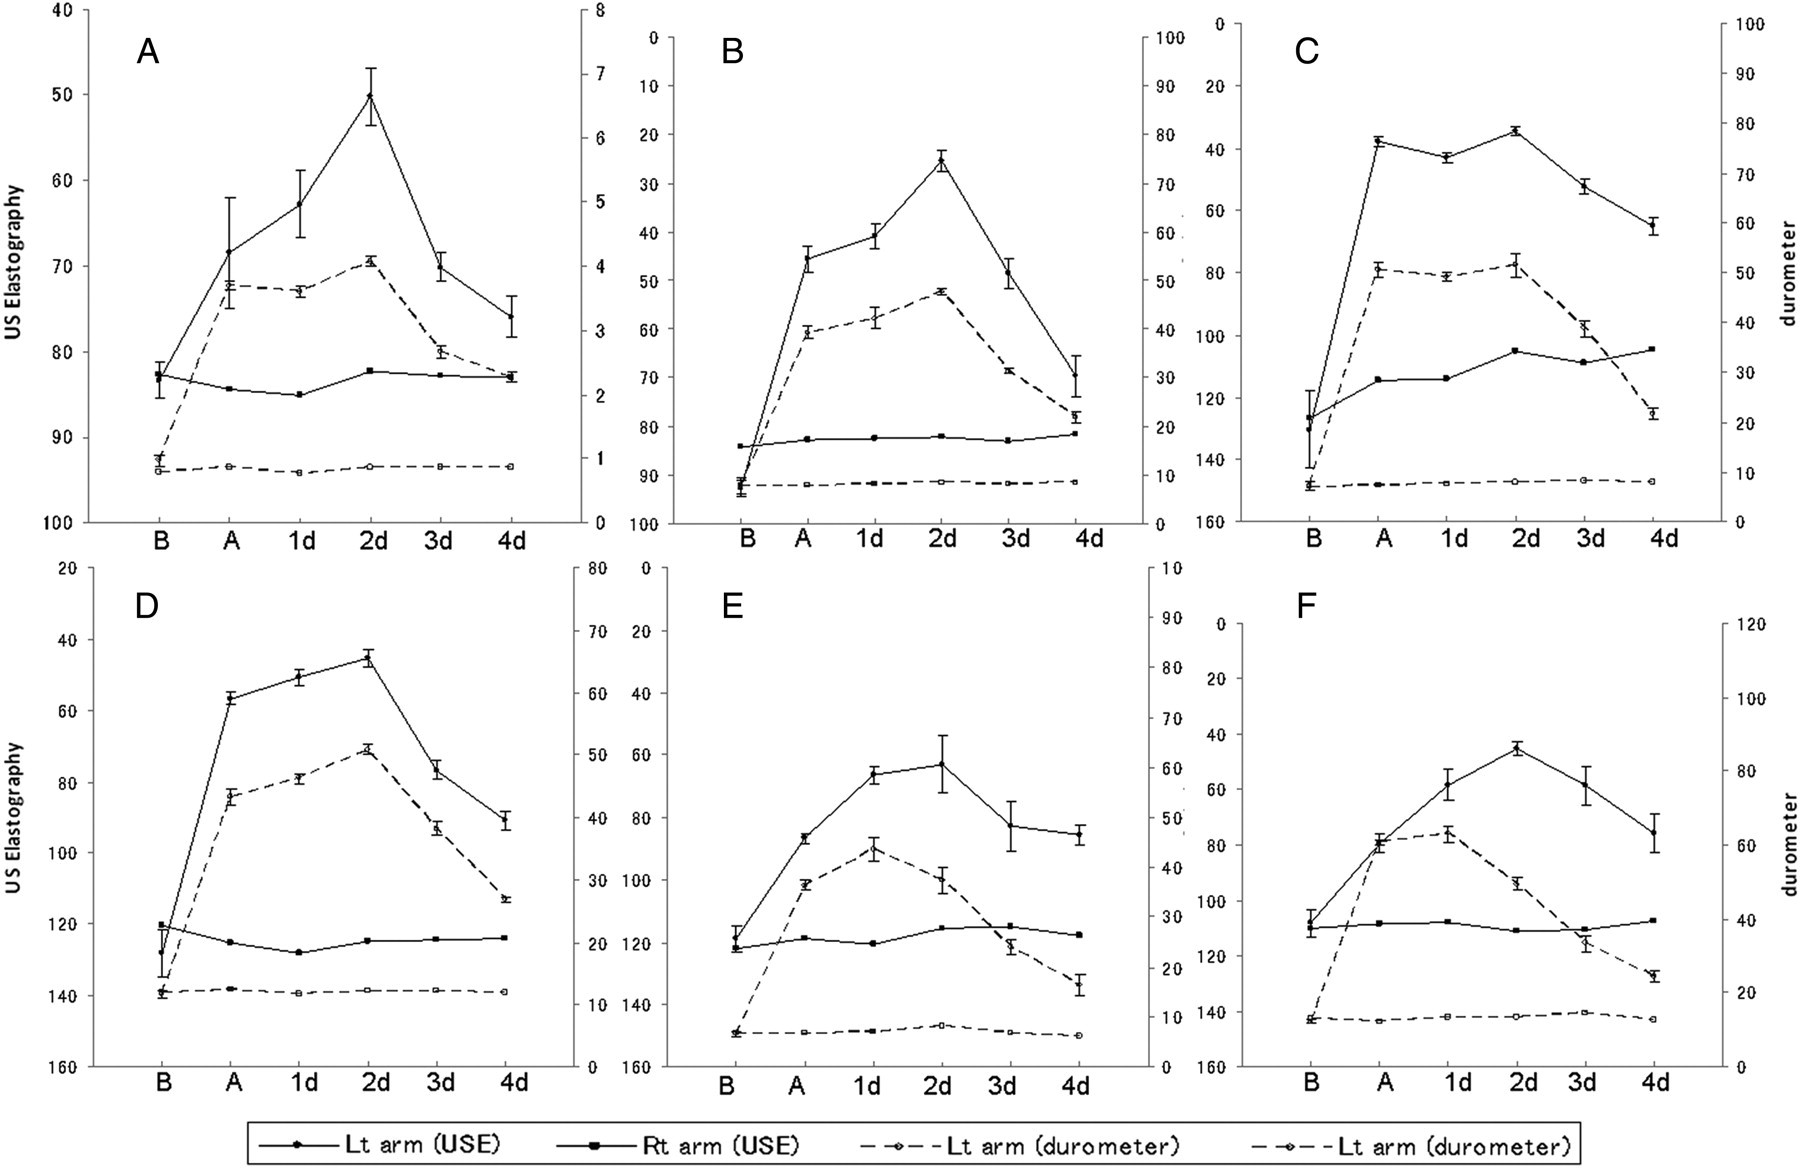
Summary of US elastography and durometer measurements of six subjects. In all subjects, the strain ratio of US elastography and the durometer measurements indicated parallel changes, where the values increased immediately after the exercise and continued to increase until 2 days post exercise (2d), and then decreased (except for the two durometer values of subjects E and F, which peaked on 1 day, instead of on 2 days post exercise). In all subjects, neither the US elastography nor the durometer measurements of the control arm demonstrated significant changes, except for the US elastography values of subject C. USE = US elastography
Discussion
During eccentric muscle contraction, muscle fibers are stretched and are subject to elevated tension, which results in microscopic muscle injuries (14–16). In general, the muscle soreness level increases significantly on 1 day after exercise and peaks on 2 days after, which is known as DOMS (7–9). To evaluate degree of the DOMS supplementary, serum creatine kinase is sometimes measured, but were not checked in this study. Murayama et al. reported muscle soreness developing day 1 after exercise and was maintained for 3 days, peaked at 2 days after, whereas muscle hardness increased immediately after exercise and peaked on 3 days after exercise. It is likely that myofibrillar damage causes muscle soreness, inflammatory substances may sensitize receptors present in damaged muscle (17) and muscle mechanoreceptors may also contribute to the soreness (18).
US elastography and the durometer measurements indicated similar changes to in muscle hardening and softening after exercise. Both measurements indicated that the muscle hardness increased immediately after exercise and peaked on day 2, except for two durometer measurements peaked, which peaked at day 1 after exercise, whereas the control arm did not show any changes in muscle hardness with time. These results were consistent with the above mentioned reviews and studies. US elastography, equipped in the commercially available US scanner, is more accessible for sport medicine field as well as clinical usage than the limited access of MR scanners. Moreover, US elastography, strain images with a translucent color scale superimposed on corresponding B-mode images, provided two dimensional ‘hardness map’ of the exercised muscle. Non-invasively, US imaging can obtain a longitudinal image of the distal myotendinous junction (MTJ) and measure its displacement during maximal isometric force generation (19). As maximal voluntary force increases, differences in MTJ displacement become apparent. Eccentric muscle contraction causes micro-structural damage to muscle fibers, which leads to increased muscle soreness and decreased MTJ displacement during maximal isometric force generation early after exercise. The morphological distribution of the hardness within and around the muscle, including the MTJ and the muscle belly, can provide physiological and also anatomical information about the exercised muscle.
In this study, US elastography used reference index of the strain ratio by comparing the ROI value on the muscle to that of the reference gel. We first tried to employ the subcutaneous fat as reference, however, the fat layer was sometimes not thick enough to allow ROI placement. A commercially available acoustic standoff pad, which is used for scanning superficial structures, was found to be too sonolucent for measuring strain values. Appropriate reference agents require a homogenous internal texture and even compressibility and conductivity for cyclic pressure toward the deep-seated muscular structures. After preliminary trials to find a suitable reference material, we adopted muscle cooling agent gel.
To evaluate muscle hardness and to verify the US elastography measurements, a commercially available durometer was employed. When a deforming force is applied, the extent of protrusion of the indentor indicates the tissue hardness. The reproducibility of this device has not been systematically evaluated, however, it has been widely used and can provide non-invasive hardness information in repetitive measurements. Similar mechanical methods measuring the tissue hardness in which the force required to deform the tissue included a hand-operated indentor device (5) and a mechanical pressure device (6). Of course, the load applied to the surface of the skin includes the sum total of the underlying subcutaneous fat, muscles, intervening stroma, and bones. The durometer indicated similar changes in tissue hardness to that measured by US elastography. No report indicated that muscle exercise alters the hardness of the subcutaneous fat. Moreover, because the thickness of the subcutaneous fat layer of the subjects ranged from 4–9 mm, this seems to be too thin to have a significant effect on the durometer measurement. We believe the hardness measured from the skin surface using the durometer mostly represent the stiffness of the underlying muscular tissue.
US elastography is commercially available and can be employed in clinical settings. The elastic properties of muscular tissue are one way of diagnosing and evaluating degenerative myopathies, to determine the best rehabilitation program for stroke patients, and diabetes (13). It is known that pain, such as tension-type headache, originates from muscle contraction and physical therapist assess muscle hardness subjectively by palpation (5). US elastography demonstrates color map of muscle hardness and can be applied to all striated muscles, provided a US probe can be placed on their surface, e.g. the neck, back, hip, shoulder, arms, and legs. After vigorous exercise of the muscle, muscle belly swelled up and macro-architecture of the muscle changed. When placing ROIs to measure the strain ratio, this muscular swelling and distortion may influence the assessment, however, accompanying B-mode images can be used to morphologically assess the target muscle.
In conclusion, muscle hardness, as measured by US elastography, increased after eccentric exercise and continued to increase, peaking on day 2 post exercise, and then decreased. This pattern was similar to the measurements produced by a durometer and is supported by the previous literatures. US elastography is feasible to measure muscle hardness and to produce a two-dimensional hardness map of the muscle.