
Abstract
Background
Three known risk factors for aortic atherosclerosis predict the severity of coronary artery disease (CAD): aortic calcification (AC), aortic wall thickness (AWT), and aortic distensibility (AD).
Purpose
To determine the relationship of AC, AWT, and AD with the severity of CAD.
Material and Methods
A total of 104 patients who underwent both coronary CT angiography (CCTA) and invasive coronary angiography were enrolled. The severity of CAD was assessed by three methods: the segment involvement score (SIS), the segment stenosis score (SSS), and the modified Gensini score (mG). We quantified AC using the Agatston method on low-dose ungated chest CT (LDCT). We measured AWT at the thickest portion of the descending thoracic aorta on CCTA. AD was calculated as the difference between the maximum and minimum areas of the ascending aorta and the pulse pressure. The relationships between the severity of CAD and the three aortic factors were assessed.
Results
The AC and AWT of the thoracic aorta were significantly higher in the occlusive CAD (OCAD) group (1984.21 ± 2986.10 vs. 733.00 ± 1648.71, P = 0.01; 4.13 ± 1.48 vs. 3.40 ± 1.01, P = 0.22). Patients with OCAD had more than one epicardial coronary artery with >50% luminal stenosis. The AC (r = 0.453 with SIS; r = 0.454 with SSS; r = 0.427 with mG) and the AWT (r = 0.279 with SIS; r = 0.324 with SSS; r = 0.304 with mG) were significantly correlated with all three methods, and the AD was negatively correlated with the SIS (r = − 0.221, P < 0.05, respectively) in the unadjusted model. After adjustment for cardiovascular risk factors, only the correlations between AC and all three methods assessing CAD remained significant.
Conclusion
There are significant relationships between AC, AWT and AD and severity of CAD. In particular, AC measured on LDCT is the most consistent predictor of severity of CAD.
Keywords
Atherosclerotic cardiovascular disease is a diffuse condition involving the coronary arteries, carotid arteries, aorta, and peripheral arteries (1). Atherosis is characterized by morphologic atheromatous lesions in the intima, and sclerosis is characterized by increase in the stiffness of vessel walls (2). As atherosclerosis progresses, vascular wall thickness increases, calcification develops, and the elasticity or distensibility of vessels decreases. Since atherosclerosis is a diffuse condition, previous studies have revealed that atherosclerotic change of the thoracic aorta is related to coronary artery disease (CAD). Three known parameters of the aorta predict coronary artery disease: aortic calcification (AC) (3–7), aortic wall thickness (AWT) (7–10), and aortic distensibility (AD) (2, 11–13). These atherosclerotic changes of the aorta have been evaluated by various modalities: echocardiography (9, 12, 14, 15), computed tomography (2–8, 11, 13), and magnetic resonance imaging (10, 16, 17).
To the best of our knowledge, no studies have evaluated the relationship between CAD and all three parameters of the aorta. Electrocardiography (ECG)-gated coronary CT angiography enabled evaluation of not only coronary artery disease, but also the aortic atherosclerotic changes, including AWT, AC, and AD.
This study was conducted to determine the relationships of AWT, AC, and AD to CAD using coronary CT angiography (CCTA).
Material and Methods
Patients
This retrospective study involved patients who had atypical chest pain and an intermediate pretest likelihood of having CAD, who underwent CCTA to rule out CAD from July 2008 until June 2009. Patients with CCTA findings of significant (>50%) luminal stenosis or patients who had discordant imaging findings with symptoms underwent invasive coronary angiography for the exact evaluation of coronary stenosis. Patients who underwent both CCTA and invasive coronary artery were included. Patients were excluded if CCTA image quality was poor for the detection of coronary artery plaques due to motion artifacts. We included 104 consecutive patients in this study (70 men and 34 women; mean age, 62 years; age range, 37–87 years).
The following data were also obtained: age, gender, cardiovascular risk factors (hypertension, diabetes mellitus, hypercholesterolemia, and smoking), blood pressure during image acquisition, heart rate during scanning, and medications. Laboratory findings such as serum levels of high density lipoprotein (HDL), low density lipoprotein (LDL), total cholesterol (TC), triglyceride (TG), high sensitivity C-reactive protein (hsCRP), and HbA1C were also measured in all patients. Since this was a retrospective analysis of clinical studies performed for other clinical reasons with a standard cardiac CT protocol, our Institutional Review Board waived the requirement for informed consent.
Coronary CT angiography image acquisition
Electrocardiogram (ECG)-gated CCTA studies were performed using a 64 detector-row scanner (Brilliance 64 channel, Philips Medical Systems, Cleveland, OH, USA). We first performed a pre-contrast, non-ECG-gated, low-dose thoracic CT (LDCT) instead of the calcium score scans to evaluate the incidental extracardiac findings and to determine a strict scanning range for the CCTA. The scanning parameters of the LDCT were slice collimation: 64 × 0.625 mm; gantry rotation time, 500 ms; tube voltage, 120 kV; tube current, 30 mAs. The calculated radiation dose was 1.076 ± 0.097 mSv. Serial images starting from the aortic arch to the diaphragm with a 3-mm thickness and 3-mm intervals were reconstructed. Subsequently, the standard coronary imaging protocols were applied, including the use of an oral beta-blocker (metoprolol tartrate; Betaloc®, AstraZeneca, Seoul, Korea) for patients with heart rates >65 bpm (unless contraindicated) and nitroglycerin (a 0.6 mg sublingual tablet, Myungmoon Pharm Co., Ltd., Seoul, Korea) for all patients. A bolus of 80 mL of a contrast agent (iopromide, Ultravist 370, Bayer Schering Pharma AG, Berlin, Germany) was intravenously injected at a rate of 5 mL/s, and then 40 mL mixture of saline and contrast agent chase (a ratio of 7:3) was injected. As soon as the density in the ascending aorta reached a predefined threshold of 100 Hounsfield units (HU), the scan started automatically with a 6-s scan delay, and the entire volume of the heart was scanned during one breath-hold (8–10 s) with simultaneous recording of the ECG-tracing. The imaging parameters were a slice collimation of 64 × 0.625 mm, a gantry rotation time of 420 ms, a tube voltage of 120 kV, and a tube current of 800 mAs. The calculated radiation dose was 11.49 ± 3.62 mSv. The optimal ECG phase that provided the best image quality was chosen using retrospective ECG-gating. The end-systolic and end-diastolic phase images were also obtained for the evaluation of aortic distensibility. The image quality of coronary artery was evaluated on a 4-point scale: 1, excellent image quality without any artifacts throughout the coronary artery; 2, acceptable image quality, not compromising the assessment of the vessel; 3, non-diagnostic image quality for a single segment within one coronary artery; and 4, non-diagnostic image quality for multiple segments within a coronary artery (18). Images with scores 3 or 4 were excluded from the analyses.
Coronary CT angiography analysis of coronary artery disease severity
The CCTA was evaluated using a dedicated work station (Extended Brilliance Workspace, Philips Medical Systems). The severity of CAD was assessed by three methods: the segment stenosis score (SSS), the segment involvement score (SIS) and the modified Gensini score (mG). The segment stenosis score (SSS) is an estimate of the diameter of the stenosis per segment. It was scored as very mild < 30% (1), mild 30–49% (2), moderate 50–69% (3), or severe >70% (4) using the worst score in the segment. The SSS was calculated as the sum of the individual segment stenosis scores (19). The segment involvement score (SIS) was used to estimate the amount of plaque for each segment. The amount of plaque was scored as absent (1) or present (2). The SIS was calculated as the sum of the individual segment involvement scores (19). The Gensini score was originally used in conventional coronary angiography (20). It is a scoring system that depends on the degree of luminal stenosis (in percentage) and the geographical importance of its location. A severity score of 1 to 32 for each vascular segmental stenosis is given and then multiplied by a factor that takes into account the importance of the lesion's position in the coronary arterial tree. For the modified Gensini score (mG) used for the CCTA, each of the vascular segments with severe stenosis >90% was graded as 8.
In addition, the patients were classified into two groups: patients with and without OCAD. Patients with OCAD had more than one epicardial coronary artery with >50% luminal stenosis. There was no luminal stenosis >50% in any of the three epicardial coronary arteries in the patients without OCAD.
Quantification of aortic calcification
LDCT images were used to quantify aortic calcification (21). Calcifications of the ascending and descending thoracic aorta ranging from the upper edge of aortic arch to the cardiac apex were quantified using the Agatston algorithm (22) (Fig. 1). The lesion definition was the same as that for coronary calcification. Some calcified foci extending into the aortic root wall were excluded.
Measurement of aortic calcification (AC). Pre-contrast LDCT images at the levels of the aortic arch (A) and the descending thoracic aorta (B) were transferred to a workstation and show highlighted aortic calcifications (pink) using the Agatston method (above a 130 HU threshold)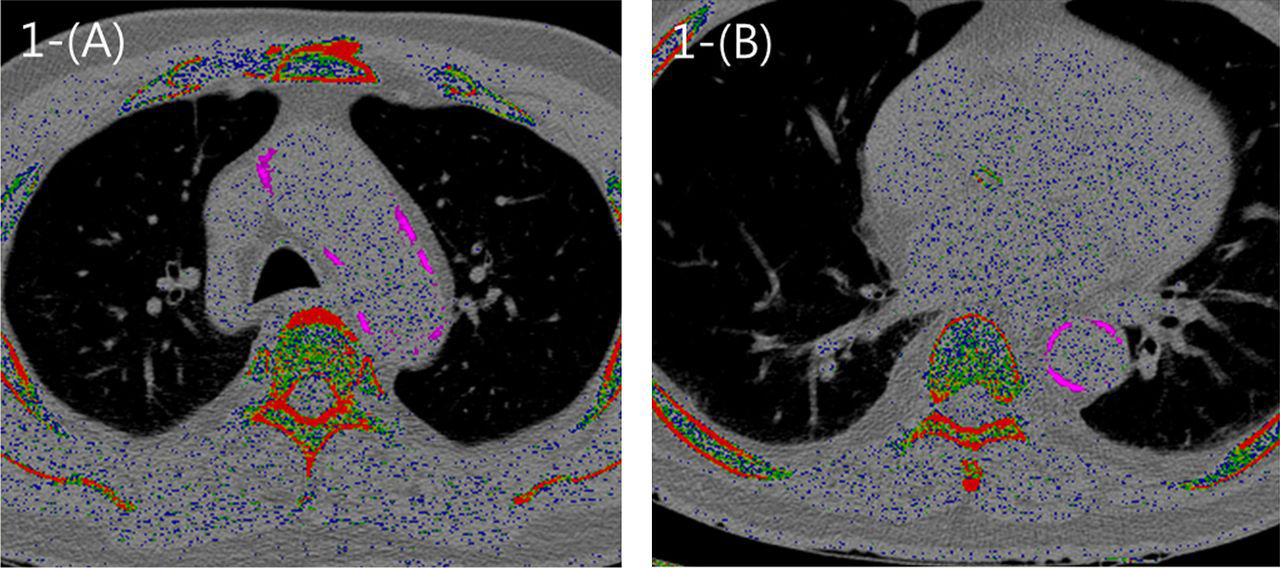
Aortic wall thickness measurements
Wall measurements were performed on the enhanced CCTA using the same workstation as previously mentioned (8). The thickest portion of the descending thoracic aorta was measured perpendicular to the center of the vessel (Fig. 2). Because it was impossible to delineate the different layers of the aortic wall on CT, we assessed the maximum wall thickness and not the intima-media thickness (IMT) or the isolated plaque thickness (8). Measurements were performed during the mid-diastolic phase (75–85%).
Measurement of aortic wall thickness (AWT). During the mid-systolic phase (75–85% of the RR interval), the maximal wall thickness was measured at the thickest portion of the descending thoracic aorta, perpendicular to the center of the vessel. Since all of the aortic wall was not distinguishable on CT images, only the maximal wall thickness was assessed
Aortic distensibility
AD was calculated as the difference of the maximum and minimum vessel cross-sectional areas of the aorta and the pulse pressure, which were measured during the CT scan (10, 13). At the level of the pulmonary artery bifurcation, the areas of the ascending and descending thoracic aorta were measured under two selected cardiac phases: the end-diastolic phase (0% of the RR interval) and the end-systolic phase (35–40%) (Fig. 3). AD was defined as follows: AD = (maximum area − minimum area)/(minimum area × ΔP), where maximum and minimum areas are the vessel cross-sectional areas at the end-systolic and the end-diastolic phases and the ΔP is the pulse pressure in millimeters of mercury.
Measurement of aortic distensibility (AD). At the level of the pulmonary artery bifurcation, the areas of the ascending and descending thoracic aortas were measured during the end-diastolic phase (a, 0% of the RR interval) and the end-systolic phase (b, 35–40% of the RR interval). The AD was calculated as follows: AD = (maximum area − minimum area)/(minimum area × ΔP), where maximum and minimum areas are the vessel cross-sectional areas at the end-systolic (a) and the end-diastolic (b) phases, and the ΔP is the pulse pressure in mL of mercury
Statistical analysis
All continuous variables are expressed as means ± standard deviations and the categorical variables are reported as percentages. Differences in baseline clinical characteristics and measured data between men and women were assessed by independent t tests for continuous variables and by chi square tests for categorical variables. The relationships of occlusive CAD with AC, AWT, and AD were evaluated by the independent t test. We also assessed the relationship between the severity of CAD and the thoracic aortic parameters by Pearson's correlation analysis. The partial correlation coefficient of the chi square test were used to control for cardiovascular risk factors. All analyses were performed using SPSS for Windows 12.0 (SPSS Inc., Chicago, IL, USA).
Results
Baseline clinical characteristics and data (n = 104)
*Antihypertensive or antihyperlipidemic agents
HDL, high density lipoprotein; hsCRP, high sensitivity C-reactive protein; LDL, low density lipoprotein; TC, total cholesterol; TG, triglycerides
Coronary CT angiography findings (n = 104)
AC, aortic calcification; AscAD, aortic distensibility of the ascending aorta; AWT, aortic wall thickness; DscAD, aortic distensibility of the descending aorta; mG, modified Gensini score; SIS, segment involvement score; SSS, segment stenosis score
Associations between occlusive coronary artery disease and aortic parameters
Associations between occlusive coronary artery disease and aortic parameters
AC, aortic calcification; AscAD, aortic distensibility of the ascending aorta; AWT, aortic wall thickness; DscAD, aortic distensibility of the descending aorta; OCAD, occlusive coronary artery disease
Correlations between severity of coronary artery disease and aortic factors
Correlations between severity of coronary artery disease and aortic parameters
*P < 0.001
**P < 0.05
AC, aortic calcification; AscAD, aortic distensibility of the ascending aorta; AWT, aortic wall thickness; DscAD, aortic distensibility of the descending aorta; M1, unadjusted; M2, age and gender-adjusted; M3, adjusted for all the cardiovascular risk factors; mG, modified Gensini score; SIS, segment involvement score; SSS, segment stenosis score
Discussion
In this study, we simultaneously compared the indices of CAD or coronary plaque burden to three parameters of aortic atherosclerosis (AWT, AC and AD) in patients who underwent both CCTA and coronary angiography.
In previous studies, thoracic AC was found to be a strong predictor of coronary artery calcifications, and this relationship was independent of cardiovascular risk factors (3, 6). Coronary artery calcification was associated with increased risk of death and cardiovascular disease (4). Takasu et al. (7) demonstrated an association between aortic atherosclerosis and obstructive CAD by performing MDCT in 97 patients. They assessed aortic plaque and AC together as aortic variables of atherosclerosis. In that study, aortic plaques found on CT were sensitive for diagnosing CAD, and AC was specific for CAD. Other investigators have shown that thoracic AWT measured with MDCT was associated with CAD (8) and the intima-media thickness of the aortic arch measured with transesophageal echocardiography was a strong predictor of the presence of CAD (9).
Our results agree with those of previous studies. In our study, the AC and AWT of the thoracic aorta were significantly higher in the occlusive CAD group. The AC and AWT were significantly correlated with the plaque burden (SIS) and the severity of CAD (SSS and mG) in the unadjusted model, though the AC tended to be more strongly correlated. The correlation between only the AC and all three aortic parameters remained significant after adjustment for the cardiovascular risk factors. Meanwhile, van Popele et al. (11) showed that aortic stiffness, assessed by measuring the carotid-femoral pulse wave velocity, was strongly and independently associated with coronary atherosclerosis in elderly subjects. Okuyama et al. (2) used ECG-gated multislice CT and showed that the atheromatous score and the stiffness (β) of the descending thoracic aorta were significantly higher in the CAD group than in the control group. However, the AD was not associated with occlusive CAD in our study, and the ascending AD was negatively correlated with the SIS only in the unadjusted model. We assume that this result was due to our study cohort characteristics different from others. The proportion of patients with occlusive CAD was high because our study population was composed of patients who underwent both CCTA and invasive coronary angiography. Accordingly, AC turned out to be the most consistent predictor of the severity of CAD in our study. In addition, the association between severity of CAD and aortic factors was statistically significant, but the correlation coefficient was relatively small as in other prior studies (5, 6). Since our study considered all AC, AWT, and AD at the same time, it may have resulted in a relatively low correlation coefficient.
There are various modalities for conducting a cardiovascular imaging study, and these modalities can help detect the atherosclerotic burden at an early stage (23). Echocardiography is relatively easy to use, and enables evaluationof AD and wall thickness, but the range of the evaluable aortic segments is limited. Although there is concern about radiation exposure, retrospective ECG-gated CCTA can simultaneously evaluate AC, maximal AWT, and AD. The ability of MDCT to depict atherosclerotic change of the thoracic aorta makes it a potential tool for detecting patients with subclinical CAD (23). In addition, dynamic CT imaging of the thoracic aorta and cardiac structures, including the coronary arteries, can provide more detailed insight into the prognosis of patients with severe aortic pathology (24). Routine chest CT combined with assessment of thoracic aortic atherosclerotic change, such as AWT, is another possible method of cardiovascular screening (23).
There are some limitations in our study. First, the patients involved in our study did not represent the general population with average risk for cardiac events. Our patients were suspected to have CAD, and all underwent invasive coronary angiography; therefore, the prevalence of CAD was high in our study group. With this limitation, the results of this study might not be applicable to other populations. Second, the sample size of our study was relatively small, and the study design was retrospective in nature. Finally, AC measured using Agatston method on LDCT may not be accurate. Two previous studies reported that the low-dose ungated MDCT is reliable for prediction of the presence of coronary artery calcification (CAC) and categorization of the four major Agatston score ranks in comparison with ECG-gated standard-dose calcium scoring CT (25, 26). Another recently published study showed excellent concordance between CAC and thoracic AC measures on ungated thoracic and ECG-gated cardiac CT scans (21). According to this evidence, measuring AC using the Agatston method on LDCT as done in this study is expected to be almost as accurate as ECG-gated CT.
In conclusion, AC and AWT, among the three representative parameters of aortic atherosclerosis, correlate with the severity of CAD. AC measured on LDCT is reliable predictor of the severity of CAD. Therefore, investigating atherosclerotic changes in the thoracic aorta with low-dose unenhanced chest CT may be useful for screening CAD.
Footnotes
ACKNOWLEDGEMENTS
This study is supported by a Korea University Grant.