




Abstract
Background
Thanks to the development of computed tomography (CT) scanners and computer software, accurate coronary artery segmentation can be achieved with minimum user interaction. However, the question remains whether we can use these segmented images for reliable diagnosis.
Purpose
To retrospectively evaluate the diagnostic accuracy of coronary CT angiography (CCTA) using segmented 3D data for the detection of significant stenosis.
Material and Methods
CCTA data-sets from 30 patients were acquired with a 64-slice CT scanner and segmented using the region growing (RG) method and the “virtual contrast injection” (VC) method. Three types of images of each patient were reviewed by different reviewers for the presence of stenosis with diameter reduction of 50% or more. The evaluation was performed on four main arteries of each patient (120 arteries in total). For the original series, the reviewer was allowed to use all the 2D and 3D visualization tools available (conventional method). For the segmented results from RG and VC, only maximum intensity projection was used. Evaluation results were compared with catheter angiography (CA) for each artery in a blinded fashion.
Results
Overall, 34 arteries with significant stenosis were identified by CA. The percentage of evaluable arteries, accuracy and negative predictive value for detecting stenosis were, respectively, 86%, 74%, and 93% for the conventional method, 83%, 71%, and 92% for VC, and 64%, 56%, and 93% for RG. Accuracy was significantly lower for the RG method than for the other two methods (P < 0.01), whereas there was no significant difference in accuracy between the VC method and the conventional method (P = 0.22).
Conclusion
The diagnostic accuracy for the RG-segmented 3D data is lower than those with access to 2D images, whereas the VC method shows diagnostic accuracy similar to the conventional method.
Keywords
Three-dimensional (3D) volume visualization techniques, such as maximum intensity projection (MIP) and volume rendering technique (VRT), allow physicians to efficiently and comprehensively review complicated 3D structures from large computed tomography angiography (CTA) data-sets. They have therefore been widely used for viewing vascular structures in clinical practice (1), and studies have proved their accuracy for stenosis evaluation (1–3). However, for coronary CT angiography (CCTA), panoramic MIP or VRT images are less helpful in diagnosing coronary artery disease (CAD), due to the concealing effect of contrast medium in adjacent heart chambers and great vessels. Ferencik et al. reported that diagnosis of coronary stenosis based on pre-rendered 3D volume rendering images (after isolating the heart from its surroundings) is not satisfactory (sensitivity 61%, specificity 85%) (4). So, radiologists and cardiologists still largely depend on viewing original slices, oblique multiplanar reformatting (MPR), and curved plane reformatting (CPR) images.
Another way to solve the concealing effect is to perform segmentation and thus eliminate all non-coronary vascular structures. Thanks to the development of image acquisition techniques and postprocessing software, “accurate” coronary segmentation can be achieved automatically or semi-automatically (5–10). However, the question remains whether we can use these segmented images for reliable diagnosis. Should we examine the coronary arteries segment by segment with 2D MPR, regardless of what the 3D image suggests, or can we combine 3D and 2D techniques to achieve both accuracy and time efficiency? The purpose of our study was to investigate the diagnostic value of segmented 3D data by retrospectively evaluating the diagnostic accuracy of CCTA for the detection of significant stenoses when using only segmented data, with coronary catheter angiography (CA) as the reference standard.
In this study, two segmentation methods were evaluated. One is region growing (RG) (7), the other is “virtual contrast injection” (VC) (11). The RG method, which is widely implemented in commercial software packages, usually starts from a given seed point/region and gradually adds the neighboring points into the region if their intensity value falls within a given range. The VC method normally requires two sets of seeds, one in the ventricle, the other in the coronary artery. The algorithms mimic the spreading of two competing contrast agents, so if the point is reached by the contrast from the coronary artery first, then it belongs to the artery, otherwise it belongs to the ventricle. The VC method is freely available as open source software (11). Both segmentation methods were combined with 3D interactive MIP viewing, and the accuracy of stenosis estimation was then compared with using conventional MPR combined with CPR 2D method.
Material and Methods
Patients
CTA data-sets from 30 patients (23 men and 7 women, mean ± SD age 64 ± 8 years) enrolled in an original research study investigating the relationship between biomarkers and imaging parameters suggestive of vulnerable plaques were evaluated retrospectively. Subjects were selected from hospitalized unstable coronary artery disease (CAD) patients or patients with non-ST segment elevation myocardial infarction in the period from January 2007 till February 2008. The exclusion criteria included contraindications to performing coronary CT or invasive angiography. The original study was approved by the regional ethical review board in Linköping.
Dual source CT protocol
CCTA was performed with a dual-source 64-slice CT scanner (Somatom Definition, Siemens Medical Solutions, Forchheim, Germany). The tube voltage was 100 kV for both tubes, with maximum current 360 mAs from 35% to 85% of the cardiac cycle, gantry rotation time 0.33 s, and pitch 0.2–0.44 adapted to the heart rate. In each rotation, 64 slices are generated with a collimation of 0.6 mm. Five milligram of intravenous metoprolol (Seloken, AstraZeneca, Basiglio, Milan, Italy) was administered to obtain an optimal heart rate. The average (± standard deviation) of the recorded heart rate during scan was 60 ± 8 bpm. A “test bolus” protocol was used to time the acquisition of the CCTA: 10 mL of iopromide, 370 mg I/mL (Ultravist; Bayer Schering Pharma AG, Berlin, Germany) was followed by 50 mL saline solution. For CCTA, 70 mL of the contrast agent was injected, followed by 50 mL saline solution. In both steps, the flow rate was 6 mL/s. Axial images were reconstructed with 0.75 mm slice thickness and 0.5 mm increment, using a medium sharp convolution kernel (B26) and retrospective ECG gating. Best diastolic 3D images were automatically selected with minimum cardiac motion detection technique.
Postprocessing
Transverse images of the best diastolic series were transferred to an off-line workstation (Leonardo; Siemens Healthcare, Erlangen, Germany). One observer with 4 years of experience in cardiac CT imaging performed interactive vessel segmentation with the RG based method on all 30 data sets with the “Circulation” software (9). After segmentation, the left and right coronary arteries were manually separated and saved into two new series of 2D slices, as shown in Fig. 1.
An example of data presentation: (a) catheter angiography; (b) 5 mm thin-slab MIP of original data; (c) 3D MIP of VC segmented data; (d) 3D MIP of RG segmented data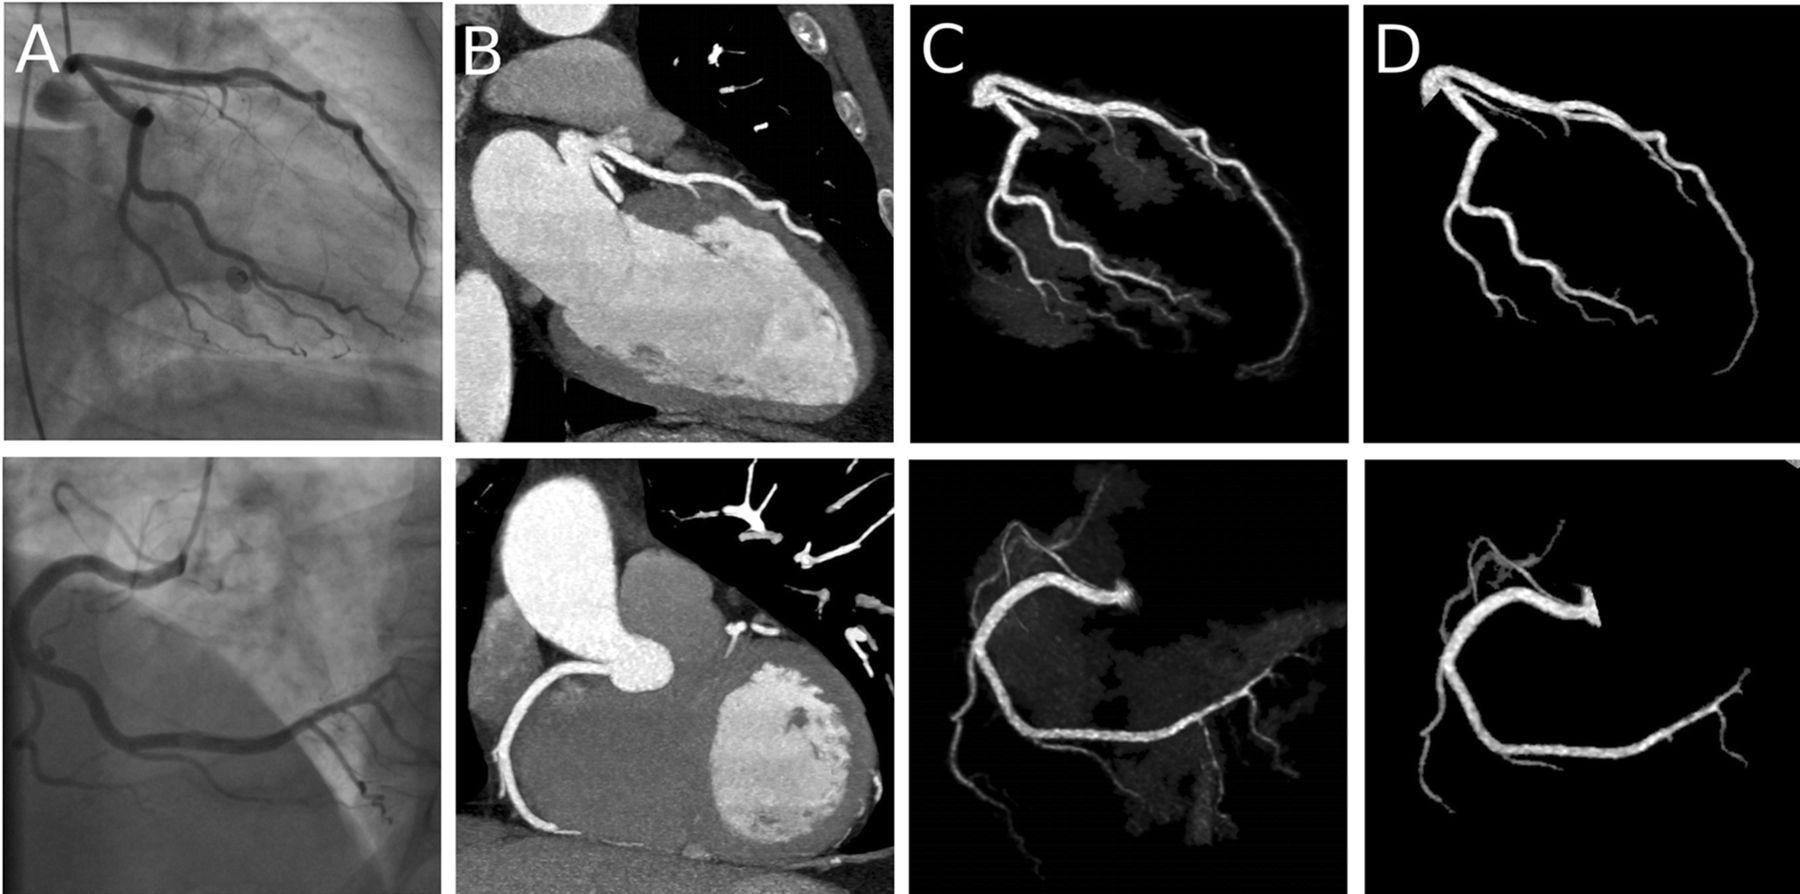
All the original transverse images were also sent to a Mac Pro computer running the open source software OsiriX (v 3.6.1) (12). The same observer also prepared another segmented series with the interactive coronary artery segmentation tool (VC-based method) (13). Segmentation results (Fig. 1) were then sent back to the Leonardo workstation for evaluation. This resulted in three types of images for each patient: original images, segmented images using the region growing method, and segmented images using the “virtual contrast injection” method. Three types of images were assigned with different anonymized patient ID, so that the reviewers could not trace the other two types of image from the image they were reading. The observer preparing these images was blinded to the CA results.
Evaluation
Three reviewers with at least 4 years of experience with cardiac CT imaging, blinded to the CA results, evaluated the CCTA data. For every examination, each of the three types of images was exclusively reviewed by one reviewer. For the original series, the reviewer was allowed to use all the visualization tools (conventional method) available on the Leonardo workstation including MPR, CPR, MIP (with or without thin-slab), and VRT. For the segmented results from RG and VC, the reviewer was instructed to only use the 3D MIP tool (Fig. 1). To minimize the influence of individual ability and experience of interpretation, the patients were randomized into three groups, and observers were asked to evaluate different groups using different types of images. The same observer reading two types of images of the same patient was avoided to eliminate the influence of prior knowledge.
Four main arteries (left main, left anterior descending, left circumflex, and right coronary artery) were classified as “evaluable” or “non-evaluable” or “missing”. An artery was classified as “non-evaluable” if motion artifacts, severe calcification, excessive image noise, and/or overlap of adjacent structures prevented assessment concerning the presence of stenosis. An artery was classified as “missing” if the branch was totally or partly missing as may occur after imperfect segmentation. Evaluable arteries were categorized as to the presence or absence of a stenosis reducing its diameter reduction by 50% or more anywhere along its entire length. An additional observer graded the severity of calcification independently with access to all three kinds of images. A “heavy calcification” vessel was defined as a vessel where the diameter of the calcification was equal to or bigger than the diameter of the vessel in the non-stenotic part.
CA was performed using a digital flat panel fluoroscopy (Axiom Artis Dfc, Siemens, Forchheim, Germany) within 3 days after CCTA. Acquisitions were obtained in standard CA projections after intracoronary administration of the contrast medium iodixanol 320 mg I/mL (Visipaque, Amersham Health B.V., Eindhoven, The Netherlands). All catheter angiograms were evaluated by a blinded independent observer with 20 years of experience in CA using a medical image workstation (IDS5, Sectra, Linköping, Sweden). Presence of a significant stenosis was also defined by a diameter reduction of at least 50%.
Statistical analysis
For each of the three presentation methods, accuracy, sensitivity, and specificity for stenosis exceeding 50% diameter reduction were calculated at the patient level, at the artery level including all arteries and at the artery level including only evaluable arteries. Positive and negative predictive values (PPV and NPV) were calculated at the patient and artery level. Confidence intervals were obtained by exact computation from the binomial distribution. The sensitivity, specificity, and accuracy of the presentation methods were compared by applying McNemar's exact test to the subpopulations defined by positive and negative findings on the reference method, and to the entire population, respectively. Inter-method agreement was expressed as Cohen's kappa statistic computed between each pair of the three CCTA presentation methods using the arteries evaluable by both methods. Free-marginal multirater kappa was used to analyze the inter-observer agreement between the three observers.
Results
The mean ± standard deviation postprocessing time for preparing the segmented result with the RG method was 3.6 ± 1.2 min per patient. A total of 3.9 ± 2.8 seed points per patient were added during the following interactive segmentation step. Using the VC method, the postprocessing time was 4.7 ± 1.1 min, and 2.7 ± 1.6 extra sets of seed were added in addition to the 3 initial seeds. The reading time was 20.7 ± 9.5 min when using the conventional method, 8.9 ± 4.9 min when using VC segmented data and 7.5 ± 3.0 min when using RG segmented data.
Accuracy for the detection of coronary artery stenoses at artery level [95% confidence limits]
The diagnostic accuracy, sensitivity and specificity of the RG-based 3D visualization method were significantly lower than using the conventional method (P = 0.0001, 0.02 and 0.002 for accuracy, sensitivity, and specificity, respectively) and the VC-based 3D visualization method (P = 0.002, 0.04, and 0.005, respectively). However, there was no significant difference in accuracy, sensitivity, or specificity between the VC-based method and the conventional method (P = 0.22, 0.18, and 0.5, respectively). The kappa value was 0.77 between the conventional method and the VC-based method (97 arteries were evaluable with both methods), 0.63 between the conventional method and the RG-based method (75 arteries), and 0.63 between the VC-based method and the RG-based method (72 arteries). Inter-observer agreement was 90% with free-marginal kappa 0.80 at artery level (72 arteries were evaluable with all three methods).
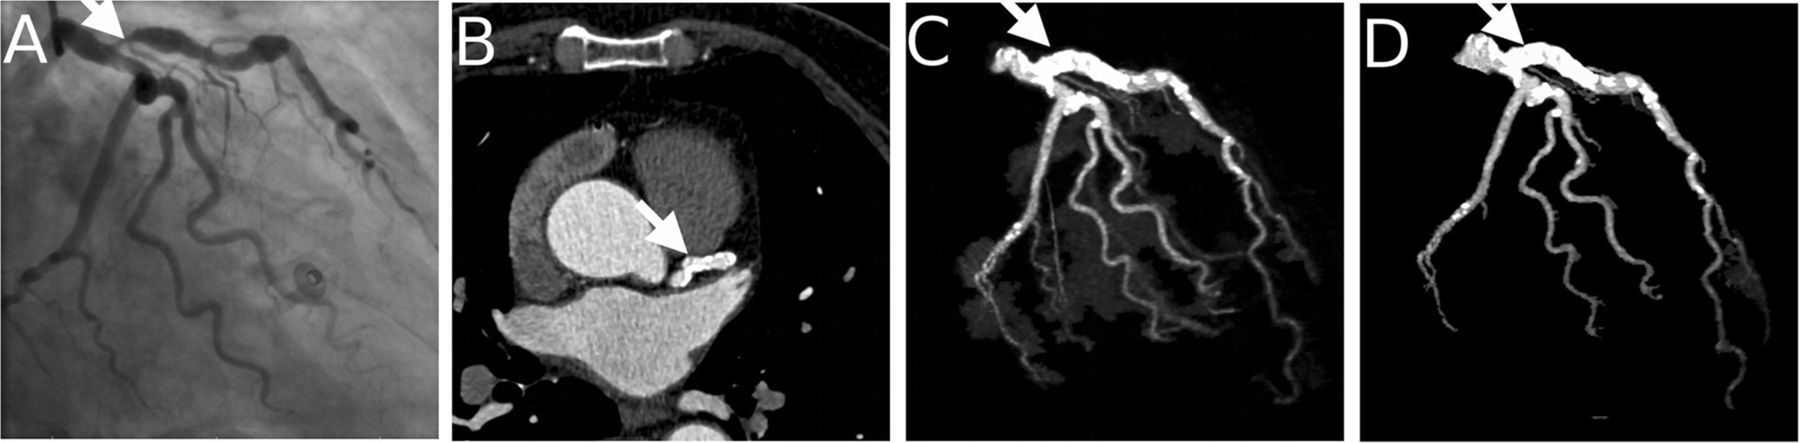
When excluding non-evaluable vessels, the accuracy, sensitivity, and specificity values of all three methods increased (Table 2). Among 120 branches, 15 branches were graded as “heavy calcification” by the independent observer. After excluding these branches from the statistics, the accuracy of all three methods increased. Results are listed in Table 3. Figs. 2–4 show a few examples of correctly and incorrectly interpreted cases.
An example of a true-positive case. The arrows point at the same stenosis in different presentation methods. (a) coronary angiography; (b) MPR view of the original data; (c) 3D MIP of VC segmented data; (d) 3D MIP of RG segmented data An example of a false-negative case caused by severe calcification. The arrows point at the same stenosis in different presentation methods. (a) Coronary angiography; (b) MPR view of the original data; (c) 3D MIP of VC segmented data; (d) 3D MIP of RG segmented data An example of a false-positive case caused by severe calcification. The arrows point at the same stenosis in different presentation methods. (a) Coronary angiography; (b) MPR view of the original data; (c) 3D MIP of VC segmented data; (d) 3D MIP of RG segmented data Accuracy for the detection of coronary artery stenoses at artery level in evaluable arteries [95% confidence limits] Accuracy for the detection of coronary artery stenoses at artery level excluding vessels with heavy calcification [95% confidence limits]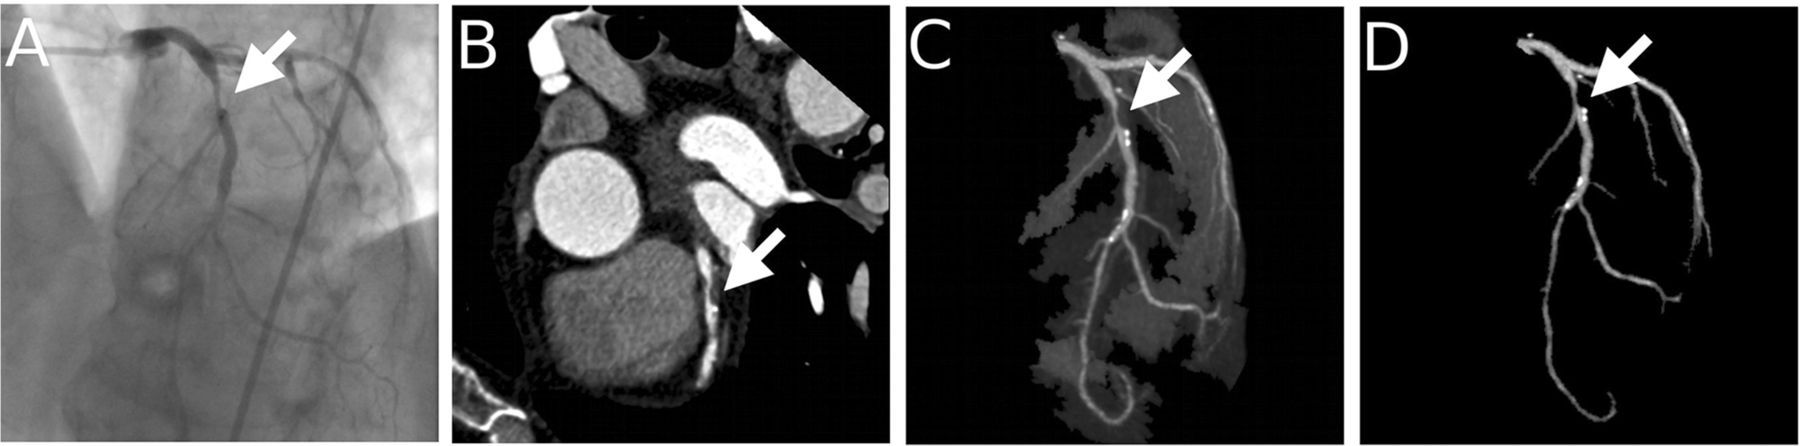

Accuracy for the detection of coronary artery stenoses at patient level [95% confidence limits]
Corrected accuracy excluding patients with no positive findings but with non-evaluable branches for the detection of coronary artery stenosis at patient level [95% confidence limits]
Accuracy for the detection of coronary artery stenoses at segment level in evaluable segments [95% confidence limits]
Discussion
MPR is recognized as the most accurate diagnostic tool for stenosis evaluation in CCTA (1, 4). However, it is also the most time-consuming method. 3D MIP or VRT is an attracting alternative in clinical practice, but as shown by Ferencik et al. (4), the diagnostic accuracy decreased when using a 3D visualization technique. Their study was quoted by SCCT Guidelines Committee as evidence against recommending 3D visualization technique for the assessment of coronary stenosis (14). However, in Ferencik's study, the 3D volumes were prepared by manually isolating the heart. It is easy to anticipate that the accuracy will be low as the ventricles conceal almost half the surface of the coronary arteries. Moreover, the VRT images were pre-rendered with a fixed window setting and limited angles, which are known factors interfering the diagnostic accuracy of 3D MIP or VRT (15). In the present study, 3D volumes were prepared with more modern software that can segment the coronary tree from all other non-vascular structures. Observers were also allowed to freely rotate the image volumes and reset the window settings.
Lower overall diagnostic accuracy was observed when using the segmented data, especially with RG based method. However, if only counting the evaluable arteries, the differences between the methods were eliminated. In practice, for a user starting with 3D viewing, the non-evaluable arteries can be viewed with MPR or CPR methods, as most software allows fast switching between 2D and 3D images, if they are not shown side by side. In view of the high NPV of 3D visualization methods, the user can choose the 3D segmented data first for an overview and use MPR only on the suspected lesions or the missing branches.
In this study, the ratio of evaluable branches was lower than previously reported numbers (94–99%) (4, 16–18), and the sensitivity and specificity were also rather low compared to the reported normal range (0.93 with 95% confidence interval (CI): 0.88, 0.97, and 0.96 with 95% CI: 0.96, 0.97) (16) even with the conventional mixed visualization method. This may be related to the fact that our patient material had a higher frequency of severe disease than the earlier studies. The corrected results after excluding severely calcified arteries (Table 3) agree better with the published data. As CCTA is recommended for intermediate risk patients, image quality is expected to be better in clinical practice. Using segmented 3D data for screening stenosis could potentially shorten reading time.
The lower accuracy values at the segment level (Table 6) compared to the artery level can be explained by segment misclassification. In several cases the observers did not agree in which segment the lesion was located, even though they were obviously referring to the same lesion.
Compared with RG, the VC method generates more evaluable branches. This is related to the fact that the VC method does not aim to define the exact border of the vessel, but rather to separate each coronary artery from other vascular structures, each with its surrounding tissue. Since the results are displayed with MIP or VRT, the exact delimitation of the lumen is left to the eye of the user, who may interactively adjust the window setting or VRT transfer function whenever needed. This approach facilitates preservation of detailed information about the coronary artery tree, e.g. the tips of minor branches, which may otherwise be lost as a result of under-segmentation (Fig. 4). In most cases, soft plaques are also included in the segmentation result (Figs. 2 and 5), which provides the physicians more confidence and may eliminate the need to switch to 2D slices. High agreement between the VC-based method and the conventional method proved the ability and accuracy of this innovative segmentation method.
In many software tools, the segmented results can also be visualized with VRT, which is helpful to illustrate the spatial relationship between structures. This can sometimes be helpful for observing calcifications in the vessel wall, which are usually more problematic with MIP images. However, MIP requires less parameter tuning to visualize small branches as discussed in (1). It is also worth noticing that the VC segmented data combined with MIP creates 3D representations of the coronary tree that are similar to the images from CA. This makes the distribution of coronary lesions more easily understandable to referring physicians and patients (e.g. Fig. 5).
An example showing that the 3D representation of CCTA helps cardiologists to understand the coronary angiography. The arrows point at the occlusion in different presentation methods. (a) Coronary angiography; (b) 5 mm thin-slab MIP of the original data; (c) 3D MIP of VC segmented data; (d) 3D MIP of RG segmented data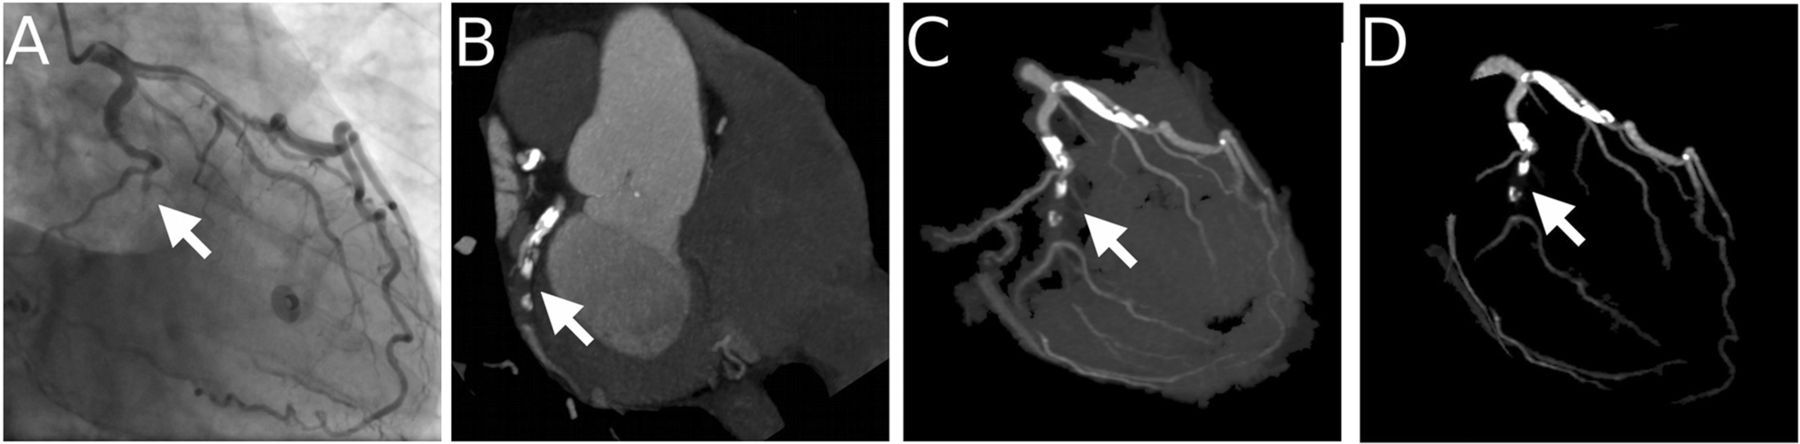
Jinzaki et al. (8) have proposed a method called angiographic view image, which is similar to the VC method. The angiographic view image removes heart chambers and great vessels and “keeps the coronary artery untouched”. High sensitivity (98%) and NPV (99%) were reported from a pilot study (17). In (19), Schnapauff et al. evaluated an “angiographic emulation” function of a commercial system (Vitrea 2, Version 3.5, Vital Images, Plymouth, MN, USA), in which “automatically detected centerline was used to create angiographic data of the left and right coronary artery tree” (judging from the image in (19), the surrounding tissue were also presented in the 3D images with a different window setting). Even with data acquired from 16-slice CT scanner, acceptable accuracy (90% [108/120]) and NPV (94% [82/88]) were achieved. These numbers and our clinical results clearly indicate that when perfect segmentation is unachievable, providing the “separation” results with uncertainty information could be a better strategy than presenting the segmentation results with potentially erroneous information.
The postprocessing time using the VC method was somewhat longer than using the RG method on the Leonardo workstation. This is mainly due to the initial steps of the VC software being less automatic than the Leonardo workstation, which requires only one click. With the interactive coronary artery segmentation software on OsiriX, the user is asked to define the heart region first and then provide three sets of seeds in the left, right coronary arteries and left ventricle. A fully automatic segmentation software based on the VC method has been proposed (6). This will hopefully shorten the processing time. Another reason for longer postprocessing time is that the VC algorithm is in general slower than the RG algorithm as more computation is needed (5). However, this can be addressed by starting the non-supervised segmentation step automatically when the data are received (6). After the initial segmentation steps, fewer additional seeds were needed in the VC method.
The current study has several limitations. First, the number of subjects was small, resulting in limited statistical power and rather wide confidence intervals. As the different viewers viewed the same case with different methods, there is still a possibility of bias caused by the reviewer's individual performance. Second, intra-observer agreement was not studied. The inter-observer agreement was evaluated, but the influence of different visualization methods could not be eliminated. Last but not least, our sample group had, in general, more severe CAD than the normal population undergoing CCTA, which can be seen as a spectrum bias (20). However, as image quality tends to be better in a more normal population, the accuracy is expected to be higher in routine cases.
In conclusion, the results of our study showed that the diagnostic accuracy is relatively low when using segmented 3D data. However, the relatively high NPV of the 3D methods suggests a potential of combining them with 2D reviewing techniques, and using 3D visualization to screen suspected lesions. The VC-based method is more promising for this screening purpose, as it can generate more evaluable arteries and has higher accuracy than the RG-based method. The efficiency and accuracy of combining the VC method with 2D visualization methods need to be investigated in future studies.
Footnotes
ACKNOWLEDGMENTS
The authors thank Professor Osman Ratib, Dr Antoine Rosset, and Joris Heuberger for developing the OsiriX software and making it open source to society. Financial support was given by the Swedish Heart–Lung Foundation.