



Abstract
Researchers have noted a nonlinear association between reading instruction dosage (i.e., hours of instruction) and reading outcomes for Grade K–3 students with reading difficulties (K–3 SWRD). In this article, we propose a nonlinear meta-analysis as a method to identify both the maximum effect size and optimal dosage of reading interventions for K–3 SWRD using 26 peer-reviewed studies including 186 effect sizes. Results suggested the effect sizes followed a concave parabolic shape, such that increasing dosage improved intervention effects until 39.92 hours of instruction (dmax = 0.77), after which the intervention effects declined. Moderator analyses found that maximum intervention effects on fluency outcomes were significantly larger (dmax = 1.34) than the overall maximum effect size. Also, when students received 1:1 instruction, the dosage response curve displayed a different functional form than the concave parabolic shape, showing the effect increased indefinitely after approximately 16.8 hours of instruction. Implications for research and practice are discussed.
The importance of early reading interventions for students with or at-risk for reading difficulties (SWRD) has been well-documented as being critical to reducing later reading disabilities (Fletcher & Miciak, 2019; D. Fuchs et al., 2012; L. S. Fuchs & Fuchs, 2007; Vaughn & Swanson, 2015). When students are proficient readers in early elementary school, they read more, gain a richer vocabulary, and further develop their reading ability. Conversely, when students struggle to read early on, they engage in less reading and have lower growth rates compared with their peers reading at grade level. This pattern, known as the Matthew Effect (Duff et al., 2015; Stanovich, 1986, 2000), leads to a widening of the reading gap between proficient and less proficient readers. Furthermore, for students who do not acquire adequate word reading skills by the end of third grade, comprehending text will become increasingly difficult as students will begin to be required to both decode more complex text and respond to increased linguistic comprehension demands (e.g., vocabulary, background knowledge, inference-making; Chall, 1996; Chall & Jacobs, 1983; Compton et al., 2008; Lipka et al., 2006; Perfetti, 1985). Thus, when students struggle to read early, they are at risk for poor academic performance throughout their school-age years (Foorman et al., 1997; Francis et al., 1996; Vaughn & Swanson, 2015).
To support students’ reading outcomes, current models of intervention delivery have utilized multi-tiered systems of support (MTSS), also referred to as Response to Intervention (RtI; D. Fuchs et al., 2012; L. S. Fuchs & Fuchs, 2007; National Center on Intensive Intervention at American Institutes for Research [NCII], 2013). Within current MTSS and RtI frameworks, all early elementary students are screened for early reading problems at the beginning and middle of the school year (D. Fuchs et al., 2012; Gersten et al., 2009; NCII, 2013; Vaughn at al., 2010). Those who are at risk for a reading difficulty receive a more intensive reading intervention often referred to as a Tier 2 or secondary intervention (e.g., D. Fuchs et al., 2012; NCII, 2013). Intensifying reading instruction is a data-based process by which decisions are made on how to best provide differing levels of support for students who have not adequately responded to the general education classroom instruction (e.g., L. S. Fuchs & Fuchs, 2007; Vaughn et al., 2010; Vaughn et al., 2012). For Grade K–3 SWRD (K–3 SWRD), Tier 2–level instruction typically includes an increase in the number of minutes of evidence-based reading curriculum instruction received per week (e.g., two to five 30-minute sessions per week) for 8 to 24 weeks and a decrease in the group size to small group or 1:1 instruction (L. S. Fuchs & Fuchs, 2007; Gersten et al., 2009; NCII, 2013; Vaughn et al., 2010; Vaughn et al., 2012). If students adequately respond to the intervention, student supports may be lessened. Supports may also remain the same or intensify if the student is making progress toward their instructional goals but has not yet achieved them or if the student is making inadequate progress toward their instructional goals, respectively. For the students who are not adequately responding to the Tier 2 reading intervention “after a reasonable amount of time” (Gersten et al., 2009, p. 4), they will receive a more intensive reading intervention. This more intensive intervention is typically referred to as a Tier 3 reading intervention and may include changes to intensify reading instruction such as smaller group size (e.g., 1:1 instruction), additional minutes of instruction, and greater alignment between student needs and instructional focus (e.g., embed self-regulation strategies into the instruction; D. Fuchs et al., 2012; Gersten et al., 2009; NCII, 2013; Roberts et al., 2019; Vaughn et al., 2010).
Despite the promise of early reading interventions, many K–3 SWRD have continued to struggle in reading (Fletcher et al., 2011; D. Fuchs & Fuchs, 2015; Lam & McMaster, 2014; Torgesen, 2000; Toste et al., 2014). Researchers have found the proportion of early elementary SWRD who inadequately respond to Tier 2 interventions to be 18% to 55% of those receiving these supports (Fletcher et al., 2011; D. Fuchs et al., 2008; Toste et al., 2014). Granted, it is difficult to determine a precise percentage of students who inadequately respond to interventions due to the range of implemented Tier 2 reading intervention characteristics (e.g., minutes of reading instruction per week, group size) and a lack of an agreed upon measurement protocol to establish adequate and inadequate response (e.g., cut score, slopes, assessment construct; Austin et al., 2017; Brown Waesche et al., 2011; Fletcher et al., 2011; Fletcher & Miciak, 2019). Therefore, it remains critical to better understand how and when to intensify reading interventions to meet the needs of students not adequately responding to reading interventions (Austin et al., 2017; Denton et al., 2011; Ehri et al., 2001; D. Fuchs & Fuchs, 2015; Hall & Burns, 2018; Mathes et al., 2005; Vaughn et al., 2010).
Intensifying Reading Interventions: How Much Reading Intervention Is Enough?
In order to optimally plan and implement reading interventions for K–3 SWRD, it is necessary for researchers to identify the reading intervention characteristics that will lead to the largest reading effect sizes (D. Fuchs & Fuchs, 2015; Hall & Burns, 2018; Mathes et al., 2005; Vaughn et al., 2003; Wanzek et al., 2016). A necessary component required to intensify instruction within MTSS and RtI is the increase in the total number of reading instruction minutes (or hours) received by a SWRD (D. Fuchs & Fuchs, 2015; Vaughn et al., 2010). As conceptualized by Warren et al. (2007), increasing intervention intensity through increased minutes of instruction can be described by the number of minutes per session (i.e., dose), the number of sessions per day or week (i.e., dose frequency), or the duration of the study in weeks, months, or years (duration). To identify the cumulative dosage intervention intensity (i.e., total number of hours of intervention), the product of dose, dose frequency, and duration are calculated (Warren et al., 2007). Moving forward in this nonlinear meta-analysis, the cumulative dosage intervention intensity will be referenced simply as dosage.
Previous meta-analyses on reading interventions have investigated dosage as a moderator, although findings have not offered much specific guidance on the optimal dosage for K–3 SWRD. More specifically, recent meta-analytic moderator analyses used to identify effect size differences on intervention characteristics (e.g., dosage, group size) have not produced statistically significant outcomes on intervention dosage (e.g., Wanzek et al., 2016; Wanzek et al., 2018). The continued difficulty in identifying dosage as a statistically significant moderator may potentially be due to dosage influencing intervention effect sizes in a nonlinear way, when linear meta-analytic methods have been utilized in this area (e.g., Hall & Burns, 2018; Wanzek et al., 2016).
Based on current meta-analyses’ descriptive data of dosage as a moderator, findings have suggested the possibility of a nonlinear relation between intervention dosage and effect sizes, such that increasing dosage appears to be associated with larger effects sizes up to a point, after which increased dosage appears to be associated with diminishing returns (Elbaum et al., 2000; Hall & Burns, 2018; Wanzek et al., 2016; Wanzek et al., 2018; Wanzek & Vaughn, 2007). If a nonlinear relationship was present (i.e., greater dosage does not necessarily lead to larger effect sizes), it would provide a possible explanation as to why recent linear meta-analytic moderator analyses have not produced statistically significant outcomes on dosage. In Wanzek et al. (2016), a meta-analysis on reading interventions for K–3 SWRD with 72 studies, the data did not suggest a linear relation between the effect sizes of interventions and dosage. More specifically, on standardized measures of foundational reading skills, Wanzek et al. (2016) found the mean effect size for students who received intensive reading instruction with a dosage of 1 to 10, 11 to 20, 21 to 30, 31 to 40 hours, and greater than 40 hours was 0.60, 0.36, 0.50, 0.75, and 0.20, respectively. Descriptively, the largest effect sizes were found on studies with dosages ranging from 31 to 40 hours rather than more than 40. Somewhat counterintuitively, these nonlinear patterns suggest more dosage does always not produce significantly larger effect sizes in comparison to a business-as-usual (BAU) group than interventions with less dosage, yet such nonlinear dosage response findings have been replicated in multiple reading intervention reviews (e.g., Austin et al., 2017; Elbaum et al., 2000; Hall & Burns, 2018; Vaughn et al., 2010).
Currently, there is a lack of consensus on a theoretical explanation as to why nonlinear dosage response may occur (e.g., Denton et al., 2011; D. Fuchs & Fuchs, 2015; Vaughn et al., 2010). In some instances, an explanation for the nonlinear dosage response appears intuitive: for concrete skills (e.g., letter-naming, phonemic awareness, phonics) that can be learned more quickly than more abstract skills (e.g., comprehension), effect sizes may increase up to a point where mastery is obtained, after which increased dosage could be associated with diminishing returns, relative to a BAU. In cases such as this, the BAU receiving less intensive instruction would learn these concrete skills at a slower rate, but once the reading intervention group had obtained mastery, the BAU group would continue to improve, and therefore the between group effect size would reduce with further observation of the groups. Conversely, more complex skills (e.g., comprehension) may require a greater amount of dosage to actualize gains, and effect sizes would continue to grow over time, relative to a BAU, vis-à-vis the Matthew Effect (Al Otaiba et al., 2005; Chall, 1996; Compton et al., 2008; Duff et al., 2015; Stanovich, 1986, 2000). In this latter case, for more abstract skills, one would not expect a nonlinear dosage response to occur (Duff et al., 2015; Stanovich, 1986, 2000).
Another theory to explain nonlinear dosage response is that scheduling more dosage in a shorter amount of time (i.e., concentrated practice) might lead to differential impacts than dosage delivered over a longer amount of time (i.e., distributed practice; Denton et al., 2011; Warren et al., 2007). Across the cognitive sciences, researchers have shown that distributed practice leads to larger effect sizes than concentrated practice (e.g., Warren et al., 2007). Again, research on this hypothesis in reading research is limited and inconclusive, with current research results suggesting that neither concentrated or distributed practice is more beneficial on measures of phonemic awareness, phonics, fluency, or reading comprehension (Denton et al., 2011; Seabrook et al., 2005; Ukrainetz et al., 2009; Vaughn et al., 2010). Vaughn et al. (2010) and Denton et al. (2011) also proposed improving active student learning to impact dosage response. Through targeting active student learning, through systematic and explicit instruction, reducing group size, and/or increasing the number of teacher–student interactions delivered in a lesson, it may be possible to keep students engaged in lessons (and learning) over a greater amount of time or dosage (Warren et al., 2007). Finally, a hypothesis with existing strong empirical support is that student characteristics may impact dosage response. Syntheses and intervention research have pointed to lower pretest scores on phonological processing, rapid naming ability, verbal ability, attention, and problem behaviors, to be associated with reduced gain in response to reading interventions (Al Otaiba & Fuchs, 2002; Fletcher et al., 2011; Nelson et al., 2003; Schatschneider et al., 2004). Therefore, studies with differing inclusion criteria or students with unique academic, cognitive, or behavior characteristics, such as co-occurring attention-deficit/hyperactivity disorder or being an English learner, may lead to different patterns of dosage response.
Even though a consensus on a theoretical explanation for the nonlinearity of reading intervention dosage response has yet to materialize, nonlinear dosage response outcomes directly relate to research and practice. For instance, when researchers are planning to study a Tier 2 reading intervention, they need to make important decisions about how much of that intervention will be administered to students. Currently, these decisions can be difficult to make given the ambiguity in the literature in which there is a limited understanding of the optimal dosage for K–3 reading interventions (D. Fuchs & Fuchs, 2015; Hall & Burns, 2018; Vaughn et al., 2010; Wanzek et al., 2016). More pragmatically, this means it is possible that researchers are under- or overadministering interventions in their research studies, and inadvertently diminishing the effect of their intervention in relation to the comparison condition. For both researchers and practitioners, these potential diminishing returns imply not only that time and financial resources may be currently ill-spent without an understanding of optimal dosage but also that the true effect size of a given intervention may be underestimated if the dosage was too high or too low. In schools, a better understanding of optimal dosage can support timely decision making to allow for the maximum effect of the intervention to be achieved. To make an analogy: Currently researchers are accustomed to identifying an optimal sample size for their studies that maximizes statistical power while fitting within the financial resources to which they have access; in the same way, researchers may also identify an optimal dosage, a priori, for their intervention study that is able to maximize the intervention effect while also conserving scarce research time and funding.
Current Research on the Optimal Amount of Intervention Dosage
Several studies have systematically manipulated intervention dosage of early elementary students with or at-risk for reading difficulties (e.g., Al Otaiba et al., 2005; Denton et al., 2011; Vaughn et al., 2003; Wanzek & Vaughn, 2008). Three such studies randomly assigned students to predetermined intervention dosages (Al Otaiba et al., 2005; Denton et al., 2011; Wanzek & Vaughn, 2008). In Wanzek and Vaughn (2008), the authors reported on two studies. Study 1 randomly assigned students to 50 sessions at 30 minutes daily (25 total hours of intervention) or a BAU comparison group. Study 2 randomly assigned students to 50 sessions at 60 minutes daily (50 total hours of intervention) or a BAU group. The intervention procedures were identical in both studies with the exception of the number of minutes per session. Outcomes from these studies found that neither treatment group significantly outperformed the comparison group on any reading measure and both treatment groups (25 hours vs. 50 hours) had similar pretest to posttest reading effect sizes.
Denton et al. (2011) also investigated dosage in relation to reading outcomes, but with three treatment conditions and no BAU. Across these three conditions, each session was 30 minutes, with each condition having the sessions per week and the intervention duration systematically manipulated in the following ways: (a) four sessions per week for 16 weeks, (b) four sessions per week for 8 weeks, and (c) two sessions per week for 16 weeks. Across the three conditions, the average intervention dosage (in hours) was 29.5 (SD = 2.0), 14 (SD = 1.5), and 15 (SD = 1.3), respectively. Denton et al. (2011) found no statistically significant differences on any reading outcome, suggesting again that outcomes did not vary based on the number of sessions per week, the duration, or the overall dosage.
In a year-long study, Al Otaiba et al. (2005) randomized students to one of three groups: (a) two weekly 30-minute reading intervention sessions, (b) four weekly 30-minute reading intervention sessions, or (c) a comparison group. In Al Otaiba et al. (2005), the four sessions per week group significantly outperformed the comparison group on phonics and comprehension outcomes, and the 2 days per week group outperformed the comparison group on a phonological awareness outcome. Such findings from Al Otaiba et al. (2005) suggest that higher dosage did lead to larger effect sizes. Overall, within reading intervention research, there remains a need to better understand how to optimize the intensity of reading intervention dosage, a particularly complex issue given that the relation between intervention dosage and effect appears to have a nonlinear form (Austin et al., 2017; D. Fuchs & Fuchs, 2015; Hall & Burns, 2018; Vaughn et al., 2003; Vaughn et al., 2010).
Overview of the Current Nonlinear Meta-Analysis
In this meta-analysis, we aimed to better understand how to optimize the characteristics associated with administering and intensifying reading interventions for K–3 SWRD. We did this by first reviewing the extant empirical literature that clearly documents that delivering small group explicit and systematic reading instruction targeting decoding and linguistic comprehension can benefit many students who struggle in reading. However, the reviewed literature also makes plain the fact that many students continue to not make adequate reading growth during (or following) a targeted reading intervention. Therefore, in order to better understand how to produce the largest possible effects in relation to a comparison condition, we identified the nonlinear association between effect sizes and dosage as a salient and unaddressed research question relating to the optimization of reading intervention research.
In the following sections, we discuss the development of the methodological aspects of this meta-analysis. In doing so, we will conceptually highlight similarities between optimal reading intervention design and questions faced in pharmacology related to patients’ response to differing dosages of drugs. We then will describe one statistical approach from the pharmacological literature and note how it can be adapted into the area of education research to create what we term a nonlinear meta-analysis: a method for estimating the optimal dosage of reading interventions just as pharmacologists seek to estimate optimal dosages of drugs. Finally, we present potential empirically supported moderators. The methods section presents the nonlinear meta-analysis model conducted on the reading intervention effect sizes.
Modeling the Nonlinear Dynamics of Reading Intervention Effects
Here, we build on previously published education research that showed the benefits of considering nonlinearity in educational outcomes (e.g., Dumas & McNeish, 2018) to conduct a meta-analysis focused on the nonlinear dynamics of reading interventions. The overarching goal was to determine the optimal dosage of reading interventions such that maximal differences were observed between students in the intervention group and students in the comparison group representing BAU. This type of nonlinear meta-analysis followed established optimization methods such as those from pharmacology in which the benefit of pharmaceutical drugs, in comparison to a placebo, diminishes after the optimal dosage is surpassed (Holford & Sheiner, 1981; Ogungbenro et al., 2009; Sheiner & Steimer, 2000). Thus, we adapted an existing statistical approach from pharmacology to education research to facilitate the optimal design of reading intervention studies: interventions that are carried out long enough for the maximal intervention effect in comparison to the BAU group to emerge, while not being so long that resources were unnecessarily depleted, or student engagement is compromised.
Although pharmacological dosage response curves can take many functional forms, the literature review conducted in this meta-analysis suggested that the effect of intervention dosage follows a concave parabolic shape (i.e., an upside-down U) such that increasing dosage improved intervention effects to a point, after which the intervention became less effective as dosage increased. In order to model this concave parabolic shape to the nonlinear dynamics of K–3 reading interventions, we adapted a model first posited by Cudeck and du Toit (2002). The original application of this model was in understanding the effect of creatine serum in kidney transplant patients (from data originally published by Smith & Cook, 1980), but here we adapted the model for use in education research. The functional form of this model is depicted in Figure 1; unlike quadratic models that include polynomial terms for the predictor, the model is parameterized to explicitly estimate the maximum effect across dosages (i.e., the peak of the curve) and the dosage value (i.e., number of hours) at which that maximum occurs.

Conceptual diagram of model from Cudeck and du Toit (2002). A concave parabolic function is defined by an intercept (the function’s value at Dosage = 0), the maximum effect of the function, and the dosage at which the maximum value occurs. Such a parameterization facilitates optimization by directly estimating maximization points. These points are visualized on this figure by the horizontal and vertical dotted lines, which represent the maximum effect size achieved by the interventions, and the time-dosage at which that maximum occurred.
Though existence of nonlinear effects has been frequently mentioned as a limitation or discussion point of statistical analyses, modeling potentially nonlinear effects of individual predictors has been often neglected because models incorporating such effects do not easily fit into the purview of the general linear model. As evidence from an education-related field, Belzak and Bauer (2019) recently noted that only 3% of psychology studies between 1998 and 2018 considered nonlinear effects of individual predictors despite the noted cautions against omitting nonlinear effects from statistical models (Hayes & Preacher, 2010; Lubinski & Humphreys, 1990; MacCallum & Mar, 1995). In education research specifically, Bauer and Cai (2009) discussed how ignoring nonlinearity of individual predictors increases the prevalence of spurious interaction effects, and those interaction effects may mask misspecification induced by errant linearity assumptions. This scant exploration of nonlinearity of individual predictor effects extends to the meta-analytic context, as we could not locate any currently published instances of nonlinear models in educational meta-analyses at the time of this writing, despite their utility in identifying maximum (or minimum) effects of study characteristics.
Potential Moderators of Optimal Dosage
Previous early elementary-aged reading intervention meta-analyses have typically included salient moderators associated with instructional components, outcomes, and characteristics associated with intervention intensity (i.e., group size, dosage). In terms of instructional components, there is wide agreement that foundational skills (i.e., phonological awareness, phonics, word recognition), reading fluency, comprehension, and language (e.g., vocabulary) are critical in helping students learn to read (e.g., Foorman et al., 2016; Gersten et al., 2009; Gough & Tunmer, 1986; National Early Literacy Panel, 2008; National Reading Panel, 2000). Therefore, this nonlinear meta-analysis included the following instructional components as moderators: foundational skills, fluency, meaning-based (i.e., comprehension, vocabulary), and multicomponent (i.e., foundational skill and meaning-based). The following outcomes, aligned to the instructional components, were also included as moderators: alphabetics (e.g., letter naming), phonemic awareness, phonics (e.g., letter-sound correspondence, word reading), fluency (i.e., timed text reading), oral comprehension (i.e., vocabulary or listening comprehension measures), and reading comprehension (i.e., sentence or passage comprehension). With similar moderators, a recent K–3 SWRD reading intervention meta-analysis (Wanzek et al., 2016) found a mean foundational skill effect of 0.47 and 0.50 from foundational skill and multicomponent interventions, respectively. Wanzek et al. (2016) also found a mean language/comprehension effect of 0.59 and 0.67 from foundational skills and multicomponent interventions, respectively. Given the important role of these instructional and outcomes constructs, we aimed to build on previous meta-analytic research by conducting a nonlinear meta-analysis moderator analysis to identify the dosage at which the maximum effect size for a given instruction or outcome moderator occurred.
Additionally, norm-referenced measures tend to be associated with higher quality studies and produce lower effect sizes than researcher-developed measures (Scammacca et al., 2015; Wanzek et al., 2013; 2016). To identify and account for any potential differences that may occur between the dosage response curves with all measures and only the norm-referenced measures, measure type (i.e., norm-referenced, researcher-developed) was also used as a moderator. Theoretically, if norm-referenced measures are less tailored to any specific intervention and therefore constitute a more rigorous way to observe learning gains, it may be hypothesized that a greater dosage of instruction may be required to observe an intervention effect when norm-referenced measures are used.
Finally, reducing group size is a commonly used strategy to intensify reading instruction (NCII, 2013; Vaughn et al., 2010; Wanzek et al., 2016). Similar to findings on dosage, decreasing the group size of already small groups has a potential nonlinear association with effect sizes. In Wanzek et al. (2016), authors identified a potential descriptive nonlinear association between group size and effect size when they reported a mean effect of 0.50 for 1:1 instruction, 0.61 for groups of 2 to 3 students, and 0.44 for groups of 4 to 5 students. These findings suggest that, as group size decreases, effect sizes do not improve. Conversely, when Vaughn et al. (2010) reviewed the characteristics of Tier 2 interventions and investigated the association between reading outcomes, dosage, and group size, they noted increased dosage was not shown to be associated with increased reading outcomes, although given a reading intervention with a relatively large amount of dosage, 1:1 instruction may be related to increased student outcomes. Findings across these and other studies (e.g., Ehri et al., 2001; D. Fuchs & Fuchs, 2015; Wanzek et al., 2018) reflect a lack of convergence on the optimal group size for reading interventions for K–3 SWRD, warranting a further investigation into whether group size may impact the results of the overall dosage response curve in terms of when the maximum effect occurs or the magnitude of that maximum effect. Overall, we included each of the described moderators to identify the dosage at which the maximal effect will occur, given the important role they play in both designing and understanding reading interventions for SWRD.
Purpose, Aims, and Research Questions
There is an ongoing need to identify and understand the intervention characteristics associated with the largest reading effect sizes (D. Fuchs & Fuchs, 2015; Hall & Burns, 2018; Mathes et al., 2005; Vaughn et al., 2003; Wanzek et al., 2016). Currently, meta-analyses have not identified reading intervention dosage as a statistically significant moderator in the K–3 SWRD context. Since meta-analytic descriptive findings have demonstrated that dosage takes a nonlinear form (e.g., after a certain amount of time, more dosage is not related to larger effect sizes; Elbaum et al., 2000; Hall & Burns, 2018; Scammacca et al., 2015; Wanzek et al., 2016; Wanzek et al., 2018; Wanzek & Vaughn, 2007), we conducted a nonlinear meta-analysis to investigate the nonlinear reported effect sizes through modeling the maximum effect and optimal dosage and meet the following aims: (a) complete a systematic review of recent research of reading interventions for K–3 SWRD, (b) generate a coded effect size data set on study and student characteristics, (c) model the nonlinear dynamics of reading intervention effects in order to understand the inter-group patterns over time, and (d) include several moderator analyses to determine how the optimal dosage of reading interventions is affected by study, intervention, and outcome characteristics. Finally, through these aims we sought to answer the following research questions, (a) what is the optimal dosage and maximum predicted effect size from reading interventions for K–3 SWRD? and (b) when investigating outcome type, intervention components, group size, or norm-referenced moderators, to what extent did the optimal dosage and maximum predicted effect size vary from the overall optimal dosage and maximum predicted effect size presented in the first research question?
Method
Literature Search
Systematic Search Procedures Overview
The search procedures were formulated to follow the guidelines presented in the Preferred Reporting Items for Systematic Reviews and Meta-Analyses (Liberati et al., 2009), a set of guidelines widely followed in educational and medical research (e.g., Harrison et al., 2019; Maggin et al., 2017; Mustian et al., 2017). This set of guidelines is fully congruent with systematic search processes recently published in Review of Educational Research (Alexander, 2020). Two members of the research team independently completed all search and coding procedures to ensure reproducibility. Discrepancies were resolved through team member discussion (see Coding Procedures for coding information). The following steps were completed in the literature search: (a) an electronic database search, (b) an ancestral review of the reference sections of relevant published meta-analyses already known to the research team and cited in this study’s literature review, and (c) a hand search of relevant journals to uncover published pieces the electronic search and ancestral review may have missed. In order to identify recent research, we included nearly 15 years of published research between January 1, 2006, and September 30, 2020. The window of this search began in 2006, as 2006 is recognized as the beginning of an increase in reading intervention research with larger sample sizes and standardized measures due to the Institute of Education Sciences (IES) prioritizing the funding of randomized controlled trials (RCTs) based on the Education Sciences Reform Act (2002) and the Individuals With Disabilities Education Improvement Act (2004; Scammacca et al., 2016). Figure 2 provides an overview of the process of article identification, screening, eligibility, and inclusion from these three steps.

Screening and eligibility flowchart.
Inclusion Criteria
We organized our inclusion criteria based on the following characteristics of the published articles identified in our search: (a) study, (b) student, and (c) intervention. In each section below, we specifically detail the inclusion criteria utilized in our literature search. As an overview, the included sample of recent reading intervention studies met What Works Clearinghouse quality standards (IES, 2020) and were composed of targeted K–3 SWRD interventions, whose sample was not solely composed of English learners (EL), and who received instruction delivered in English, in the United States, by a human instructor.
We aimed to focus on this more homogenous sample of included studies to both align with the empirical evidence supporting the current work (i.e., nonlinear dosage-response) and to limit the additional error in the model that may result through the inclusion of studies that varied too widely in their characteristics. Therefore, when such study characteristic variation was not accounted for in this nonlinear meta-analysis’s empirical rationale or through a sufficiently sampled moderator, the given study was not included in this nonlinear meta-analysis. For example, as is detailed below, we excluded a computer-based instruction moderator (one treatment condition from Torgesen et al., 2010) in our search but included a norm-referenced measurement moderator (31 treatments) in our search. In the following sections, we provide a more detailed rationale and definition for each inclusion and exclusion criterion, and later in the Discussion section, we present the possibilities our current inclusion (and exclusion) criteria provide for future research.
Study characteristics
Given the open theoretical questions reviewed in the front-end of this article related to diminishing intervention effect sizes relative to control groups (e.g., Wanzek et al., 2016; Wanzek et al., 2018), studies were only included in this meta-analysis if they featured a research design that was experimental or quasi-experimental with a comparison group that included exposure to a weaker instructional condition (e.g., BAU). Therefore, studies that utilized a design featuring two treatment conditions and no comparison condition (e.g., Vadasy et al., 2015) were excluded. We also excluded adaptive interventions (e.g., Gilbert et al., 2013) and RtI-based treatments (e.g., Al Otaiba et al., 2014) where individual student dosage varied within a treatment group, because our planned nonlinear meta-analysis required the analytic assumption that all students included within a given effect size calculation received the same dosage (measured in hours of instruction, see analysis plan for details). Furthermore, previous meta-analyses have found that higher quality studies tend to produce lower effect sizes (Scammacca et al., 2015). To guard against potential biases in effect sizes due to variation in overall study quality, all included studies needed to meet the What Works Clearinghouse (WWC) Group Design Standards with or without Reservations (IES, 2020) and needed to be published in a peer-reviewed journal. Consequently, dissertations and studies not meeting the WWC (IES, 2020) standards were excluded. A further description of the WWC study rating criteria is presented in the coding procedures section.
Student characteristics
The student-centered inclusion criteria utilized here reflected our major focus on K–3 SWRD, previously reviewed in this article. Therefore, all participants in the included studies needed to be in grades K–3 and needed to be identified as with or at-risk for a reading disability (e.g., researcher-delivered reading assessment screener). Students receiving a Tier 2 or 3 reading intervention were also included if they were not making adequate progress in their Tier 1 reading intervention or in any way demonstrated reading difficulties (e.g., low reading assessment scores). Studies that included students not meeting the inclusion criteria were included only if the outcomes were disaggregated to allow for the calculation of an effect size specifically for the grades K–3 SWRD (Wanzek et al., 2016; Wanzek et al., 2018). Also, studies that selected students for reasons not related to reading performance (e.g., low socioeconomic status; Apel et al., 2013) were not included, because these students did not meet the previously outlined criteria to receive a Tier 2 or 3 reading intervention (e.g., D. Fuchs et al., 2012; NCII, 2013).
Finally, studies that delivered a reading intervention to only SWRD ELs (as part of the inclusion criteria used by the authors of those studies) were also excluded for three reasons. First, the reading profile characteristics of ELs, compared with non-ELs, diverge in that oral comprehension (i.e., vocabulary knowledge, listening comprehension) has been shown to explain a larger proportion of the variance in reading outcomes of elementary ELs than non-ELs, both with and without reading difficulties (Cho et al., 2019; Grant et al., 2011; Proctor et al., 2005). Second, based on the identified oral language instructional needs of ELs, it stands to reason that instruction, response to instruction, and therefore dosage response would be different across ELs and non-ELs. Finally, researchers have noted unreliable methods for determining risk for reading disabilities among ELs, with some researchers noting an overestimation of the prevalence of reading difficulties among ELs (Sullivan, 2011), and others noting that early elementary ELs are underestimated for special education relative to their non-EL peers (O’Connor et al., 2013; Samson & Lesaux, 2009).
Intervention characteristics
Studies needed to implement an intervention that targeted reading skills and included at least one reading outcome with a calculable effect size. To be included, a reading skill and reading outcome definition needed to align to the National Reading Panel (2000) reading constructs of alphabetics (i.e., phonemic awareness, phonics, word reading), fluency, and comprehension (e.g., text comprehension, vocabulary). Due to the analysis plan, effect sizes could not be calculated without a pretest score; therefore, posttest scores without a pretest scores were excluded from the analysis (ES = 41). In the introduction, we presented an empirical rationale to support our nonlinear dosage response meta-analysis; therefore, as previously stated, we chose to narrow the context of our search to align with such empirical intervention work. In this way, studies needed to be aligned to research suggesting the presence of a nonlinear dosage response (e.g., Denton et al., 2011; Vaughn et al., 2010; Wanzek et al., 2016; Wanzek & Vaughn, 2008) and deliver instruction in English, in the United States, during normal school hours, and in a school setting. Although some empirical work with reading instruction outside of the school setting does exist in the peer-reviewed literature (e.g., Zvoch & Stevens, 2013), this meta-analysis is focused on school-based intervention work, as interventions delivered outside the normal school setting tend to have dissimilar counterfactuals (i.e., nonacademic setting), lower attendance rates, and higher attrition rates than studies delivered during normal school hours (Durlak et al., 2010; Lauer et al., 2006; Roberts et al., 2018). In order to further align with the empirical research on dosage response, this nonlinear meta-analysis included reading interventions for K–3 SWRD only when delivered by a human instructor, and therefore instances where the instruction or intervention was administered to students via a computer without a human instructor (e.g., paraprofessional, special education teacher) were also excluded (k = 1; i.e., Torgesen et al., 2010).
In order to support our planned nonlinear meta-analysis of dosage response, the included studies also needed to present either (a) the average treatment dosage in hours (or minutes) or (b) the number of hours (or minutes) of each instructional session along with the number of sessions in order to calculate the total number of hours of instructional time (coding of dosage is further described in the coding procedures section). Since the purpose of this meta-analysis was to model the nonlinear relation between treatment’s cumulative dosage intervention intensity (i.e., dosage; Warren et al., 2007) and effect size on a temporally fine-grained scale (i.e., hours and minutes), we excluded studies that only reported a median or range of treatment dosages without mapping that range onto each reported effect size (e.g., 40- to 60-minute sessions). We also excluded studies that used the term daily (e.g., daily for 12 weeks) to report dose frequency. We excluded studies lacking sufficient detail on the amount of treatment delivered in a given intervention, because that reporting style precluded an adequately precise calculation of a cumulative dosage intervention intensity (i.e., dosage; Warren et al., 2007) and a specific treatment dosage for each specific reported effect size.
Electronic Database Search
The electronic database search utilized a three-step process. First, we searched the electronic databases of ERIC and psycINFO with the following search terms: (read* OR “phon*” OR vocab* OR fluen* OR decod* OR comprehen* OR lit*) AND (“elementary” OR “primary education” OR kinder* OR “grade 1” OR “grade 2” OR “grade 3”) AND (instruct* OR interven* OR program) AND (“reading difficult*” OR disabil* OR struggl* OR risk OR dyslex*). Next, articles were screened at the abstract level. Articles that could not be excluded based on the abstract proceeded to a full-text review to be assessed (independently, by two members of the research team) for eligibility. From the electronic database search, we identified 4,954 articles with 4,823 excluded at the abstract level, resulting in a full text review article pool of 131 articles. During the full text review, 106 articles were excluded due to the following reasons: participants not with or at-risk of reading difficulty, findings not disaggregated for SWRD (k = 19), an ineligible design (e.g., adaptive intervention, no comparison condition; k = 26), not meeting WWC Group Design Standards (k = 3), instruction not delivered in English or the instruction was delivered outside the United States (k = 9), intervention dosage not adequately reported (k = 32), an ineligible instruction type (e.g., not reading, computer-based without a human instructor; k = 9), students included outside of Grades K–3 with findings not disaggregated for Grades K–3 (k = 3), an ineligible setting (e.g., summer school; k = 2), or not having a calculable effect size (k = 3). Following the full text review, 25 studies met the inclusion criteria.
Ancestral Review of Prior Relevant Syntheses and Hand Search of Journals
Following the electronic database search, we reviewed the reference sections of similar meta-analyses (i.e., Hall & Burns, 2018; Wanzek et al., 2016; Wanzek et al., 2018). This step did not identify any new articles meeting the inclusion criteria. The final step was the hand search of relevant journals commonly publishing reading intervention research with SWRD. We undertook the hand search on the following list of journals, which is the same as the list of journals that were hand-searched by Wanzek et al. (2016): Exceptional Children, Elementary School Journal, Journal of Educational Psychology, Journal of Learning Disabilities, Journal of Special Education, Learning Disabilities Research and Practice, Reading and Writing, Reading Research Quarterly, Remedial and Special Education, Scientific Studies of Reading, and School Psychology Review. The journal hand search resulted in one new article meeting the inclusion criteria (i.e., Simmons et al., 2011). Across all three steps, we identified 26 studies with 39 treatment condition for inclusion in this nonlinear meta-analysis, a total pool that is slightly more than the 25 articles identified by Wanzek et al.’s (2018) K–3 SWRD reading intervention meta-analysis. The pool of studies that met all inclusion criteria in the current meta-analysis is understandably small, given the high resource intensiveness of the intervention studies included and the requirement to exclude studies not adequately reporting dosage (k = 32).
Coding Procedures
Code sheets were organized to extrapolate relevant information from studies based on study and student characteristics that may meaningfully influence the optimal dosage in reading interventions. The following dimensions of each study were coded by the coding team: (a) study characteristics (e.g., experimental design, number of treatment condition), (b) student characteristics (e.g., grade), (c) intervention characteristics (e.g., phonics, group size, dosage), measure characteristics (e.g., construct, norm-referenced), (d) counterfactual condition characteristics, (e) study outcomes (i.e., sample size, means, standard deviations), and (f) study quality. The coding team for this meta-analysis included the first author and one paid graduate research assistant trained in reading intervention research. Based on previous reading meta-analysis experiences (e.g., Scammacca et al., 2016; Roberts et al., 2020), the first author was well-suited to lead the article coding process and train the doctoral-level graduate research assistant who also has experience in systematic reviews and working with children with reading difficulties. Prior to independent coding, the graduate research assistant separately coded randomly selected articles included in this meta-analysis, until meeting a minimum of 90% exact agreement with the first author on each dimension (e.g., intervention characteristics, study outcomes). The graduate assistant was able to achieve this level of exact agreement with the first author on the second coding attempt. Next, all articles were independently double-coded by the first author and the graduate assistant. This coding process, including the recoding of the two articles used in the coding reliability process, resulted in an intercoder agreement of 97.34%. Given this high level of intercoder reliability, coding discrepancies were rare, but when they did arise, discrepancies were resolved between coders through discussion.
As a point of clarification on the treatment dosage coding procedures, we coded dosage based on the average treatment minutes or hours per student. It is important to note that the nonlinear meta-analysis used here assumes that, within each calculated effect size, each student received the same number of treatment hours, which is the same assumption as previous work within the education research literature using more traditional methodologies (e.g., Wanzek et al., 2016). However, when studies did report standard deviations around the average number of treatment hours (10 reported SDs) within a specific effect size calculation, those SDs were reasonably small ranging from 3.08 with a mean dosage of 21.50 hours (Vadasy et al., 2007), to a SD of 7.98 with a mean dosage of 42.20 hours (Vadasy et al., 2006b; Study 1). Supplemental Table S1 (available in the online version of this article) presents all available study dosage means and standard deviations. These standard deviations suggest that, within effect sizes, students did not vary much from the average dosage. When an average treatment dosage was not available, we calculated the product of dose, dose frequency, and duration to identify the total dosage (i.e., cumulative dosage intervention intensity; Warren et al., 2007).
Counterfactual Quality Coding Procedures
We developed a counterfactual comparison condition coding scheme, modified from Scammacca et al. (2016), to code counterfactual condition quality. Counterfactual conditions, including BAUs and treatment controls, were coded as high, moderate, or low quality. A high-quality counterfactual rating was given when all students in the comparison condition (e.g., BAU), received a research-based, commercially available reading curriculum or an instructional program that was described as explicit instruction in research-based reading skills (National Reading Panel, 2000; e.g., phonemic awareness, phonics). A moderate quality rating was given when some counterfactual condition students received a research-based, commercially available reading curriculum or explicit instruction in research-based reading skills. A low-quality study rating was given if no counterfactual condition students received such a curriculum. If the counterfactual condition was not described, a not defined rating was given.
Study Quality Coding Procedures
To establish study quality, we used the WWC study quality ratings to evaluate individual-level RCTs and QEDs (IES, 2020). Studies earned the highest rating of Meets WWC Group Design Standards without Reservations if students were randomized to condition without differential attrition. Two scenarios exist for studies to have earned the second highest rating of Meets WWC Group Design Standards with Reservations. The first scenario is that students were randomized to condition, differential attrition occurred, and baseline equivalence was present. The second scenario is that students were not randomized to condition, and baseline equivalence was present. Finally, studies received a rating of Does not Meet WWC Group Design Standards if either students were randomized to condition, differential attrition occurred, and there was an absence of baseline equivalence, or students were not randomized to condition and there was an absence of baseline equivalence. See the WWC Standards Handbook Version 4.1 (IES, 2020) for additional details on establishing study quality ratings.
Analytic Strategy
As previously described, the general purpose of this meta-analytic investigation was to determine the optimal dosage for reading interventions for K–3 SWRD. To accomplish this, the nonlinear meta-analysis model focused on optimal dosage of an intervention and was formulated as a nonlinear mixed effect model such that
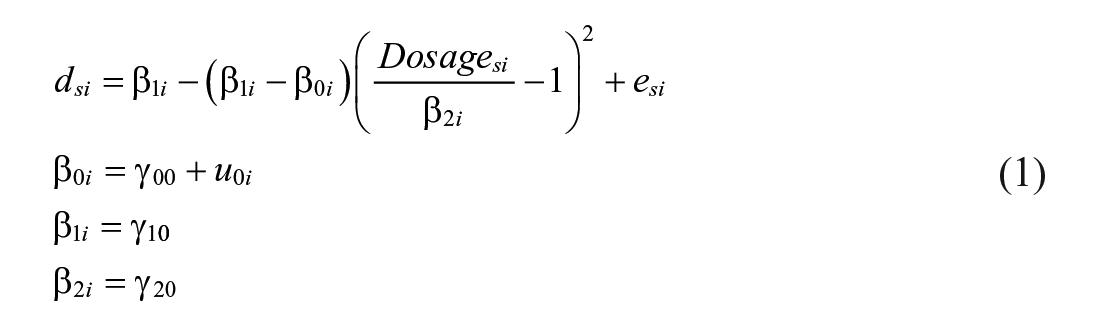
where
To account for the fact that effect sizes are nested within interventions, the intercept (
The outcome being nonlinearly modeled in Equation 1 is a standardized effect size representing the difference between intervention and control groups. The studies we reviewed in this meta-analysis all featured pre- and postintervention measurements for both a treatment group (or multiple treatment groups) and a control group. Therefore, the desired effect size for this meta-analysis would compare the change in the intervention group to the change in the control group. Standardizing the pre- to postintervention growth in the intervention group alone would overestimate the effect size because the control group may also learn in response to their BAU instruction. Therefore, we use the

where
Other effect sizes with similar goals exist and simulations studies have noted that the
Results
Descriptive Statistics of Included Studies
Online Supplemental Table S1 presents study characteristics for the 26 studies, 39 treatment conditions, and 2,912 included students at posttest across all studies and conditions. Across all the treatments, dosage in hours ranged from 5.33 to 76.50 hours (M = 31.14, SD = 21.35). Eighteen treatments delivered instruction in a 1:1 setting, and 20 treatments delivered instruction in a small group (2–8 students) setting. One study delivered instruction in a whole class setting. The grade level of treatments included eight Kindergarten-only, 16 first grade-only, four second grade-only, one third grade-only, and 10 multiple grade. Two treatments delivered a single or multiple standardized commercially available reading interventions, as designed, 13 delivered a researcher-modified standardized commercially available reading intervention, and 24 delivered a researcher-designed (i.e., not commercially available) reading intervention. Three, four, 12, and 20 of the treatment conditions were compared with counterfactual conditions with quality ratings as high, moderate, low, and not defined, respectively. Finally, there were a total of 186 effect sizes, 2 which is sufficient to estimate a nonlinear model with a single random effect (e.g., McNeish, 2016). Of these effect sizes, 144 were estimated from norm-referenced measures. Effect sizes were disaggregated into five categories: (a) alphabetic principles (i.e., letter naming; 5 effect sizes), (b) foundational skills (i.e., phonemic awareness, phonics [e.g., letter-sound correspondence, word reading]; 103 effect sizes), (c) fluency (i.e., timed passage reading; 27 effect sizes), (d) reading comprehension (i.e., sentence and passage comprehension; 33 effect sizes), and (e) oral language (i.e., vocabulary [e.g., picture vocabulary, word definitions], listening comprehension; 8 effect sizes). An additional 10 outcomes had multiple reading outcome constructs (e.g., fluency and reading comprehension).
Intervention Type
The interventions were classified into four categories. Foundational skills interventions, which included phonological awareness and/or phonics instructional components but did not include a vocabulary or comprehension component (k = 14; 17 treatments; Coyne et al., 2013; D. Fuchs et al., 2019; Kerins et al., 2010; R. D. Morris et al., 2012; Pullen & Lane, 2014; Simmons et al., 2007; Simmons et al., 2011; Vadasy et al., 2006a, 2006b [Study 1; Study 2]; Vadasy et al., 2007; Vadasy & Sanders, 2008, 2010, 2011). Fluency interventions featured instruction in fluency only (k = 3; 5 treatments; Swanson & O’Connor, 2009; Young, Durham, et al., 2018; Young, Pearce, et al., 2018). Meaning-based interventions focused on text or passage comprehension and/or vocabulary instructional components, but not foundational skills components (k = 3; 3 treatments; Fien et al., 2011; Gillam et al., 2014; Good et al., 2015). Finally, multicomponent interventions utilized a combination of foundational skills and meaning-based components (k = 9; 14 treatments; Case et al., 2010; Denton et al., 2013; Denton et al., 2014; D. Fuchs et al., 2019; Lane et al., 2009; R. D. Morris et al., 2012; Simmons et al., 2007; Solari et al., 2018; Vadasy & Sanders, 2009). Online Supplemental Table S1 provides additional study characteristics for each included study and treatment.
Nonlinear Dosage Response Analysis
With the descriptive patterns among the included studies described, we now turn to the nonlinear dosage response analysis. The maximal effect size of the K–3 reading interventions with SWRD estimated by the model was dmax = 0.77, and this maximal effect was estimated to occur at 39.92 hours of instruction. It is important to note that this 0.77 effect size is the model-predicted maximal effect size (analogous to a predicted y value in a linear regression), indicating what the dosage response model estimated to be the maximal expected effect size given the parabolic and concave pattern in the data.
Figure 3 includes the nonlinear function estimated by the model both without and with superimposed data points (the upper and lower panels of Figure 3, respectively). As can be observed, the function that describes the predicted effects of these interventions increases steadily from the shortest included intervention (Fien et al., 2011; dosage equaled 5.33 hours) until the maximal 39.92-hour time-point, when the curve turns downward and the predicted intervention effect decreases for the rest of the window-of-observation of this meta-analysis (Denton et al., 2013, was the study with the longest dosage, at 76.50 hours). The parameters of this overall model, which was fit to all 186 effect sizes, were then used as a baseline point-of-comparison for the following moderation analyses: A procedure that is analogous to comparing with the grand mean, where the grand or overall optimal dosage of reading interventions for K–3 SWRD is 39.92 hours. The weighted unconditional intraclass correlation was .145 (between-study variance = .123, within-study variance = .724), suggesting that moderators may be worth examining to explain the source of these differences. These moderators are considered in the next section.

Optimal dosage curves for the included reading interventions. The upper panel depicts the effect size curve as estimated by the fitted model, with the scale zoomed-in to best accommodate the curve itself. The bottom panel depicts the same curve but with the data (i.e., effect sizes) superimposed, and the scale zoomed-out to illustrate the variability in those effect sizes. The size of the data points in the lower panel also varies to illustrate the sample size that was included in each effect size calculation (bigger data points represent larger samples). Both the upper and lower panels illustrate that the maximal effect of k–3 reading interventions with SWRD is estimated to be d = 0.77 and that effect is estimated to occur at 39.92 hours of instruction.
Moderating the Optimal Intervention Dosage
In order to ascertain how various components of the reading interventions included in this meta-analysis moderated the optimal dosage or the maximum predicted effect size, we fit models with different characteristics as covariates (one characteristic per model), and the values from these moderation models were statistically compared with values from the overall model using custom linear hypothesis testing (i.e., the ESTIMATE statement in SAS). Some moderators explained a large proportion of the between-study variance such that the unexplained variance was close to 0, so the random intercept was dropped from the model in such cases. In this analysis, we ran separate nonlinear models for the subset of effect sizes that were relevant to each moderator in order to ascertain the way that moderator may influence the optimal dosage. Because the moderators used here very rarely intersected with one another (e.g., studies using one intervention component very rarely or never had other intervention components), it was not statistically possible to estimate the interaction effects among the moderators. However, in order to begin to understand the cumulative effect of the salient intervention types, a moderator for multiple component interventions was modeled.
Here, we first present moderation analyses based on outcome measures (i.e., foundational skill, fluency) and the presence of norm-referenced measures. Then we present moderation analyses based on the four intervention components (i.e., foundational skill, fluency, meaning-based, multicomponent). Since we aimed to identify how the inclusion of specific components (e.g., foundational skill) affected the optimal dosage and maximum predicted effect size, we allowed the effect sizes of studies with more than one instructional component to be included in multiple intervention component moderator categories (e.g., Vadasy et al., 2007; i.e., foundation skills and fluency). This led to a subset of effect sizes from 12 studies (18 treatments) being assigned to more than one intervention type moderator category. Next, we present a moderation analysis of intervention treatments by the group size of the instruction (i.e., 1:1 instruction, small group instruction). It should be noted that some theoretically salient moderators that were coded for in this meta-analysis did not have sufficient sample size to allow for the nonlinear dosage response analysis to be run on that subset of interventions (e.g., whole class instruction). Instances where sample size limited the moderators, we were able to test are indicated below in the sections in which they arose.
Reading Outcome
Here, we present nonlinear dosage response results moderated by the reading outcomes measured in the included studies. First, dosage response analysis related to foundational skill outcomes (which included phonological awareness and phonics outcomes) are presented, followed by fluency outcomes. Alphabetic principle (i.e., letter naming; 9 effect sizes) and oral comprehension outcomes (i.e., vocabulary or listening comprehension measures; 9 effect sizes) did not have a sufficient sample size to conduct a moderation analysis related to those specific reading outcomes. Relatedly, reading comprehension outcomes did not vary by dosage and the dosage response curve was essentially a horizontal line, which does not have an associated maximum. Therefore, the dosage response curve for reading comprehension outcomes is not presented or discussed here. Nonlinear dosage response curves for the included reading outcome moderators (i.e., foundational outcomes, fluency outcomes, and norm-referenced outcome measures) are depicted in Figure 4.
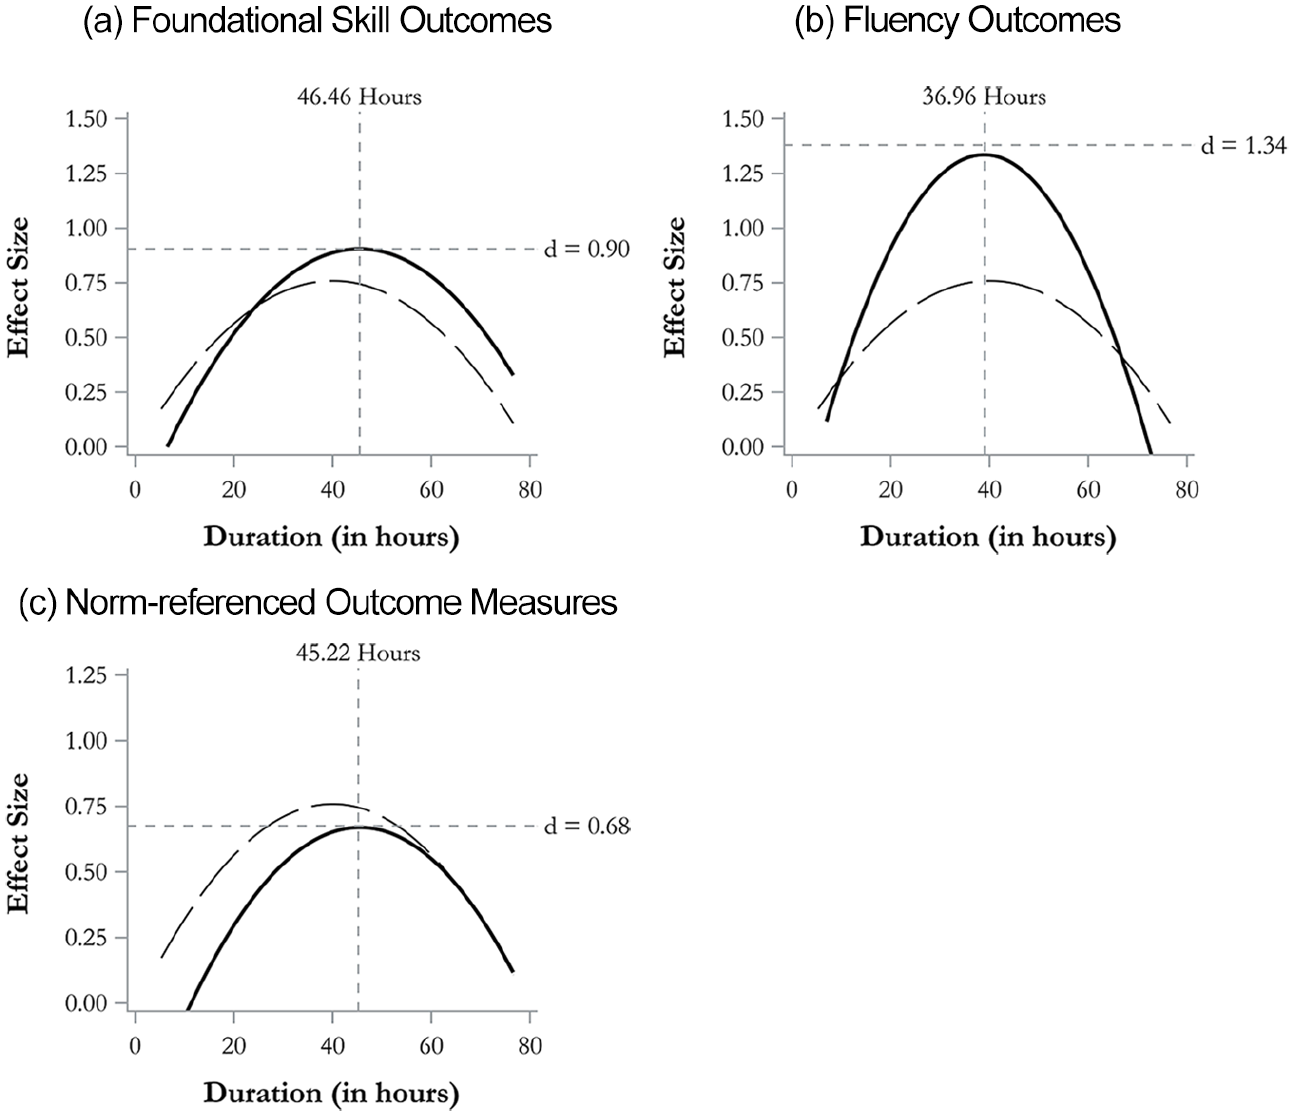
Nonlinear dosage response curves for the two reading outcome moderators included in this meta-analysis. The dashed line in each of the four panels above is the same and depicts the overall model also presented in Figure 3 (with a maximal effect of d = 0.77 and optimal dosage of 39.92 hours). The solid lines above are unique to each panel and depict the nonlinear dosage response curve for the specific subset of interventions featuring the appropriate reading outcome. Maximal estimated effects are depicted by the horizontal dotted lines, and the optimal dosage is depicted by the vertical dashed line.
Foundational skill outcomes
The nonlinear dosage response curve for those interventions that featured a foundational skill outcome measure (34 treatments with 107 effect sizes) are depicted in Panel A of Figure 4. For this subset of interventions, the maximal effect was larger than the overall maximal effect (dmax = 0.90) but not significantly so, t(37) = 1.09, p = .28. The optimal dosage on a foundational skill reading outcome measure was 46.46 hours, which was not significantly different than the overall optimal dosage, t(37) = 1.53, p = .14.
Fluency outcomes
The nonlinear dosage response curve for those effect sizes that featured a fluency skill measure (15 treatments with 32 effect sizes) is depicted in Panel B of Figure 4. As is visualized in that curve, the optimal dosage for fluency outcomes (36.96 hours) was not significantly different than the overall model, t(37) = −0.98, p = .34. However, the maximal intervention effect for fluency outcomes (dmax = 1.34) was significantly higher than the overall model, t(37) = 2.04, p = .04.
Norm-referenced outcome measures
Panel C of Figure 4 depicts the dosage response curve for interventions that included norm-referenced outcome measures (31 treatments and 144 effect sizes). For intervention effect sizes featuring a norm-referenced measure, neither the maximal effect (dmax = 0.68) nor the optimal dosage (45.22 hours) was significantly different than the overall curve: maximal effect t(37) = −0.79, p = .44; optimal dosage t(37) = 1.48, p = .15. Dosage response parameters from non-norm-referenced outcomes were not compared with the overall curve, because no intervention that utilized non-norm-referenced measures reported a dosage greater than 36.15 hours.
Intervention Component
Nonlinear dosage response analysis compared the optimal intervention dosage (measured in hours) and the maximum predicted effect for interventions that include the following components: foundational skill (which included phonological awareness or phonics instruction), fluency, meaning-based (which included vocabulary or comprehension instruction), and multicomponent (which featured a foundational skill component and a meaning-based component). Nonlinear curves related to the intervention type moderation analysis are depicted in Figure 5 and inferential tests comparing their parameters with the overall dosage response are described below. For greater detail on the intervention components present in each study and study treatment condition, see online Supplemental Table S1.
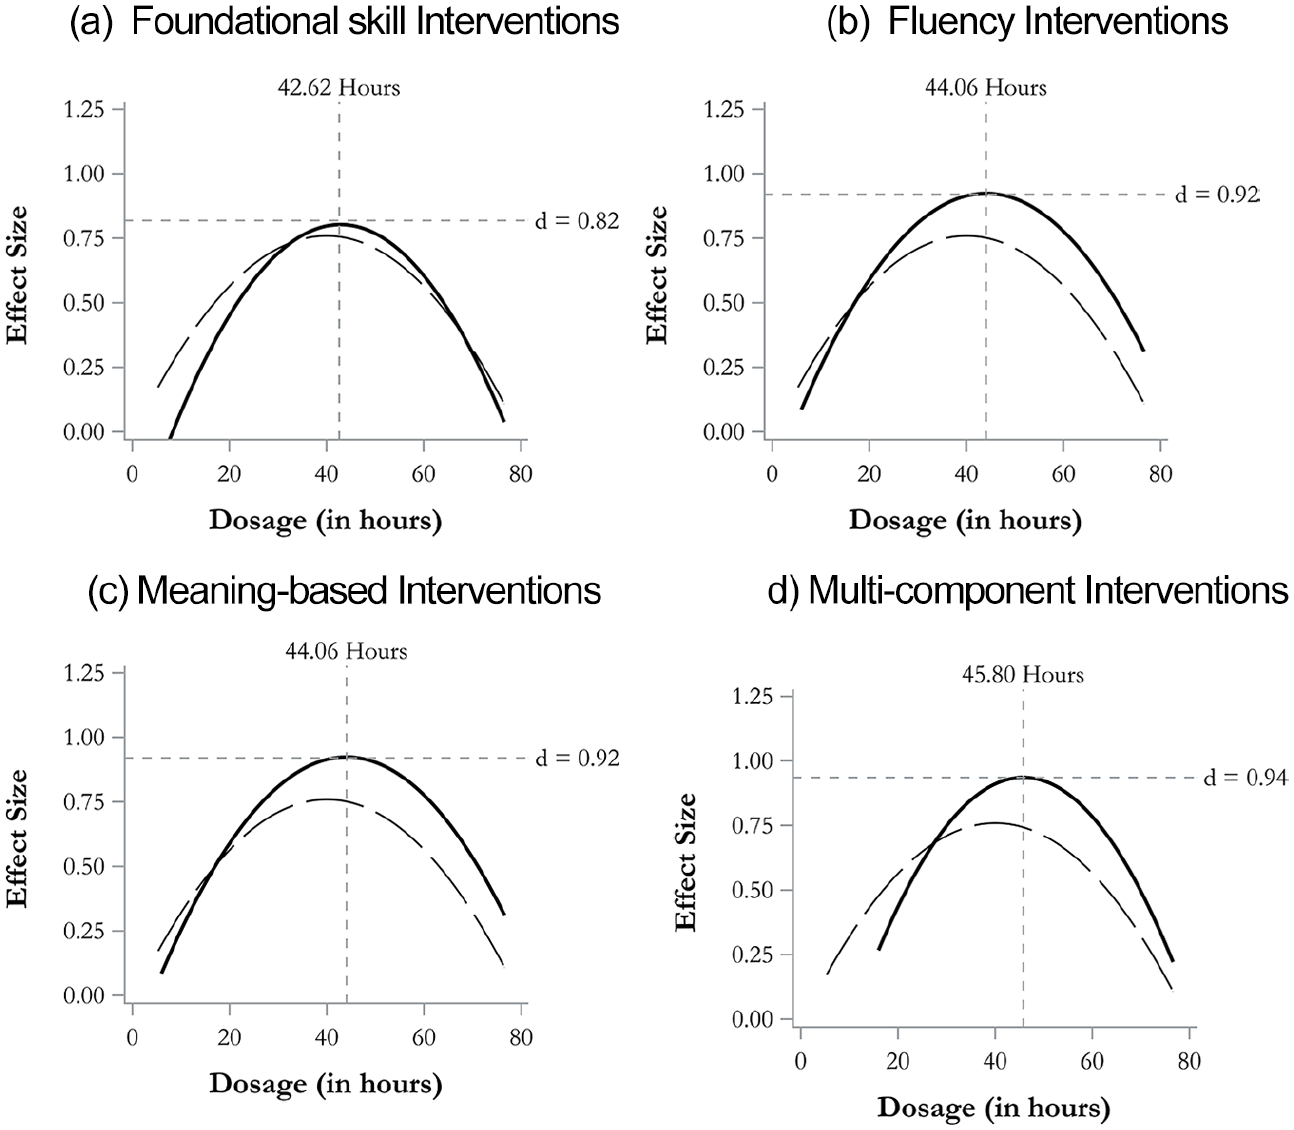
Nonlinear dosage response curves for the four moderating intervention types included in this analysis. The dashed line in each of the four panels above is the same and depicts the overall model also presented in Figure 3 (with a maximal effect of d = 0.77 and optimal dosage of 39.92 hours). The solid lines above are unique to each panel and depict the nonlinear dosage response curve for the specific subset of interventions featuring the appropriate intervention component. Maximal estimated effects for each of these four intervention components are depicted by the horizontal dotted lines, and the optimal dosage is depicted by the vertical dashed line.
Foundational skill interventions
Panel A of Figure 5 depicts the nonlinear dosage response curve for the interventions with a foundational skill component included in this meta-analysis. Thirty-one treatments had a foundational skill component, with 161 reported effect sizes. As can be seen in Figure 5, the maximal effect in this subset of the interventions is somewhat larger than the overall (dmax = 0.82) and the optimal dosage is also somewhat more than the overall (42.62 hours). However, neither of these parameters were statistically significantly different than the parameters from the overall model, maximal effect: t(37) = 0.46, p = .65; optimal dosage: t(37) =0.94, p = .35.
Fluency interventions
Panel B of Figure 5 depicts the nonlinear dosage response curve for interventions with a fluency component. Twenty treatments had a fluency component, with 113 reported effect sizes. Similarly to the foundational skill interventions, both of the focal parameters of the fluency interventions’ nonlinear dosage response curve were somewhat larger than the overall model, although neither were significantly different from the overall, maximal effect: dmax = 0.92; t(37) = 1.20 p = .24; Optimal dosage: 44.06 hours; t(37) = 1.20, p = .24.
Meaning-based interventions
The nonlinear dosage response curve for interventions with a meaning-based interventions component is shown in Panel C of Figure 4. Eighteen had a meaning-based component, with 91 reported effect sizes. This moderating intervention type did not significantly influence either the estimated maximal effect, dmax = 0.85; t(37) = 0.57, p = .57, nor the optimal dosage, 42.37 hours; t(37) = 0.43, p = .67.
Multicomponent interventions
The nonlinear dosage response curve for interventions with both a foundational skill and meaning-based component (i.e., multicomponent) is depicted in Panel D of Figure 5. There were 14 treatments classified as a multicomponent intervention, with 86 reported effect sizes. Among the curves in Figure 5, this dosage response curve showed the most marked difference from the overall curve in both the maximal effect and the optimal dosage, with both these focal parameters being higher than those in the overall model. The maximal estimated effect for the multicomponent interventions was dmax = 0.94, but this value was not significantly different than the overall maximal effect, t(37) = 1.07, p = .29. The optimal dosage for multicomponent interventions (i.e., 45.80 hours of instruction) was also descriptively later than in the overall model, but this pattern was not statistically significant, t(37) = 1.78, p = .08.
Instructional Group Size
As a final moderator analysis, we modeled the nonlinear dosage response of K–3 reading interventions for SWRD that featured either small group instruction or 1:1 instruction. One included study (i.e., Gillam et al., 2014) utilized whole class instruction, but that sample size was not sufficient for a separate analysis of whole class interventions. The nonlinear dosage response curves for the small group and 1:1 instructional conditions, along with the overall dosage response model, are depicted in Figure 6.

Nonlinear dosage response curves for different K–3 reading interventions with SWRD featuring different group sizes of instruction.
Small group instruction
The gray curve in Figure 6 shows the nonlinear dosage response curve for the small group interventions (21 included treatments and 117 reported effect sizes). For these small group interventions, the maximal effect was somewhat lower than the overall (dmax = 0.61), but this maximum was not statistically different than the overall, t(37) = −1.34, p = .19. In the same way, the optimal dosage for the small group interventions (40.72 hours) was later than the overall optimal dosage, but not significantly so, t(37) = 0.14, p = .89.
One-to-one instruction
The nonlinear dosage response curve for the 1:1 interventions (18 treatments with 67 reported effect sizes) is shown by the black curve in Figure 6. As can be observed, the pattern of nonlinear dosage response for the 1:1 interventions showed a substantial departure from the overall model, with an entirely different functional form emerging. While the overall model showed a parabolic and concave nonlinear dosage response pattern (see the dashed line in Figure 6), the subset of interventions that used 1:1 instruction displayed an initially convex and then sharply increasing nonlinear form, such that the 1:1 intervention effect was predicted to generally increase steeply and monotonically as the dosage of the intervention increased, at least after 16.8 hours of instruction. Such a finding appears to imply that, after approximately 16.8 hours of 1:1 reading intervention, more hours of intervention are always more effective. Of course, the nonlinear dosage response curve for 1:1 interventions for K–3 SWRD may eventually top-out and decrease just as all the other curves in this meta-analysis did, but the point at which that maximum would occur cannot currently be observed in the empirical literature. See the Discussion section for more about the implications of this finding.
Discussion
When students struggle in reading, or do not adequately respond to reading intervention, research recommends increasing the intervention dosage as one mechanism to increase intervention intensity. Yet, linear models in intervention research (e.g., Denton et al., 2011; Wanzek & Vaughn, 2008) and meta-analyses (e.g., Hall & Burns, 2018; Wanzek et al., 2016) have been unable to substantiate the claim that a larger dosage (i.e., more hours of intervention) produces significantly larger effect sizes than interventions with less dosage (i.e., fewer hours of intervention). Therefore, we modeled the nonlinear dynamics of reading interventions in order to better understand the association between reading intervention dosage and K–3 SWRD reading outcomes. The present study produced a number of salient findings for discussion: (a) the optimal dosage across all effect sizes was 39.92 hours with a dmax = 0.77, (b) this optimal dosage was generalizable across all treatment and the foundational skill (but not fluency) outcome moderators, (c) 1:1 instruction did not display a maximum, but the effect continued to increase as intervention length increased. Each of these key findings is now further discussed.
Key Findings
In this nonlinear meta-analysis, we first fit the pharmacologically inspired nonlinear meta-analytic model to all 186 effect sizes. From this model, we found a maximal effect of dmax = 0.77 at 39.92 hours of instruction (see Figure 3). This finding appears to be generally in convergence with the most current and robust linear meta-analyses on reading interventions for K–3 SWRD, where Wanzek et al. (2016) descriptively found the largest effect size of 0.75 occurred at 31 to 40 hours of treatment on foundational skill standardized measures (Wanzek et al., 2016; did not report dosage as moderator for any other outcome measures).
After identifying the optimal curve for all 186 effect sizes, we set out to examine intervention component and outcome measure moderators. We were unable to model alphabetic principle or oral comprehension (i.e., vocabulary, listening comprehension) outcome measures as moderators due to an insufficient number of effect sizes corresponding to those outcome measures. We were also unable to model reading comprehension outcomes, because the dosage response curve was essentially flat, meaning that reading comprehension outcomes did not increase or decrease relative to dosage. This flat reading comprehension outcome dosage response curve we identified is also aligned to previous reading intervention research outcomes (Denton et al., 2011; Wanzek & Vaughn, 2008). Thus, increasing the field’s understanding, both theoretically and empirically, of why reading comprehension effects appear not to change with increases or decreases in dosage appears to be an important future line of research in this area.
Findings from the outcome measure moderator analysis indicated a statistically significant difference in the maximal effect on fluency outcomes (dmax = 1.34, p < .05) in comparison to the overall model’s maximal effect of dmax = 0.77. Notably, although the maximal effect was significantly higher for fluency outcomes, the optimal dosage to achieve that effect was not significantly different from the overall model. The maximal effect for foundational skill outcomes did not differ from the overall model. Similarly, interventions with a foundational skill, fluency, and meaning-based component did not differ from the overall model in the maximum effect size or optimal dosage. The overall maximum effect of multicomponent interventions also did not differ from the overall model.
Across all moderator analyses, findings suggested that the identified optimal amount of treatment of 39.92 hours of instruction generalized to all measurement constructs and intervention components. Therefore, in all cases, the optimal amount of K–3 SWRD intervention dosage is around 40 hours. After 40 hours, unless an intervention is changed in a meaningful way, K–3 SWRD reading intervention effect sizes relative to a comparison condition would be expected to decline. Of course, as more empirical K–3 SWRD intervention studies are published, the sample size of future nonlinear meta-analyses will increase, therefore possibly increasing the chance that more significant moderators of this optimal dosage will be identified. At this point, we recommend researchers use the specific dosage-response curve associated with their planned K–3 SWRD reading intervention (e.g., a meaning-based intervention) in order to identify the specific optimal amount of dosage for their intervention, which regardless of the intervention components or outcomes is expected to be around 40 hours.
Finally, we conducted a moderator analysis on group size comparing the dosage curve of reading instruction in small group and 1:1 settings. Small group instruction was not a statistically significant moderator on either the maximum effect size or the amount of dosage at which the maximum effect occurred. Differing from small group instruction, the nonlinear dosage response curve for 1:1 instruction displayed a different functional form from the overall dosage response curve such that larger dosages continually increased effect sizes, at least for the dosages that have been studied (see Figure 6). This finding is aligned to Vaughn et al. (2010), who found that specifically in a 1:1 setting (unlike small group settings), higher dosage is associated with larger effect sizes. Another possible explanation may be that, as 1:1 interventions last longer and longer, a maximum effect and subsequent decrease may emerge but that maximum has not yet been observed in the research literature or that it occurs at a dosage that has not yet been studied. Therefore, for K–3 SWRD who after 40 hours of instruction have not adequately responded to instruction or who display significant reading deficits, 1:1 instruction can be viewed as a potentially meaningful and beneficial intensification strategy.
Limitations and Future Directions
This meta-analysis has several limitations, which also present opportunities for future research. The first limitation was the number of studies represented in this meta-analysis. Even though our sample was similar to other recent meta-analyses of K–3 SWRD reading interventions, a larger sample may have allowed us to include additional moderators in the nonlinear analysis. Our sample size was also reduced due to our stringent dosage reporting requirements (32 studies were dropped due to dosage reporting issues). To overcome insufficient dosage reporting, previous meta-analyses have used medians and ranges to calculate dosage when more precise methods of dosage were unavailable. Unfortunately, to model the nonlinear dosage response in this meta-analysis, we required greater specificity in dosage in order to be able to calculate the cumulative dosage intervention intensity (i.e., dosage; Warren et al., 2007). Therefore, we chose not to use author reported medians and ranges in calculating dosage, thus reducing the number of effect sizes included here. To better understand the relation between dosage and effect sizes, future research would be supported by intervention studies reporting dosage means and standard deviations or the factors needed to calculate the dosage without the use of ranges and medians. Of course, this issue also implies that studies that did not report pretest information for participants also were necessarily excluded from the nonlinear meta-analysis. Because our research questions in this article were focused on the maximum effect and optimal dosage of the intervention, and therefore we needed a parabolic function with a maximum to describe the effect sizes, we required information about participants’ ability coming into each included intervention in order to conduct the current work. For this reason, the possibility that nonlinear patterns may exist in posttest only intervention effect sizes (over another salient variable besides dosage) remain an interesting future direction.
Another limitation was based on our definition of dosage, which was limited to the intervention’s cumulative dosage intensity (i.e., product of minutes per session, sessions per week, and weeks [or months] of intervention [i.e., duration]; Warren et al., 2007). This definition did not allow us to control or account for other characteristics associated with dosage such the length of each individual session (in hours), the number of sessions per week, or the intervention duration in weeks or months (Warren et al., 2007). Descriptively we provide this information in online Supplemental Table S1. Unfortunately, these dosage characteristics were not able to be accounted for in this nonlinear meta-analysis. Therefore, future studies could manipulate such dosage characteristics in order to better understand the conditions under which intensified interventions are most effective and for whom (Denton et al., 2011; Wanzek & Vaughn, 2008).
Additionally, we did not include computer-based reading interventions, studies composed of entirely EL SWRD, and internationally based studies, because at this point, we lacked the empirical rationale for including such interventions. Of course, our current inclusion and exclusion criteria leave an opportunity for future research to explore the use of a nonlinear meta-analysis to identify a dosage response curve for computer-based instruction, ELs, or students at different grade levels. Also, in aiming to identify recent research within the past 15 years to guide current practices, we further restricted our sample. In this way, the current meta-analysis is highly relevant for current or recent interventions that include K–3 SWRD and may be less relevant for the research context prior to 2006. We would also suggest the use of this nonlinear meta-analytic method across a wide variety of areas within the education sciences (e.g., different domains of learning; different age ranges) as a potentially fruitful avenue for future work.
The final limitation of the current work was that we modeled the moderators such that if the intervention contained a foundational skill, fluency, or meaning-based component, it was included in that respective categorical moderator. This led to some effect sizes being included in multiple categories (e.g., foundational skill and multicomponent). By modeling the instructional component moderators as such, it allowed for a better understanding of how the inclusion of a given instructional component may or may not significantly moderate the parameters of the dosage response curve. It was beyond the scope of this meta-analysis to analyze instructional moderators where a given effect size is associated with only one instructional moderator (e.g., foundation skill-only, multicomponent), and therefore such research questions can and should be evaluated with future research.
For intervention research and practice, the results suggested that at approximately 40 hours of a reading intervention, researchers and practitioners can expect that on average, a K–3 SWRD will have reached a maximal effect in comparison to the BAU condition. After this amount of time, if the K–3 SWRD has not adequately responded to the instruction, the intervention may need to be further intensified (e.g., more individualized instruction, smaller group). More specifically, this nonlinear meta-analysis findings suggest that a 1:1 setting could provide growth beyond the maximal dosage and maximal effect size of a small group setting. That being said, individual student needs vary and specific student characteristics can potentially influence student response to interventions (Fletcher et al., 2011; D. Fuchs et al., 2008; Toste et al., 2014). Therefore, findings from this meta-analysis are not meant to state that individual student factors would not result in differing dosage response patterns. Instead, this meta-analysis identified the optimal dosage, on average, for K–3 SWRD reading interventions. To better understand the dosage response curve on an individual student level, areas of future research may include identifying student characteristics and group sizes associated with dosage response rates, possibly by collecting academic, cognitive, and behavioral measures, measuring outcomes at various dosages (e.g., 20, 40, and 60 hours) and in different group sizes (i.e., 1:1, small group). Through such a design, it would be possible to identify individual rates of dosage response based on student and intervention characteristics, as well as allow both researchers and practitioners to better understand the conditions by which a given K–3 SWRD responds to a reading intervention. In fact, some nonlinear modeling methods conceptually related to this nonlinear model applied here (Dumas & McNeish, 2017) may be successfully applied to the estimation of such student-specific parameters in future research. We also believe that this nonlinear meta-analysis may function as a productive example of what useful findings can be gleaned when patterns of effect sizes, and moderators thereof, are analyzed nonlinearly. As previously argued (e.g., Bauer & Cai, 2009), the use of linear models when the true relations among the variables is nonlinear is likely to result in potentially confounded findings. In cases where critical educationally relevant quantities can be defined as parameters of a nonlinear function, a methodology such as the one employed here may be highly beneficial to consider.
Conclusion
Our findings suggest that reading intervention effect sizes, relative to a comparison condition, increase until approximately 40 hours of small group K–3 SWRD reading instruction. After this point, effect sizes tend to decline. For students who have inadequately responded to small group reading instruction, we also identified 1:1 groupings as a possible method to increase student outcomes after the 40-hour time point is reached.
Supplemental Material
sj-docx-1-rer-10.3102_00346543211051423 – Supplemental material for Understanding the Dynamics of Dosage Response: A Nonlinear Meta-Analysis of Recent Reading Interventions
Supplemental material, sj-docx-1-rer-10.3102_00346543211051423 for Understanding the Dynamics of Dosage Response: A Nonlinear Meta-Analysis of Recent Reading Interventions by Garrett J. Roberts, Denis G. Dumas, Daniel McNeish and Brooke Coté in Review of Educational Research
Footnotes

Notes
Authors
GARRETT J. ROBERTS is an associate professor in the Department of Teaching and Learning Sciences at the University of Denver, 1999 E. Evans Avenue, Denver, CO 80210, USA; email:
DENIS G. DUMAS, is an assistant professor of research methods and statistics at The University of Denver Morgridge College of Education, 1999 East Evans Avenue, Denver, CO 80208, USA; email:
DANIEL MCNEISH is an associate professor of quantitative psychology at Arizona State University, PO Box 871104, Tempe, AZ 85287, USA; email:
BROOKE COTÉ is a doctoral student in the Department of Teaching and Learning Sciences at the University of Denver, 1999 E. Evans Avenue, Denver, CO 80210, USA; email:
References
Supplementary Material
Please find the following supplemental material available below.
For Open Access articles published under a Creative Commons License, all supplemental material carries the same license as the article it is associated with.
For non-Open Access articles published, all supplemental material carries a non-exclusive license, and permission requests for re-use of supplemental material or any part of supplemental material shall be sent directly to the copyright owner as specified in the copyright notice associated with the article.
