



Abstract
Design-based methods have recently been developed as a way to analyze randomized controlled trial (RCT) data for designs with a single treatment and control group. This article builds on this framework to develop design-based estimators for evaluations with multiple research groups. Results are provided for a wide range of designs used in education research, including clustered and blocked designs. Because analysis in the multi-armed setting involves pairwise contrasts across the research groups, the key methodological question addressed is: How do the estimators for the two-group design need to be adjusted for multi-armed trials? The critical insight is that in multi-armed trials where the goal is to identify the most effective treatments, the samples for each pairwise contrast are representative of the full set of randomized units, not just of themselves. The implication is that variance terms need to be adjusted slightly under the finite-population framework that can reduce precision, and blocks need to be weighted to reflect the full randomized sample in the block or biases can result. An empirical example using data from a multi-armed education RCT demonstrates the issues.
Keywords
Design-based methods have recently been developed as a way to analyze data from impact evaluations of interventions, programs, and policies (Freedman, 2008; Imbens & Rubin, 2015; Lin, 2013; Schochet, 2013, 2015/2016; Yang & Tsiatis, 2001). The nonparametric estimators are derived using the building blocks of experimental designs with minimal assumptions and are unbiased and normally distributed in large samples with simple variance estimators. The methods apply to randomized controlled trials (RCTs) and quasi-experimental designs (QEDs) with comparison groups for a wide range of designs used in social policy research. The methods have important advantages over traditional model-based impact estimation methods, such as hierarchical linear model (HLM) and cluster robust standard error methods, and perform well in simulations (Schochet, 2015/2016; Schochet & Kautz, 2018). Design-based estimators are acceptable for What Works Clearinghouse evidence reviews (Scher & Cole, 2017).
The literature on design-based methods has focused on RCTs with a single treatment and a single control group. This theory, however, has not been formally extended to designs with multiple research groups, apart from Dasgupta, Pillai, and Rubin (2015) who focus on design-based methods for 2 k factorial designs. This is an important gap in the literature because multi-armed RCTs can simultaneously examine the effects of multiple interventions in a single study, thereby increasing the amount that researchers and policy makers can learn from impact evaluations. In social policy research, these designs are particularly relevant for interventions that are relatively easy to implement. Multi-armed designs are also useful for rapid-cycle experiments involving multiple cycles of small changes aimed at continuous program improvement, for example, using behavioral-based interventions.
Multi-armed RCT designs have been used in education research in a variety of contexts. For instance, they have been used to test the effects of different forms of teacher-to-parent communication on student outcomes (Kraft & Rogers, 2014) and the effects of text messaging and peer mentoring on college enrollment rates among high school graduates (Castleman & Page, 2015). Multi-armed RCTs have also been used in larger studies to test the effects of competing math curricula (Agodini et al., 2009) and reading curricula (James-Burdumy et al., 2009). They have also been used internationally, for example, in Honduras, to examine the effects of various data-driven assessment tools to improve teaching practices and student outcomes (Toledo, Humpage-Liuzzi, Murray, & Glazerman, 2015).
This article provides new results on the estimation of average treatment effects (ATEs) for multi-armed designs, building on and referencing the design-based literature for the two-group design, rather than developing estimators from scratch (although we provide proofs of some key results for the two-group design in an online supplement to help clarify the theory). The approach is based on the Neyman–Rubin–Holland potential outcomes framework that underlies experiments (Holland, 1986; Neyman, 1923/1990; Rubin, 1974, 1977). The article also builds on Dasgupta et al. (2015) who focus on factorial effects for nonclustered designs only, whereas we consider a broader range of multi-armed RCT designs with blocking, clustering, and the inclusion of weights and baseline covariates to improve precision. Our focus is on RCTs, although key concepts apply also to multi-armed QEDs.
The article is in four sections. The first section discusses the considered estimators. The second section discusses how design-based ATE estimators for the two-group design need to be modified for the multi-armed design when comparing pairs of research groups to each other. The third section provides an empirical example using data from multi-armed RCT testing the effects of various supplemental reading interventions. The final section presents conclusions.
Considered ATE Estimators
An important consideration for multi-armed RCTs is the pairwise contrasts of interest to best address the study research questions. For instance, researchers may be interested in all pairwise comparisons across the research groups, pairwise comparisons with the control group, or pairwise comparisons with the best of the other treatments (Hsu, 1996; Westfall, Tobias, Rom, Wolfinger, & Hochberg, 1999). This section considers design-based ATE estimators for each pairwise contrast in isolation. For example, for a design with three treatment groups (T1, T2, and T3) and a control group (C), the methods apply to each possible pairwise contrast (e.g., T1–T2, T1–T3, T1–C, T2–C) as well as to contrasts formed by combining groups (e.g., comparing the combined T1 and T2 groups to the C group). Thus, the methods apply to the multi-armed context regardless of the full set of contrasts of interest.
We focus on settings where interest lies in comparing impact findings across the tested treatments to identify the most effective ones (i.e., where the various contrasts are interpreted in unison). Clearly, if the focus is only on a particular contrast without regard to the others (i.e., if a specific contrast is included in a meta-analysis to compare impact findings from past evaluations of similar interventions), estimators for the two-group design apply without any modifications. Because we consider multi-armed RCTs that involve multiple hypothesis testing across contrasts, the inflation of Type 1 errors for each individual test is of concern. We refer readers to Hsu (1996), Schochet (2009, 2017), and Westfall, Tobias, Rom, Wolfinger, and Hochberg (1999) for a discussion of multiple comparison adjustments for multi-armed designs.
We focus on the designs presented in Schochet (2015/2016) defined by two key features: clustering and blocking. Nonclustered designs are those where the unit of analysis aligns with the unit of randomization (such as analyzing student-level data with student-level random assignment), whereas clustered designs are those where the unit of analysis is nested within the unit of random assignment (such as analyzing student-level data with school- or teacher-level random assignment). For nonblocked designs, randomization is conducted within a single population, whereas for blocked designs, randomization is conducted separately within distinct subpopulations (such as school districts or grades). In combination, these two design features cover most RCTs in the education field.
We consider design-based estimators for both the finite-population (FP) model where impacts are assumed to pertain to the study sample only and the super-population (SP) model where impacts are assumed to generalize to an infinite population (which may be vaguely defined). We also consider estimators for models with and without baseline covariates to improve precision and models with weights to adjust for data nonresponse and to determine how to aggregate blocks and clusters to obtain pooled ATE estimators. We focus on unbiased (consistent) estimation and do not consider other types of estimators, such as those that improve mean squared error by allowing bias to improve precision.
As formalized mathematically in this article, we find that key components of the design-based theory for the two-group design apply also to multi-armed RCTs. However, two modifications are required if interest lies in comparing treatment effects across contrasts: Under the FP model, ATE estimators for each pairwise contrast pertain to the entire randomized sample, not just to the two groups being compared. Thus, variance estimators for the FP model for the two-group design need to be adjusted slightly to reflect the broader inference population. For similar reasons, for blocked designs, the weights assigned to each block to obtain pooled ATE estimators need to be scaled to reflect the size of the full randomized sample in the block. Ignoring this rescaling can lead to biased impact estimates.
In this article, we do not consider statistical power considerations for multi-armed designs, but note here that for several reasons, these designs could require larger samples to produce precise impact estimates than for the two-group design. First, for multi-armed designs, the sample is split across more research groups. Second, we might expect impacts to be smaller when contrasting variants of a treatment than when comparing a treatment to a control (status quo) condition. Finally, larger sample sizes might be required to compensate for multiple comparison adjustments when conducting hypothesis tests across the pairwise contrasts. These factors could be mitigated somewhat for rapid-cycle, multi-armed RCTs that focus on mediating or proximal outcomes (such as teacher knowledge) where we might expect intervention effects to be larger than for more distal outcomes (such as student test scores).
ATE Estimators for Nonclustered Designs
Consider the simplest multi-armed RCT design where n individuals from a single population are randomly assigned to one of K distinct research groups
We do not consider orthogonal fractional factorial designs where the interventions consist of components that could each be turned on or off to form different service packages and where the research groups include only a subset of all possible treatment combinations (see Box, Hunter, & Hunter, 2005; Wu & Hamada, 2009). Our focus is on examining pairwise contrasts between distinct research groups, whereas factorial designs are structured to estimate main and interaction effects by comparing combinations of research groups to each other. Under fractional factorial designs, main and two-way interaction effects become confounded with higher order interaction effects (and even with each other in some designs with small numbers of tested combinations), and the nature of the confounding depends on the adopted parameterization of the factorial design. This confounding complicates the assumptions required to develop design-based impact estimators, and these assumptions are likely to vary based on the structure of the factorial design. We do not address this topic here, but it is an interesting area for future research (note that Dasgupta et al., 2015, consider 2 k factorial designs only).
We assume the sample contains
Design-based estimators in the multi-armed context rely on several assumptions that we generalize using the corresponding assumptions for the two-group design: The stable unit treatment value assumption (SUTVA; Rubin, 1986) which has two parts. First, for any two random assignment vectors Independence between research group assignment status and potential outcomes, Qi
⫫ A positive probability of assignment to each research group for each individual. Finite first and second moments for potential outcomes.
FP Model
Under the FP model for the multi-armed design, the n individuals participating in the study are assumed to define the population universe, and potential outcomes are assumed to be fixed for the study. In this setting, the ATE parameter of interest for comparing interventions (research groups) K and k ′ is

Importantly, this parameter pertains to the full sample of n individuals, not just to the
To demonstrate these adjustments, consider first the data-generating process for the observed outcome yi :

This relation states we can observe
Consider the simple differences-in-means estimator for

To show that this estimator is unbiased, we use the law of iterated expectations to demonstrate key conditioning arguments that are needed for more complex derivations later (although the result can be established more directly). First, we calculate the expectation of

We know from Imbens and Rubin (2015) and Schochet (2010, 2015/2016) that the simple differences-in-means estimator for the two-group design is unbiased for the FP model (see Supplemental Material in the online version of the journal). Thus, the interior conditional expectation in Equation 4 equals

where
We can use a similar conditioning approach to calculate the variance of

Using variance results for the FP model for the two-group design (see, e.g. Schochet, 2010, 2015/2016, and Supplemental Material in the online version of the journal), we have that

where

are variances of

is the variance of individual-level treatment effects for the contrasted groups. We hereafter refer to the final term in Equation 7 as the “FP heterogeneity term.”
Similarly, because the differences-in-means estimator is unbiased for the FP model, it follows that

where

The critical difference then between the variance expression for the multi-armed RCT and the two-group RCT is that the FP heterogeneity term contains the divisor n rather than
Unbiased estimates for
The FP heterogeneity term,

Aronow, Green, and Lee (2014) discuss methods to obtain sharper bounds on the FP heterogeneity term by approximating the marginal distributions of potential outcomes. 1
The ATE estimator,
We conducted simulations to provide practical guidance on the choice of z tests or t tests for hypothesis testing. For the simulations, we generated potential outcomes for a small three-armed RCT with 40 individuals, where 12 to 28 individuals were assigned to the two groups being contrasted (see Table 1). We generated potential outcomes using the normal and lognormal distributions (to allow for some skewness) assuming zero ATEs but allowing for some treatment effect heterogeneity. We assessed Type 1 errors across the 5,000 replications and compared estimated variances using Equation 10 to the true ones (see the footnote to Table 1 for simulation details).
Simulation Results for t Tests and z Tests for Designs With Small Sample Sizes
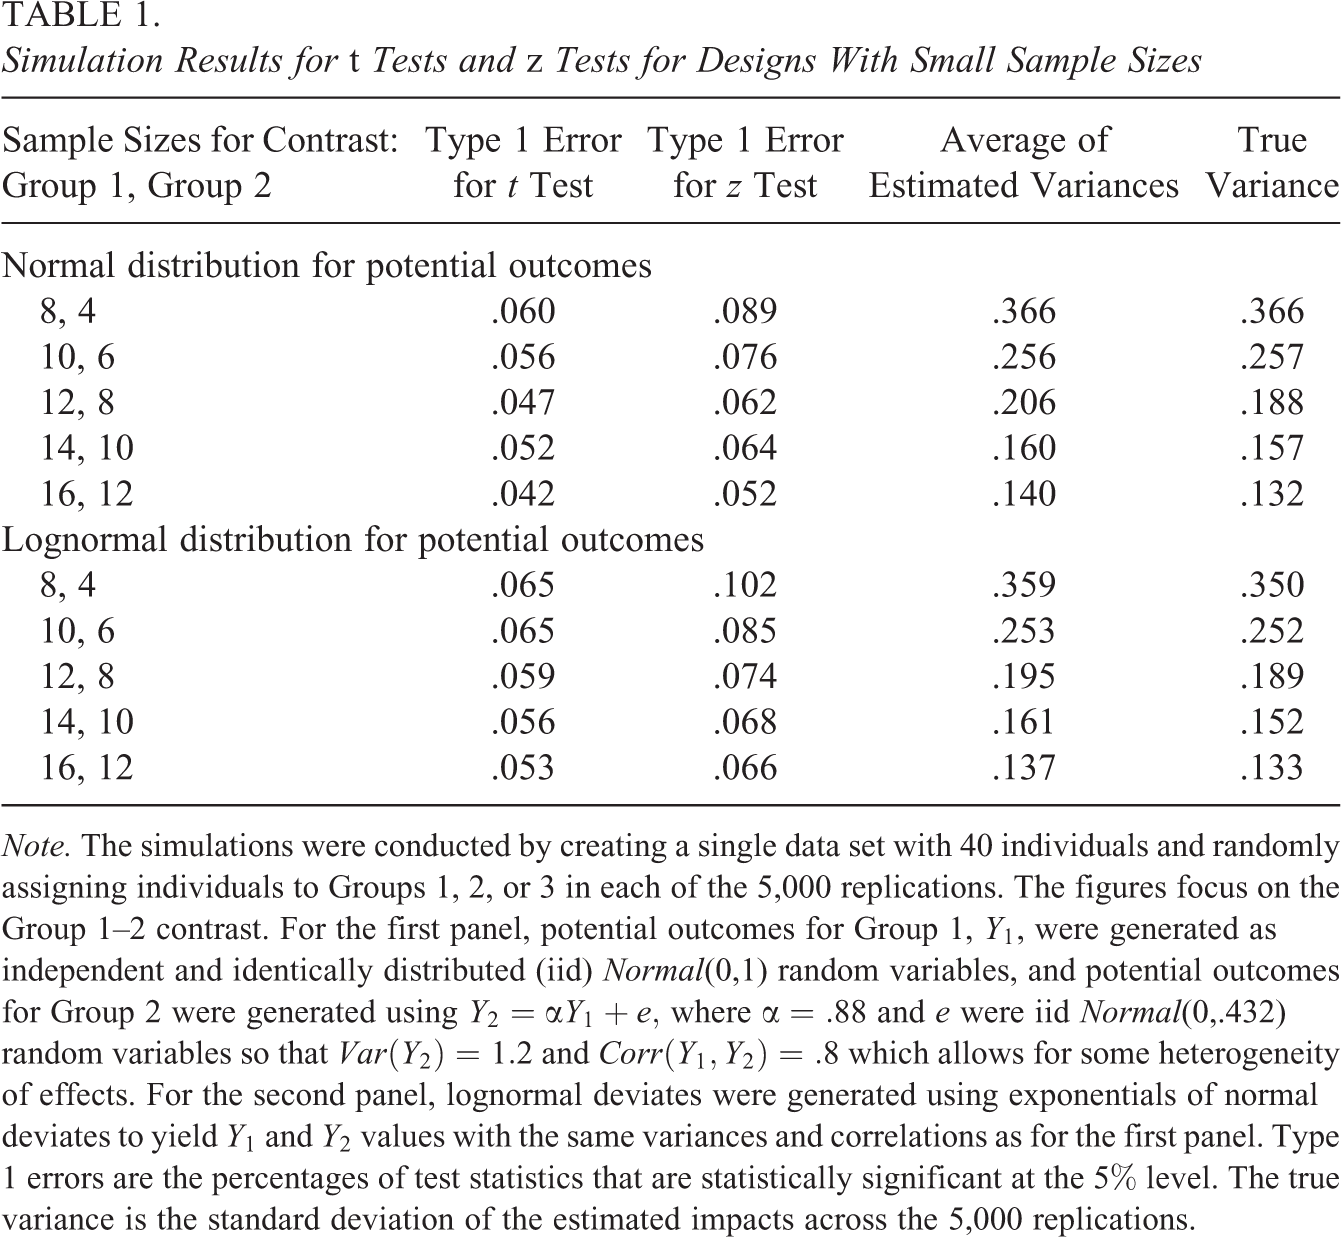
Note. The simulations were conducted by creating a single data set with 40 individuals and randomly assigning individuals to Groups 1, 2, or 3 in each of the 5,000 replications. The figures focus on the Group 1–2 contrast. For the first panel, potential outcomes for Group 1, Y
1, were generated as independent and identically distributed (iid) Normal(0,1) random variables, and potential outcomes for Group 2 were generated using
The simulation results indicate that with very small sample sizes, the t tests are preferred because they yield Type 1 errors that are closer to the 5% nominal level than the z tests that yield inflated values (Table 1). We also find that the estimated variances match actual ones, even using the skewed lognormal distribution. We find very similar results assuming different levels of treatment effect heterogeneity across the sample (not shown).
For models that include weights,

where
are weighted sample variances,
are average weights for the two groups, and the FPC term uses
SP Model
Model-based ATE estimation methods, such as ordinary least squares (OLS) and HLM, typically assume an SP framework with an infinite SP. For this framework, the parameter of interest for each pairwise contrast is the mean effect in the infinite SP,
In this SP setting, design-based ATE estimators for the multi-armed design are identical to those for the two-group design (see, e.g. Schochet, 2010, 2015/2016). The simple differences-in-means estimator for each contrast is unbiased and asymptotically normal, with the same variance estimator as in Equation 10 except that the FP heterogeneity term disappears because n is infinite. These results hold regardless of the number of research groups. Intuitively, each research group is a random sample from the infinite SP, so the mean outcomes across research groups are uncorrelated (which differs from the FP framework).
The finding that ATE estimators under the SP model are the same for the two-group and multi-armed RCT extends to blocked and clustered designs. This occurs because the SP framework for these designs assumes random sampling of study blocks, clusters, and/or individuals from infinite populations so the FP heterogeneity terms do not apply (see Pashley & Miratrix, 2017; Schochet, 2015/2016, for a discussion of different types of SP models based on the various stages of sampling that are assumed to be random or fixed). This same finding regarding the absence of the FP heterogeneity terms for the SP model also applies to models that include baseline covariates. Thus, we primarily focus on the FP model for the rest of this article.
Note that a framework in between the considered FP and SP models is a design where the study sample is randomly selected from a broader universe that is finite. In this case, the variance estimators for the FP model apply except that the FP heterogeneity term is divided by the number of individuals in the broader universe rather than the size of the study sample.
Models With Baseline Covariates
Researchers analyzing RCT data often include baseline covariates in the estimation models to increase precision and to adjust for random imbalances between the research groups. For multi-armed designs, separate regression models can be estimated for each pairwise contrast. In this case, the statistical properties of the multiple regression estimator for the two-group design apply to each pairwise model. The only difference is that the FP heterogeneity term for the variance estimator contains the divisor n rather than
To demonstrate these results more formally for the FP model, we can, following Freedman (2008), first rearrange Equation 2 assuming a two-group design using the estimation sample assigned to conditions K and k ′ only to obtain the following regression model:

where
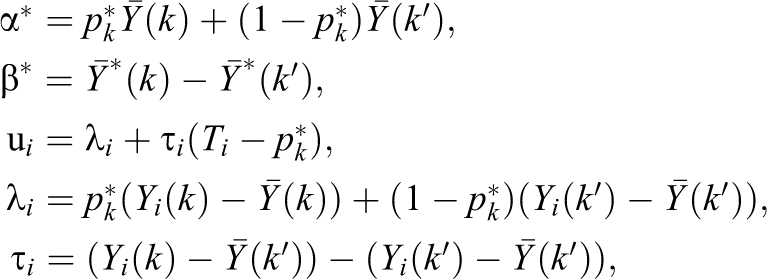
where

Nonetheless, as shown in Freedman (2008) and Schochet (2010) for the two-group design, OLS estimation of Equation 12 yields a differences-in-means estimator,
Consider next an OLS regression of yi
on
Freedman (2008), Schochet (2010, 2015/2016), and Lin (2013) show that the standard variance estimator from the OLS regression needs to be adjusted to fully align with the structure underlying the two-group RCT design. As shown in Theorem 1 of Supplemental Material in the online version of the journal, the multiple regression estimator for the two-group design,

where

We can now apply the same conditioning arguments as above to Equation 13 to move from the two-group design to the multi-armed design to obtain the following conservative variance estimator for a pairwise contrast based on estimated model residuals:

where


In this expression, the

Note that the same variance estimator results (i.e., the
Extensions to Blocked Designs
Blocked designs occur when random assignment is conducted separately within distinct study subpopulations (such as school districts, grades, or cohorts over time). Consider a blocked design with K research groups in each block. Let the subscript “b” indicate blocks
In the multi-armed FP context where interest lies in identifying the most effective treatments among those tested, the ATE parameter for block b is

which is calculated over the full randomized sample of nb individuals in the block. The ATE parameter across all blocks can then be expressed as
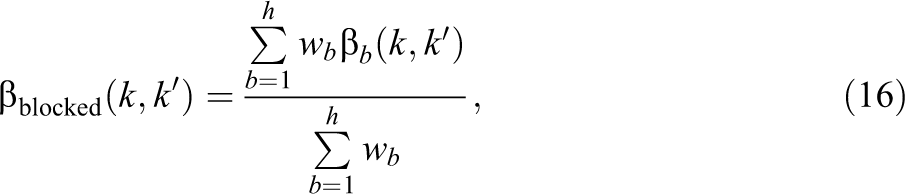
which is a weighted average of the block-specific ATEs with weights
Importantly,

where
As an example, consider a design with two blocks and three research groups, where Block 1 has 20, 20, and 10 individuals in the three research groups, and the corresponding figures for Block 2 are 20, 10, and 20. If we weigh blocks proportional to their sample sizes, the correct weight for Block 1 under the multi-armed trial for any pairwise comparison is
ATE estimators for the parameter in Equation 16 for the multi-armed design are the same as for the two-group design. The only differences are that the block-specific weights for each pairwise contrast pertain to the full randomized sample, and the FP heterogeneity terms in the variance estimators have divisors nb
rather than

where

which can be estimated by applying Equation 10 or Equation 11 separately for each block. Note that in the FP framework, the block-level weights in Equation 19 are assumed to be fixed for the study, but randomness could result if the weights incorporate adjustments for data nonresponse, in which case, the variance results are conditional on the weights.
Similarly, regression estimators for blocked designs for the simple treatment-control design apply to the multi-armed context with the same modifications to the weights and FP heterogeneity term as above (see Schochet, 2015/2016). The same weighting issues also apply to SP estimators for random blocked designs, where the blocks are considered to be randomly sampled from a broader block population.
ATE Estimators for Clustered Designs
The above theory extends directly to clustered designs where groups (such as schools or classrooms) rather than individuals (such as students) are randomly assigned to the research groups and where outcome data are collected on individuals (such as students). In this section, we show that the same issues apply to clustered designs as nonclustered designs as we move from the two-group to multi-armed context. Our focus is on the FP model because ATE estimators for clustered designs under the SP model do not change in the multi-armed setting. Because parallel issues exist for clustered and nonclustered designs, we provide less detail in this section than before.
For the analysis, we use similar notation as for the nonclustered design with the addition of the subscript “j” to indicate clusters. For instance, for the nonblocked design,
Similar to the nonclustered design, we rely on several assumptions for the clustered design: (a) SUTVA, which states that for any two random assignment vectors
In the multi-armed setting for clustered designs where the goal of the study is to identify the most promising treatments among those tested, the ATE parameter for comparing interventions K and k ′ is as follows:
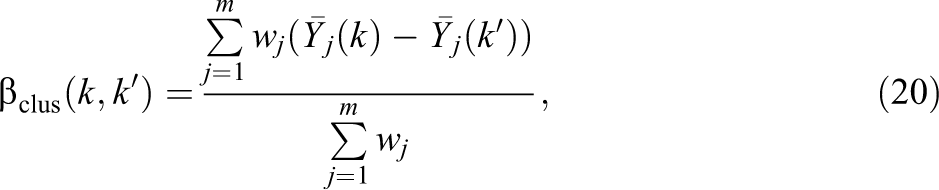
where

are mean, cluster-level potential outcomes in conditions K and k
′; and the clus subscript signifies clustered designs. This ATE parameter is a weighted average of treatment contrasts across all m clusters in the sample, not just the
To develop estimators for the ATE parameter in Equation 20, note first that for clustered designs, a simple version of the design-based approach is to average the individual data to the cluster level (although as discussed later, versions exist that instead use individual-level data). In this setting, the data-generating process for the observed mean outcome for cluster j can be expressed as

where

Consider the weighted simple differences-in-means estimator using the aggregated data:

where the third equality holds using Equation 21. To examine the statistical properties of this estimator in the multi-armed context, we build on the properties of this estimator for the two-group design.
For the two-group design, the estimator in Equation 21 is biased for the parameter in Equation 20 in finite samples if the weights differ across clusters and cluster-level ATEs are heterogeneous (the general case we consider). This is because the denominators in Equation 22 will depend on the particular allocation of clusters to the two research groups (i.e., the weights become random variables). However, as shown in Supplemental Material in the online version of the journal. Material (that builds on Schochet, 2013, 2015/2016), as m gets large,

where

where


is the FP heterogeneity term (see Supplemental Material in the online version of the journal). Accordingly, using the Cauchy–Schwartz inequality as for the nonclustered design, a consistent (upper-bound) variance estimator for Equation 24 is

where


We can now extend these results to the multi-armed design using the same conditioning arguments as discussed in the previous section for the nonclustered design. First, we can show that the estimator in Equation 22 is a consistent estimator for the ATE parameter in Equation 23 using the law of iterated expectations, where, for arbitrarily large m, we first calculate expectations with respect to the randomization distribution, R, conditional on the
Similarly, for large m, we can use the law of total variance to examine the asymptotic variance of
Similar adjustments apply to variance expressions for regression-adjusted estimators, where separate weighted regression models with baseline covariates can be estimated for each pairwise contrast. The Supplemental Material in the online version of the journal (Theorem 2) examines the statistical properties of regression estimators that use individual-level data (for both outcomes and covariates) rather than cluster-level averages, because this approach improves precision by allowing covariates to explain both within- and between-cluster variation in the outcome. The variance formulas for these regression estimators for the two-group design still apply in the multi-armed context except that the FP heterogeneity terms are divided by m rather than

where


are mean square errors from the individual-level regression model averaged to the cluster level;
Finally, no new issues arise for blocked, clustered designs. The formulas in Schochet (2015/2016; chapter 8) still apply in the multi-armed context, except that the block-specific weights for each pairwise contrast now pertain to the full randomized sample of clusters, and the FP heterogeneity terms in the variance estimators are now divided by mb
(the total number of clusters in the block) rather than
Empirical Application
To demonstrate the ATE estimators discussed above, we use data from a multi-armed RCT that tested the effectiveness of several supplemental reading interventions for fifth graders (James-Burdumy et al., 2009). The study used a blocked, clustered design where schools were randomized within school districts. Table 2 summarizes the data for our analysis, including the study samples, research groups, and the composite test score outcome used by the evaluation. Our analysis uses the evaluation’s control group (Group 1) and two treatment groups created from the original four: (a) Schools offered the Reading for Knowledge curriculum (Group 2) and (b) schools offered any of the other three reading curricula (Group 3) that we combine because the original evaluation found similar impacts for them (and to minimize the reporting of results). Our goal is not to mimic the original study findings or to provide policy conclusions but to demonstrate several key features of ATE estimation in the multi-armed setting.
Summary of Randomized Controlled Trial Data for the Empirical Analysis
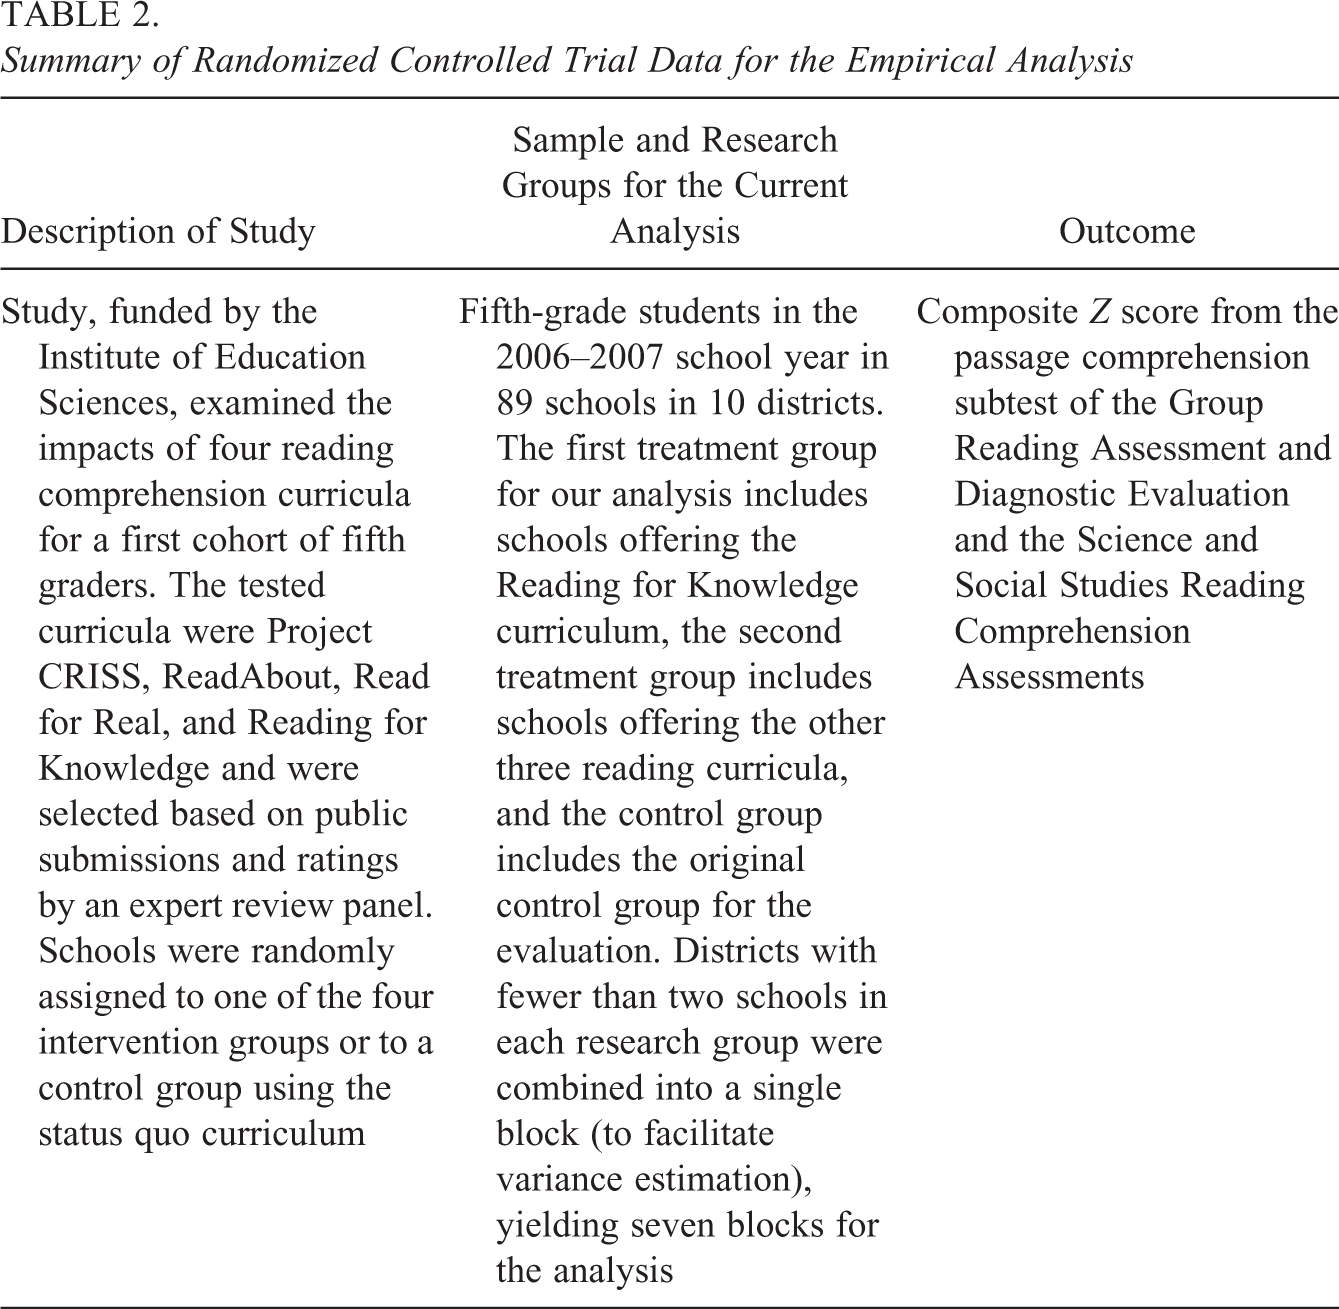
Table 3 displays impact results under the FP model for the three possible pairwise contrasts comparing Groups 1, 2, and 3. The results are presented for the design-based estimators discussed in this article and for those assuming the two-group design that ignore the adjustments for the multi-armed trial. The impact estimates and standard errors could differ for the two scenarios because of differences in how the block-level weights and FP heterogeneity terms are calculated. The estimates were obtained using the free RCT-YES software version 1.2 (www.rct-yes.com), with clusters weighted by their student sample sizes. To increase precision, all models included the following baseline covariates: school urban/rural status, teacher and student race/ethnicity indicators, student pretest scores on the Group Reading Assessment and Diagnostic Evaluation and Science and Social Studies tests, and an indicator of limited English proficiency. For illustrative purposes, we focus on unadjusted p values, although in practice, a more rigorous approach would be to adjust the p values for multiple testing across the three pairwise contrasts.
Impact Findings on Composite Z Scores for the Empirical Analysis
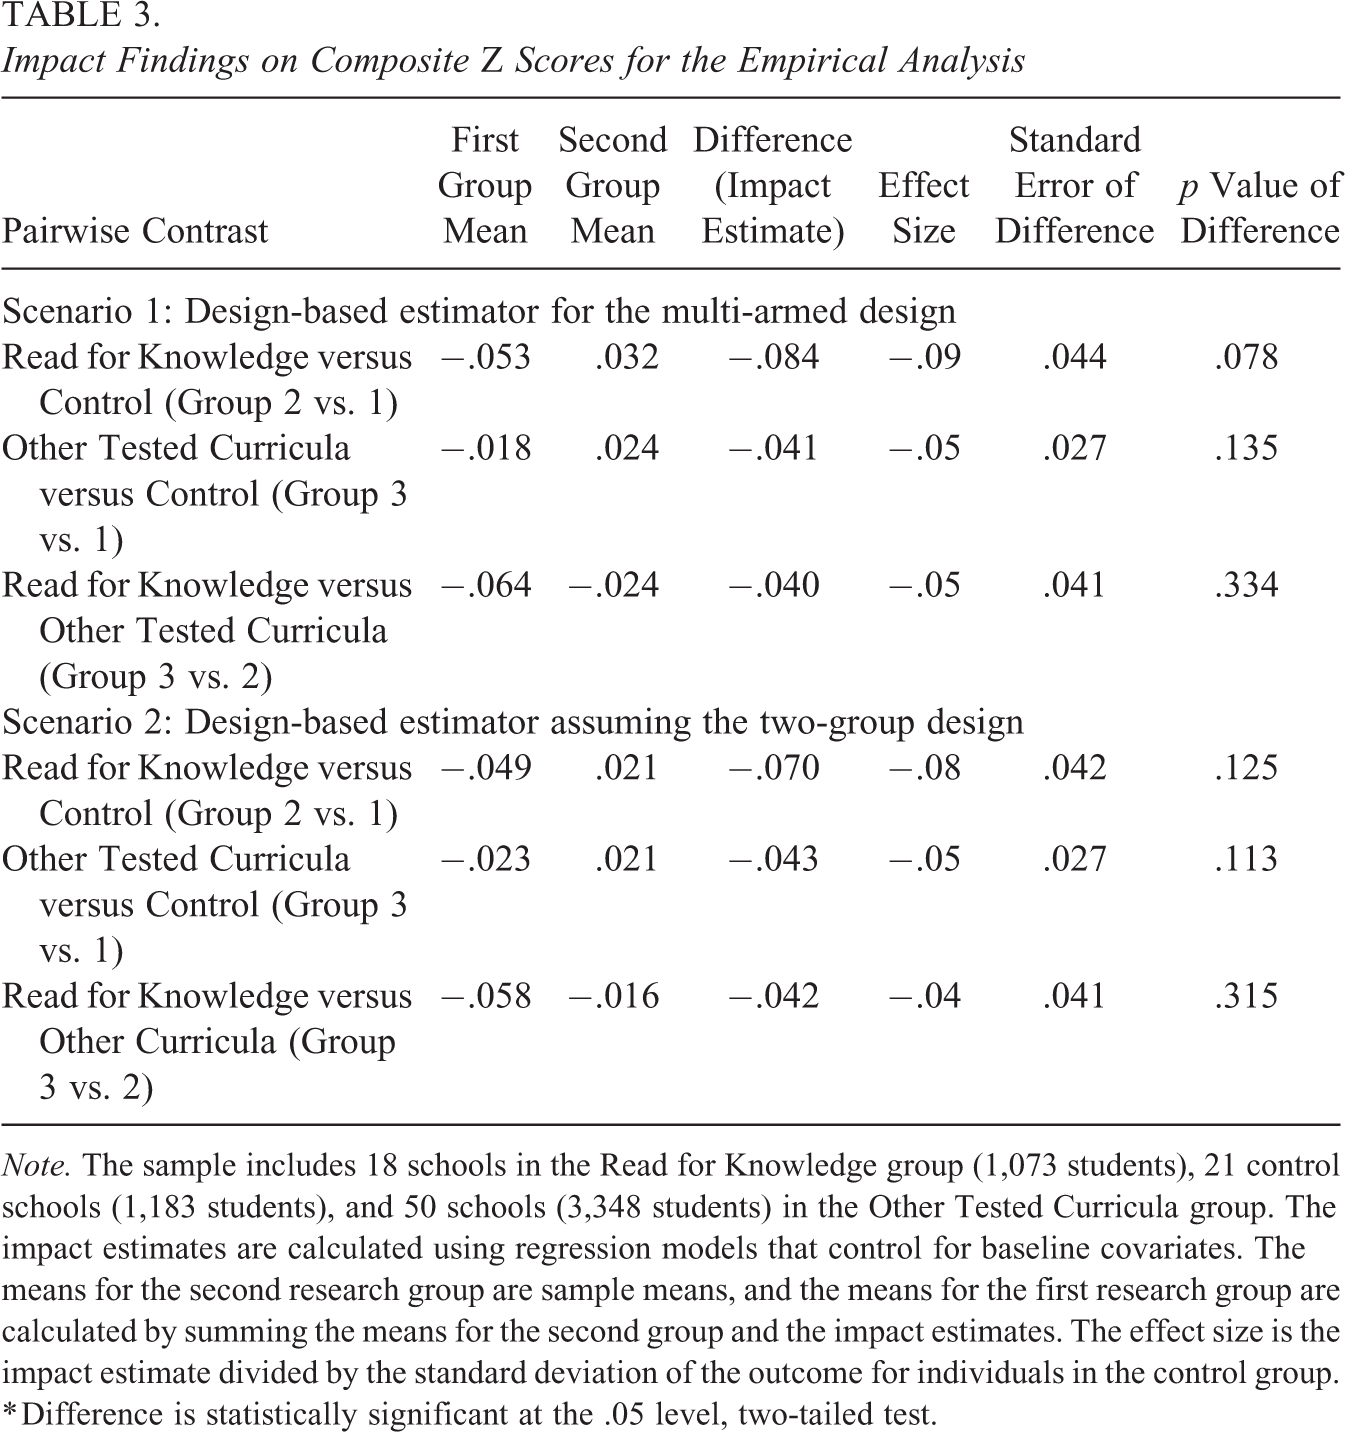
Note. The sample includes 18 schools in the Read for Knowledge group (1,073 students), 21 control schools (1,183 students), and 50 schools (3,348 students) in the Other Tested Curricula group. The impact estimates are calculated using regression models that control for baseline covariates. The means for the second research group are sample means, and the means for the first research group are calculated by summing the means for the second group and the impact estimates. The effect size is the impact estimate divided by the standard deviation of the outcome for individuals in the control group.
* Difference is statistically significant at the .05 level, two-tailed test.
The results suggest that the tested reading curriculum lowered test scores relative to the status quo curricula, although none of the impacts are statistically significant at the 5% level. However, there is some evidence using the multi-armed estimator that the Read for Knowledge curriculum performed worse than the control condition if we adopt a 10% significance standard (p value of .078). This evidence, however, is weaker using the two-group estimator (p value of .125).
Table 4 provides key reasons for the differences in p values for the Group 2 versus 1 contrast for the two designs. First, we find some differences in block-level weights across the designs because assignment rates to the research groups differed across some blocks (Blocks 4, 6, and 7) and also because of random differences in average school sizes across the research groups. This means that the estimators under the two-group and multi-armed design differ because the estimated impacts vary considerably across blocks (they range from −.534 to .277 as shown in Table 4). Second, the pooled standard error is only slightly larger for the multi-armed design (.044 vs. .042 from Table 3) because even though the FP heterogeneity terms are about half as large for the multi-armed trial, they typically comprise less than 5% of the total variance (see final column of Table 4). Putting these findings together, the main driver of the p value differences for the Group 2 versus 1 contrast is that Block 3, which has the largest negative impact across the sites, is weighted more heavily under the multi-armed design than the two-group design. This weighting difference leads to a more negative overall impact estimate under the multi-armed trial (−.084) than under the two-group design (−.070), with only a small difference in standard errors.
Block Impacts, Weights, and Standard Errors for the Read for Knowledge and Control Group (Group 2 vs. 1) Contrast
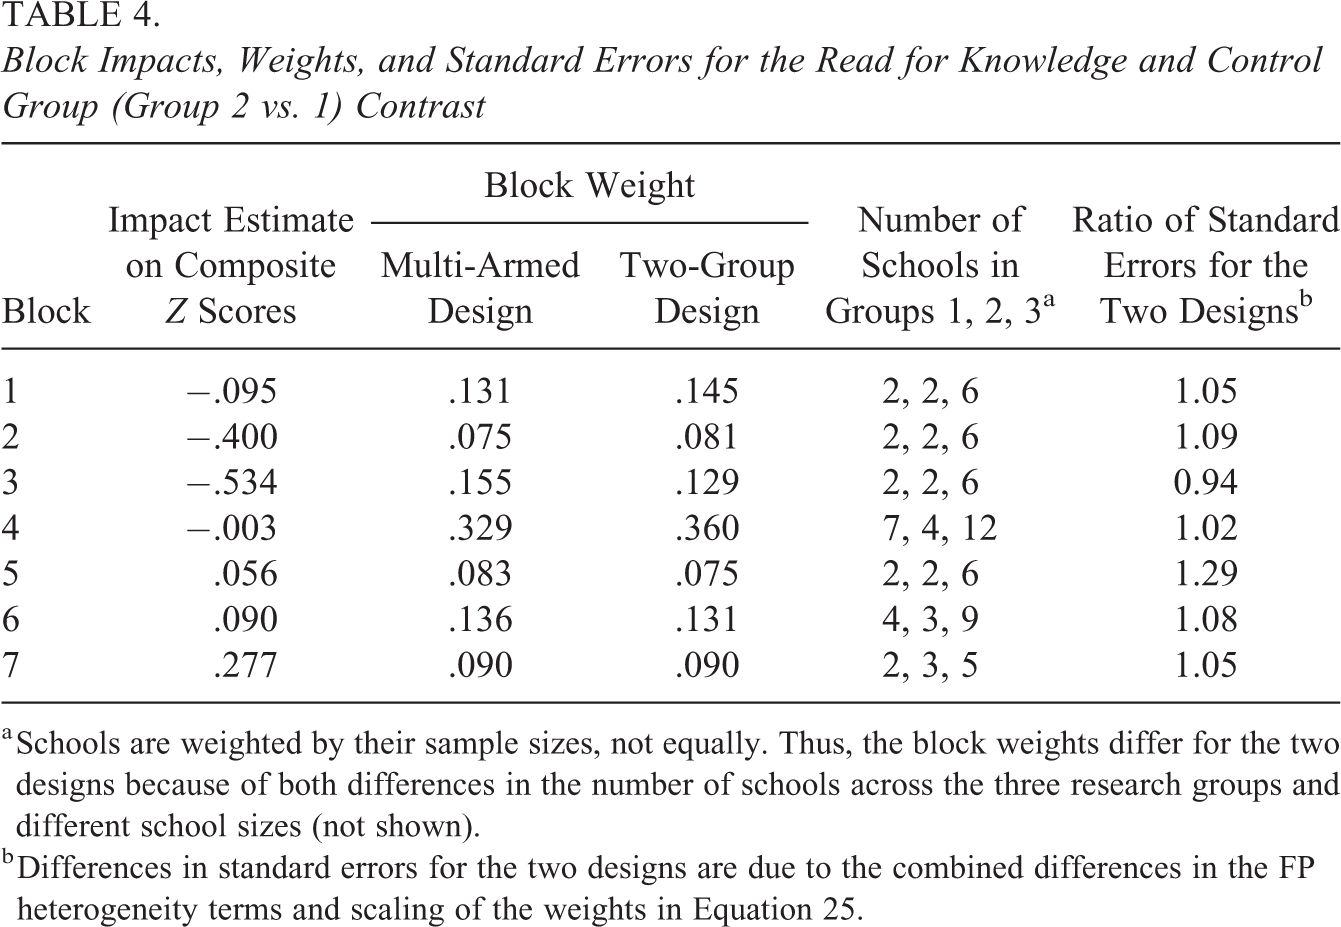
a Schools are weighted by their sample sizes, not equally. Thus, the block weights differ for the two designs because of both differences in the number of schools across the three research groups and different school sizes (not shown).
b Differences in standard errors for the two designs are due to the combined differences in the FP heterogeneity terms and scaling of the weights in Equation 25.
This analysis suggests that the adjustments needed to produce design-based estimators in the considered multi-armed context can matter in real-world RCT applications, although in this example, they did not produce different overall conclusions regarding the effects of the tested reading curricula.
Conclusions
This article developed design-based estimators for multi-armed impact evaluations for a wide range of designs used in education research, where interest lies in comparing impacts across the tested treatments to identify the most effective ones. Because the analysis in the multi-armed setting typically involves pairwise contrasts across the research groups, the key methodological question addressed in the article is: How do the estimators for the two-group design need to be adjusted for multi-armed trials? The critical insight is that in multi-armed trials using the FP framework, the samples for each pairwise contrast are representative of the full set of randomized units, not just of themselves. In essence, a “pure” FP model does not exist in the multi-armed setting. The implications are that (a) the FP heterogeneity terms need to be slightly adjusted in the variance estimators (that can slightly reduce precision) and (b) the weights need to be adjusted for blocked designs, so that blocks are weighted by the entire size of the block, not just the size of the two contrasted groups under investigation. Ignoring these adjustments could lead to biased estimators, especially the weighting corrections for blocked designs if impacts and assignment rates to the research groups differ across blocks.
As demonstrated by our empirical example using data from a clustered, blocked RCT, these adjustments can affect the estimated impacts and standard errors. Thus, researchers analyzing data from multi-armed trials should be cautious about applying methods for the simple treatment-control design for each pairwise comparison in turn. Instead, the adjusted estimators presented in this article are more grounded in the mechanisms underlying multi-armed experiments and are required to generate consistent estimators. In addition, although not the focus of this article, adjusting for multiple hypothesis testing across pairwise contrasts should be considered for multi-armed trials to control Type 1 error rates. The free RCT-YES software (www.rct-yes.com) can be used to estimate and report impacts using the methods discussed in this article, including multiple testing adjustments.
Supplemental Material
Supplemental Material, DS_10.3102_1076998618786968 - Design-Based Estimators for Average Treatment Effects for Multi-Armed RCTs
Supplemental Material, DS_10.3102_1076998618786968 for Design-Based Estimators for Average Treatment Effects for Multi-Armed RCTs by Peter Z. Schochet in Journal of Educational and Behavioral Statistics
Footnotes
Declaration of Conflicting Interests
The author(s) declared no potential conflicts of interest with respect to the research, authorship, and/or publication of this article.
Funding
The author(s) received no financial support for the research, authorship, and/or publication of this article.
Notes
References
Supplementary Material
Please find the following supplemental material available below.
For Open Access articles published under a Creative Commons License, all supplemental material carries the same license as the article it is associated with.
For non-Open Access articles published, all supplemental material carries a non-exclusive license, and permission requests for re-use of supplemental material or any part of supplemental material shall be sent directly to the copyright owner as specified in the copyright notice associated with the article.
