
Abstract
This paper begins by setting the linking methods of Reardon, Kalogrides, and Ho in the broader literature on linking. Trends in the validity data suggest that there may be a conditional bias in the estimates of district means, but the data in the article are not conclusive on this point. Further, the data used in their case study might support the validity of the methods only over a limited range of the ability continuum. Applications of the method are then discussed. Contrary to the title, the application of the linking results is not limited to aggregate-level data. Because the potential application is so broad, further research is needed on issues such as the possibility of conditional bias and the validity of estimates over the full range of possible values. Validity is not a dichotomous concept where validity exists or it does not. The evidence reported by Reardon et al. provides substantial, but incomplete, support for the validity of the linked measures in this case study.
Keywords
In education and the behavioral sciences, linking involves taking two assessments composed of different items and recalibrating the scores on one or both assessments so that the scores on both tests are on the same scale. To use an analogy from the physical sciences, if we think of a ruler calibrated in inches as one “assessment” and a ruler calibrated in centimeters as the other “assessment,” then converting the measurements taken with the first assessment into centimeters would be an example of linking. After the conversion to the common centimeter scale, we could meaningfully compare the results of measurements taken with the inch ruler to the results of measurements taken with the centimeter ruler. The sole purpose of linking is to enable meaningful comparison of measurements taken by different assessment devices.
As noted by Kane (2013) and Reardon, Kalogrides, and Ho (2021), validation must begin with a statement of the intended purposes of the measurements. In the case of Reardon et al., the purpose questions are as follows: “What is it we want to compare?” and “Why do we want to compare them?” The answer to the first question is fairly simple. We want to compare mean test scores of schools or districts that administered different state tests. Reardon et al. focuses on comparisons of aggregate-level data: for example, the mean reading scores of Atlanta students who took the Georgia Milestones Assessment System (GMAS) with the mean reading scores of students in Boston who took the Massachusetts Comprehensive Assessment (MCA). However, once a linking function is established, the application of the function is not limited to aggregate data. For instance, states have what is functionally a “passing” score. Students scoring above that cut score are labeled as “proficient” with grade-level material. Once a linking function is established for comparing aggregate-level scores, we could use it to convert the Georgia cut score and the Massachusetts cut score to a common scale so that we can determine whether the proficiency standard in Georgia is as rigorous as that in Massachusetts. We could even use it to compare the scores of individual students across states. For instance, consider a student who, after third grade, moved from Georgia to Massachusetts. If we use our linking function to convert the student’s third-grade GMAS score to the same scale as the fourth-grade MCA score, then we could compare the two scores to estimate the student’s growth in reading from third to fourth grade.
Some of these things are already done. For instance, since 2003, the National Assessment of Educational Progress (NAEP) has mapped the proficiency cut scores of the states onto the NAEP scale (U.S. Department of Education [USDE], 2019). This means that, since 2003, NAEP has developed functions for mapping state test scores onto the NAEP scale. These NAEP linking functions provide an alternative to deriving a linking function using the method of Reardon et al. (2021).
I am not saying that all these applications of the linking formula would be legitimate in that they would provide reliable and valid data on which to base the comparisons. Rather, I am saying that once the linking function is established, the barn door is wide open to all of these applications and more. If we take Kane’s (2013) admonition seriously, we have to evaluate the validity of linked scores for a wide variety of potential applications. Although Reardon et al. (2021) discourages the use of these linking formulas in high-stakes testing, in reality, the temptation to use the formulas in high-stakes testing may be overwhelming. Because the potential applications are so broad and the temptation to use such methods in high-stakes testing is so irresistible, the validity of the linking formulas needs to be examined carefully, extensively, and cautiously. Reardon et al. clearly understands this, and their findings make an important contribution to the methodology and evidence regarding the linking of statewide test scores across states. To begin the evaluation of the evidence, the methods used by Reardon et al. need situating in the wider linking literature.
Linking
Linking processes fall into three types: equating, calibration, and concordance (Feuer et al., 1999; Kolen, 2004; Kolen & Brennan, 2014). The first two of these involve linking tests that measure the same construct. The construct measured by a reading or math test is determined by its content coverage. Given that content coverage is left to the states and NAEP, there is nothing in the system to assure that the several state tests and the NAEP test have the same content coverage and measure the same construct. Therefore, the linking process of Reardon et al. (2021) falls into the concordance category, not equating or calibrating.
Concordance (or moderation) refers to a process of calibrating two tests that measure similar but not the same construct. The most common example of moderation in the United States is the linking of ACT (2018) composite scores with SAT total scores. In this conversion, SAT and ACT scores are considered equivalent if they correspond to the same percentile rank in the population of college admissions test takers. Because equivalence is based on percentile rank, this is called equipercentile linking. Whereas the linear linking of Reardon et al. requires the strong assumption of a linear relationship between scores on the two assessments, equipercentile linking requires the weaker assumption of a monotone relationship. Linear linking assumes that the distributions of the two tests are the same except for their means and standard deviations. In mapping state cut scores onto the NAEP scale, NAEP uses equipercentile linking. Although it may seem counterintuitive to link scores that measure somewhat different constructs, the practice is widely accepted with respect to the ACT and SAT scores. Virtually, every college or university that allows student applicants to submit either the SAT or ACT score makes their admissions decisions, in part, on equipercentile ACT/SAT scores.
Although there is a very substantial literature on linking tests that measure the same construct, there is far less research (Kolen, 2004) on how linking methods work when the constructs are similar but not identical. To my knowledge, there is little literature comparing the content of state and NAEP tests in the same subject area (USDE, 2018). There are, however, studies reporting on correlations between state tests and NAEP. The National Center for Education Statistics (NCES) has used a correlation of at least .7 as the criterion for considering two tests to be similar if not identical. In 2003, for example, NCES reports a correlation of .7 or better between state and NAEP reading scores in 29 of 51 states in fourth grade and 29 of 48 states in eighth. For mathematics, the correlation was .7 or better in 30 of 49 states in fourth grade and 41 of 46 states in eighth (USDE, 2008a, 2008b). These correlations lead to the conclusion that the similarity between the constructs measured by state assessments and NAEP varies across states and, in some states, is not high enough to support a conclusion that the constructs are highly similar.
Linear Versus Equipercentile Linking
Although the constructs measured by the several state tests and NAEP are not the same, in the strictest sense, Reardon et al. are making an assumption that the constructs are similar, as in the SAT/ACT conversion process. However, they are making stronger assumptions about the form of the relationship between scores (linear rather than monotone) than the assumption about the relationship between SAT and ACT scores.
This comparison of Reardon et al.’s approach to the ACT/SAT concordance process leads naturally to the question of whether the relationship of NAEP scores to statewide test scores is linear. Reardon et al. (2021) are assuming it is linear not just in one state but in every state for both reading and math. Future research on the validity of the linear linking model should investigate the linearity of these relationships.
Equivalent and Nonequivalent Groups Designs
There are two linking designs. The first is a nonequivalent design in which the sample taking one test is drawn from a different population than is the sample taking the second test. Nonequivalent groups require that there be at least a small set of anchor items that are administered to the sample taking each test. There are no common items administered in NAEP and in state tests. Therefore, Reardon et al. cannot use an approach applicable to nonequivalent groups.
In the equivalent groups design, both tests are administered to the same people or to random samples from the same population. Therefore, Reardon et al. must make an assumption that, within a state, the population from which the NAEP and state test samples are drawn come from the same student populations. There are aspects of the two testing procedures that may lead to differences in the populations as recognized by Reardon et al. For instance, participation in NAEP is voluntary whereas participation in state testing is required. NAEP is administered in a 90- to- 120-minute session on a single day, whereas state tests allow students unlimited time. Since state tests are often administered over several days, if a student misses the main testing day, they may be able to take it a few days later when they return to schools. Both programs offer accommodations, but the accommodation procedures may not be the same for NAEP and the state test in every state. Because the state tests are required, offered on multiple days, allow unlimited time, and offer extensive accommodations, the population from which state tests draw may be broader and span a wider range of ability.
In short, the procedures developed by Reardon et al. (2021) make three major assumptions regarding every state for both reading and math: The constructs measured by NAEP and the statewide test are highly similar, the relationship between the state and NAEP test scores is linear, and the populations of test takers for NAEP and the statewide test are the same. They recognize all of these assumptions. However, in their validity study, these assumptions are tested only indirectly. Direct tests of the individual assumptions remain a matter for future research.
Linking Functions
The basic equations for linear linking are well known. Let

where
and

Reardon et al. then assumes that the state scores are standardized to have

and

which leads to a simplified form of their Equation 1:

Assuming
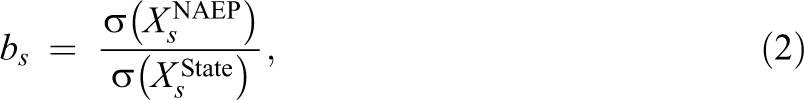
For any group, say district d:s, the estimate of its standard deviation can be transformed from the state scale to the NAEP scale using the constant bs :

Equation 7 is their Equation 3 expressed my notation.
The case study possesses formidable obstacles to the use of Equations 6 and 7 (their Equations 2 and 3) that are unique to their case study. First, the authors did not have complete data on the state tests from which to estimate district means
Second, in the case study, there are 20 districts covering 13 states. The linking involves linking not just one state test to the NAEP scale but 13 separate state tests in both reading and math. There is not just one set of equating constants (b, a) to be estimated but 26 sets of linking constants (
Validity Results
There are three major types of validity evidence in the study: bias, root mean square error (RMSE), and correlations. Both state reading and state math tests are included in the analysis. Further, there are estimates of linking error.
Most of this evidence is impressive. For instance, when state test data are used to estimate district NAEP means, the reliability-adjusted correlations between the estimated and actual NAEP means range from .93 to .98 in reading and .93 to .96 in mathematics (Reardon et al. 2021, Table 1). As another example, when state test data were used to estimate district Measures of Academic Progress (MAP) means, the reliability-adjusted correlations of the estimated and actual means were .91 to .95 in reading and .90 to .95 in math (Reardon et al. 2021, Table 2). The correlations for estimated and actual district standard deviations (Table A1 and A2) are not as high but generally supportive. Similarly, RMSE’s correlations in Tables 1 and 2 are relatively modest when compared to the actual standard deviation of NAEP scores. The estimates of linking error are also small. Overall, the correlational results lead to the conclusion that the linking process accurately predicted the rank order of the district means.
One limitation of these data is that they seem to cover only a limited range of the NAEP (or MAP) scale. I suspect that all or most of these large urban districts have achievement test means (NAEP, MAP, and statewide test) below the corresponding state average. If so, then their means would cover a limited interval of the achievement scale. The validity data support the validity of score estimates falling in the range covered by the district means, but results do not generalize beyond that range.
There is a trend in the bias statistics that suggests a conditional bias in the estimates although the data are not conclusive on this point. The possibility of a conditional bias is an educated guess on my part that warrants further study and may be confirmed or disconfirmed by further analysis. The bias statistics in Tables 1 and 4 are all positive. The authors note that this is unexpected, and they go on to say “under a linear linking such as Equation 2, our definition of bias implies that the weighted average bias, among all districts within each state, and across all states, is 0 by design” (p. 11). Nevertheless, how can one explain the fact that these particular district means tend to be consistently overestimated? In addition, the means for boys and girls are overestimated. The means for the three ethnic groups are also overestimated. Even though the average bias in each state should be zero, all of the biases in Tables 1 and 4 are positive.
One possible explanation is that, for some reason, the estimated district means
Table 1 shows hypothetical district means whose linked estimates are regressed toward the state mean and whose means display a conditional bias of the sort posited here. I conjecture that all (or most) of the large urban means in Reardon et al. (2021) are below their state means and display a positive bias as do all of the districts below the mean in Table 1. Were there any districts above their respective state means (and I conjecture there are few if any), they would display negative bias as do those above the mean in Table 1. In other words, it is here conjectured that the district means come from a limited interval below each state mean where, if regression to the mean is occurring, a positive bias is to be expected. If this conditional bias holds, the absolute value of the bias tends to increase as distance from the state means increases (as in Table 1 of this article).
Hypothesized Bias Pattern of Linked Estimates as Compared to Actual NAEP Scores With Mean = 230 and Variance = 30

Note. Hypothetical mean NAEP score with corresponding linked NAEP score and bias. NAEP = National Assessment of Educational Progress.
This conditional bias theory suggests a prediction to check against the data. Table 1 of Reardon shows bias statistics for Blacks, Hispanics, and Whites. These bias statistics involved pooling over grades and subject matters. In most data, Whites have higher means than Blacks or Hispanics in both reading and math and in all grades. If all three race/ethnic groups have means below state averages, but the White mean is higher than that for Blacks and Hispanics and therefore closer to the state mean, the regression toward the mean hypothesis would lead one to expect less bias in the White means than in the Black or Hispanic means. This prediction is supported by the data in Table 1 where the biases for Blacks, Hispanics, and Whites are 1.80, 2.08, and 0.66, respectively.
The regression toward the mean hypothesis may also help explain the trend of the female and male means. In reading, females generally have higher mean reading scores than males. If both females and males have reading means below their respective state averages but females have higher means closer to state averages, one would expect less bias in female means. The male/female means in Table 1 are pooled over both math and reading, but the female bias of 1.70 is less than the male bias of 1.84. If these bias statistics primarily reflect the higher reading means of females, or if the females generally have higher (but below average) means than males in both reading and math, the regression toward the mean hypothesis could explain both the positive bias of male and female means as well as the direction of the difference in the female/male bias.
The data in the manuscript are far from conclusive on this point, but they are suggestive of a conditional bias in which the bias is positive for districts with means below the state average, negative for districts with averages above the state average, and the absolute bias increases for districts further from the state average. This conditional bias hypothesis may explain three trends in the data of Tables 1 and 4: (1) All biases are positive, (2) the means for Blacks and Hispanics are more biased than those for Whites, and (3) the female means are less biased than the male means.
Even if this bias conjecture is correct, it does not imply a flaw in either the HETOP method or the linking method itself. Rather, it would suggest a violation of one or more assumptions of HETOP or the linking method. The validity evidence supports the validity of the rank ordering of districts while suggesting a pattern of systematic bias that would not alter the rank ordering of district means. It also suggests that one feature of the bias statistic, their positive sign, may result from the limited range of district mean scores included in the study. With a broader range of districts, one could examine the pattern of the bias more thoroughly. The strong correlations accompanied by the less supportive bias statistics would suggest that the district means have been placed on a common scale, but our conjecture about the bias pattern would suggest that the common scale differs systematically from the NAEP scale.
Application and Discussion
The methods of the study are presented as examples of techniques that can be used in the empirical evaluation of linking studies. Further examples of methods for evaluating linking methods can be found in the special issue of Applied Psychological Measurement edited by von Davier and Liu (2008) with exemplary studies (Dorans et al., 2008; Liu & Holland, 2008; von Davier & Wilson, 2008: Yang & Gao, 2008; Yi & Harris, 2008) and with comments by Peterson (2008) and Brennan (2008).
Limitations
There are four potential limitations of the methods applied to the case study. They represent the limitations of the method, the case study data, or both. First, the methods apply linear linking. These methods assume a linear relationship between state test scores and NAEP (or MAP) rather than the weaker monotonic assumption of equipercentile linking. The method assumes a linear relationship in all 13 states and both subject matters. If a linear relationship holds, within every state, the state test and the NAEP test scores have identical distributions except for their means and variances.
Second, the study used rather limited data about the distribution of test scores in each district. The authors estimated district means and standard deviations from data showing the proportion of the district’s students falling in each of its state’s achievement categories. As compared to estimating means and standard deviation from full data, there is a substantial loss of information from having only student proportions in achievement categories. States use from two to five categories, and accuracy may decline as the number of achievement categories approaches two.
Third, the districts are not a representative sample of districts around the country or in their respective states. I conjecture that most, if not all, of these districts have means below that of their state. Thus, they represent a rather restricted range of achievement levels, a range that may fall entirely below the national average and the respective state averages. The districts are very large. It is only with the greatest caution that one can generalize from the validity data of this study to the full population of districts within the United States or within any given state. The limited range may partially explain why the bias in estimates of state NAEP means was so consistently positive even though there should be a mix of positive and negative biases that average out to zero in each state as a whole.
Last, the methods of this study assume that the content of the state tests and the NAEP tests are similar, so that the state and NAEP tests measure the same dimension when in fact existing data suggest that the picture is somewhat mixed. Further, these methods assume that the population of students taking the statewide tests is the same as that taking the NAEP tests in each state and district, whereas differences in content, administration procedures, and the use of accommodated assessments may suggest otherwise.
In short, there may be more than just measurement, sampling, and linking error in this study. Other sources of error include nonlinearity of state/NAEP relationships, district unrepresentativeness, dissimilarities between state/NAEP administration procedures, dissimilarities of populations tested, and unequal use of accommodations.
Future Research
The limitations above suggest a number of possible research endeavors. Some of these endeavors would involve real data while others would involve simulation. Some of the endeavors would involve quantitative data while others would involve qualitative. Given the schedule for revisions in NAEP assessments and the various state tests, some of the research would need to be ongoing to keep pace with changing events.
Where some assumptions of the linking method may be violated, simulation data might be used to evaluate the effect of the violations. Although there is considerable simulation research on linking, there has been little research examining what happens to linked estimates when the linked tests involve somewhat different constructs (Kolen, 2004). Further, most studies have examined the accuracy of a single linking formula converting scores on one test to the scale of a second test, but what happens in situations where there are many tests (e.g., 50 state tests), each related to the common scale by a different function?
There are also a number of questions to be studied with real, quantitative data. For instance, are scores on NAEP related to scores on the several state tests by a linear function? If the methods employed in this study are applied to small districts or to districts (or subgroups) covering the full range of reading or math achievement, how well do the methods reproduce scores at various points along the achievement range?
And finally, there are qualitative issues. How well does the content of the state tests match that of NAEP (or the MAP)? How comparable are the populations to which the two kinds of tests are given? Are accommodations used comparably in the two programs?
Applications
In what kinds of research would these methods be applied most usefully? In answering this question, there would seem to be two considerations. First, there is no need to employ such linking unless the research involves cross-state comparisons. Evaluations of state policies will inevitably involve such comparisons, but district or school comparisons may not. For instance, Teitelbaum (2003) compared the math achievement in states requiring varying numbers of math credits for high school graduation to see whether increasing high school math course requirements might increase a state’s average math achievement. Such a study would require cross-state comparisons of achievement because it involves state policies. Using actual state NAEP data is one possibility, but using statewide data linked to the NAEP is a second possibility. If one has conducted an efficacy study on a national sample and NAEP data are unavailable, statewide data linked to the NAEP scale are also a possibility (e.g., Bernstein et al., 2004). While linked scores could be used, unreliability and linking errors may lower power, at least to some degree. The linking may be accomplished by the methods of Reardon et al. (2021) or alternative linking strategies (USDE, 2019).
The second consideration is the type of comparison involved in the study. The correlations between district’s actual NAEP means and their linked NAEP means are impressive, as are the correlations of actual district MAP means and the linked estimates. This would suggest that linked NAEP scores do a good job of ranking districts. However, ranking districts involves comparing one linked NAEP score to other linked NAEP scores. The study supports the validity of comparing linked NAEP scores to each other. The bias data, however, are not as impressive. There may be systematic bias that is not yet fully explained or understood. The bias comparisons involve comparing an actual NAEP score to a linked NAEP score rather than comparing linked NAEP scores to each other. The validity study provides far more support for comparing linked NAEP scores to each other than it does for comparing linked NAEP scores to actual NAEP scores. Thus, these linked NAEP scores will be most useful in studies that require cross-state score comparisons and that involve comparing linked scores to each other.
The authors state that linked scores derived from their methods can be “used to investigate broad patterns in the relationships between average test performance and local community or schooling conditions, both within and between states. Linked scores are needed for studies that involve cross-state comparisons or a combination of cross- and within-state comparisons but not for studies that involve only within-state comparisons. Cross-state comparisons are most clearly indicated in studies of statewide policies.
Finally, even when a study involves cross-state comparisons of districts or schools, there may be alternatives. The researcher may be able to find multiple districts in each state that use a common test such as the MAP. In other studies, there may be no need for cross-state comparisons. For instance, if one wanted to compare the achievement of districts that did and did not offer universal free breakfast programs, finding an effect in several within-state studies may be just as useful as one or more studies of a national sample. However, when such alternatives are not available, the strong correlations in the Reardon et al. study qualified by the bias indices support the use of these methods to compare linked scores to each other in cross-state comparisons but much less support for the comparison of linked and actual NAEP scores. The linking process seems to place district means on a common scale, but the common scale may differ in systematic ways from the NAEP scale itself.
Footnotes
Declaration of Conflicting Interests
The author(s) declared no potential conflicts of interest with respect to the research, authorship, and/or publication of this article.
Funding
The author(s) received no financial support for the research, authorship, and/or publication of this article.