
Abstract
This article proposes a class of cognitive diagnosis models (CDMs) for polytomously scored items with different link functions. Many existing polytomous CDMs can be considered as special cases of the proposed class of polytomous CDMs. Simulation studies were carried out to investigate the feasibility of the proposed CDMs and the performance of several information criteria (Akaike’s information criterion [AIC], consistent Akaike’s information criterion [CAIC], and Bayesian information criterion [BIC]) in model selection. The results showed that the parameters of the proposed CDMs could be recovered adequately under varied conditions. In addition, CAIC and BIC had better performance in selecting the most appropriate model than AIC. Finally, a set of real data was analyzed to illustrate the application of the proposed CDMs.
1. Introduction
Cognitive diagnostic assessments (CDAs) aim to detect whether examinees have mastered a set of attributes or skills of interest. Unlike traditional tests that typically provide only total ability estimates, CDAs can provide detailed diagnostic information about the strengths and weaknesses of students to aid instruction and learning. In recent years, CDAs have received increasing attention within educational and psychological tests.
1.1. Dichotomous Cognitive Diagnosis Models
So far, a large number of cognitive diagnosis models (CDMs) have been proposed to satisfy the demands of the CDAs. Examples of CDMs include the deterministic inputs, noisy “and” gate (DINA) model (Haertel, 1989; Junker & Sijtsma, 2001); the deterministic input, noisy “or” gate (DINO) model (Templin & Henson, 2006); the reduced reparameterized unified model (R-RUM; Hartz, 2002); the linear logistic model (LLM; Maris, 1999); the noisy, input deterministic “and” gate (NIDA) model (Junker & Sijtsma, 2001); the generalized DINA (G-DINA) model (de la Torre, 2011); and the log-linear CDM (LCDM; Henson et al., 2009). However, most of these CDMs are only suitable for dichotomously scored items.
1.2. Polytomous Cognitive Diagnosis Models
Polytomously scored items, or polytomous items for short, are important for various testing purposes (Embretson & Reise, 2000). Examples of polytomous items include the constructed-response items in cognitive tests and rating scales in personality and attitude tests. Despite some limitations, polytomous items have several advantages over dichotomous items (van der Ark, 2001). First, polytomous items can usually provide more information than dichotomous items and thus yield more accurate parameter estimation (Nering & Ostini, 2010). Second, polytomous items may be more suitable than dichotomous items for some purposes. For example, in noncognitive tests, rating scales with only two options may frustrate respondents (Cox, 1980) and limit the reliability. In cognitive tests, dichotomous items like multiple-choice and true-false items are usually, though not always, believed to elicit only lower level cognitive skills, whereas polytomous items such as essays are more likely to measure higher level cognitive processes (Bandalos, 2018, p. 82). Finally, researchers have shown that open-ended items that are usually polytomously scored are more appropriate for diagnostic purposes because students’ responses can be explicitly observed and students need to really solve the problem, which may not be the case for multiple-choice items due to the availability of options (Birenbaum & Tatsuoka, 1987).
To analyze polytomous data in CDAs, a common strategy is to convert polytomous data into dichotomous data (e.g., Lee et al., 2011; Templin & Henson, 2006). After this conversion, the existing CDMs for dichotomous data can be applied. However, such a method can lead to loss of information and reduce classification accuracy (Ma & de la Torre, 2016; Tu et al., 2017). Therefore, it is necessary to develop CDMs for polytomous data.
At present, only a few polytomous CDMs have been developed to deal with polytomous items, such as the general diagnostic model (GDM; von Davier, 2005, 2008), the partial-credit DINA model (PC-DINA; de la Torre, 2010), the polytomous LCDM (P-LCDM; Hansen, 2013), rating scale diagnostic model (RSDM; R. Liu & Jiang, 2020), and the sequential G-DINA model (Ma & de la Torre, 2016). It is important to note that the GDM allows polytomous items, and polytomous attributes, while the other models focus only on polytomous responses. However, these CDMs, except the sequential G-DINA model, do not consider the relationship between attributes and response categories by assuming that all response categories of an item measure the same set of attributes. This may result in a loss of diagnostic information because different response categories could measure different attributes. More importantly, the existing polytomous models are based on different theoretical assumptions (or cognitive processing), which belong to different types of models. For example, the P-LCDM belongs to graded response models based on the global (or cumulative) logit, the GDM, PC-DINA and NRDM are partial-credit models that make use of the local logit, while the sequential G-DINA model is a special case of the sequential process model based on the continuation ratio (CR) logit. Therefore, for these existing CDMs, each model depends on restrictive theoretical assumptions and limits their use.
The current article proposes a class of CDMs for polytomous responses with less restrictive assumptions. In the proposed CDMs, three different link functions, namely, the cumulative logit, the local logit, and the CR logit, are considered. Moreover, constraints on the Q-matrix and the parameters across categories may be imposed. As a result, the proposed model contains at least 12 different types of polytomous CDMs and can deal with ordinal polytomous responses of different nature. In contrast, many existing CDMs for polytomous response, such as the sequential G-DINA and the P-LCDM, can only handle one particular type of polytomous response data and can be viewed as special cases of the proposed model. Therefore, compared with existing CDMs, the proposed model is more flexible and could have a wider range of applications.
The remaining sections of the article are laid out as follows. In Section 2, we introduce a class of CDMs for polytomous data and discuss its relationship with some existing models. In Sections 3 and 4, we introduce the approaches for estimating the parameters of the class of polytomous CDMs and several model fit indices, respectively. Section 5 presents the results of a simulation study, and in Section 6, a real data example is presented, respectively. We conclude the article with a brief summary and a discussion in the last section.
2. General Polytomous CDMs
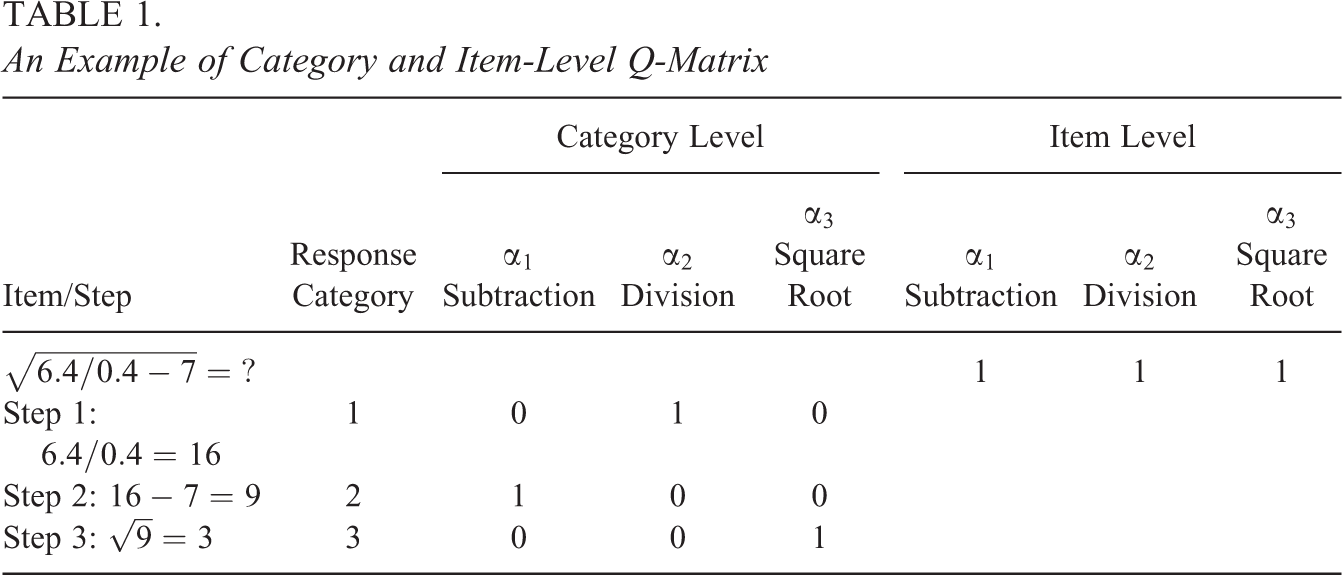
The Q-matrix plays a key role in cognitive diagnosis. The traditional Q-matrix is a
Take
An Example of Category and Item-Level Q-Matrix
2.1. The Proposed Class of Polytomous CDM
Let

where

where
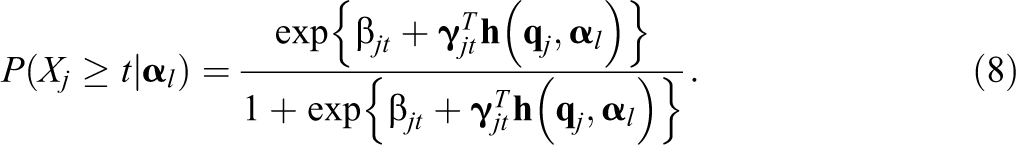
In the proposed CDMs, we consider three different link functions: (1) global logits, (2) local (or adjacent categories) logits, and (3) CR logits. To simplify the model, constraints on the Q-matrix and constraints to the same parameters across categories can be adopted in the proposed CDMs.
Type of link function. Note that under the global, local, and CR logit link functions, Equation 1 can be written as respectively. It should be noted that 


Constraints on the main effects and interactions. First, when an attribute, or a set of attributes, has the same impact on different categories, we could assume that the main effects due to this attribute are equal across all categories and that the interaction effects due to this set of attributes are also equal across all categories. More formally, we assume where W represents the index for main effect or interaction. This constraint, which is referred to as the equality constraint across categories, can substantially decrease the number of parameters of item j.
Constraints on the Q-matrix. Another possible constraint is related to the Q-matrix. The proposed model was defined using a category-level Q-matrix, but as mentioned before, the item-level Q-matrix can be obtained by imposing some constraints on the category-level Q-matrix. An item-level Q-matrix assumes that all the attributes required for the item are required for each category of the item as in By combining the above two constraints, we can obtain four different item parameterizations (see Table 2). Each of them can be combined with the global, local, or continuation ratio logit link functions to obtain different types of CDMs for polytomous responses.
Parameterizations of Different Cognitive Diagnosis Models for Polytomous Data

2.2. Relations With Existing Polytomous CDMs
It can be shown that some existing polytomous CDMs are special cases of the proposed CDMs. First, using the item-level Q-matrix, the proposed CDM with global logit link function can be written as
The category response function for item j can be expressed as

with

subject to the constraints

This model is equivalent to Hansen’s (2013) P-LCDM by imposing some constraints.
Second, using the category-level Q-matrix, the proposed CDM with the CR logit can be expressed as

Let

where

with

Different from the global or cumulative logit, here
Third, using an item-level Q-matrix, the proposed CDM with the local logit link function can be written as

with

When only main effects are considered, the above model is similar to von Davier’s (2005, 2008) GDM for partial-credit data. In addition, R. Liu and Jiang’s (2020) RSDM can also be obtained by imposing appropriate constraints.
It should be noted that in the article, the general formulation
3. Parameter Estimation
Item parameters of the proposed class of CDMs can be estimated using the marginal maximum likelihood estimation approach via the expectation–maximization (MMLE/EM) algorithm. The marginal log-likelihood function of the response matrix can be written as

where

where

Note that

For item j, the M step maximizes the following objective function

using some general optimization algorithms. In this study, the parameter estimation code was written in R software (R Core Team, 2018) using various functions from the G-DINA R package (Ma & de la Torre, 2019b). The E and M steps are repeated until convergence. Note that the prior distribution of attribute patterns was uniform in the first iteration, and then estimated after each iteration, as in de la Torre (2011). After item parameters are obtained via the EM algorithm, we use the expected a posteriori (EAP) method to estimate the examinee parameters.
4. Model Selection
The proposed class of CDMs for polytomous data, subsumes a number of CDMs with different parameterizations. In practice, to determine the most appropriate model, information criteria, such as Akaike’s information criterion (AIC; Akaike, 1974), asymptotically consistent Akaike’s information criterion (CAIC; Bozdogan, 1987), and Bayesian information criterion (BIC; Schwarz, 1978) may be used:


where L is the likelihood based on maximum likelihood estimation (MLE), d refers to the number of parameters under the assumed model, and N is sample size.
5. Simulation Studies
In this section, two simulation studies were carried out to evaluate the feasibility of the proposed models. For notational convenience, in this article, the category-level Q-matrix is referred to as the cat-Q, while the item-level Q-matrix the item-Q. In addition, the CDMs using the item- and category-level Q-matrices are called item- and cat-CDMs, respectively.
Study 1 aims to examine (1) whether the EM algorithm can accurately estimate the parameters of the proposed models and (2) whether using item-level Q-matrix to analyze data generated by category-level Q-matrix will reduce the accuracy of parameter estimation. Study 2 aims to investigate whether the model-data fit indices can be used to select the appropriate CDMs under various simulation conditions. For simplicity, equality constraints across response categories were not imposed in the simulation studies.
5.1. Simulation Study 1
5.1.1. Design
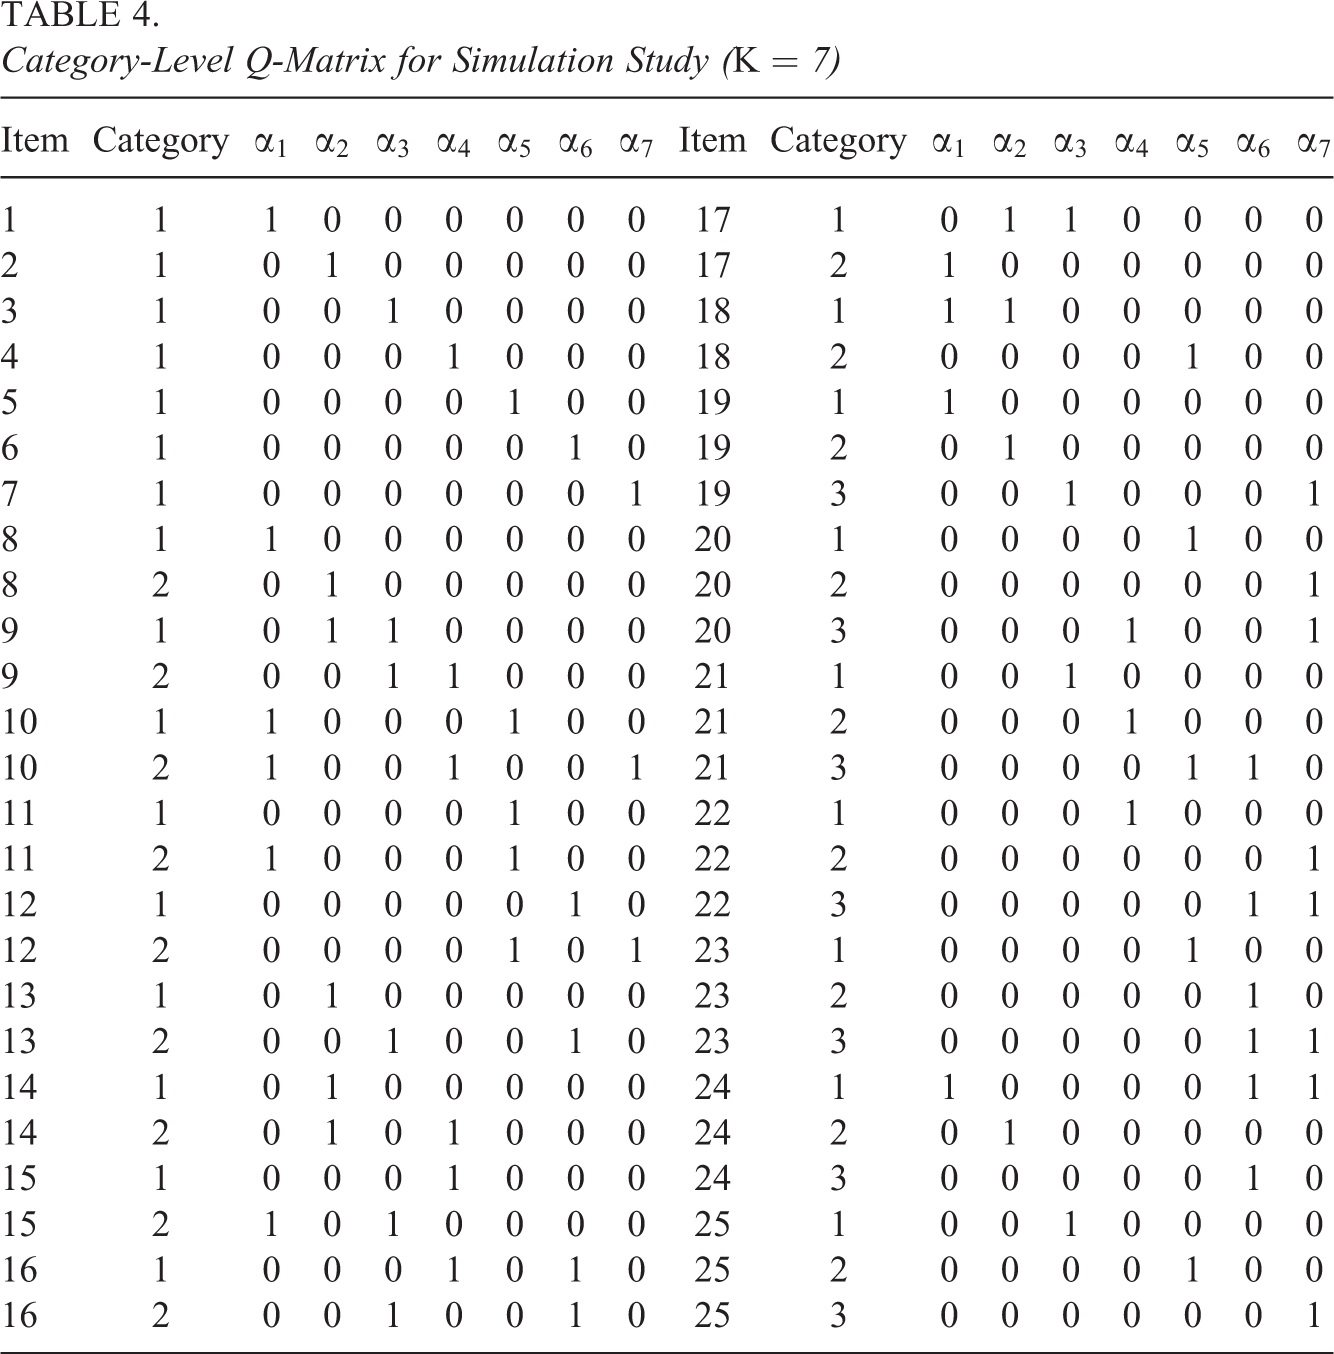
In Study 1, we manipulated the number of attributes, sample size, and link function. Specifically, the number of attributes was set at K = 5 or 7, test lengths were 20 when K = 5, and 25 when K = 7. The link functions included local logit, global logit, and continuation ratio logit (or CR logit). The category-level Q-matrices when K = 5 and 7 are given in Tables 3 and 4, respectively. Each category in the category-level Q-matrix was constrained to measure a maximum of two attributes. Each attribute was measured the same number of times in the test. For a given item, the number of attributes measured by different categories was independent.
The item-level Q-matrix was created from the category-level Q-matrix by assuming all attributes measured by the categories were needed for the item. Four different sample sizes were used (N = 500, 1,000, 2,000, and 4,000 examinees). The attribute profiles of individuals were simulated using the higher order model (de la Torre & Douglas, 2004). The conditional probability of mastering attribute k can be calculated by the following equation

The simulation method is the same as C. Wang (2013), that is, the higher order latent trait and intercept parameters were drawn from the standard normal distribution, and the slope parameters were drawn from the lognormal (0, 1) distribution. Item responses were generated based on the cat-CDMs with three different link functions. Under each condition, 100 data sets were simulated. To calibrate the data, we fitted the CDMs with three link functions using both category-level and item-level Q-matrices.
Category-Level Q-Matrix for Simulation Study (K = 5)

Category-Level Q-Matrix for Simulation Study (K = 7)
For each item, three types of parameters (intercept, main effect, and interaction effect) were randomly drawn from three normal distributions with a common standard deviation of 0.5 and means of −2, 4, and 0, respectively. Given the item parameters, we can calculate the probability of examinees with attribute pattern
5.1.2. Evaluation criteria
The item parameter recovery was evaluated using bias and root mean square error (RMSE) defined as


where J and R are the number of items and replications, respectively, and
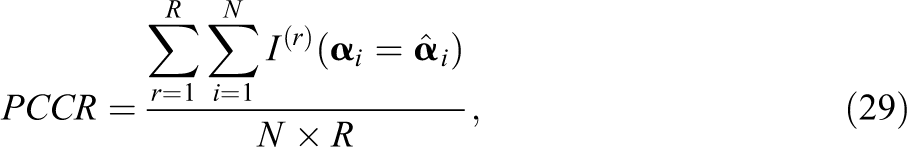
where N and R are the sample size and the number of replications, respectively; are indicator functions; and represent true and estimated attribute profiles, respectively.
5.1.3. Results
Recall that in this simulation study, the data were generated using cat-CDMs with three link functions (local, global, and CR logits) but fitted using both cat-CDMs and item-CDMs. The convergence of model calibration was monitored, and a calibration is said to converge normally when the difference of the negative 2 times log-likelihood values for two consecutive EM iterations was less than .01 and the number of EM iterations is less than 1,000. We found that both cat-CDMs and item-CDMs converged normally for all replications under all simulation conditions.
To evaluate parameter estimation accuracy, we only focus on the results of cat-CDMs. Figures 1 and 2 present the PCCRs of CDMs under varied conditions. When K = 5 and 7, the PCCRs of the cat-CDMs with the local and CR logit link functions were greater than .9 and .85, respectively, while the PCCRs of the cat-CDMs with the global logit link function were above .85 and .76, respectively, regardless of the sample size. Under the same conditions, the PCCRs of CDMs with the global logit were slightly lower than those of the CDMs with local and CR logits. This may be because the model based on the global logit link is more complex compared with the other two link functions. It can also be observed that, as expected, the PCCRs increased as the sample size increased but decreased as the number of attributes increased. In addition, under all conditions, the cat-CDMs produced higher PCCRs than the item-CDMs. For example, when K = 7 and the sample size was 500, the PCCR of the Item-CDM with the local logit was about .84, whereas the PCCR of the cat-CDM under the same condition was about .88.
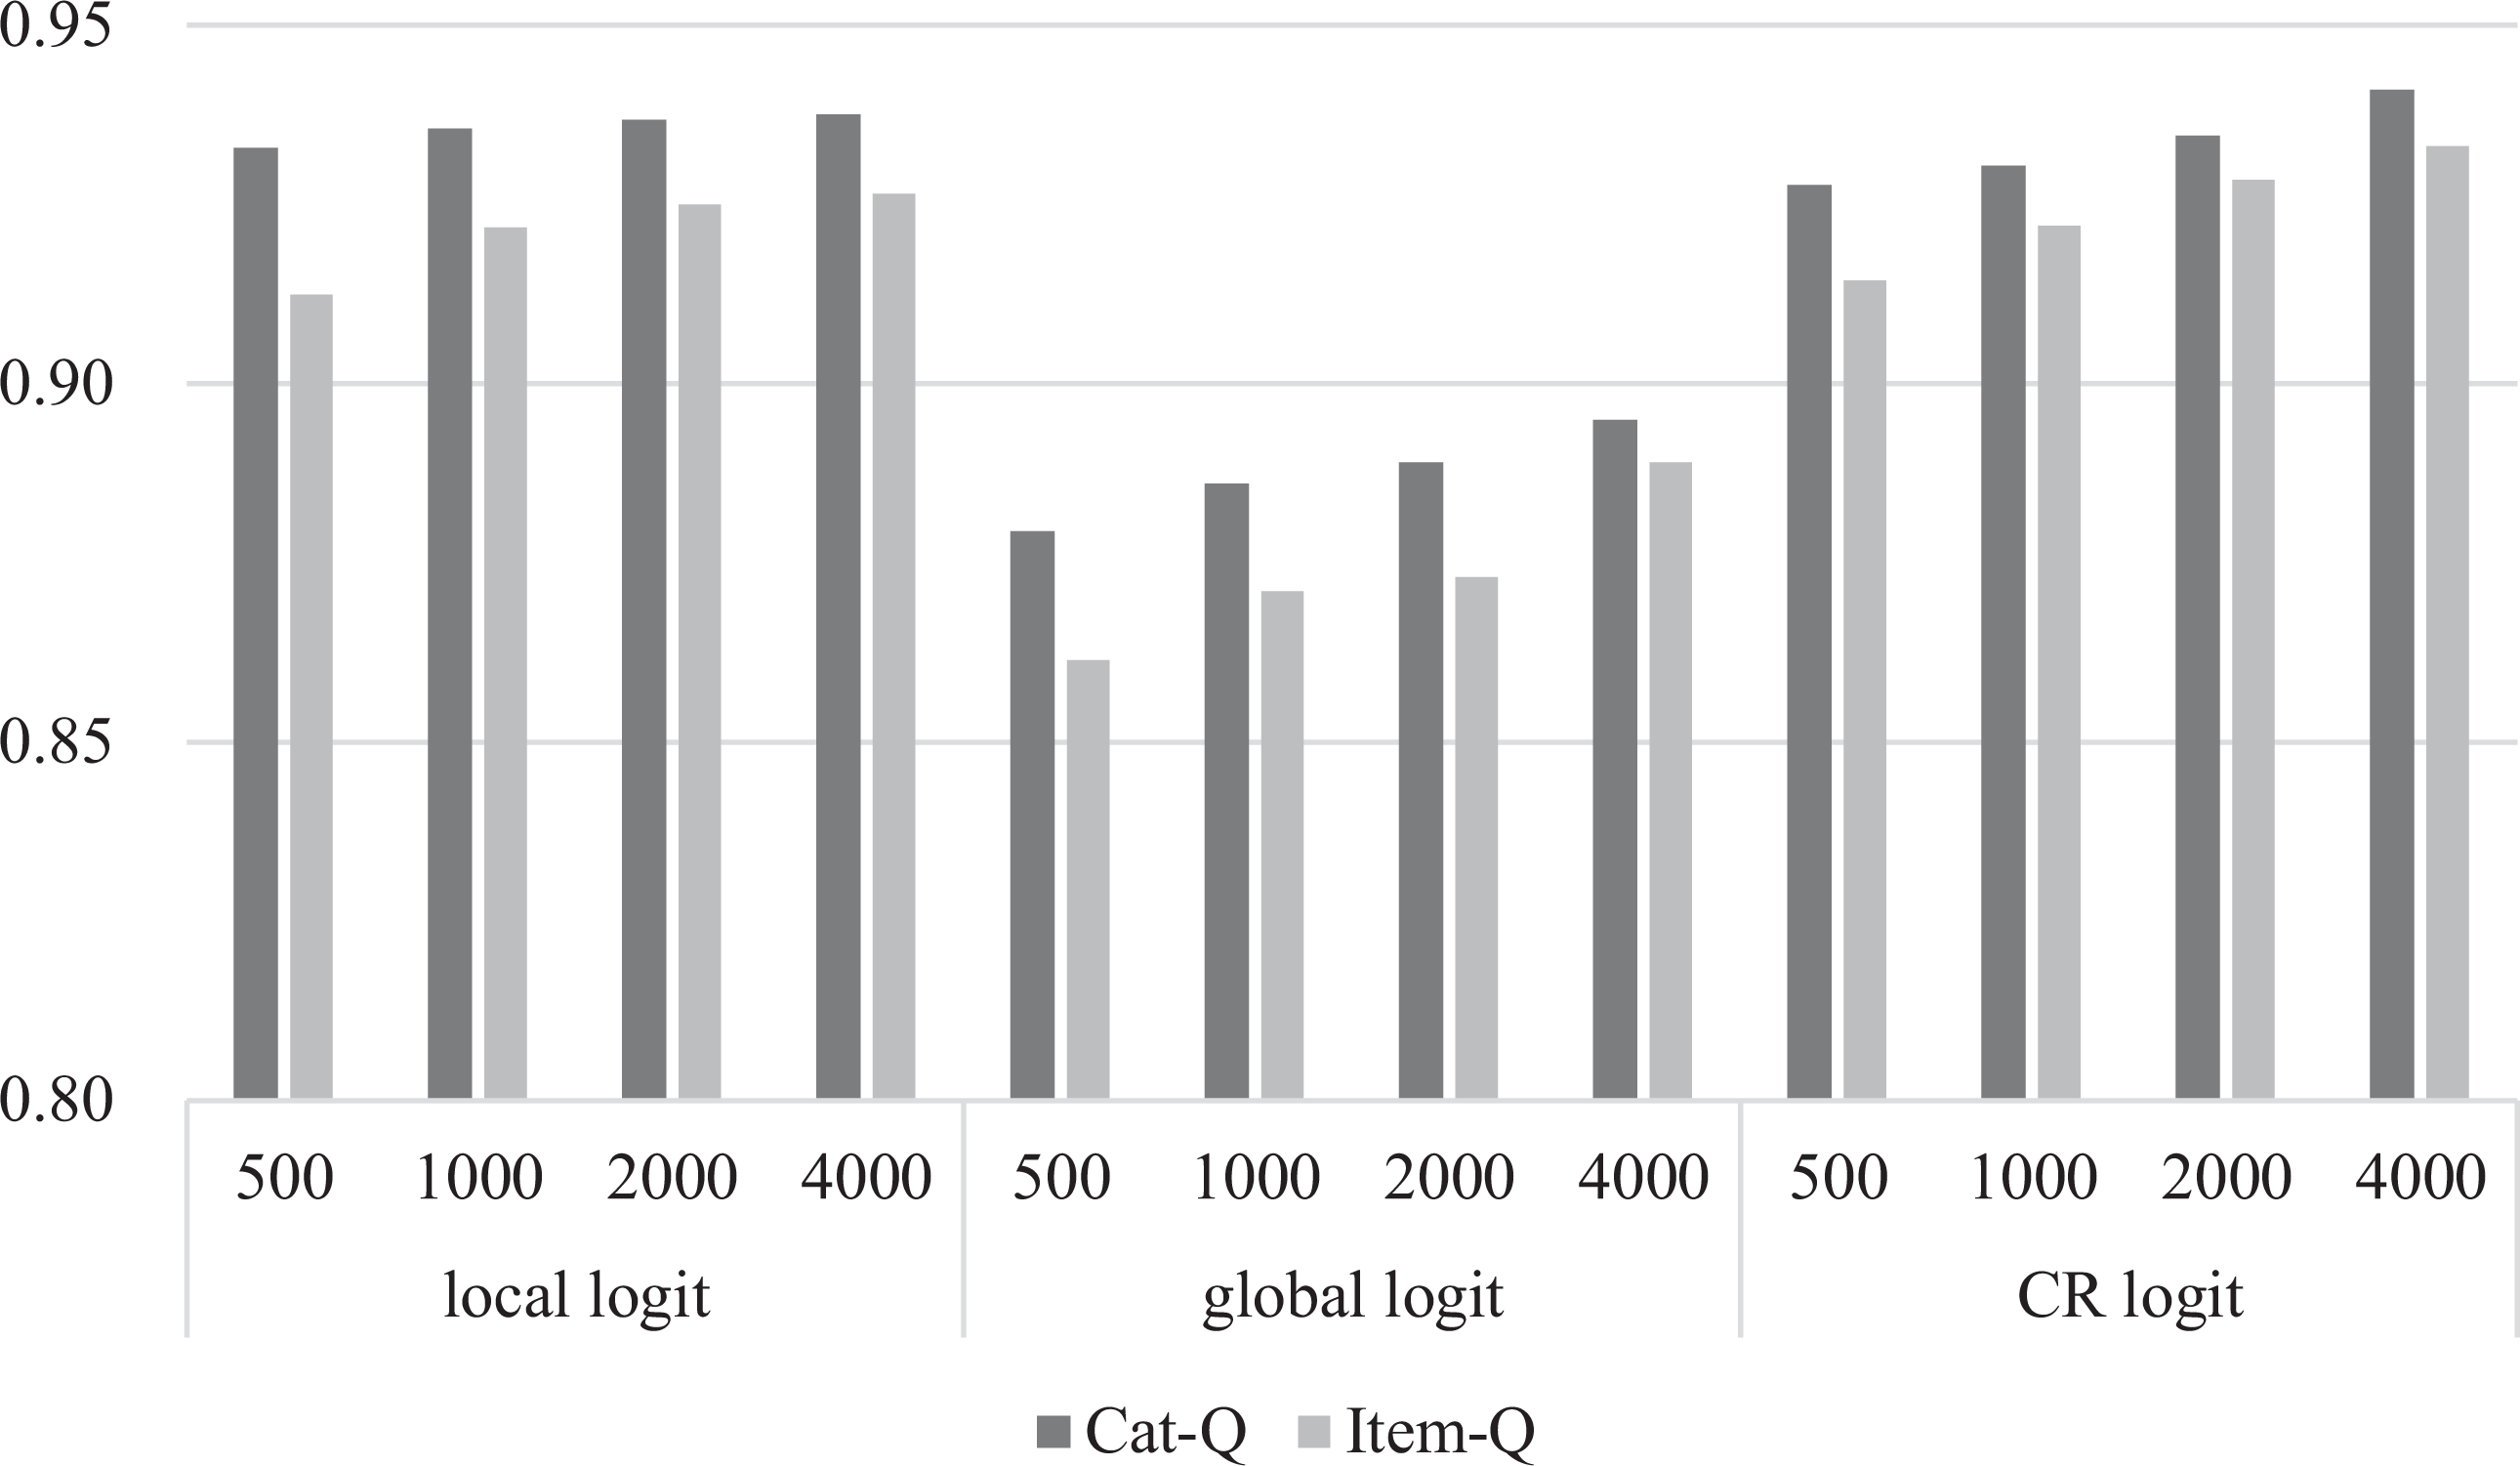
The pattern correct classification rates for K = 5 with various Q-Matrices and test lengths. Note. Item-Q = item level-Q; cat-Q = category level-Q; CR = continuation ratio.
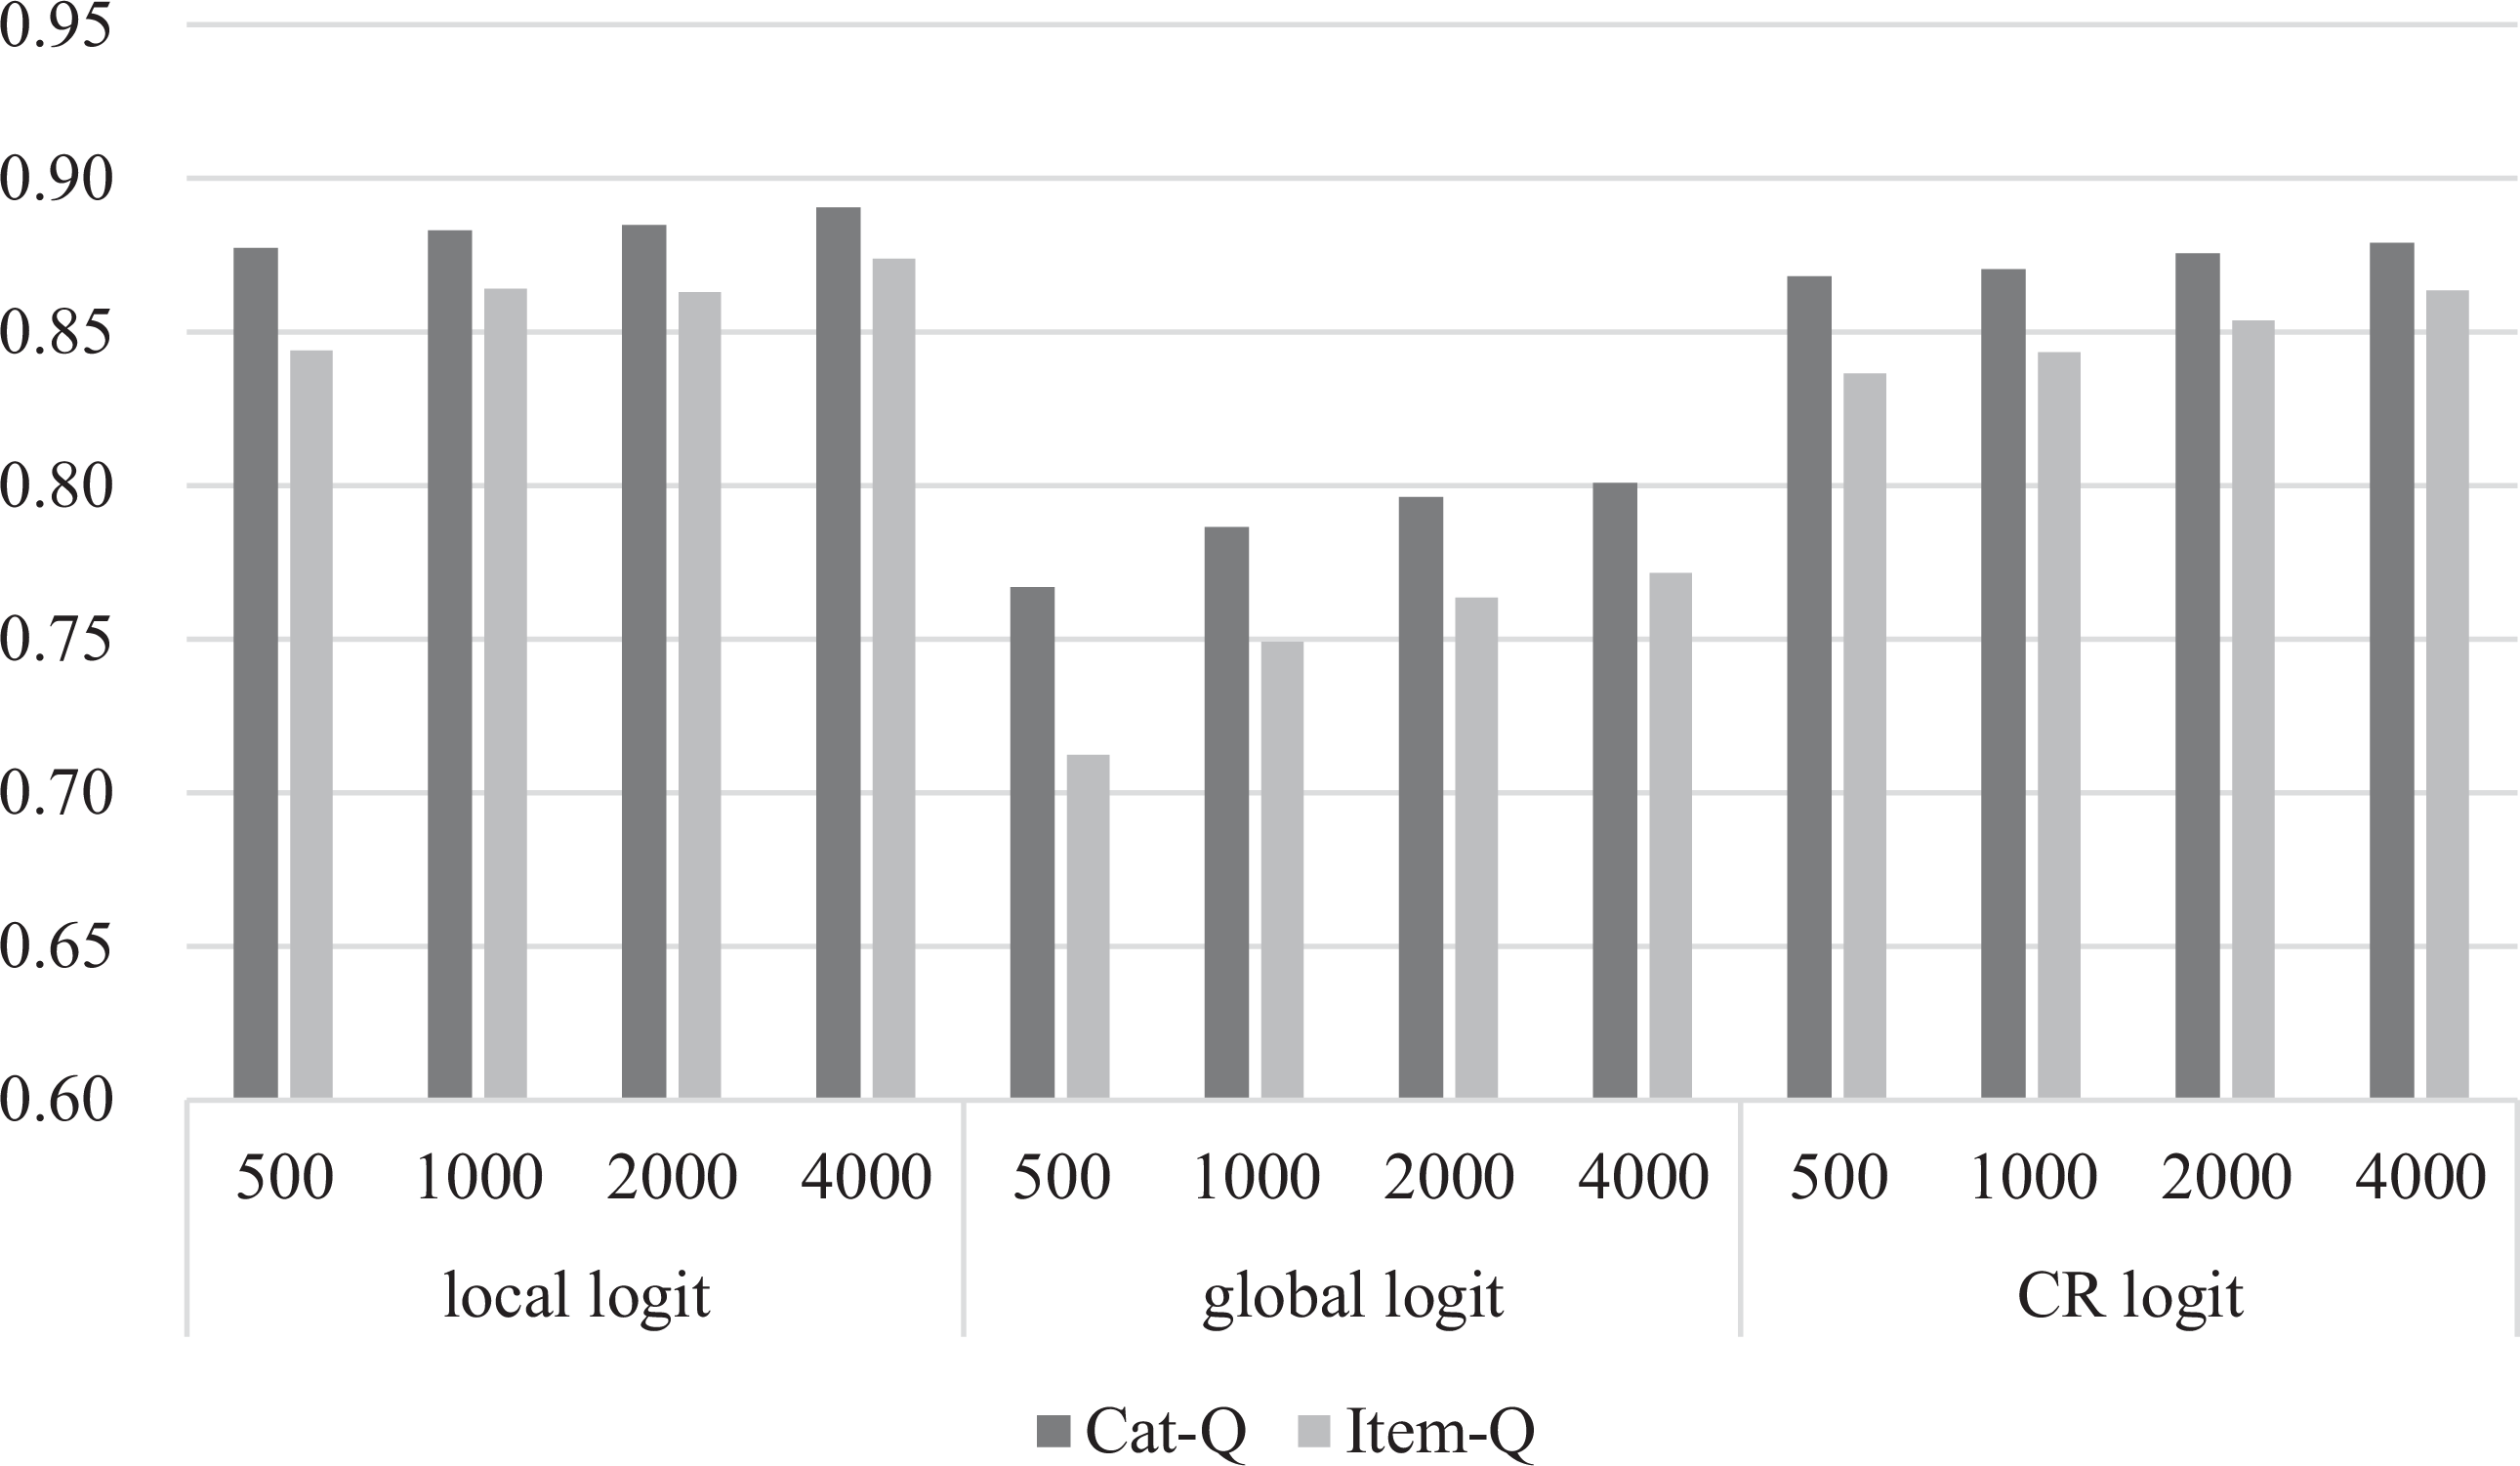
The pattern correct classification rates for K = 7 with various Q-Matrices and test lengths. Note. Item-Q = item level-Q; cat-Q = category level-Q; CR = continuation ratio.
Tables 5 and 6 provide the biases and RMSEs, respectively, when K = 5, and Tables 7 and 8 summarize these results when K = 7. The results in Tables 5 through 8 showed that the intercept and main effect parameters can be more accurately estimated with lower biases and RMSEs than the interaction effects, which is consistent with the findings of Jiang and Ma (2018). The accuracy of the item parameter estimation was improved with the increase of sample size. In addition, the cat-CDMs provided higher estimation accuracy for item parameters (with lower biases and RMSEs) than the item-CDMs. This is because, in general, item-CDMs involve more item parameters than cat-CDMs. For example, under the local logit link function, when K = 5, the cat-CDM had 131 item parameters but the item-CDM had 273 item parameters.
Biases of Item Parameter Estimates When K = 5
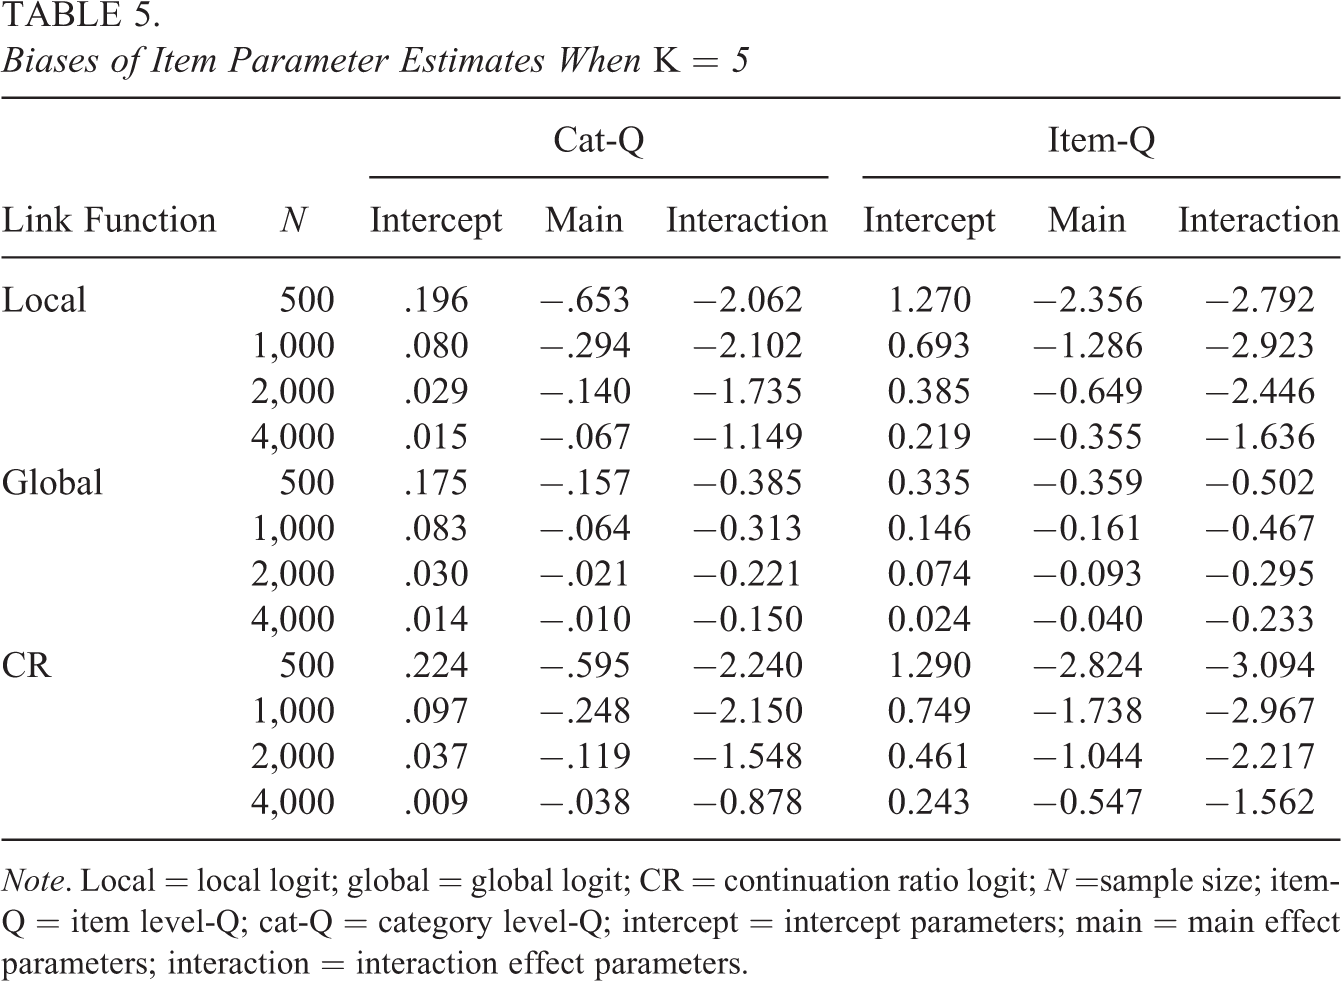
Note. Local = local logit; global = global logit; CR = continuation ratio logit; N =sample size; item-Q = item level-Q; cat-Q = category level-Q; intercept = intercept parameters; main = main effect parameters; interaction = interaction effect parameters.
RMSE Values for Simulation Study (K = 5)
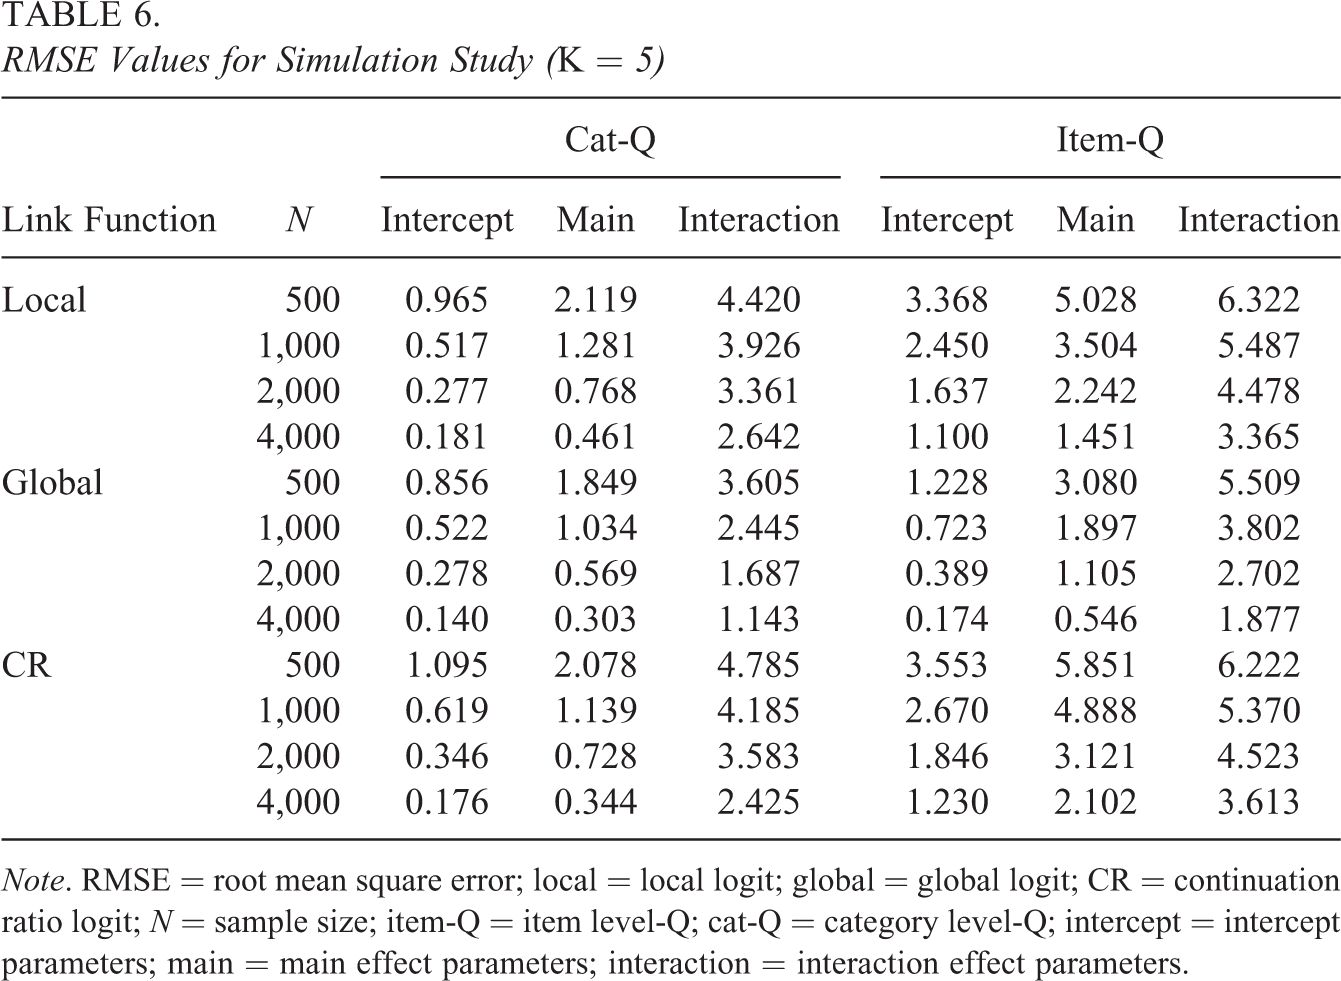
Note. RMSE = root mean square error; local = local logit; global = global logit; CR = continuation ratio logit; N = sample size; item-Q = item level-Q; cat-Q = category level-Q; intercept = intercept parameters; main = main effect parameters; interaction = interaction effect parameters.
Bias Values for Simulation Study (K = 7)
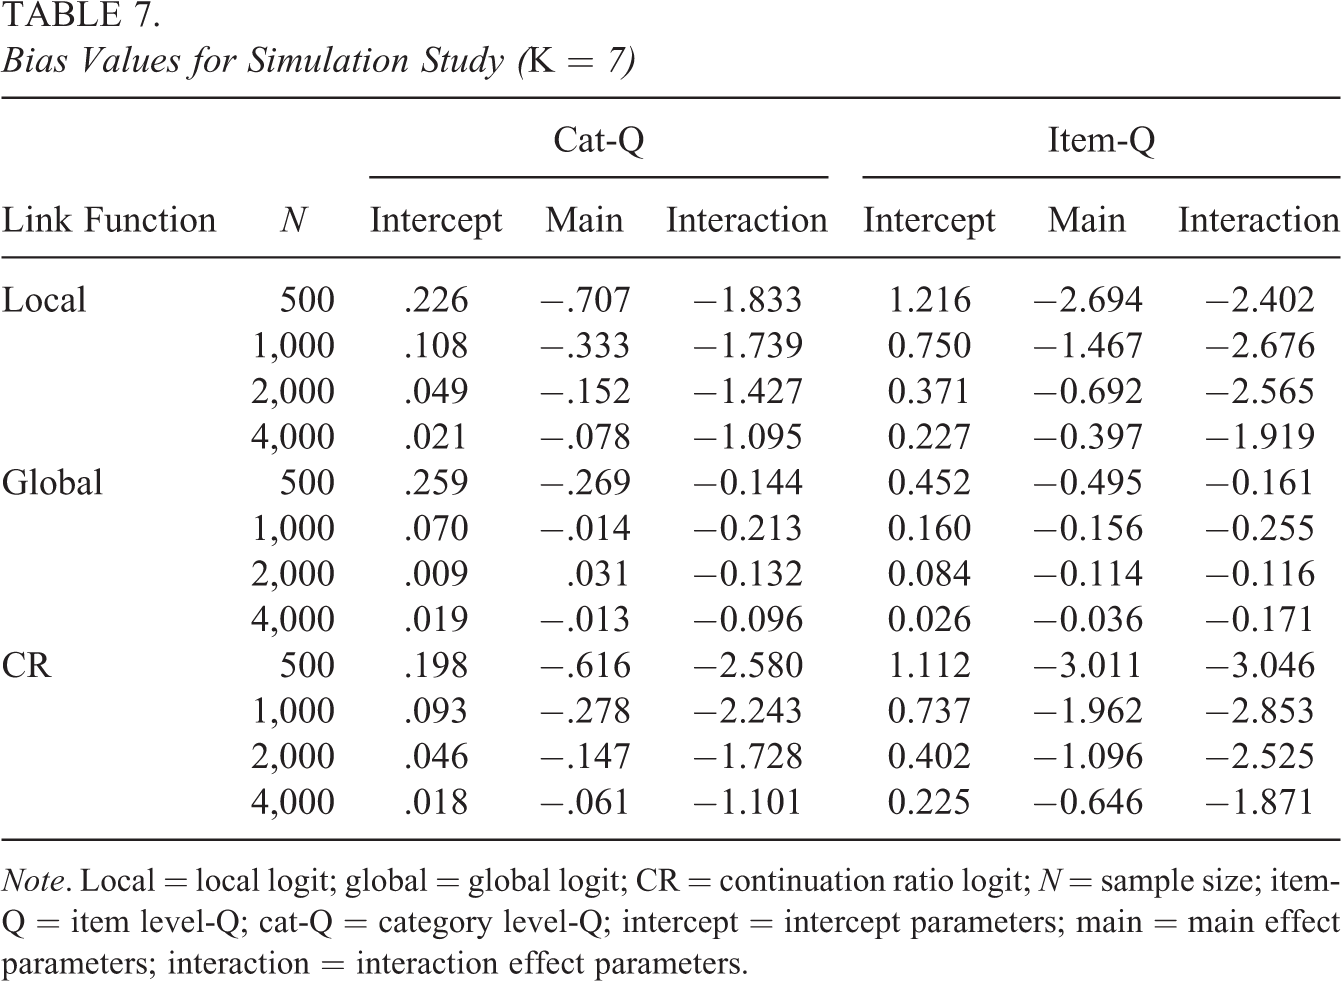
Note. Local = local logit; global = global logit; CR = continuation ratio logit; N = sample size; item-Q = item level-Q; cat-Q = category level-Q; intercept = intercept parameters; main = main effect parameters; interaction = interaction effect parameters.
RMSE Values for Simulation Study (K = 7)

Note. RMSE = root mean square error; local = local logit; global = global logit; CR = continuation ratio logit; N = sample size; item-Q = item level-Q; cat-Q = category level-Q; intercept = intercept parameters; main = main effect parameters; interaction = interaction effect parameters.
In conclusion, the results of Simulation Study 1 showed that (1) item and examinee parameters can be recovered reasonably well based on the MMLE/EM algorithm; (2) cat-CDMs always had higher estimation accuracy for both item and examinee parameters than item-CDMs. This is mainly due to the fact that the cat-CDMs define the attributes required for each category, which provides additional information and helps improve the estimation accuracy of item and examinee parameters; and (3) as sample size increased, the estimation accuracy of item and respondent parameters improved.
5.2. Simulation Study 2
5.2.1. Design
The purpose of Study 2 was to evaluate the performance of the model-data fit indices in selecting appropriate link functions for the model. These factors were manipulated in the simulation study: sample size (500, 1,000, 2,000, and 4,000) and link functions (local, global, and CR logits). The number of attributes was fixed to K = 5. The Q-matrix, the generation of attribute profiles, and item parameters were the same as Study 1. Under each condition, 100 data sets were generated. When the cat-CDMs were used to generate the data, the cat-CDMs were also used to fit the data. Table 9 presented the data generation and fitting methods in Study 2. The proportion of times that the generating (or true) models were selected was used to evaluate the performance of the model fit indices.
5.2.2. Results
Table 10 gives the proportion of times that the cat-CDMs were chosen by different relative fit indices when data were generated using the cat-CDMs.
The Method of Generating and Fitted Data in Study 2
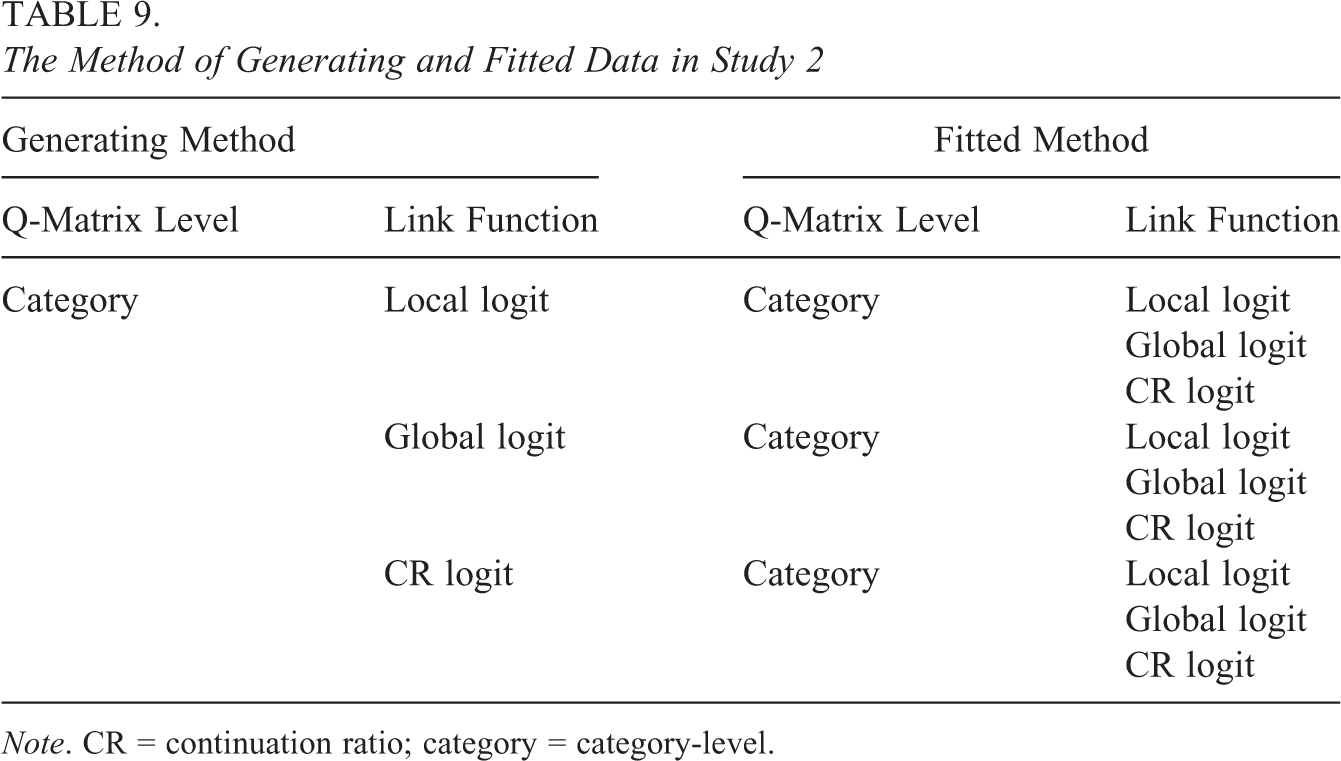
Note. CR = continuation ratio; category = category-level.
Proportion of Selecting Generating Cat-CDMs
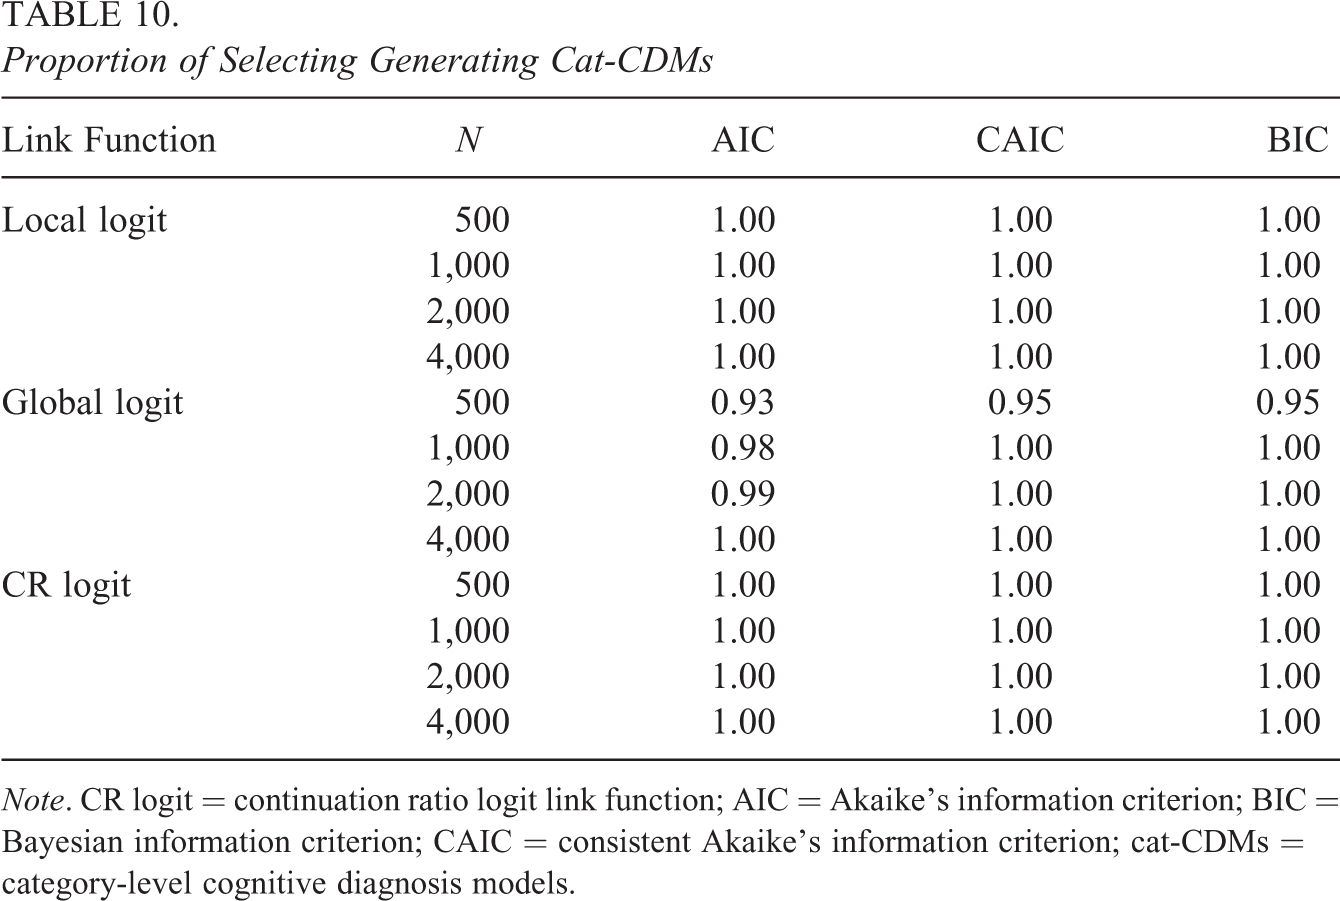
Note. CR logit = continuation ratio logit link function; AIC = Akaike’s information criterion; BIC = Bayesian information criterion; CAIC = consistent Akaike’s information criterion; cat-CDMs = category-level cognitive diagnosis models.
As shown in Table 10, when the generating model had CR logit or local logit, regardless of the sample size, the AIC, CAIC, and BIC always selected the generating model. When the generating model had global logit link function, under the condition of N = 500, the proportion of the AIC, CAIC, and BIC selecting the generating model was 93%, 95%, and 95%, respectively; for these indexes, the proportion of selecting the generating model increased as the sample size increased. For example, when N = 4,000, these indexes always selected the generating model.
6. Real Data Analysis
6.1. Data
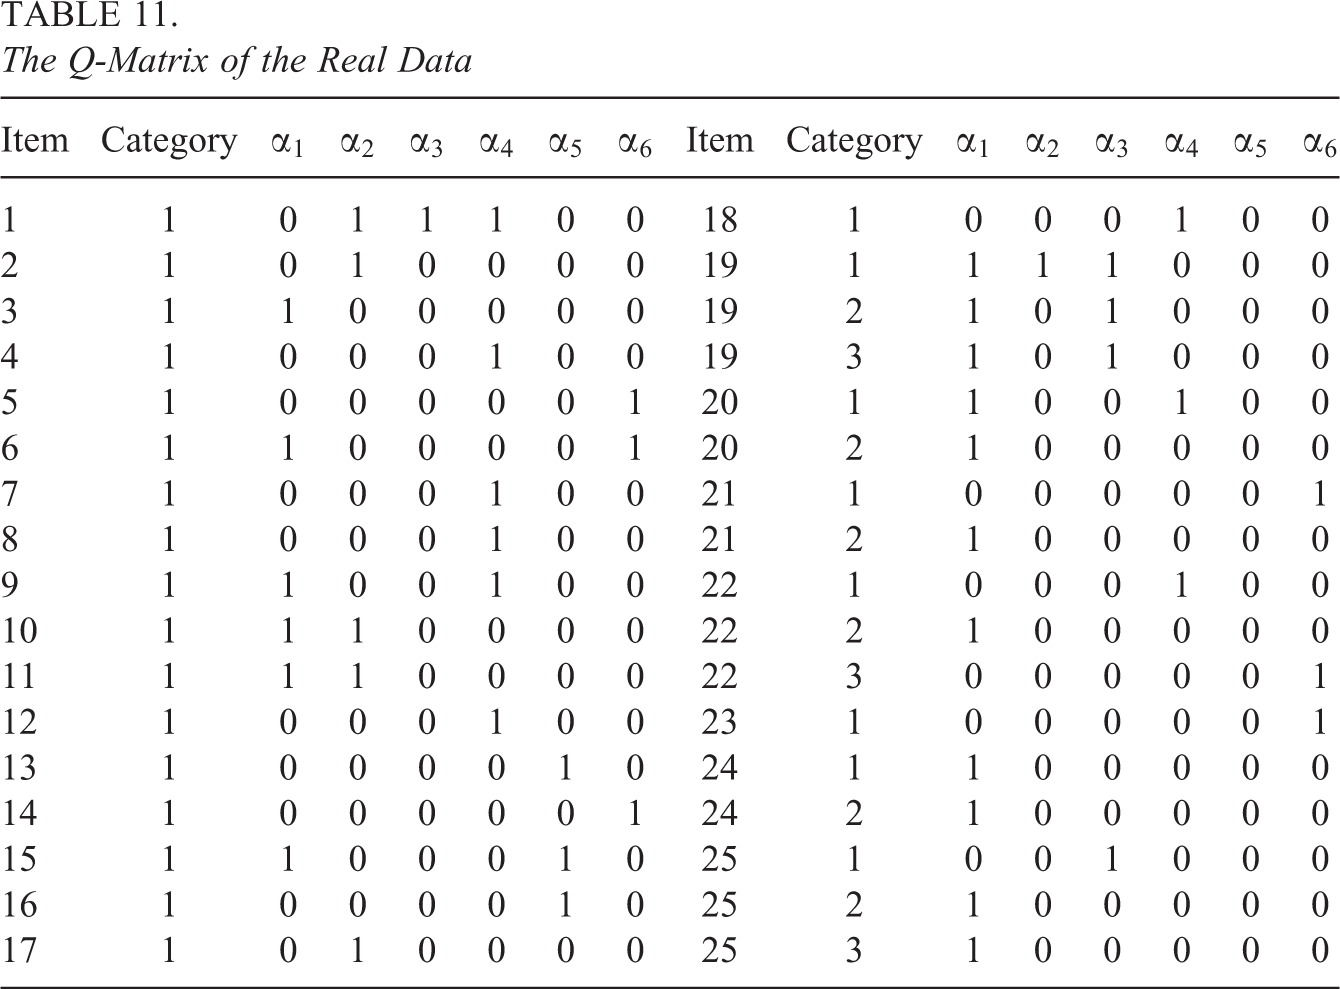
In this section, a real data analysis was conducted to illustrate the application of the proposed class of polytomous CDMs. The data consist of responses of 516 Chinese eighth-grade students to 25 items of a mathematics diagnostic test. Of 25 items, there are 6 polytomous items and 19 dichotomous items. Six attributes are measured by the test, namely, (
The Q-Matrix of the Real Data
6.2. Analysis and Results
In this analysis, the proposed class of polytomous CDMs was used to analyze the real data and the model fit indices were calculated. The results are shown in Table 12. It can be observed that the cat-CDM with the CR logit and equality constraints across categories had the smallest values of the BIC and CAIC and, therefore, had a better model fit.
The Results of Test-Level Fit
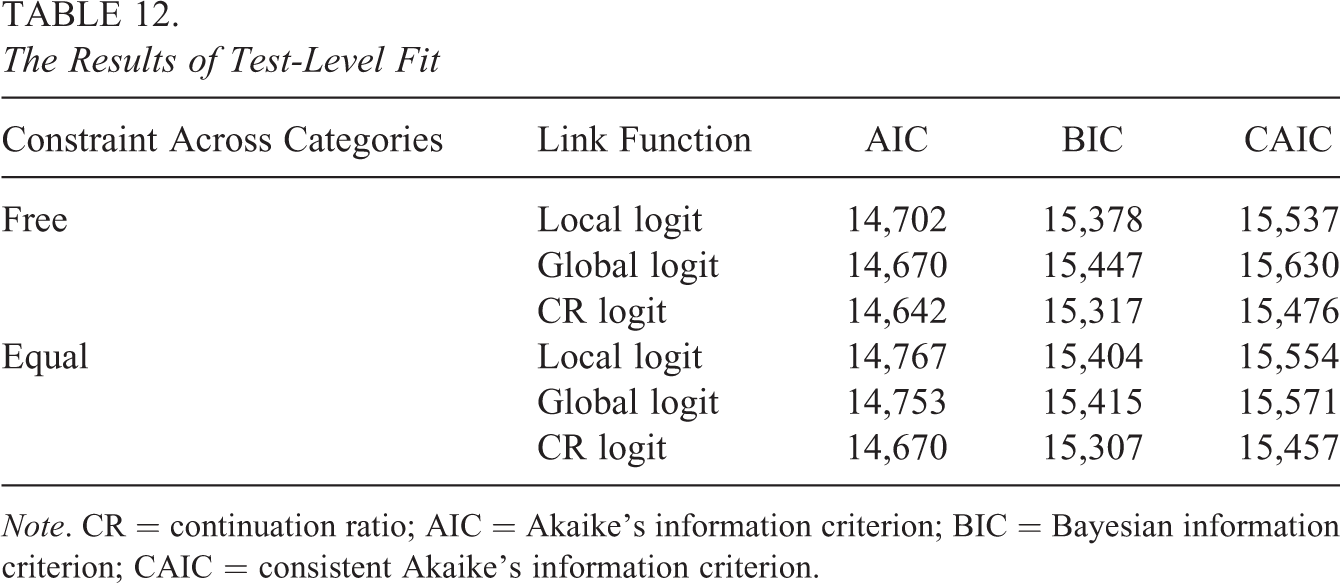
Note. CR = continuation ratio; AIC = Akaike’s information criterion; BIC = Bayesian information criterion; CAIC = consistent Akaike’s information criterion.
The results of relative model fit at test level indicated that the model with CR logit, cat-Q, and equality constraints across categories may be the most appropriate for analyzing the empirical data. However, it is still unclear whether it can fit data adequately in an absolute sense. To answer this question, the differences in observed and model-implied Fisher’s z-transformed Pearson correlations between all pairs of items were calculated. The differences were then divided by their corresponding standard errors, resulting in test statistics conforming to standard normal distribution (Chen et al., 2013). Table 13 shows the p value of the maximum test statistic associated with each item. Note that the p values were adjusted using Bonferroni method because 24 hypothesis tests were conducted for each item. It can be observed that the adjusted p values were greater than .05 for all items, indicating that the model had a good fit at the item level. Therefore, the analyses below were based on the model with CR logit and equality constraints across categories.
The Results of Item-Level Fit
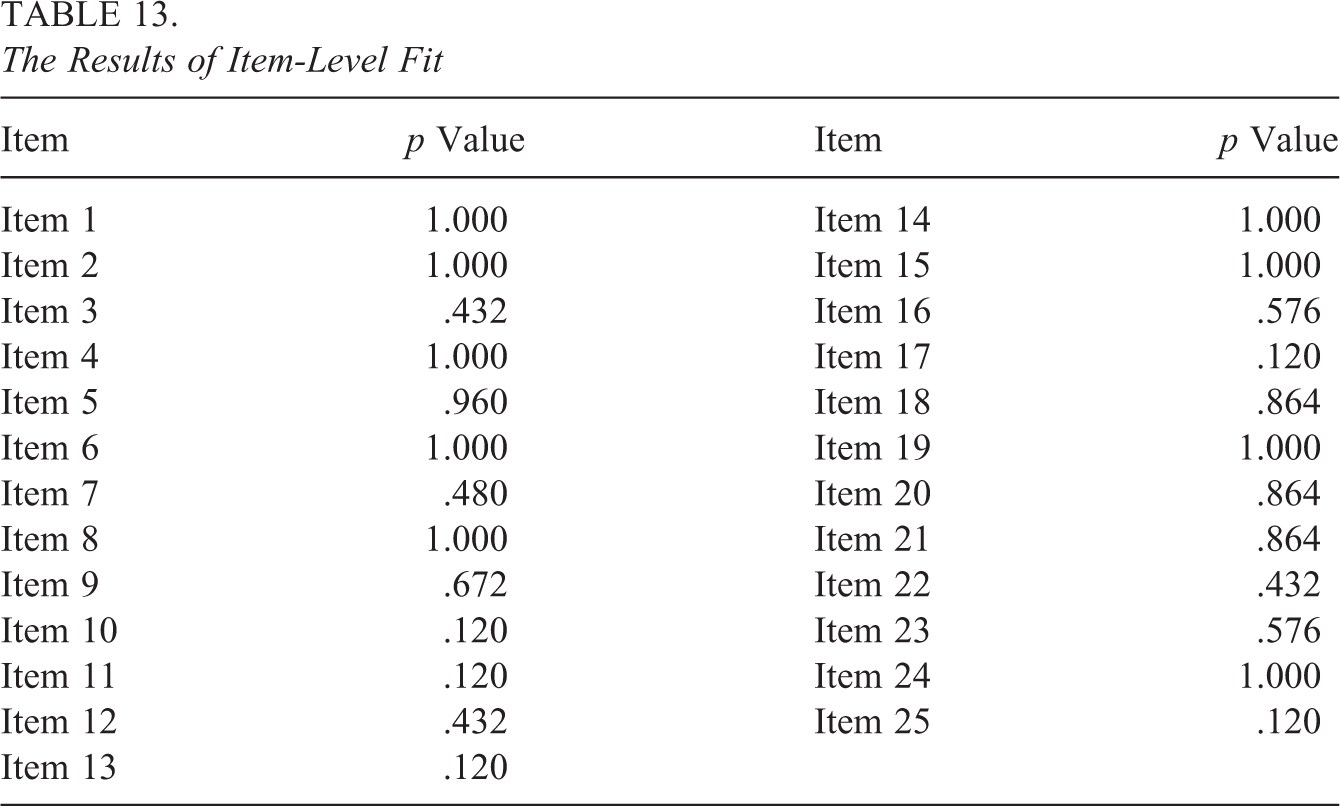
Table 14 summarizes the attribute-level classification consistency indices using the estimator of Johnson and Sinharay (2018). The classification consistency index is used as an important indicator of the reliability of CDA tests (Cui et al., 2012; W. Wang et al., 2015). For the cat-CDM with CR logit and equality constraints across categories, the classification consistency of six attributes ranged from .883 to .924, with the average classification consistency value of .892. Johnson and Sinharay (2018) suggested a very good reliability range of .8–.9 when reporting a single reliability indicator of skill level. This result showed that the selected model had very good reliability on each attribute.
The Classification Consistency for Each Attribute
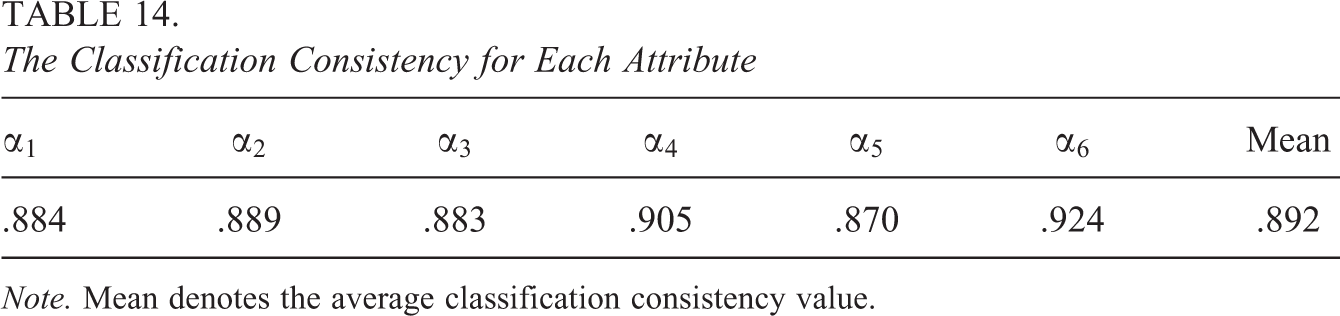
Note. Mean denotes the average classification consistency value.
Table 15 gives the average mastery percentages of students in each attribute. As the results show, for each attribute, at least 45% of the students had mastered it, with
Mean of Students’ Mastery Percentages Across Six Attributes
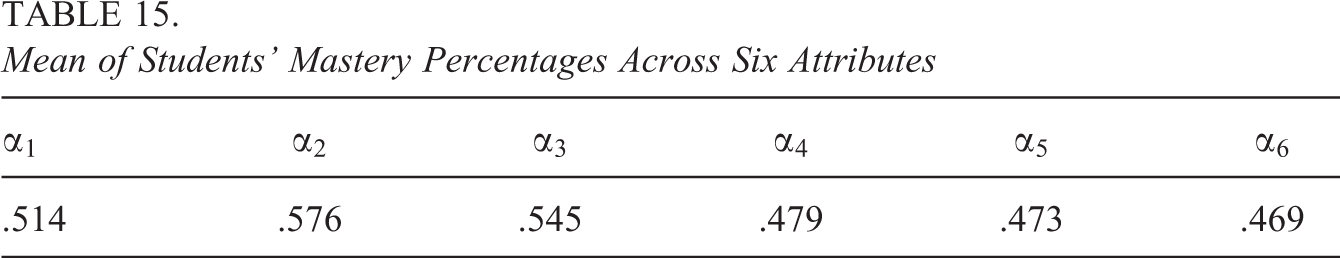
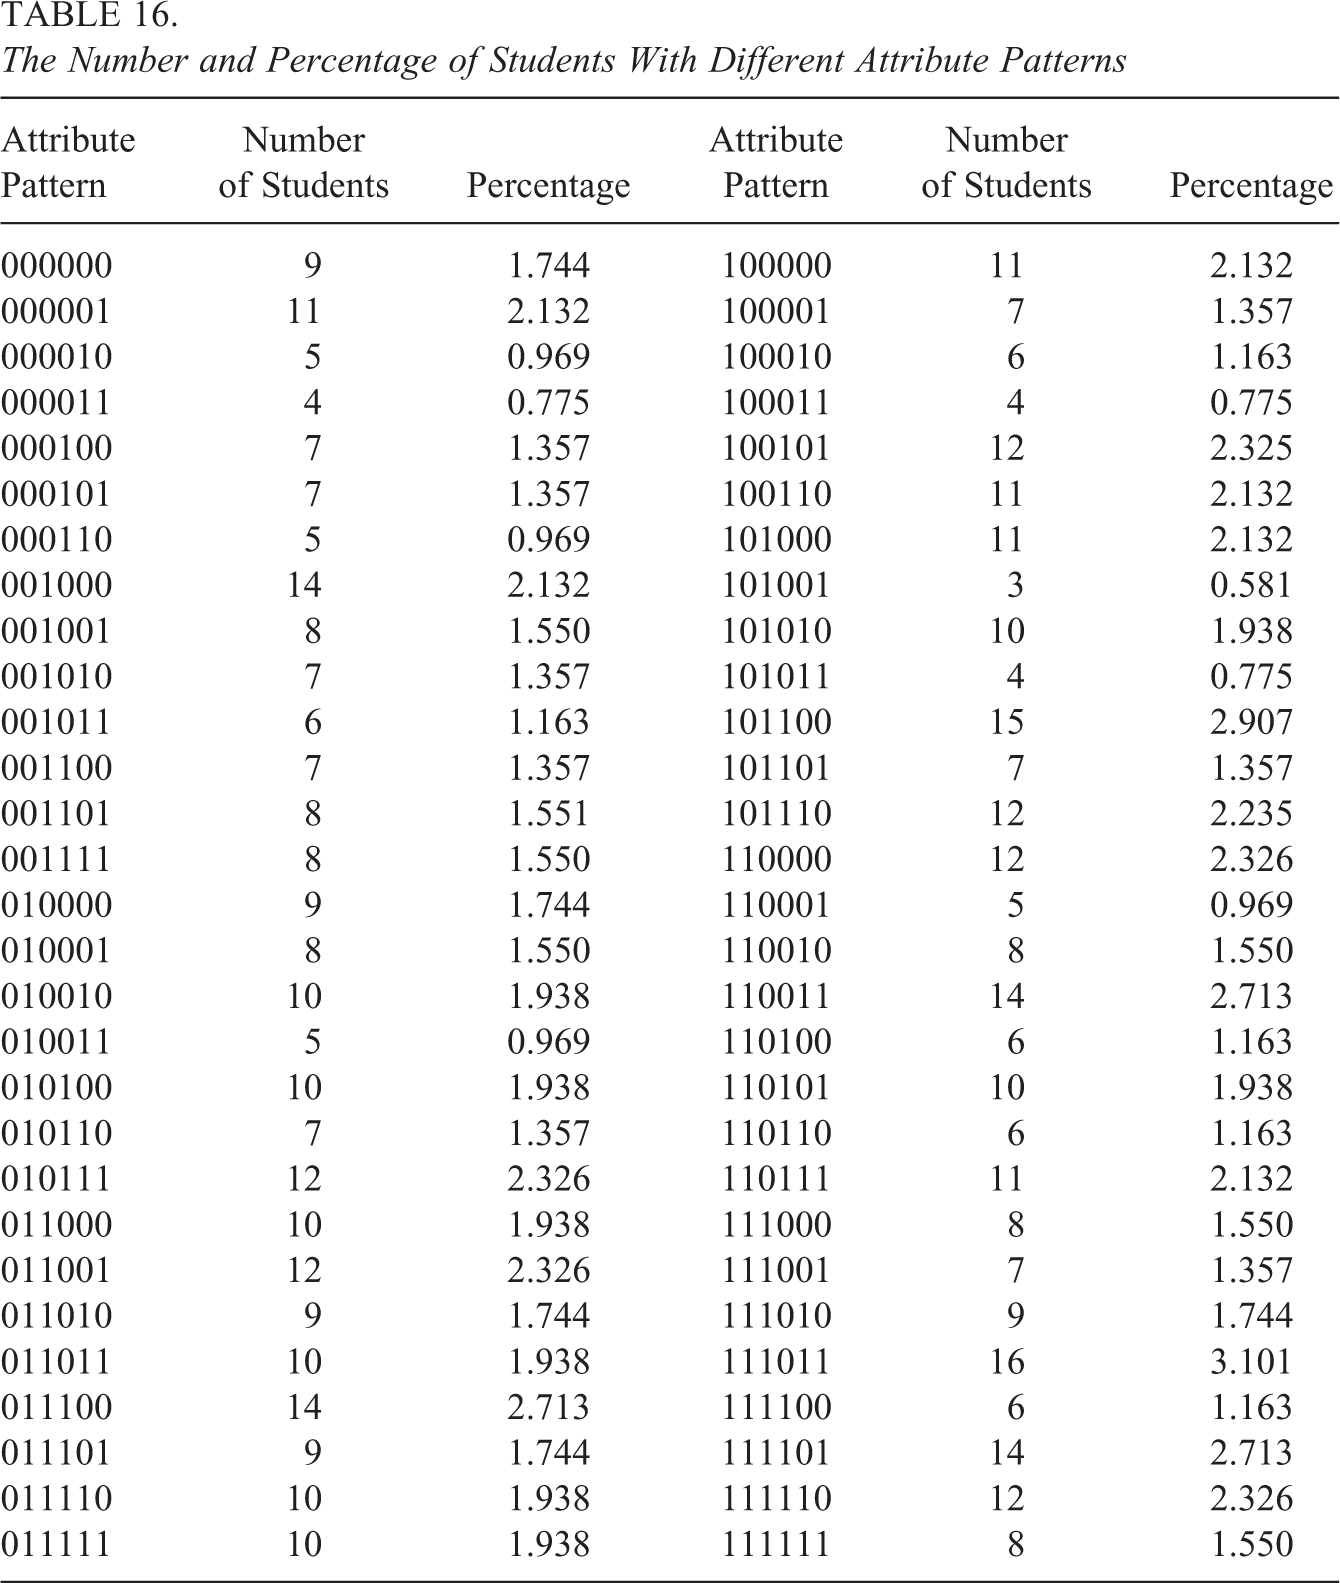
Table 16 presents the number and percentage of students in different attribute patterns. The results in Table 16 showed that the attribute patterns of the 516 students were included in 58 attribute patterns. The proportion of students who only mastered one or fewer attributes was about 12%. The percentage of those who mastered two attributes was about 22%. The majority (more than 65%) of the students mastered at least three attributes.
The Number and Percentage of Students With Different Attribute Patterns
7. Discussion
In this article, we proposed a class of polytomous CDMs for polytomous items with different link functions and various constraints on Q-matrix and item parameters. The proposed CDM for polytomous response is very general and subsume several commonly used polytomous CDMs including the P-LCDM (Hansen, 2013), the sequential G-DINA model (Ma & de la Torre, 2016), and RSDM (R. Liu & Jiang, 2020). The proposed models can also help us understand the relation of existing models. In particular, some existing models, such as the P-LCDM and sequential G-DINA model, are closely related with the only difference in the use of link functions. This article also developed the MLE procedure for estimating model parameters, which could be used for some existing models that were subsumed by the developed model and that were originally proposed to be estimated using Markov chain Monte Carlo (MCMC) method such as the RSDM (R. Liu & Jiang, 2020). Despite some advantages, MCMC tends to be slow and the MLE estimation based on the proposed models could be particularly useful in practice.
The simulation results indicated that the EM algorithm can be used to adequately estimate model parameters under varied conditions. The simulations studies also showed that the structure of Q-matrix was an important factor affecting the estimation accuracy. For example, under the same simulation condition, the cat-CDMs produced higher item and person parameters estimation accuracy than the item-CDMs. This is mainly because the category-level Q-matrix defines the relationship between attributes and response categories and thus provides additional information to aid the parameter estimation. This also suggests that identifying the association between attributes and categories when developing polytomously scored items for cognitive diagnosis assessment could be useful. In addition, this article carried out a simulation study to investigate the performance of several model fit indices in selecting appropriate model under different sample sizes and generating models. According to the simulation study, for data generated using the cat-CDMs with the global link function, the AIC, CAIC, and BIC did not always select the correct model when the sample size was small (e.g., 500).
Although the results are promising, several future directions of research can be identified to unlock the potential of these proposed polytomous CDMs. First, some constraints on the Q-matrix design need to be further studied. This study assumed that the Q-matrix is correctly specified. However, in practice, this assumption is not always satisfied. Some existing studies had shown that the Q-matrix misspecifications would reduce the accuracy of item and person parameter estimation (Kunina-Habenicht et al., 2012; Lei & Li, 2016). Therefore, it is worth examining how the proposed polytomous CDMs perform when Q-matrix is misspecified. The current study did not model the relation between attributes, but, in practice, attributes may have different hierarchical structures such as linear, convergent, divergent, and mixed structure. In order to get a more general conclusion, future research should consider these factors.
Second, the same model was fit to all polytomous items in a single test in this study, though, theoretically, researchers do not have to do so, given that the model we proposed is defined at item level and that it is possible to specify different models for different items. The practical challenge, however, is how to determine the most appropriate model for each item. Ostini and Nering (2006) emphasized that data characteristics should be first considered (p. 91). For example, if the problem-solving process is sequential (this might be evaluated by domain experts), the continuation ratio model appears the natural choice. In addition to data characteristics, the evaluation of model-data fit at item level can provide valuable information for model selection. Currently, most studies on item-level model-data fit measures focused on dichotomous data (e.g., de la Torre & Lee, 2013; Y. Liu et al., 2016; Ma et al., 2016; Sorrel et al., 2017; C. Wang et al., 2015). An exception is Ma and de la Torre (2019a), which examined the performance of the Wald statistic in selecting the most appropriate models under the sequential G-DINA model, but it is still unclear how the Wald statistic can be used to determine the best link functions based on the proposed models. Future research could explore how models should be selected at the item level.
Finally, the proposed polytomous CDMs are confirmatory in nature, given that the Q-matrix is assumed to be known a priori. In contrast, some exploratory diagnostic models for polytomous response have been developed recently (e.g., Culpepper, 2019; Fang et al., 2019). An advantage of the exploratory diagnostic models is that they do not require prior knowledge of the underlying structure and provide a framework for researchers to infer the underlying structure and item response process simultaneously (Culpepper, 2019). Future research can explore how confirmatory and exploratory CDMs could be used together to better analyze the data from diagnostic assessments. In addition, although a set of CDMs is developed, the conditions for ensuring model identifiability are still unclear. Culpepper (2019) and Fang et al. (2019) discussed the identifiability conditions for some general CDMs, but further investigation is needed to shed more light on the connection between their findings and the proposed models.
Footnotes
Declaration of Conflicting Interests
The author(s) declared no potential conflicts of interest with respect to the research, authorship, and/or publication of this article.
Funding
The author(s) disclosed receipt of the following financial support for the research, authorship, and/or publication of this article: Humanities and Social Science Research Projects in Colleges and Universities in Guizhou Province (grant ID: 2020QN018), National Natural Science Foundation of China (31660278, 31760288, 31960186), and Guizhou Normal University’s 2019 PhD Research Startup Project (GZNUD[2019] No. 27).