
Abstract
Solving a constructed-response item usually requires successfully performing a sequence of tasks. Each task could involve different attributes, and those required attributes may be “condensed” in various ways to produce the responses. The sequential generalized deterministic input noisy “and” gate model is a general cognitive diagnosis model (CDM) for graded response items of this type. Although a host of dichotomous CDMs with different condensation rules can be used to parameterize the success probability of each task, specifying the most appropriate one remains challenging. If the CDM specified for each task is not in accordance with the underlying cognitive processes, the validity of the inference could be questionable. This study aims to evaluate whether several hypothesis tests, namely, the Wald test using various variance–covariance matrices, the likelihood ratio (LR) test, and the LR test using approximated parameters, can be used to select the appropriate CDMs for each task of graded response items. Simulation studies are conducted to examine the Type I error and power of the hypothesis tests under varied conditions. A data set from the Trends in International Mathematics and Science Study 2007 mathematics assessment is analyzed as an illustration.
Cognitive diagnosis models (CDMs) have attracted considerable attention recently in the field of educational measurement. CDMs are multidimensional models with the intention of uncovering individuals’ mastery profiles on a set of skills or attributes from their observed item responses. The attributes are typically, although not always, represented by binary latent variables with 1 for mastery and 0 for nonmastery.
To make inference about students’ attribute profiles, a number of CDMs have been developed (for reviews, see DiBello, Roussos, & Stout, 2007). To understand these models, the condensation rule (Maris, 1999) is critical. The condensation rule defines the way that attributes interact to produce an observed item response. For example, based on a conjunctive condensation rule, the deterministic inputs, noisy “and” (DINA) gate (Haertel, 1989) model, assumes that individuals are expected to have low probabilities of performing an item correctly unless they master all required attributes. In contrast, based on the disjunctive condensation rule, the deterministic inputs, noisy “or” (DINO) gate (Templin & Henson, 2006) model assumes that mastering at least one required attribute could yield a high success probability. The additive CDM (A-CDM; de la Torre, 2011), which has an additive condensation rule, assumes that each required attribute contributes to the success probability independently and uniquely. Aside from these specific models, researchers have developed some general CDM frameworks. Examples are the generalized DINA (G-DINA; de la Torre, 2011) model, the log-linear CDM (LCDM; Henson, Templin, & Willse, 2009), and the general diagnostic model (von Davier, 2008). Note that the G-DINA model and LCDM consider all main effects of latent variables and all possible interactions among them. By setting appropriate constraints, specific models with conjunctive, disjunctive, or additive condensation rules can be obtained as special cases.
Specifying the condensation rule for each item is largely based on experts’ judgment and thus could be subjective. A misspecification in the condensation rules produces the use of inappropriate CDMs, which then results in a model-data misfit (Kunina-Habenicht, Rupp, & Wilhelm, 2012; Y. Liu, Tian, & Xin, 2016) and could call into question the validity of inferences. For example, Rojas, de la Torre, and Olea (2012) have shown that fitting the conjunctive model to the data generated from the disjunctive model, or vice versa, can lead to poor attribute estimation. With the development of the general CDMs, some may argue that the general models should be preferred to the reduced models, such as the DINA model, DINO model, and A-CDM because they can provide better model-data fit in terms of the likelihood. However, as noted by W. Ma, Iaconangelo, and de la Torre (2016), the reduced models may still be more appropriate for several reasons. For example, the reduced CDMs usually have more straightforward interpretations because of the corresponding condensation rules. In addition, due to fewer item parameters involved, the reduced models need a smaller sample for accurate parameter estimation. Lastly, W. Ma et al. (2016) have found that the appropriate reduced models can provide better person attribute estimation than the saturated models, especially when the sample size is small.
As emphasized by von Davier (2014), it is important to consider other alternatives prior to committing to using one particular model. A few studies along this line can be found in literature. For example, Chen, de la Torre, and Zhang (2013); Henson, Templin, and Willse (2009); and Sinharay and Almond (2007) evaluated and compared different models using Akaike’s (1974) information criterion (AIC), Schwarz’s (1978) Bayesian information criterion (BIC), and deviance information criterion (Spiegelhalter, Best, Carlin, & Van Der Linde, 2002) at the test level. A limitation of model comparison at the test level is that all items are typically assumed to conform to the same model, which, most likely, is not the case in practice.
At the item level, Henson et al. (2009) provided a way to determine the appropriate reduced model by visual inspection of the estimates of LCDM, and Sinharay and Almond (2007) checked the item fit plots generated from a residual analysis. In addition, de la Torre (2011) proposed to use the Wald test (Wald, 1943) to evaluate whether the reduced models subsumed by the G-DINA model can be used in place of the saturated G-DINA model without a significant loss in model-data fit. The Type I error and power of the Wald test for comparing the G-DINA model and the DINA model, DINO model and A-CDM were examined by de la Torre and Lee (2013), and the performance of the Wald test in comparing the G-DINA model with the logistic linear model (Maris, 1999) and reduced reparameterized unified model (Hartz, 2002) was later investigated by W. Ma et al. (2016). Although the model selected by the Wald test can provide better person classification, the Type I error rates of the Wald test are found to be inflated, especially when sample size is small or item quality is low (de la Torre & Lee, 2013; W. Ma et al., 2016). One possible cause is that the population proportion parameters were ignored when calculating the covariance matrix. Philipp, Strobl, de la Torre, and Zeileis (2018) found that the item parameter standard errors were underestimated when the population proportion parameters were ignored. Another possible cause is that all aforementioned studies estimated the covariance matrix using the outer product of the gradient (OPG) method, which has been shown less accurate for item response models when sample size is small (Chalmers, Pek, & Liu, 2017; Paek & Cai, 2014). One alternative way of estimating covariance matrix is developed by Louis (1982), who showed that the covariance matrix can be obtained using the code for expectation–maximization (EM) algorithm directly. Another alternative is the so-called sandwich-type estimator (White, 1982), which, unlike the OPG and Louis’s estimators, is shown to be consistent under misspecified models (e.g., White, 1982; Yuan, Cheng, & Patton, 2014).
To date, research on model comparison, or condensation rule selection, mainly focuses on dichotomous responses data. In this article, we consider polytomously scored items that can be decomposed into a series of tasks. Items of this type are not uncommon, especially, in educational assessments. For example, when introducing the popular partial credit model (PCM), Masters (1982) took
This study aims to evaluate the performance of the Wald test using various covariance matrices and the likelihood ratio (LR) test in selecting appropriate condensation rules for the graded response items based on the sequential G-DINA model. Specifically, the OPG, Louis’s, and sandwich covariance estimators are considered for the Wald test. It should be noted that this is not the first work investigating the sandwich-type covariance estimator in CDMs. Under the LCDM framework, Y. Liu, Xin, Andersson, and Tian (2018) evaluated the performance of covariance estimator based on the observed information matrix and sandwich-type estimator, which is based on the observed and OPG information matrices, using the dcminfo R package (Y. Liu & Xin, 2017). Based on these information matrices, Xin, Liu, Tian, and Li (2017) examined the performance of the Wald test for item-level model selection. However, the observed information matrix involves second derivatives of the log likelihood with respect to all model parameters, which are difficult to calculate analytically. In contrast, current study employs Louis’s (1982) approach that tends to be easier to obtain when the EM algorithm is used for model estimation. In addition to the Wald test, this study considers the LR test for condensation rule selection to reduce the impact of covariance matrix estimations. Investigating condensation rule selection procedures for the sequential G-DINA model has the potential to advance the use of constructed-response items in cognitively diagnostic assessments. In addition, since the dichotomous G-DINA model is a special case of the sequential G-DINA model, the findings in this study have important implications about the performance of these procedures under the G-DINA model for dichotomous response data. The remainder of this article is laid out as follows. The second section provides an overview of the sequential G-DINA model. In the third section, we introduce how the LR test and Wald test are used for condensation rule selection. The fourth section describes in detail a simulation study for evaluating the Type I error and power of the LR test and Wald test under varied conditions. Then, a set of data from Trends in International Mathematics and Science Study (TIMSS) 2007 mathematics assessment was analyzed to illustrate how the Wald and LR tests can be used in practice. We conclude the sixth section with a brief summary of this study and a discussion of directions for future research.
Overview of the Sequential G-DINA Model
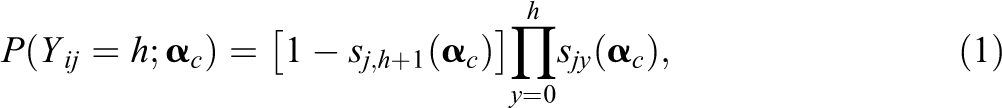
Suppose a test measuring K attributes has J items. Also, suppose that item j consists of Hj tasks that need to be undertaken sequentially and yields Hj + 1 response categories (i.e., category 0, 1, …, Hj). Specifically, a student gets a score of 0 if she or he fails the first task, and a score of h (h > 0) if she or he performs the first h tasks successfully, but fails task h + 1 if task h is not the last task. Because task h is related to response category h directly, we use them interchangeably in this article. A binary q-vector
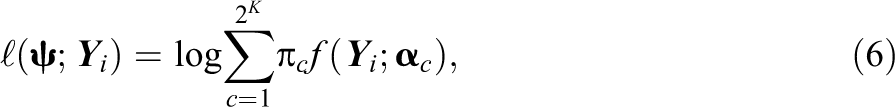
The sequential G-DINA model (W. Ma & de la Torre, 2016) assumes that solving an item involves undertaking a sequence of tasks and that individuals cannot complete a task unless they have already performed the previous task successfully. Let
where
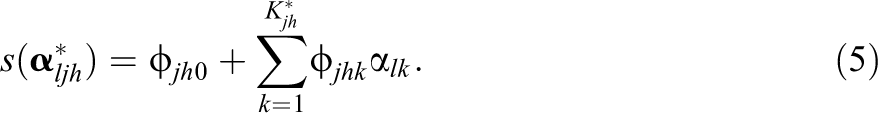
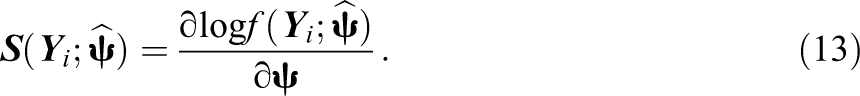
For task h of item j, let

where
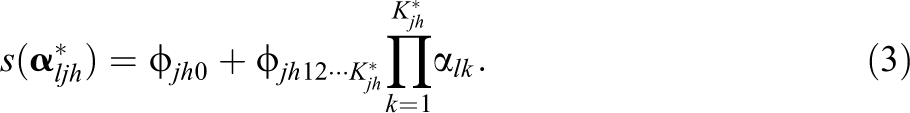
The processing function based on the DINO model is given by

where
Category-Level Model Comparison
If a response category only requires one attribute, the G-DINA model and other reduced CDMs (e.g., DINA model, DINO model, and A-CDM) are not distinguishable, which implies that all condensation rules are equivalent. Therefore, model comparison is only necessary for categories requiring two or more attributes, which are referred to as multiattribute categories.
LR Test
Let
where
In this study, the LR test is conducted category by category and item by item. For the augmented model, the G-DINA model is used as the processing functions for all categories of all items, whereas for the compact model, the G-DINA model is used as the processing functions for all categories except the studied category, for which a reduced model is used as the processing function. The augmented model only needs to be calibrated once. Given that the reduced models to be tested for each category in this study include the DINA model, DINO model, and A-CDM, the data need to be calibrated
The LR test could be time-consuming, and thus we also consider an EM-based approximation, which is referred to as two-step LR test, similar to the implementation in Sorrel, de la Torre, Abad, and Olea (2017). Specifically, the processing functions under a reduced model are estimated using a one-step EM algorithm based on the estimates under the G-DINA processing functions directly without recalibrating the data. When the DINA or DINO model is used as the processing function, some reduced latent groups are equivalent in that they have the same processing function. We use a vector of length
where
When the processing function is the A-CDM, the following log-likelihood function is maximized for a studied category while the processing functions of other categories are hold constant,
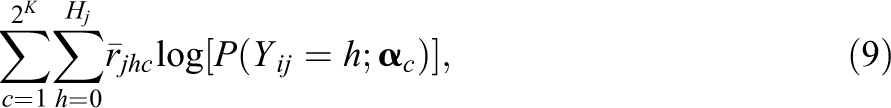
where
The Wald Test
To use the Wald test to examine whether a reduced model can be used in place of the G-DINA model as the processing function for a multiattribute category, category h of item j, a
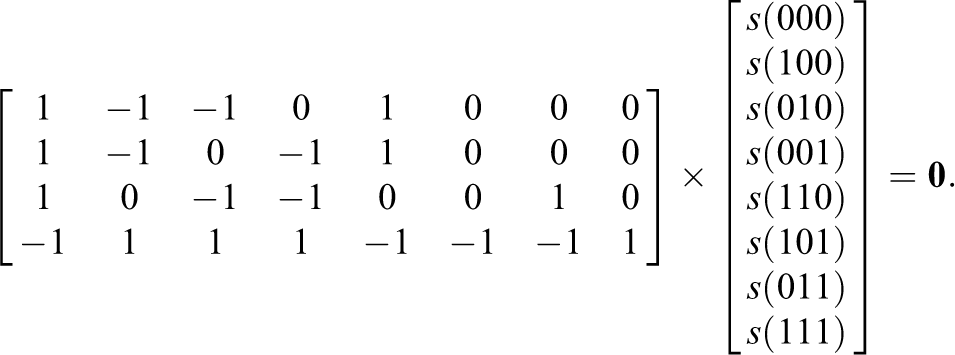
Examples of the restriction matrices for the DINA and DINO models can be found in de la Torre and Lee (2013). The Wald statistic can be calculated as

where
An accurate estimation of the covariance matrix of the processing functions is critical for the Wald test. The covariance matrix of model parameters can be obtained by inverting the observed information matrix, which is defined as
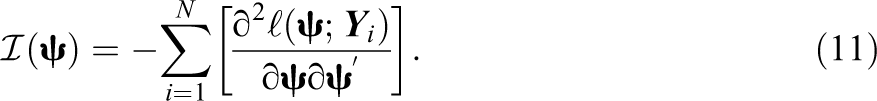
The observed information as defined in Equation 11 is typically hard to evaluate because of the second-order partial derivatives of the log-likelihood function; and therefore, in practice, it is often approximated by
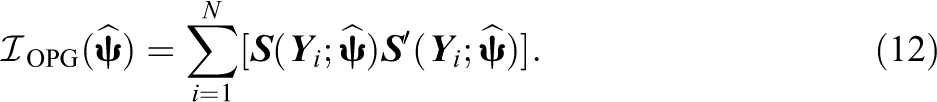
where, with details given in Appendix A,
The information matrix
In addition to the OPG approximation, Louis (1982) gives an expression to estimate the observed information matrix using the complete and missing information matrices from the EM algorithm directly. Let
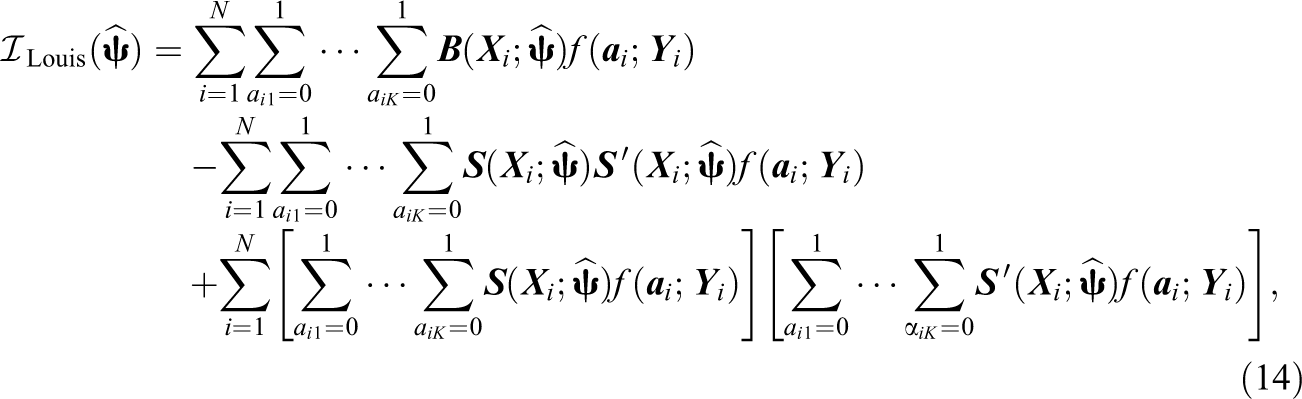
where

The covariance matrix based on the OPG approximation and Louis’s estimator can be written as

Apart from various ways of estimating the covariance matrix, it is still questionable that what parameters need to be considered in the approximation of the observed information matrix for CDMs. In practice, only item parameters are typically of interest, and therefore, some previous studies (e.g., de la Torre, 2008) calculate the covariance matrix of item parameters by inverting the OPG information matrix for each item separately or, equivalently, by inverting a block diagonal information matrix for all items. Based on this, the Wald test has been shown to produce inflated Type I error rates under some conditions for model comparison and differential item functioning detection for dichotomous response data (de la Torre & Lee, 2013; Hou, de la Torre, & Nandakumar, 2014; W. Ma et al., 2016). Philipp et al. (2018) found that standard errors based on the complete OPG information matrix that considers both item and proportion parameters were more accurate. Despite the superiority, the complete information matrix could be too large to be manageable in that its size increases exponentially with the number of attributes. For example, when there are 15 attributes as in Lee, Park, and Taylan (2011), the complete information matrix is larger than 32,768 × 32,768, which may be problematic when calculating the inverse. Philipp et al. (2018) also examined the incomplete OPG information, which is a full matrix and considers only item parameters, and found that corresponding standard errors tended to be slightly underestimated. However, it is not clear whether the Wald test will be influenced. Therefore, in this study, we also consider estimating covariance matrix using only item parameters. The corresponding OPG, Louis, and sandwich-type estimators are denoted as
Simulation Study
The goal of this simulation study is to systematically evaluate the performance of the LR tests and the Wald test using different information matrices for category-level model selection in the context of the sequential G-DINA model. The Type I error and power of these statistical tests were examined under varied conditions.
Design
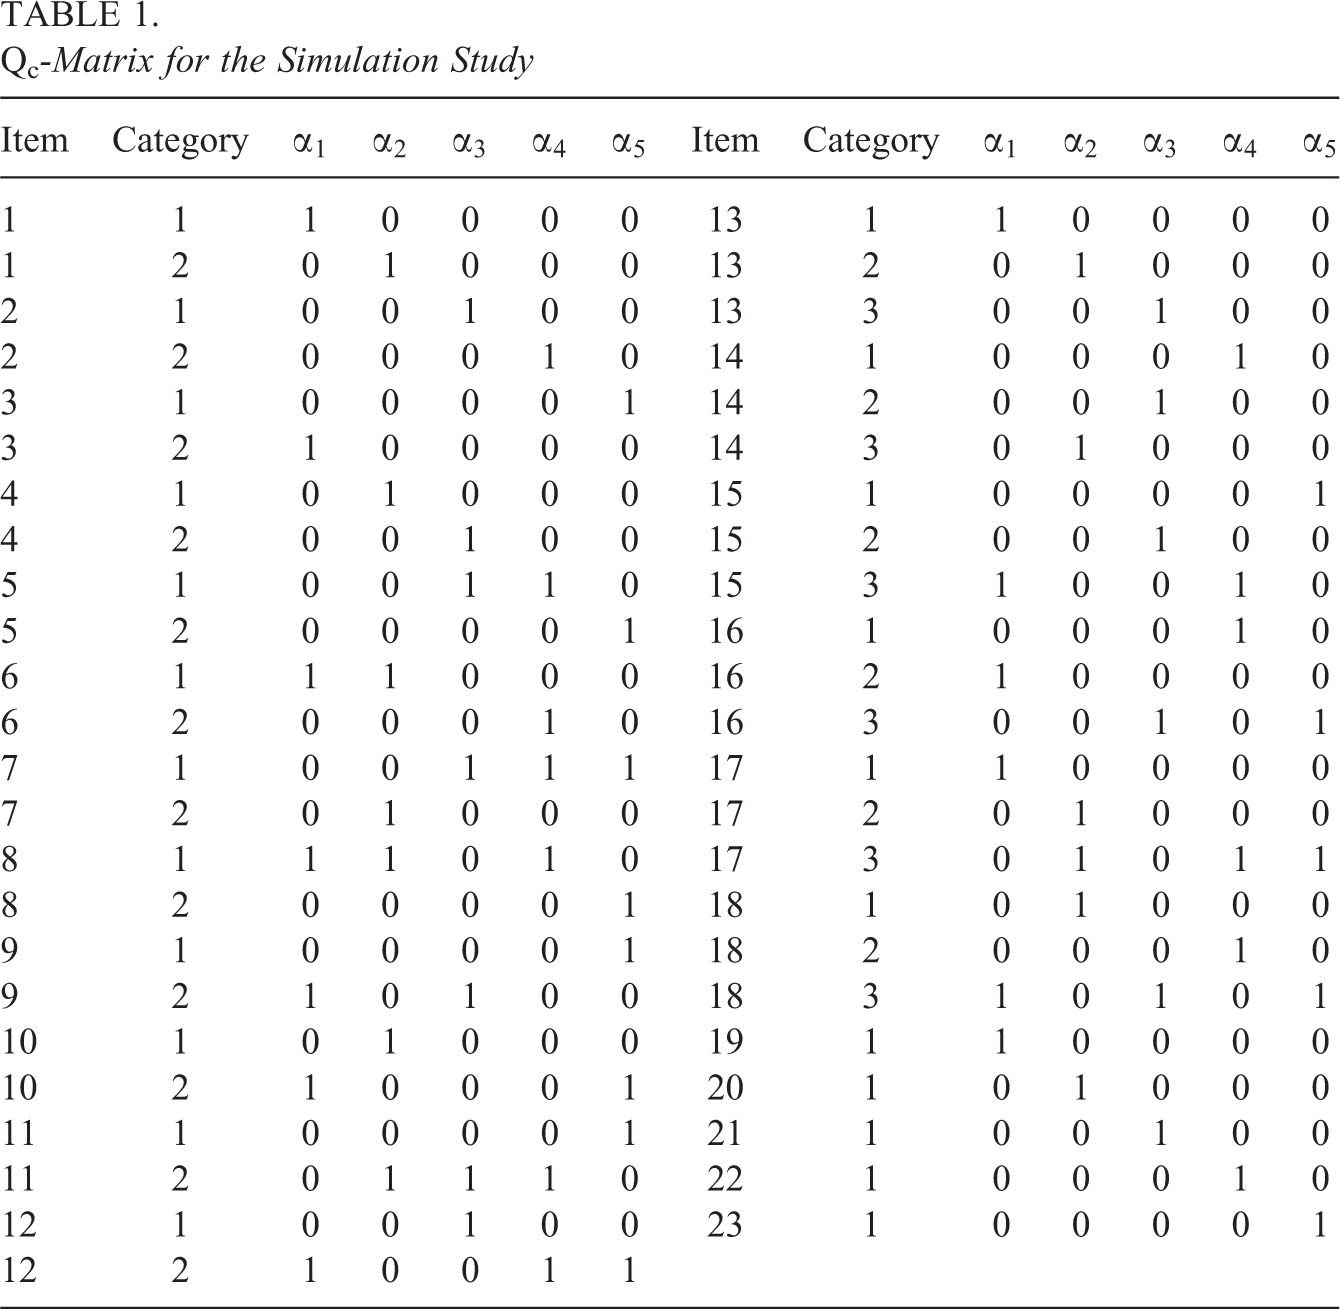
The number of items and attributes were fixed to
Qc -Matrix for the Simulation Study
Results
Type I Error
Type I error occurs when a hypothesis test concludes that the G-DINA processing function is statistically better than the generating processing function. For each of the multiattribute response categories, the (observed) Type I error rate is the percentage of times that the hypothesis test makes the Type I error out of the 1,000 replications under a specific significance level. The Type I error rates were averaged across categories with the same
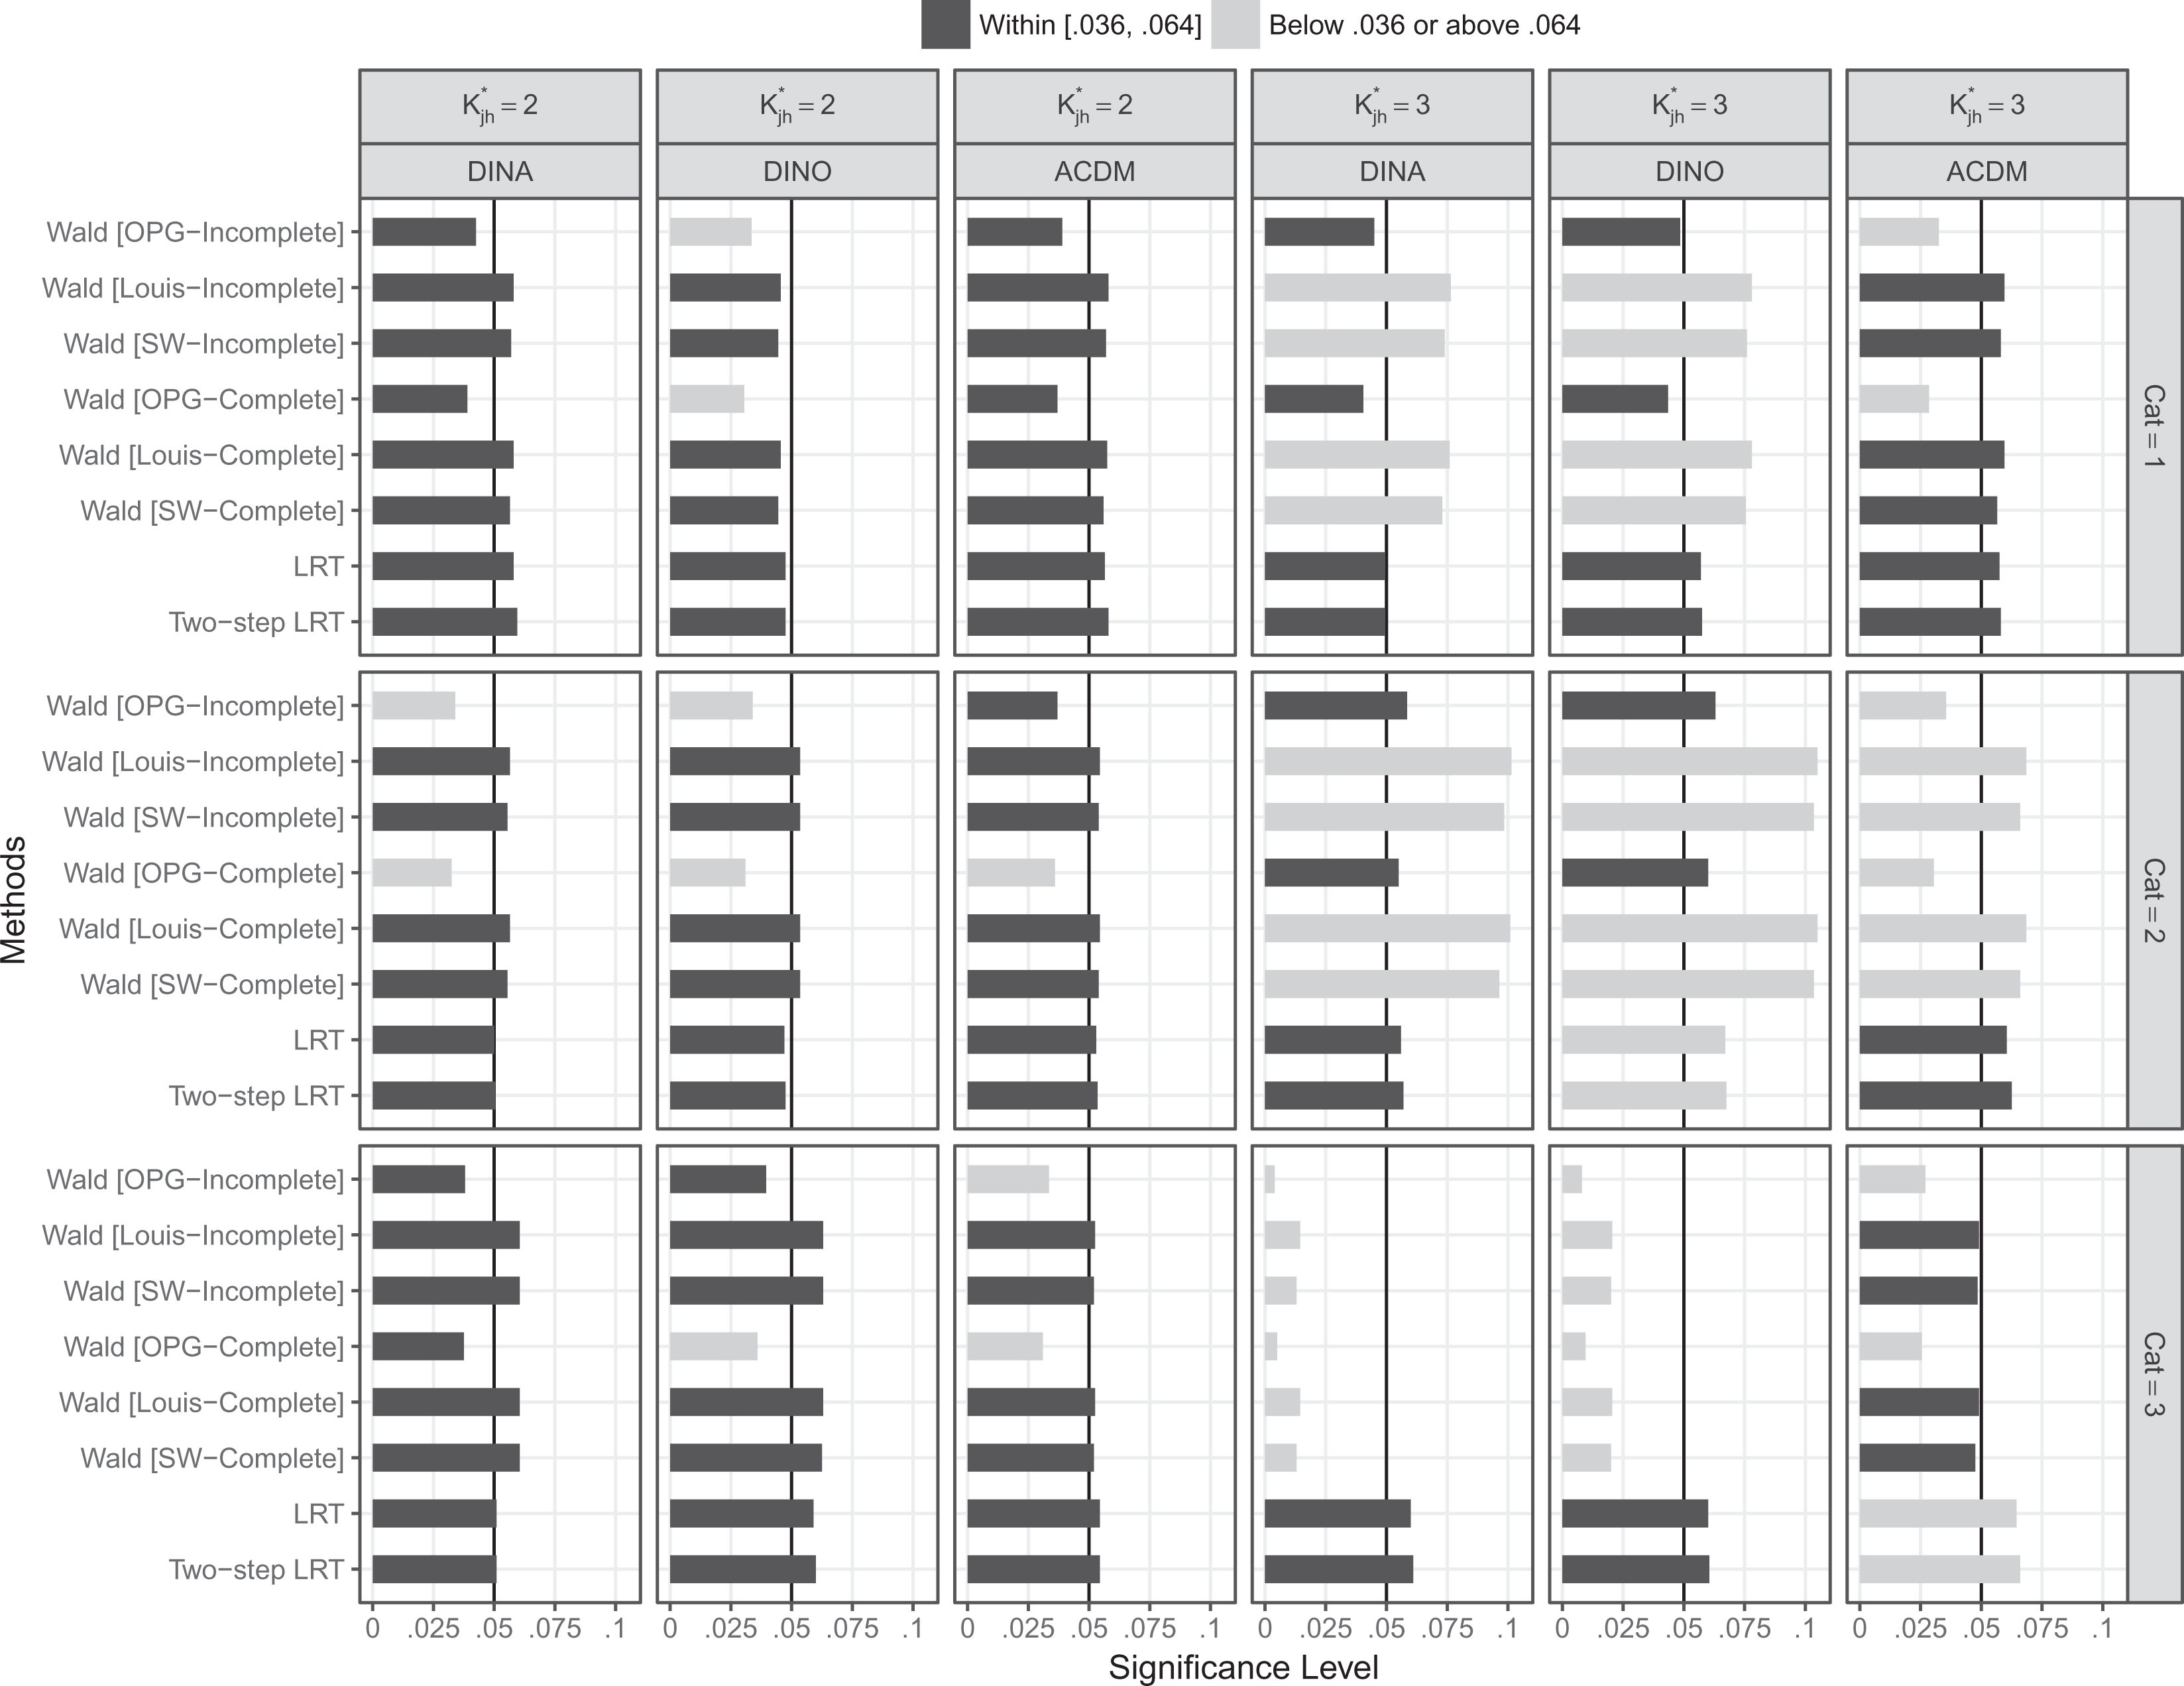
Type I error when N = 1,000 and items were of high quality.
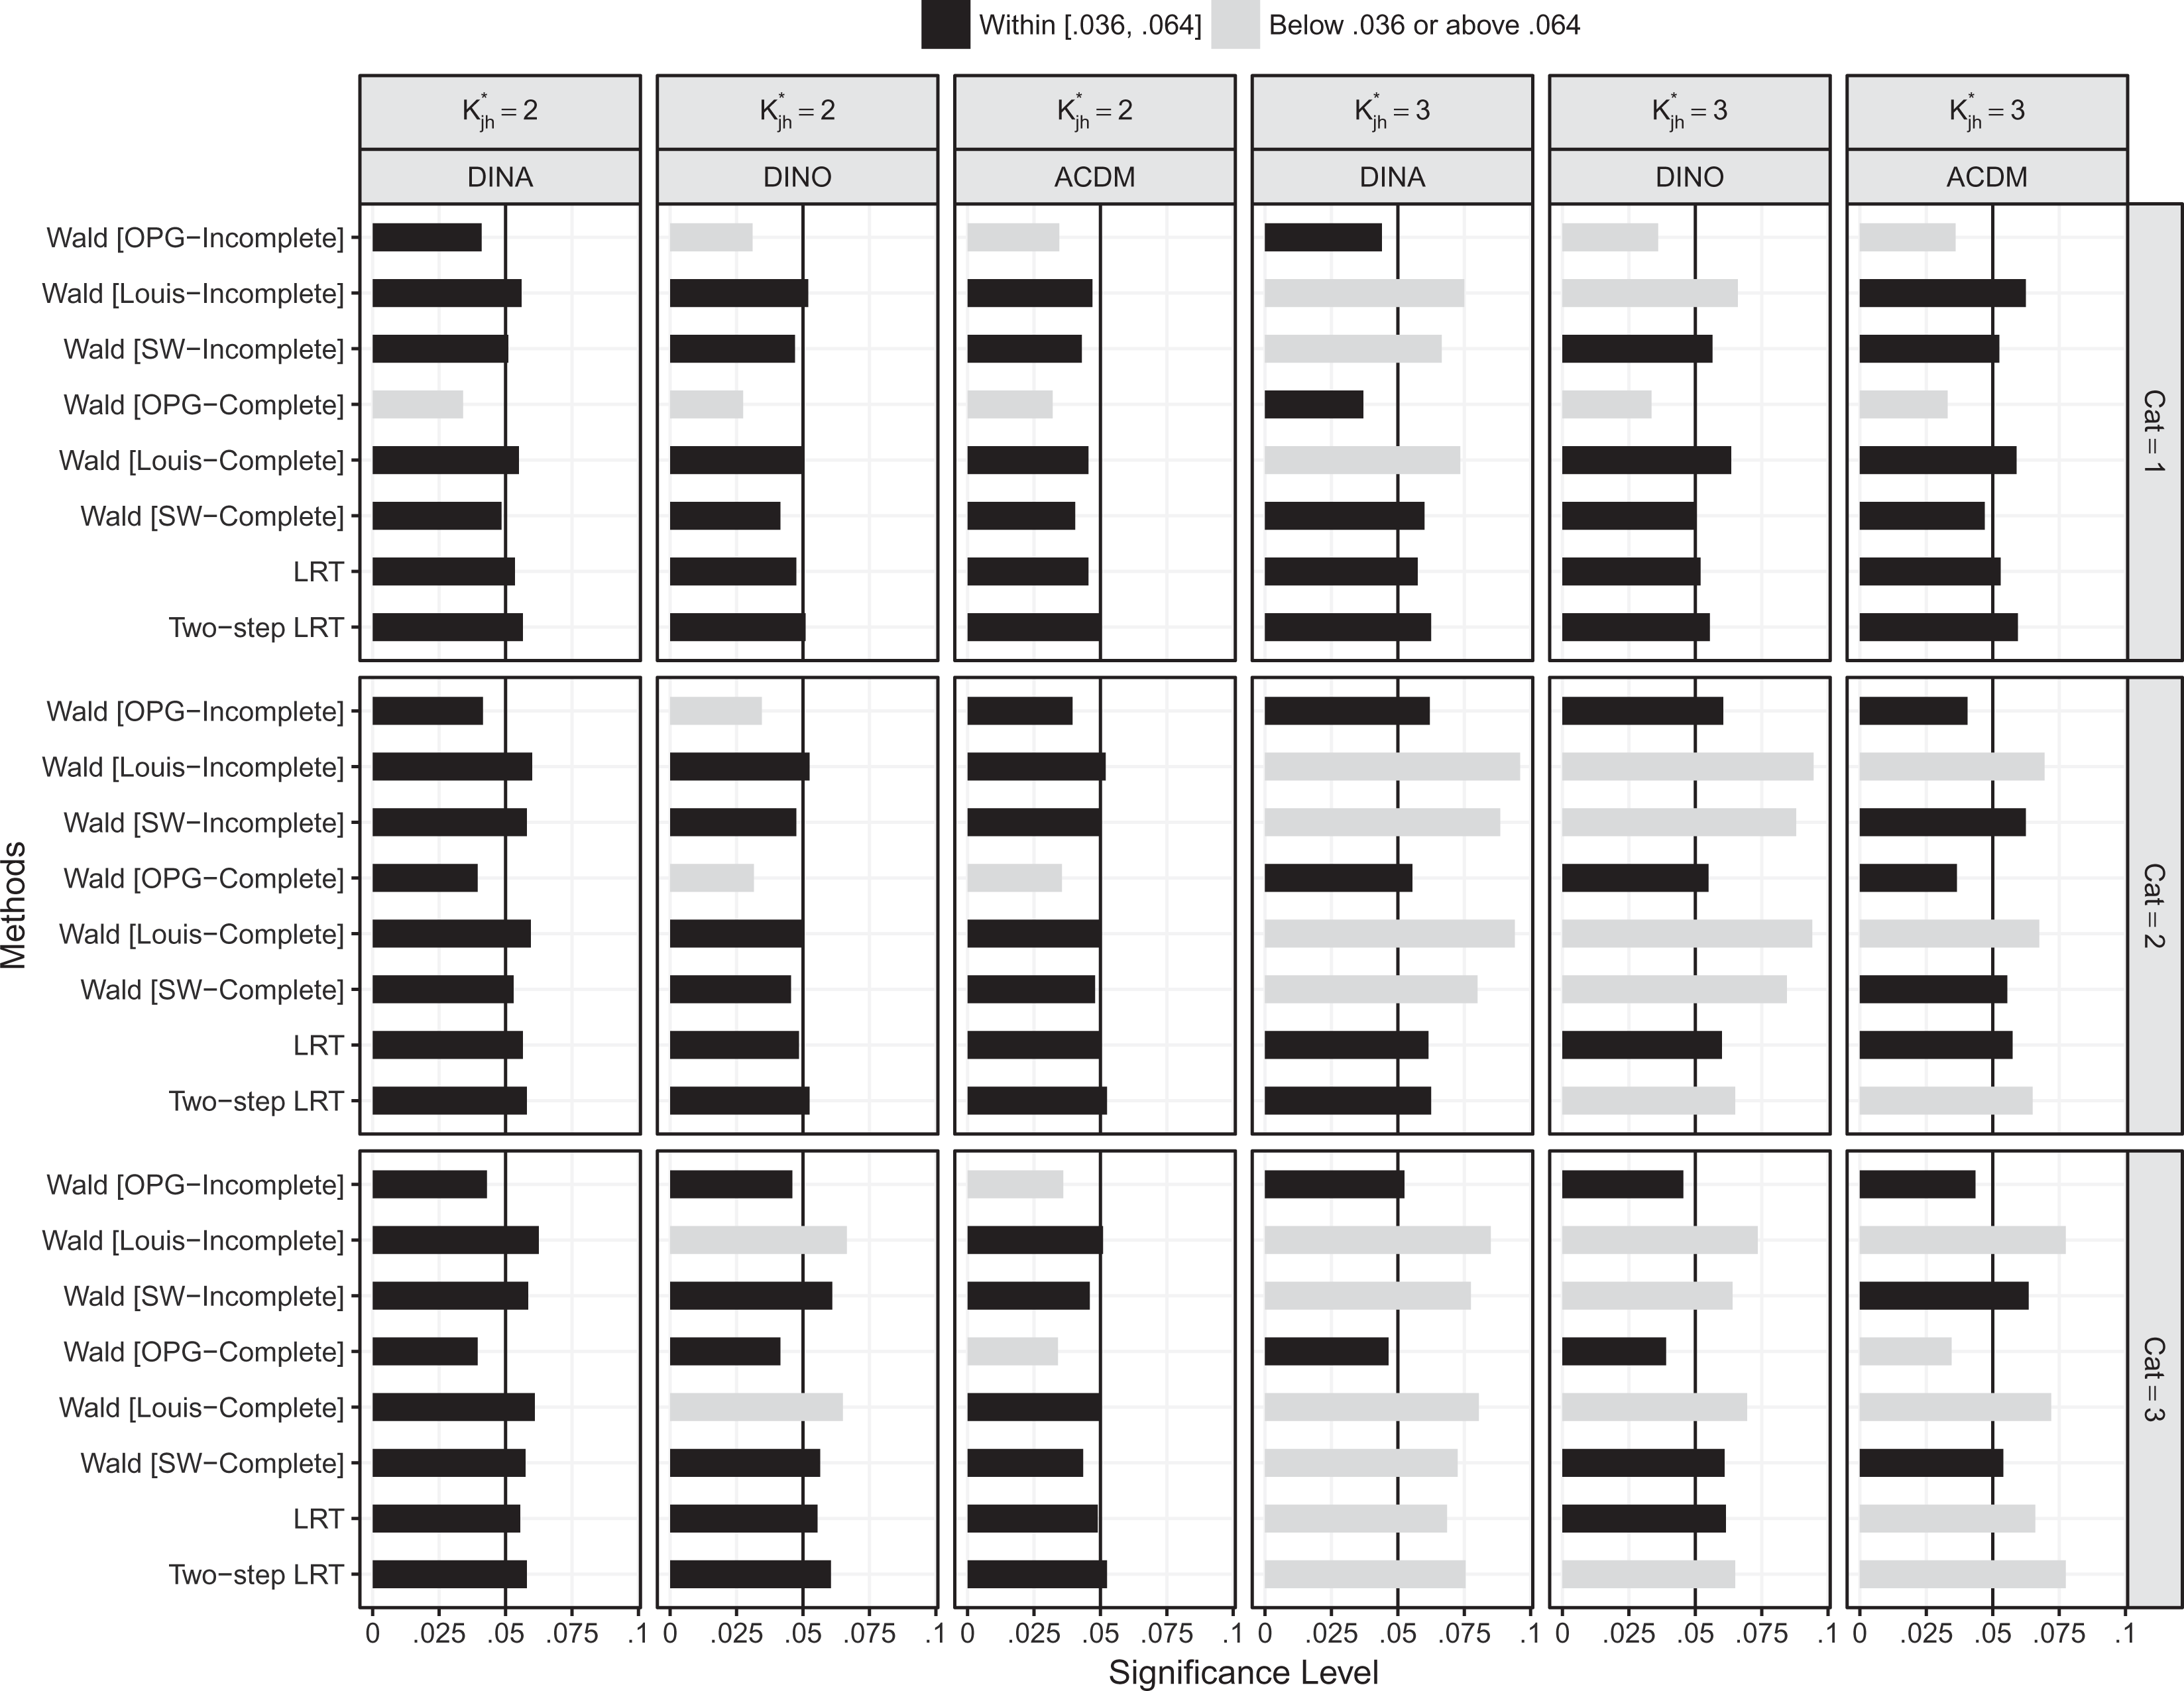
Type I error when N = 1,000 and items were of moderate quality.
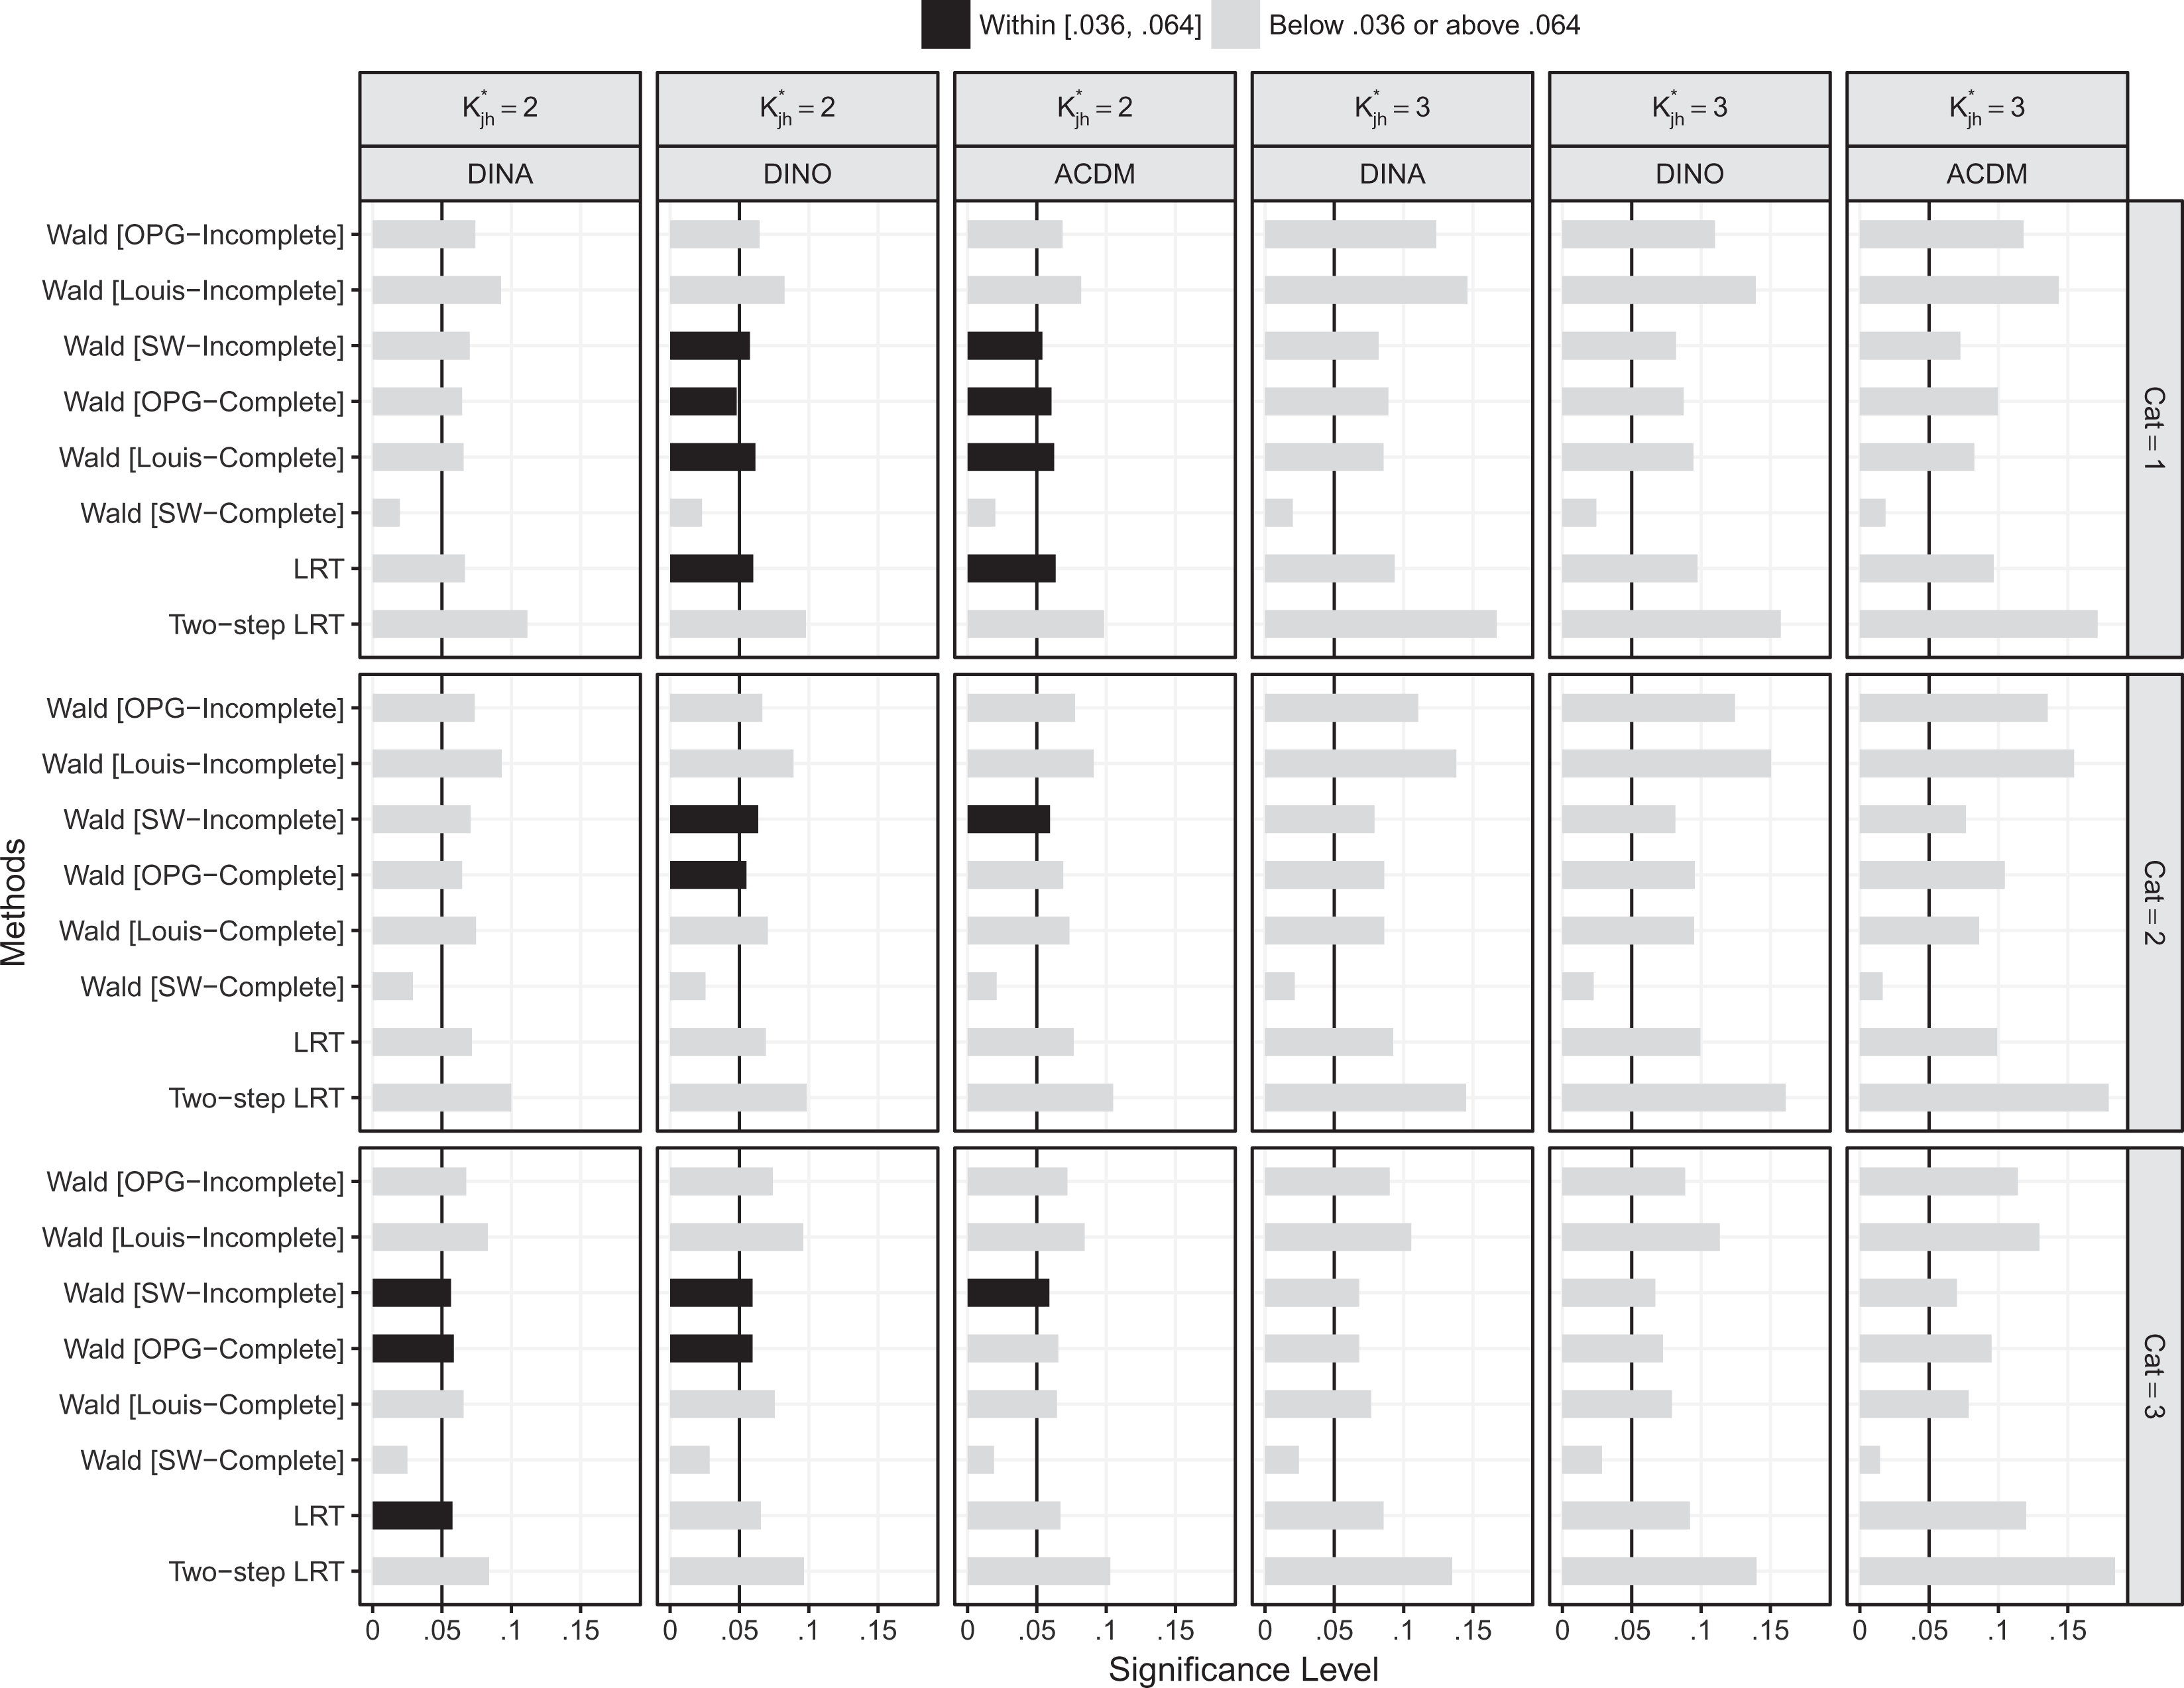
Type I error when N = 1,000 and items were of low quality.
As shown in Figure 1 where
From Figure 2 where
When
When
Empirical Power Rates
Statistical power indicates the performance of a hypothesis test in rejecting the null hypothesis when it is not correct. To compare statistical power rates, all hypothesis tests should have the same observed Type I error rate. However, this is not the case as shown in the previous section. As a result, the empirical power rates calculated from the empirical distributions under the null hypothesis were reported instead. Specifically, when the generating model was fitted to the data, the fifth percentile of the p values for each hypothesis test was calculated and used as the empirical cutoff for each condition. The empirical power rate, which was calculated for each hypothesis test under each condition, is defined as the percentage of p values that were less than the empirical cutoff under the same condition. Note that if the Type I error rate matches the nominal level, the empirical power rate is the same as the theoretical power. Like the Type I error rate, the empirical power rates were also averaged across categories with the same
Empirical Power for the DINA Processing Function: ACDM–Generated Data
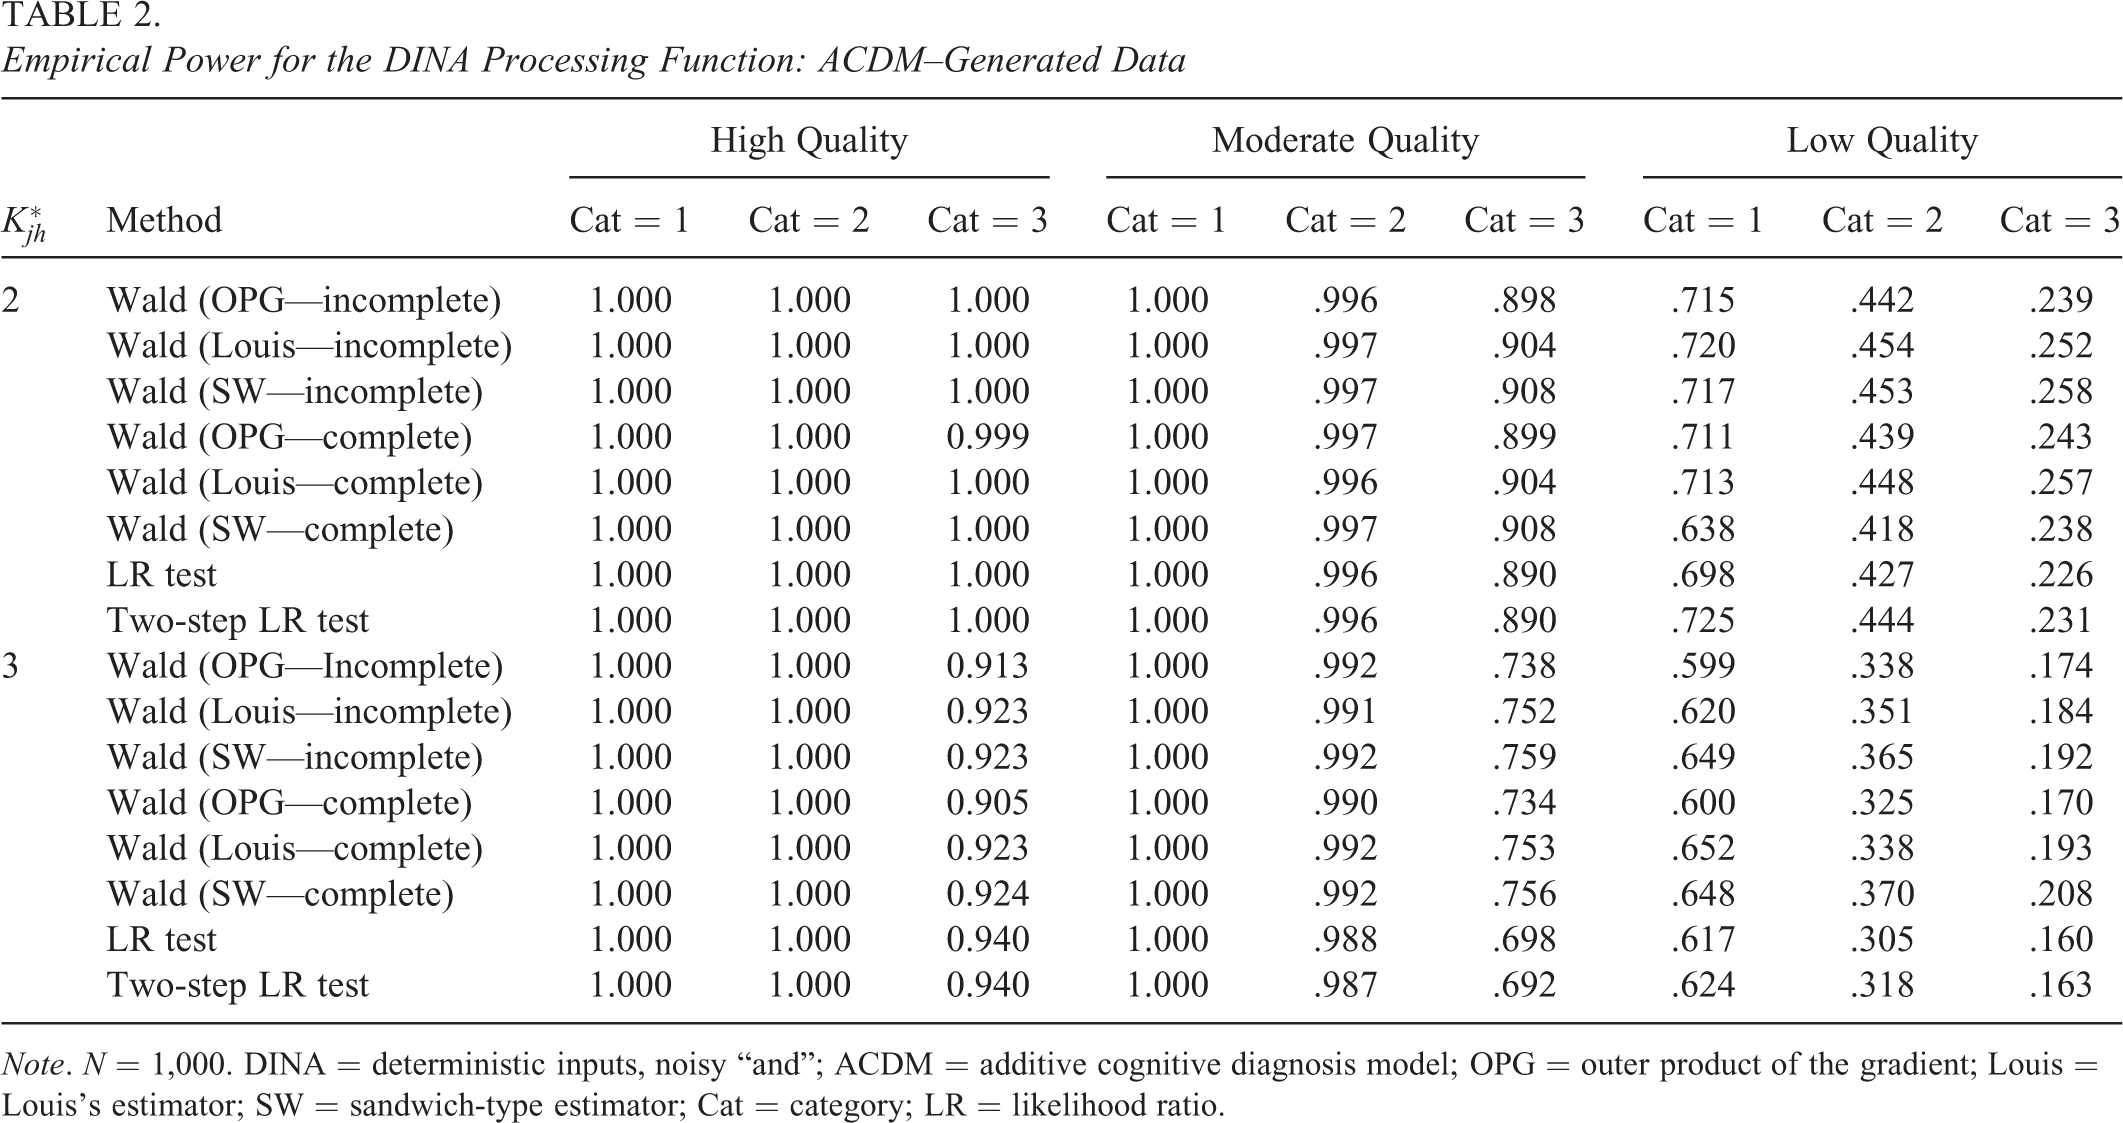
Note. N = 1,000. DINA = deterministic inputs, noisy “and”; ACDM = additive cognitive diagnosis model; OPG = outer product of the gradient; Louis = Louis's estimator; SW = sandwich-type estimator; Cat = category; LR = likelihood ratio.
Empirical Power for the DINA Processing Function: ACDM–Generated Data
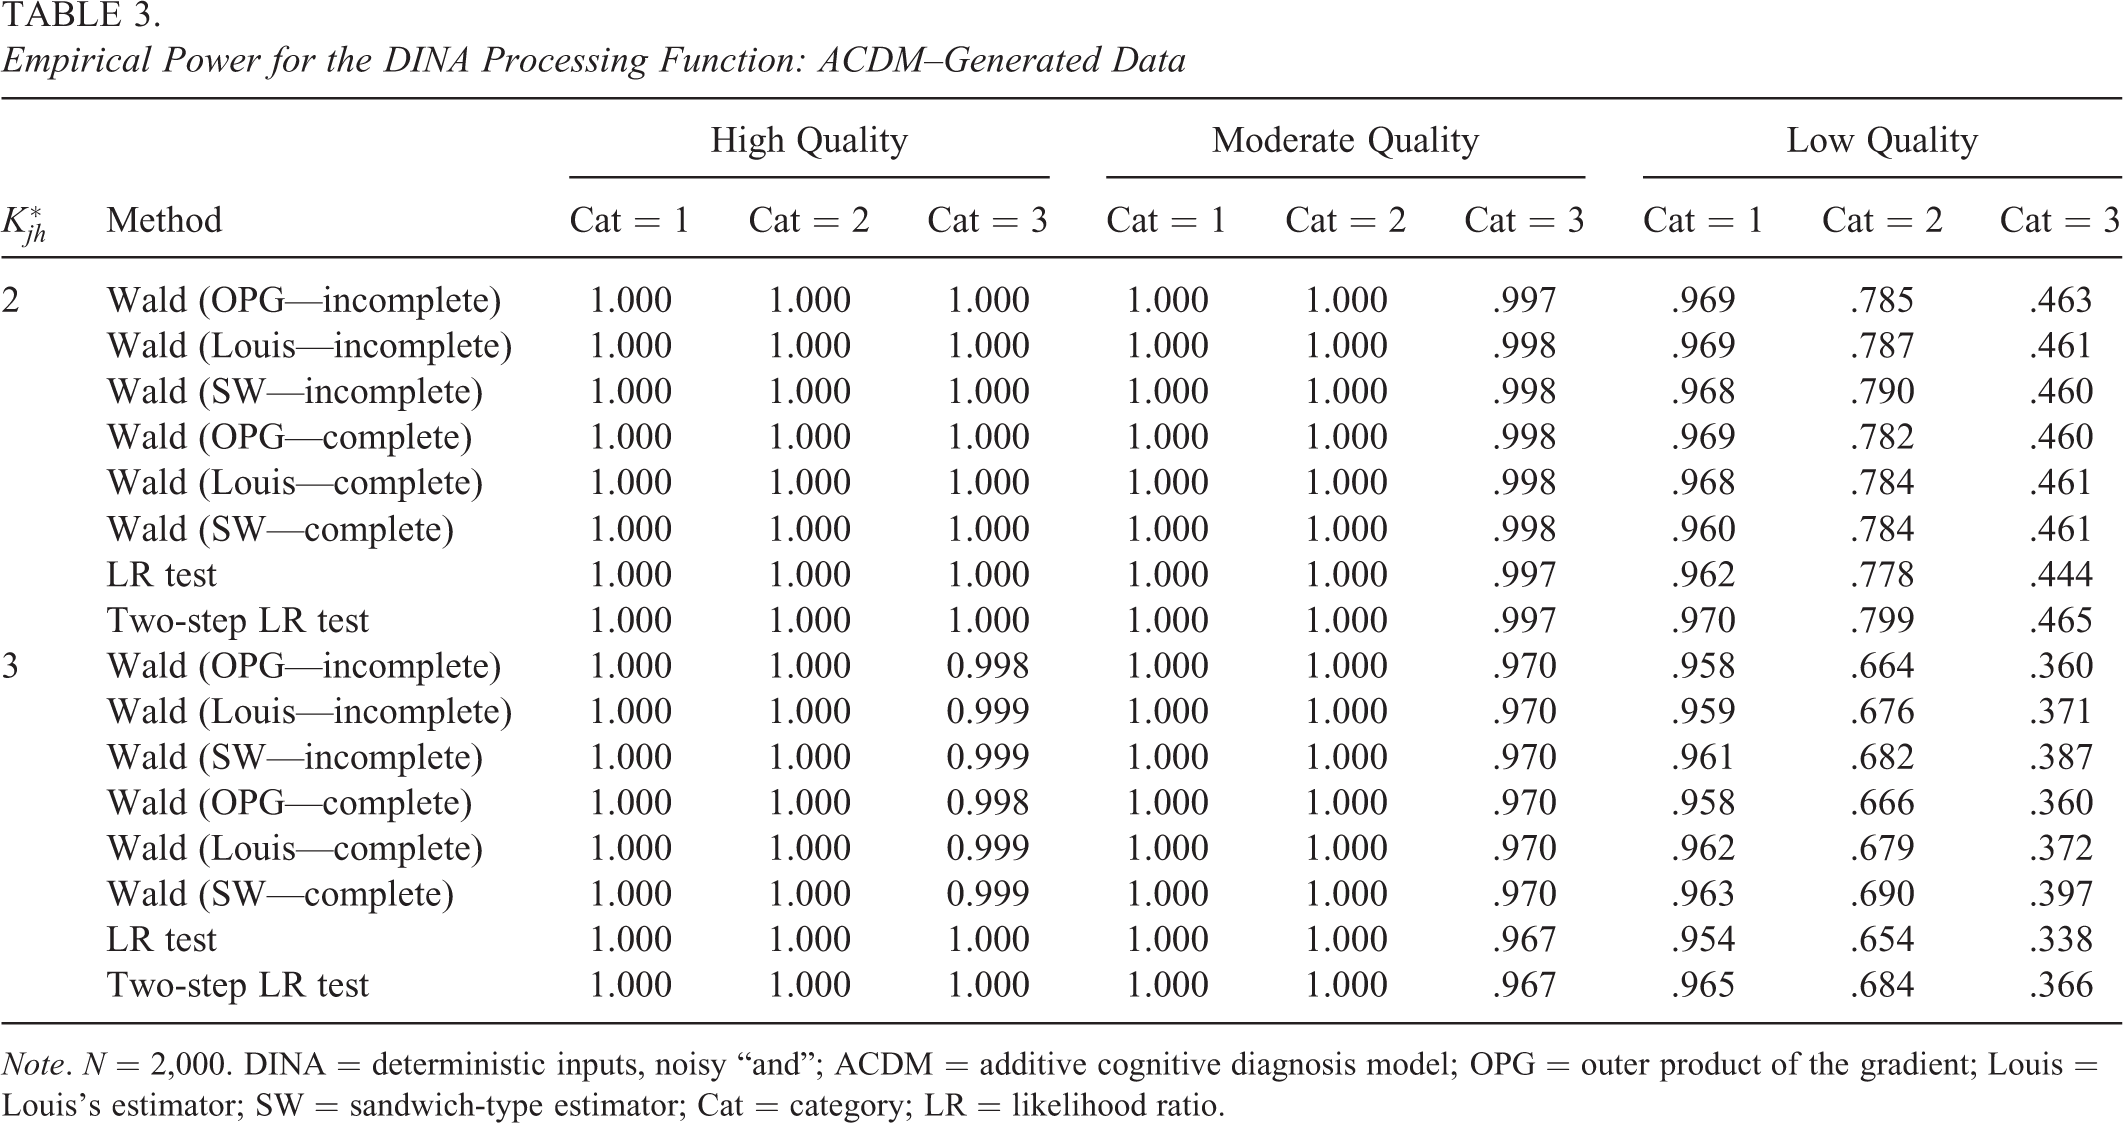
Note. N = 2,000. DINA = deterministic inputs, noisy “and”; ACDM = additive cognitive diagnosis model; OPG = outer product of the gradient; Louis = Louis's estimator; SW = sandwich-type estimator; Cat = category; LR = likelihood ratio.
Empirical Power for the DINA Processing Function: ACDM–Generated Data
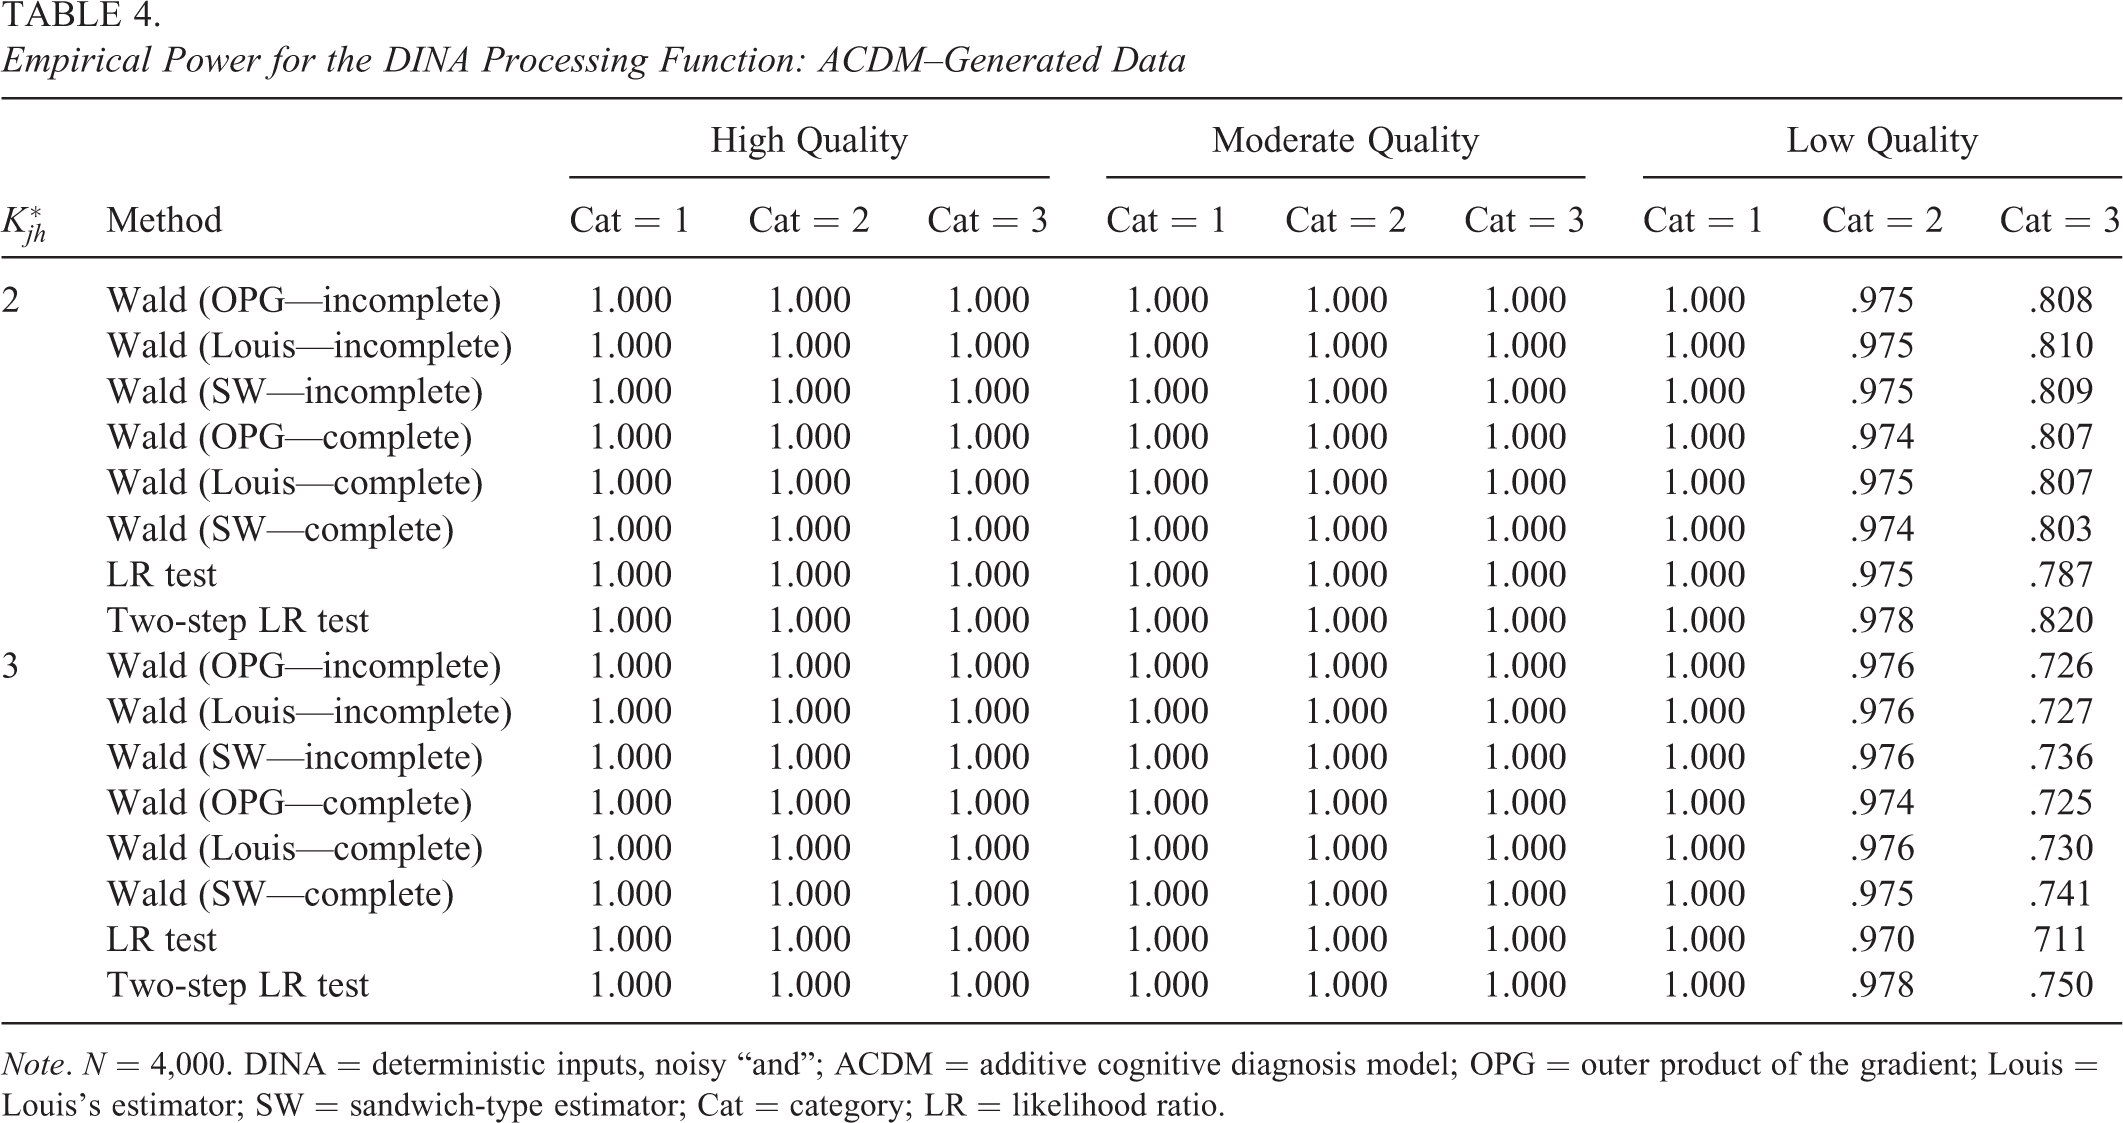
Note. N = 4,000. DINA = deterministic inputs, noisy “and”; ACDM = additive cognitive diagnosis model; OPG = outer product of the gradient; Louis = Louis's estimator; SW = sandwich-type estimator; Cat = category; LR = likelihood ratio.
From Tables 2 through 4, the empirical power rates of the Wald and LR tests increased as the sample size increased,
Similar patterns can be observed under other conditions. The power rates were high under the favorable conditions (i.e., higher item quality, larger sample size, lower level of category, and smaller
When we consider all simulated conditions, no one method outperformed others consistently in terms of the empirical power. However, when the generating processing function is the DINO model, the Wald test regardless of the information matrices produced much lower power rates than the LR and two-step LR tests under high item quality, small sample size,
Real Data Analysis
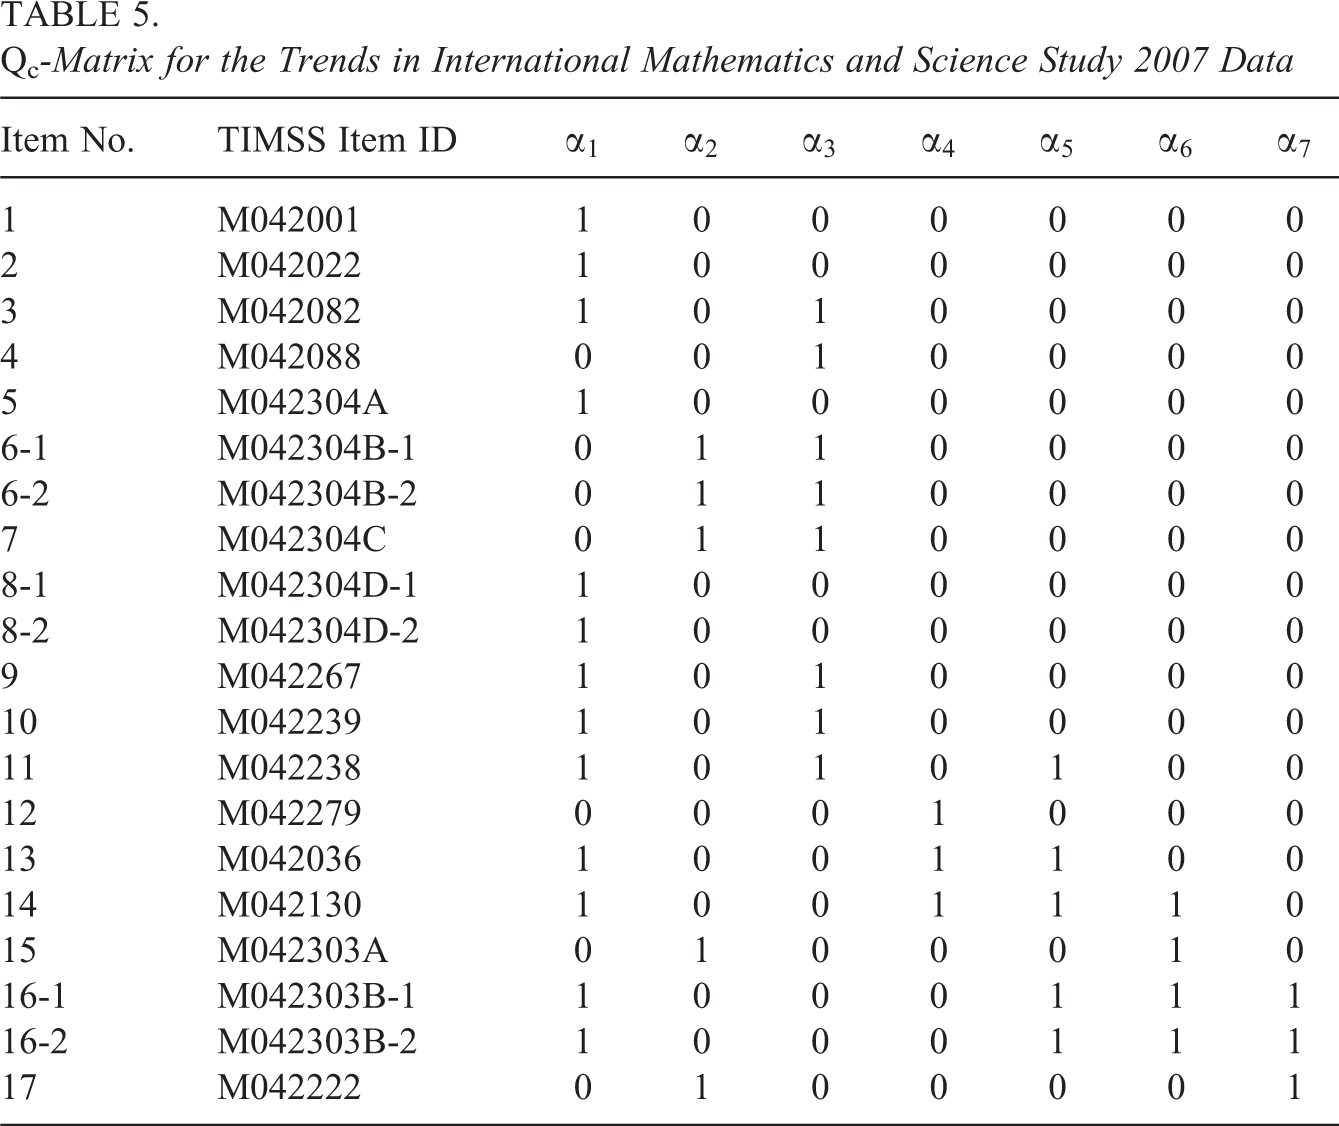
Responses of 1,328 students from the United States to 17 items from the Block 4 of the TIMSS 2007 eighth-grade mathematics assessment were analyzed in this study. The attributes measured by these items were identified by L. Ma (2014), who considered both cognitive process attributes and content attributes and built attributes at two levels. However, for illustration purposes, only seven second-level content attributes were considered in this study, namely, (α1) whole numbers and integers; (α2) fractions, decimals, ratio proportion, and percent; (α3) algebraic expressions and equations/formulas functions; (α4) geometric shapes; (α5) geometric measurement and location movement; (α6) data organization and representation; and (α7) data interpretation and chance. L. Ma (2014) also developed the Q-matrix for these items using multiple regression and the least squares distance method, and the Qc-matrix, given in Table 5, was created based on L. Ma’s work by assuming that for each polytomously scored item, all required attributes are measured by each step of the item. The sequential G-DINA model was fitted to the data. The Wald test using the incomplete and complete OPG, Louis, and sandwich information matrices; the LR; and the two-step LR tests were conducted to examine whether the saturated G-DINA model can be replaced by the DINA model, DINO model, and A-CDM. However, the complete and incomplete Louis’s information matrices were not positive definite, and therefore both Louis’s and sandwich covariance matrices were not calculable.
Qc -Matrix for the Trends in International Mathematics and Science Study 2007 Data
For 13 multi-attribute response categories from 9 dichotomous items and 2 polytomous items, the DINA model was never selected by any of the hypothesis tests. The DINO model was selected only once for Item 17 by the Wald test using the complete information matrix with a p value of .51; whereas for this item, A-CDM was believed appropriate by all hypothesis tests. Because the DINA and DINO models were not selected for any other category, only the p values for A-CDM were given in Table 6. The results from all hypothesis tests were consistent for 8-item response categories. Specifically, the G-DINA model was deemed appropriate for Items 3, 6-1, 10, and 11, whereas the sequential A-CDM was considered as good as the sequential G-DINA model for Items 7, 9, 13, and 17. For other items or categories, different procedures selected different condensation rules. Based on the Wald test using the complete information matrix, the A-CDM was appropriate for 9-item response categories; whereas based on two-step LR test, A-CDM may only be used for four response categories.
p Values of the Wald and LR Tests for the ACDM Processing Function
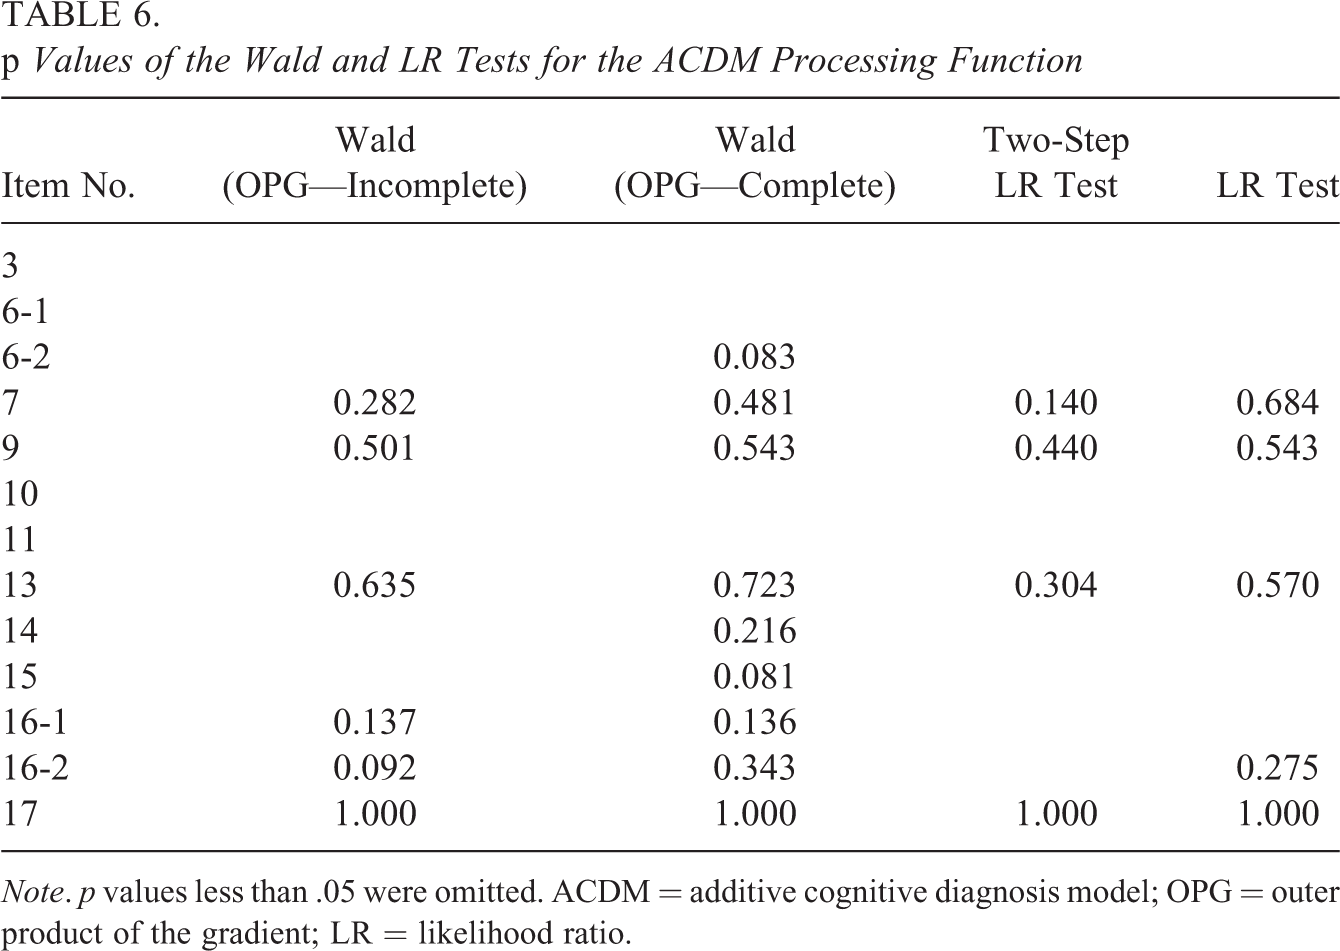
Note. p values less than .05 were omitted. ACDM = additive cognitive diagnosis model; OPG = outer product of the gradient; LR = likelihood ratio.
According to the models suggested by each hypothesis test, the data were recalibrated, and the AIC and BIC were calculated for each fitted model. The LR test was also implemented at test level to evaluate whether the suggested models fitted as well as the saturated sequential G-DINA model. Based on the test-level LR test, the models suggested by the Wald test using the complete information matrix were significantly worse than the sequential G-DINA model,
AIC and BIC for Models Selected by the Wald and LR Tests
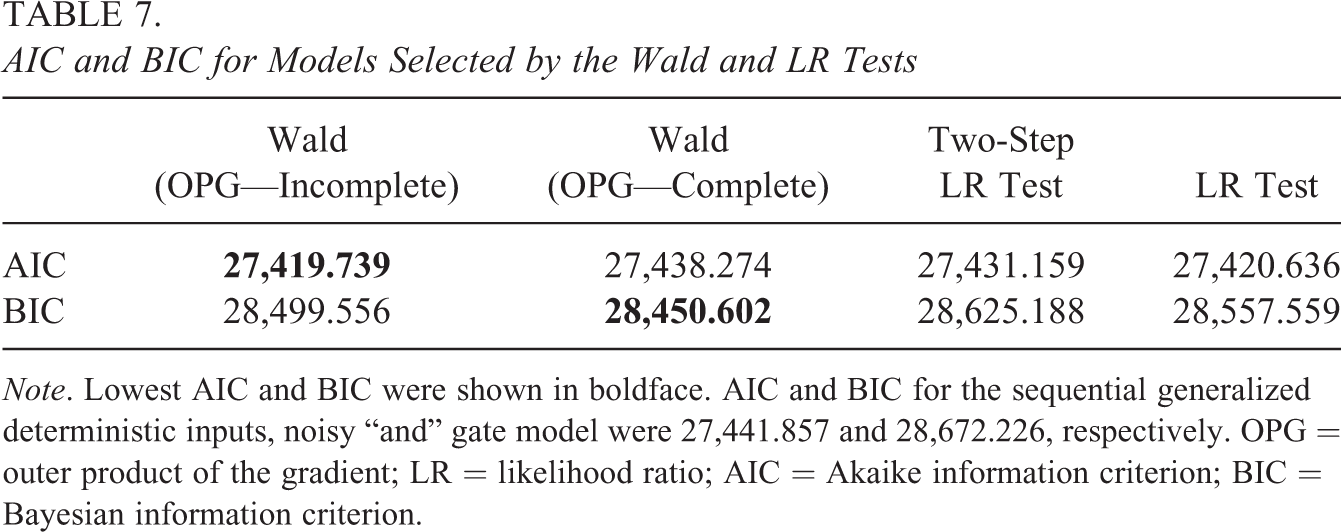
Note. Lowest AIC and BIC were shown in boldface. AIC and BIC for the sequential generalized deterministic inputs, noisy “and” gate model were 27,441.857 and 28,672.226, respectively. OPG = outer product of the gradient; LR = likelihood ratio; AIC = Akaike information criterion; BIC = Bayesian information criterion.
Table 8 gives the classification consistency among a variety of sequential CDMs, including the sequential G-DINA, DINA, DINO, and A-CDM, as well as the sequential models selected using Wald and LR tests. The attribute profiles were estimated using the expected a posteriori method. The upper triangle shows the classification consistency at attribute level, which is defined as the proportion of individual attributes that were identically classified by two CDMs, whereas the lower triangle shows the classification consistency at attribute vector level, which is defined as the proportion of individuals who were classified into the same latent class by two CDMs. It can be observed that the condensation rules can have a strong influence on individual classifications. For example, the classification consistency at attribute vector level ranged from 0.284 to 0.785 among the sequential G-DINA, DINA, DINO, and A-CDM. The model selected by the two-step LR test had the highest classification consistency (i.e., 0.925) with the sequential G-DINA model, followed by the model selected by the LR test (i.e., 0.893). It should be noted that the classification consistency results show the impact of condensation rules on individual classifications but do not tell us which model is the best in that the true attribute profile for each individual is unknown.
Classification Consistency Among Different CDMs
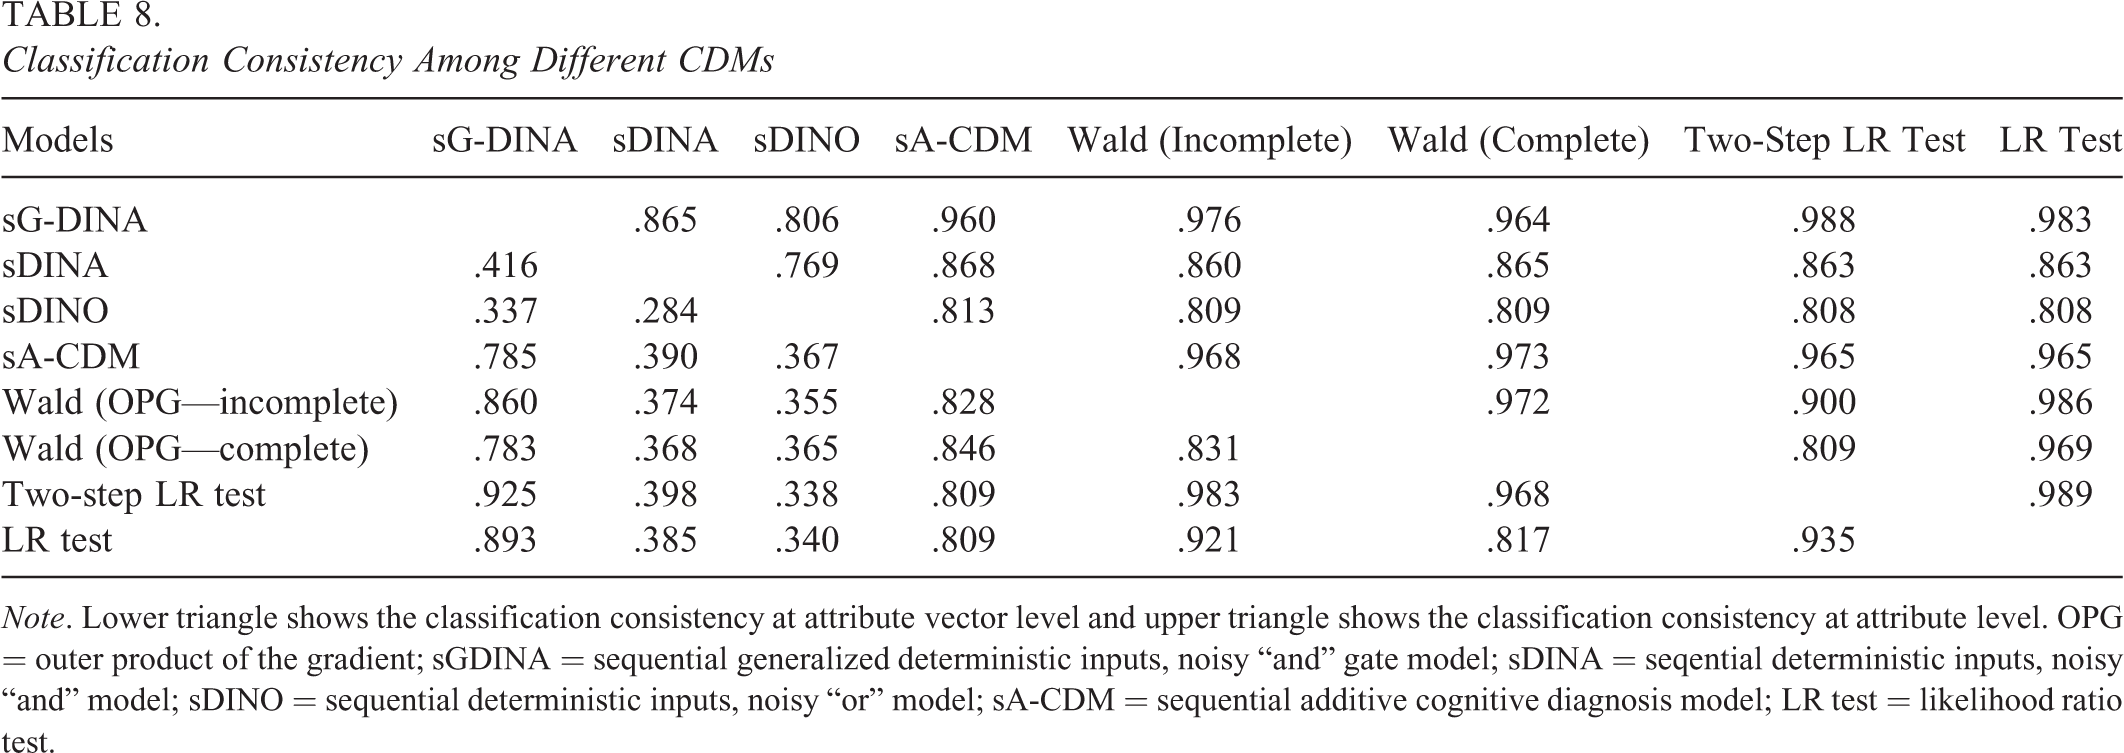
Note. Lower triangle shows the classification consistency at attribute vector level and upper triangle shows the classification consistency at attribute level. OPG = outer product of the gradient; sGDINA = sequential generalized deterministic inputs, noisy “and” gate model; sDINA = seqential deterministic inputs, noisy “and” model; sDINO = sequential deterministic inputs, noisy “or” model; sA-CDM = sequential additive cognitive diagnosis model; LR test = likelihood ratio test.
Discussion
It has been said that no model is true, but some are more useful than others. A psychometric model should be in line with the underlying cognitive processes to provide a good approximation to the reality. The condensation rule is a central component for many CDMs, and in this study, we examined the Type I error and power of the Wald and LR tests in determining the appropriate condensation rules for each response category of a polytomously scored item. This is achieved by comparing whether the reduced models can be used in place of the G-DINA model without a significant loss in model-data fit.
This study systematically examined the influence of incomplete and complete OPG, Louis’s, and sandwich covariance matrices on the Wald test. Results show that the Wald test using complete or incomplete OPG information matrices tended to be conservative especially when sample size was small. This finding is partially consistent with Y. Liu, Xin, Li, Tian, and Liu (2016) who examined the Type I error rates of the Wald test for the DINA model using the complete OPG information matrix in detecting differential item functioning for dichotomous responses and found that the Wald test tended to be conservative under small sample sizes regardless of item quality.
The Wald test based on the Louis’s information matrices does not outperform that based on the simpler OPG information matrices. Also, the Louis’s information matrices are more likely to be nonpositive definite as noticed by other researchers (e.g., Duan & Fulop, 2011). Despite this issue, the resulting sandwich information matrices could help the Wald test control the inflation of the Type I error when items were of low quality.
Despite not involving an estimated covariance matrix, the LR test also produced inflated Type I error rates under some unfavorable conditions. However, unlike the Wald test, the LR test did not tend to be conservative under high item quality conditions. Although the two-step LR test performed as well as the LR test under most conditions, it tends to yield much more inflated Type I error rates than the LR test when items were of low quality and sample size was small.
In terms of the computation time, the LR test can be very expensive if the data calibration takes time or the number of categories is very large. For the real data analyzed in this study, the Wald test using the OPG information took only about 0.25 s to compare the G-DINA processing function with the DINA, DINO, and A-CDM for all multiattributes categories. In contrast, the LR test and two-step LR test took around 16 min and 12 s, respectively. It should be noted that the code for the LR test was written in R by the author, and faster speeds can be expected by using a program written in a lower level language such as C. Under most conditions, the studied methods have similar power rates, and no single method performed best across all conditions. Despite excellent power rates under favorable conditions, their power can drop substantially under unfavorable conditions.
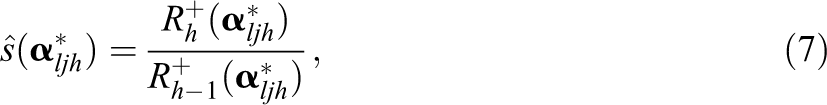
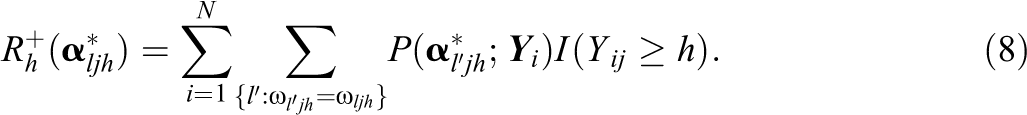
Based on the closed-form solution for item parameter estimation, the processing function for category h is the ratio of the expected number of examinees, given a particular attribute pattern obtaining a score of h or higher to the expected number of examinees and given the attribute pattern obtaining a score of
A set of data from the TIMSS assessment was retrofitted to illustrate the use of the Wald and LR tests in practice. It is shown that, for the current data, models with different condensation rules produced substantial different person classifications, and thus, it is important to choose CDMs that can approximate the underlying cognitive processes well using, for example, the Wald and LR tests. However, the results need to be interpreted with cautions because of many challenges associated with retrofitting (R. Liu, Huggins-Manley, & Bulut, 2017). For example, many attributes are relatively coarser-grained but still assumed to be binary latent variables for CDM analyses. This may produce unstable or inaccurate parameter estimates. It would be interesting to explore how attributes should be defined to balance the grain size and the number of attributes in the context of large-scale assessments as in Skaggs, Wilkins, and Hein (2016).
It is worth emphasizing that retrofitting tends to be suboptimal. This study intends to provide a set of tools that can be used along with the sequential G-DINA model, so that researchers can develop the CDAs under this framework. To achieve this goal, future research along this line is needed. For example, the test length and the number of attributes were fixed and the Q-matrix was assumed known. Guo, Ma, and de la Torre (2017) found that with misspecified Q-matrix, the standard error of item parameters estimated using the OPG approximation can be problematic, so future research may examine their influence on the performance of the Wald test. In addition, apart from the OPG, Louis’s, and sandwich information matrices investigated in this study, future research may explore the performance of the Wald test using covariance matrix calculated in other ways, such as the Oakes’s method (Chalmers, 2018) and the numerical differential methods (Jamshidian & Jennrich, 2000).
Supplemental Material
Supplemental Material, DS_10.3102_1076998618792484 - Category-Level Model Selection for the Sequential G-DINA Model
Supplemental Material, DS_10.3102_1076998618792484 for Category-Level Model Selection for the Sequential G-DINA Model by Wenchao Ma, and Jimmy de la Torre in Journal of Educational and Behavioral Statistics
Footnotes
Appendix A
Appendix B
Authors’ Note
This article is based on the first author’s PhD dissertation at Rutgers, The State University of New Jersey, under the supervision of the second author.
Declaration of Conflicting Interests
The author(s) declared no potential conflicts of interest with respect to the research, authorship, and/or publication of this article.
Funding
The author(s) received no financial support for the research, authorship, and/or publication of this article.
References
Supplementary Material
Please find the following supplemental material available below.
For Open Access articles published under a Creative Commons License, all supplemental material carries the same license as the article it is associated with.
For non-Open Access articles published, all supplemental material carries a non-exclusive license, and permission requests for re-use of supplemental material or any part of supplemental material shall be sent directly to the copyright owner as specified in the copyright notice associated with the article.