
Abstract
Bank failure prediction is an important study for regulators in the banking industry because the failure of a bank leads to devastating consequences. If bank failures are correctly predicted, early warnings can be sent to the responsible authorities for precaution purposes. Therefore, a reliable bank failure prediction or early warning system is invaluable to avoid adverse repercussion effects on other banks and to prevent drastic confidence losses in the society. In this paper, we propose a novel self-organizing neural fuzzy inference system, which functions as an early warning system of bank failures. The system performs accurately based on the auto-generated fuzzy inference rule base. More importantly, the simplified rule base possesses a high level of interpretability, which makes it much easier for human users to comprehend. Three sets of experiments are conducted on a publicly available database, which consists of 3635 United States banks observed over a 21-year period. The experimental results of our proposed model are encouraging in terms of both accuracy and interpretability when benchmarked against other prediction models.
Keywords
Introduction
Bank failure prediction is of great importance to a bank’s policy-makers, regulators, and clients. There is no doubt that the failure or collapse of a bank leads to devastating consequences and widespread repercussions on other banks and financial institutions. Some of the negative impacts are the massive bailout cost for a failing bank and the negative sentiments and loss of confidence developed by investors and depositors. Generally speaking, bank failures are due to financial distress. In the past several years, many countries have experienced significant banking sector problems with the United States sub-prime crisis and weak economy being the most possible causes. According to the Federal Deposit Insurance Corporation (FDIC) [9], from 2008 to 2011, there are 414 banks closed in United States only. The overall deposits of the 414 failed banks are over 481 million US dollars and the overall assets are over 668 million. The estimated overall financial losses of the 414 failed banks are over 89 million. There are 157 bank failures in 2010 only, which is the highest number since 1992. The increase in bank failures has rekindled the interest in the prediction or early warning of bank failures.
A reliable early warning system of bank failures requires an accurate prediction model. Most prediction models in the literature are based on statistical studies. The pioneers of the statistical approach are proposed by Beaver [2] and Altman [1]. Beaver is one of the first researchers to use financial statements to predict bankruptcy and his study is based on one financial ratio (univariate) at a time. Altman, on the other hand, uses a number of financial ratios (multivariates) as inputs to predict bankruptcy. The Multivariate Discriminant Analysis (MDA) method [1] employs a discriminant function to classify the firms into their respective groups. The discriminant function is essentially a linear combination of independent financial ratios of the firm to minimize misclassifications. The MDA method is widely adopted in the literature and it is based on the assumption that any two different classes have Gaussian distributions with equal covariance matrices. The Recursive Partitioning Algorithm (RPA) [11], which is a computerized and non-parametric technique to construct a classification tree (precedent to C4.5 [31]) for the prediction of firm insolvencies, is found to outperform MDA in most cases. However, the authors of [11] also observe that additional information can be derived by assessing both RPA and MDA. Other well-known statistical models proposed in the literature include the logistic regression approach [26], which is essentially a linear sigmoid model that functions like a single-neuron network, and the Cox’s proportional hazards model [5,19], which employs an estimated proportional hazard function based on the hazard rate of an average-performing bank. All the above introduced models have their own deficiencies and a “satisfactory model has yet to be developed” [38].
Unlike statistical models, the neural network approach [20] does not make assumptions on data distributions. Furthermore, it does not require any rigid restrictions on the use of input and output functions other than being continuous and differentiable [38]. Although the neural network approach provides superior results to the traditional statistical models [38], it offers little explanatory capability. The trained weight values associated with respective linkages of the neural network are simply numbers used for computations rather than meaningful indicators for human users to comprehend. This is the reason why majority neural networks function as black boxes [3]. A reliable model, which is as robust as a neural network and offers better interpretability, is thus desired.
Neural fuzzy inference system [18,22] (fuzzy neural network is used interchangeably in the literature) combines the learning capabilities of neural networks and the transparent properties of fuzzy systems together by performing respective fuzzy or non-fuzzy operations in each layer of the network. The objective of such soft computing approaches [16] is to synthesize the human ability to tolerate and handle uncertain, imprecise, and ambiguous information in the decision-making process. Some Neural Fuzzy Inference Systems (NFISs) self-organize their structures, which are normally realized by utilizing the clustering results obtained from the training data sets [42]. In this way, NFIS saves a great amount of efforts on the determination of the system structure and the construction of fuzzy rules, which are the two major overheads of traditional fuzzy systems. Furthermore, NFIS provides semantically meaningful linguistic inference rule base rather than the “black box” offered by most neural networks. The high-level linguistic fuzzy rules are represented in the IF–THEN form, which makes NFIS extremely intuitive and effortlessly comprehensive to the human users. In the bank failure prediction application, NFIS can be applied to identify the inherent characteristics of the failed banks and thus allows us to semantically and numerically understand the financial distress that leads to a bank failure. In the literature, there are a series of promising NFISs proposed to forecast bank failures [25,30,39–41]. Although these models are accurate in prediction, none of them focuses on the improvement of interpretability. Some of them employ unnecessarily larger number of fuzzy rules and all of them utilize all financial covariates given in the data set.
On the other hand, our novel NFIS model automatically constructs a simplified inference rule base and at the same time obtains high-level prediction accuracy, i.e., our proposed model is intuitively more comprehensive and is still highly competitive in terms of accuracy. Furthermore, only a limited number of high-level control parameters and necessary constraints are required before our proposed system iteratively optimizes the self-generated inference rule base without any expert guidance or human intervention. After adequate exploration (facilitated by the genetic algorithm), our proposed system obtains a concise yet highly reliable inference rule base to function as an early warning system for bank failure predictions. It is more encouraging to show in the later sections of this paper that the auto-generated rules are consistent with expert knowledge and the performance of our proposed system gets more reliable with the increase of the prediction time of bank failures.
The rest of this paper is organized as follows. Sections 2 and 3 respectively describe two techniques, which are the foundations to introduce our proposed clustering method. Section 4 provides the details of our proposed clustering method. Section 5 defines the system architecture of our proposed model, which employs the fuzzy rules automatically obtained by the proposed clustering method. Section 6 presents the experimental results on bank failure predictions and analytically compares the results of our proposed model against other benchmarking models. Section 7 concludes this paper and recommends possible further improvements.
Rough set theory for knowledge reduction
Rough sets [28] are always compared to fuzzy sets [45]. To describe belongingness, fuzzy sets use straightforwardly defined membership functions, while rough sets use relative relations denoted as the lower and upper approximations. Both theories aim to achieve the same type of goal [44], however, it is always better to have them both in one system to take advantages of their complements [29].
Knowledge representation system and decision table
Rough set theory is initiated to model relations in a given data set or knowledge base [28]. It is a formally defined methodology that can be applied to reduce the dimensionality of a given data set [34], preceding the training of an inference system.
To express mathematically how rough set theory is applied in knowledge reduction, decision logic language is used to model the Knowledge Representation System (KRS). Such a system is represented in a pair
Decision tables can be defined in terms of KRS. If we have
An example to illustrate the concept of a decision table
An example to illustrate the concept of a decision table
A numerical example of a decision table
Indiscernible relation over knowledge K, denoted as
Rough set theory approximates knowledge using a pair of relational approximations. The lower and upper approximations of a set, when given an equivalence relation
According to Table 2, we can define three sets based on the decision attribute e:
Attribute reduction and feature selection
Rough set theory performs knowledge reduction with two fundamental concepts, reduct and core. Intuitively, a reduct of knowledge is an essential subset of knowledge that suffices to define all basic relations, whereas a core is the most fundamental subset of knowledge that consists of the common attributes of all reducts.
Given a decision table
Based on indispensable relations, reduct and core are defined as follows.
The decision table, which is derived by removing all dispensable attributes from Table 2, is shown in Table 3, where “x” denotes a do-not-care value. Please note that attribute c in Table 3 is removed because that column consists of do-not-care values only. Therefore, there are only three features selected to represent the original decision table without losing any essential information.
The decision table after attribute reduction
The decision table after attribute reduction
When a training data set is given, continuous data can be represented with categorical values if separation boundaries in every input dimension are determined. After removing all dispensable attributes and merging all duplicates, a simplified decision rule base is obtained. This knowledge reduction process is actually the process of finding a reduct of the knowledge representation system constructed from the given data set. The final decision table after knowledge reduction (based on Table 2) is shown in Table 4.
The final decision table after knowledge reduction
The final decision table after knowledge reduction
Genetic Algorithm (GA) [14] is in the field of evolutionary algorithms. The idea of GA is inspired by the survival of the fittest theory proposed by Charles Darwin. GAs are searching algorithms based on the mechanics of natural selection and natural genetics [12]. GA normally starts with a randomly initialized population, which consists of artificial creatures denoted as chromosomes. Based on their fitness values, some of them are selected in pairs as parents and granted the opportunities to produce offspring by means of crossover operators. Subsequently, some survived chromosomes are randomly selected for mutation, which means their genes are to be varied. The chromosomes in the next generation are expected to perform better and the process goes on iteratively until any termination criterion is met. Although randomized, GA is not a random walk. It efficiently exploits historical information to speculate on new search points with expected improvements [12].
Because rough set theory only applies to categorical values, discretization of the training data set is required. GA is employed by our proposed model to search for optimal or satisfactory suboptimal separation boundaries in every input dimension. Different strategies that can be applied to each step of GA are not covered in this paper. However, all strategies applied to our proposed model are introduced with details in the following section.
Proposed clustering technique
Genetic Algorithm based Rough Set Clustering (GARSC) is a clustering technique, which integrates genetic algorithm and rough set theory together. Genetic algorithm is applied to determine optimal or at least satisfactory suboptimal solutions. Rough set theory is incorporated to alleviate the curse of dimensionality problem [8], which leads to unnecessarily large network sizes of many established inference systems. By applying rough set approximations, the original knowledge base is greatly reduced without losing essential information. This wonderful characteristic of rough set theory is extremely helpful to improve the interpretability [27] of an existing inference rule base, i.e., reduce the number of features used for reasoning, reduce the number of rules in the rule base, and reduce the number of arguments stated in each inference rule. Therefore, the overall proposed system achieves a high level of interpretability without sacrificing accuracy. The overall GARSC process is illustrated in Fig. 1.
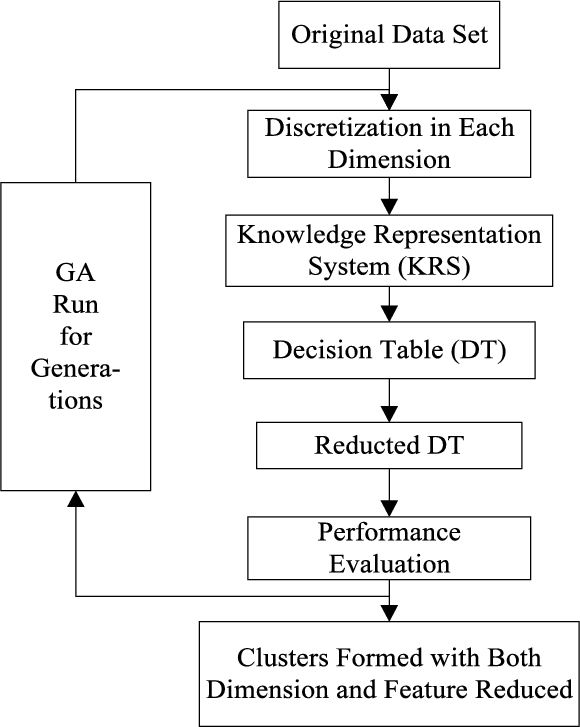
Flowchart of genetic algorithm based rough set clustering process.
Please note that up to now the inference rules are crisp decision rules and we need to transform them into fuzzy rules by generating Gaussian type fuzzy membership functions based on the clustering results and assigning corresponding linguistic terms. Subsequently, the transformed fuzzy rules are used to evaluate the performance of the current solution. This knowledge transfer concept is illustrated in Fig. 2.

Illustration of knowledge transfer from crisp rules to fuzzy ones.
The reason why Gaussian type fuzzy membership functions are utilized in our proposed system rather than other commonly adopted ones (such as triangular and trapezoidal) is that Gaussian function is continuous, which better represents the density of the cluster (see Fig. 5), and it only has two parameters (mean and standard deviation), which are easier to derive. Assume in dimension x, we define
This particular process of knowledge transfer from crisp to fuzzy cannot be omitted because the crispness of separation adopted in rough set theory does not tolerate overlapping. Fuzzy membership functions are employed to represent the derived clusters to deal with inexact information and unforeseen circumstances. This kind of knowledge transfer has a great advantage because it naturally prevents the fuzzy membership functions from overlapping or separating too much with adjacent ones, which is another important aspect of interpretability in fuzzy modeling. Furthermore, because clustering is performed in each individual feature, no transformation or normalization is required and more importantly, semantic meanings of the assigned linguistic labels are preserved.
Before the detailed introduction of GARSC, there are certain constraints on data discretization to be defined. One is the maximum number of separation boundaries allowed in each dimension. This constraint straightforwardly determines the maximum number of fuzzy membership functions allowed in each dimension. However, the actual number of fuzzy membership functions formulated in each dimension is also determined by the knowledge reduction process. The smallest number of separation boundaries actually in use is zero, which means that particular feature is not considered in the simplified knowledge base. This constraint should not be set to a large value because employing a huge number of fuzzy membership functions degrades interpretability.
The other constraint is on the minimum distance between any pair of adjacent separation boundaries in the same dimension, which is termed mindis. This constraint is imposed to make sure that the actual constructed fuzzy membership functions have high-level generalization such that any adjacent pair of them should not be merged into one. The minimum distance constraint mindis is defined in Eq. (4). The max function in the denominator defines the level of generalization.
Knowledge reduction and removal of inconsistent rules
It has been discussed earlier in this paper that after the removal of all dispensable attributes, the finalized decision table is independent, which is actually one of the many possible reducts of the originally constructed decision table. Therefore, attribute reduction is performed during the process of constructing the independent decision table with minimum cardinality. If an attribute is dispensable in all rules, then that attribute can be removed from the given data set. This process of removing attributes that do not contribute to the essential knowledge base is referred as feature selection.
Decision rule reduction is conceptually similar to attribute reduction. Other than merging each set of duplicate rules into one single rule, a decision rule in the rule set is dispensable if and only if the performance of the rule base does not decrease with the removal of that rule. This is also referred as the pruning process of decision rules. Moreover, the removal of inconsistent rules is necessary to maintain the integrity of the knowledge base.
Inconsistent rules, which are the rules with the same conditional attributes but different decision attribute, do often exist in real world applications. Only one rule from each inconsistent rule set should be preserved to remove ambiguities. To determine which rule(s) should be preserved in the simplified decision table, we propose Eq. (5) (in rough set theory terms) to compute the confidence of the kth rule. The min function is applied to penalize information incompatibility.
Based on the confidence evaluation function, the criteria to remove inconsistent rules from the decision table are defined as follows. The rule with the maximum confidence value will be preserved in the decision table while all the other rules from the same inconsistent rule set will be removed. If multiple rules are tied at the maximum confidence value in the same inconsistent rule set, the rule covers the most number of data elements is preserved. If multiple rules still tie in this situation, a random rule will be selected as the winner with equal probability.
Proposed genetic algorithm strategies
As mentioned earlier in this paper that all strategies of genetic algorithm applied to our proposed clustering method is introduced with details in this subsection.
Commonly adopted strategies
In genetic algorithm, the population size defines the total number of chromosomes existing in each generation. Increasing the population size is equivalent to increasing the number of possible solutions. Therefore, more candidates will be examined, and a wider range of area in the universe of discourse will be explored.
In GARSC, real number coding strategy is employed to construct chromosomes. Each gene used in the chromosome represents a separation boundary in its respective dimension. Because GARSC technique only constrains the maximum number of partitions allowable in each dimension, hence, the actual number of partitions varies, i.e., chromosomes in GARSC have different lengths.
In GARSC, elitism replacement strategy is applied to exploit solutions that have been evaluated before. The elitism ratio μ, which is in the
The overall clustering process stops when genetic algorithm reaches the predefined number of generations, which should sufficiently ensure the convergence of the genetic algorithm.
Fitness evaluation function
Fitness function evaluates the quality of each chromosome. It is probably the most important component in genetic algorithm, because it directly defines the performance of each chromosome and intimately characterizes the ideal solution that the user attempts to search for. Based on the nature of the bank failure prediction problem, we propose our fitness function f in Eq. (6). We use capital letters to represent constants and small letters to represent variables. Term-1 and term-3 in Eq. (6) represent the accuracy of the model and term-2 represents the interpretability because it is the score on the number of derived fuzzy rules. This fitness function is to be minimized by the genetic algorithm.
We propose three terms that evaluate two different types of performance in the fitness function. The employment of this type of fitness function is one way to implement a multi-objective genetic algorithm [7]. The three terms in Eq. (6) are placed in descending order of importance and the proof is given as follows.
Term-1 of Eq. (6) can be expanded into Eq. (8).
If the number of correctly classified data elements decreases by one, i.e.,
Comparing Eq. (8) to Eq. (9), if all the other terms in Eq. (6) remain unchanged, then the fitness value is increased by
Similarly, we can find that if one more rule is employed in the inference knowledge base, i.e.,
By substituting Eq. (7), we can rewrite term-3 of Eq. (6) into Eq. (10).
Because we are evaluating the effect of the slightest change of Eq. (10) while the other two terms of Eq. (6) remain unchanged, we can say that the classification accuracy and interpretability of the constructed model do not vary, but there is a small increase in the mean squared error. The amount of the slightest change is assumed to be smaller than one (if only one predicted value among all the data elements is computed differently without changing the classification accuracy). It is also obvious that
Thus, the complete proof has been given that the amount of effect decreases along the three terms of Eq. (6). Term-1 ensures the correctness of the constructed model and term-2 encourages the constructed model to achieve the same level of accuracy by using lesser number of rules. A higher level of interpretability with the same level of accuracy constructs better model because a higher level of generalization is achieved to prevent the model from over-fitting. Term-3 refines the constructed model to achieve a better fitting on the given data set as long as accuracy and interpretability are kept unchanged. Please note that although evaluations on feature selection and attribute reduction are not introduced in the fitness function (the number of features selected and the number of arguments employed in each inference rule are less concerned by the financial experts because they run regressions on all available features), GARSC still performs those two processes to optimize the inference rule base for a higher level of interpretability.
Tournament selection strategy
To produce new chromosomes, parents with high fitness values are selected from the current generation to produce offspring in the next generation. Tournament selection strategy [24] is employed in GARSC because we can easily control the selection stress by adjusting only the tournament size m and the selection probability p.
For each chromosome to be selected for crossover, m candidates are randomly selected from the current generation for consideration and they are sorted in descending order based on their fitness values. The selection process starts with the first candidate and the probability of selecting the nth candidate
If m is large, it is more stressful for lesser fit candidates to be selected. On the other hand, a small tournament size increases the probability of lesser fit candidates being selected as they are competing with a lesser number of the others. In general, a large value of m is used in simple and unimodal application domains to accelerate the converging process and a small value of m is used in complex and multimodal application domains to better explore the universe of discourse [24].
In the early generations of GA, p should be set to a small value to give more chances to those lesser fit candidates to get selected. In this way, the search is prevented from premature convergence because more possible candidates are considered even if they have smaller fitness values. However, in the late generations, p should set to a large value, because only those highly fit candidates are expected to lead the selection towards the best solution in more in-depth exploitation. Tournament selection probability p in GARSC is defined by Eq. (12).
Modified uniform crossover operator
When sufficient number of parents has been selected, the crossover operator is applied to each pair of parents to produce offspring. The probability for a pair of selected parents eventually mate is defined as the crossover rate. However, because elitism replacement strategy is applied in GARSC, the crossover rate is set to one, i.e., every pair of parents is crossovered to produce offspring. Because chromosomes in GARSC consist of real number coded genes to represent sets of separation boundaries, which are different in length, there is no simple crossover operator feasible to perform the proposed information exchange between the selected parents.
A modified uniform crossover operator is proposed to deal with chromosomes of different lengths. Similar to conventional uniform crossover operator, a binary string is randomly created to control in each position, from which parent the child should inherit the gene. The length of the control string is assigned to the number of conditional attributes in the given data set. Therefore, there will be no risk taken on the misunderstanding of the dimensionality during the creation process of offspring. The modified uniform crossover operator is illustrated in Fig. 3.
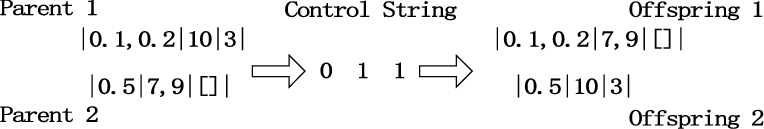
Illustration of the proposed modified uniform crossover operator.
Because feature selection is applied in GARSC, many chromosomes have no gene in certain input dimension as indicated with the empty brackets “
The network architecture of our proposed GARSINFIS model.
Unlike conventional mutation operators, which simply vary the values of the selected genes, a set of three different mutation operators is proposed in GARSC. Whenever a gene is selected to be mutated, one of the following three operators are performed with equal probability:
Add one separation boundary to the gene if possible;
Remove one separation boundary from the gene if possible;
Vary the value of a randomly selected separation boundary in the gene if possible.
Similar to tournament selection probability p, the mutation rate mrate, which defines the probability for each gene to be mutated, should increase from a small value in the early generations to a large value in the late generations. Based on this policy, mrate is defined in Eq. (13).
Proposed system architecture
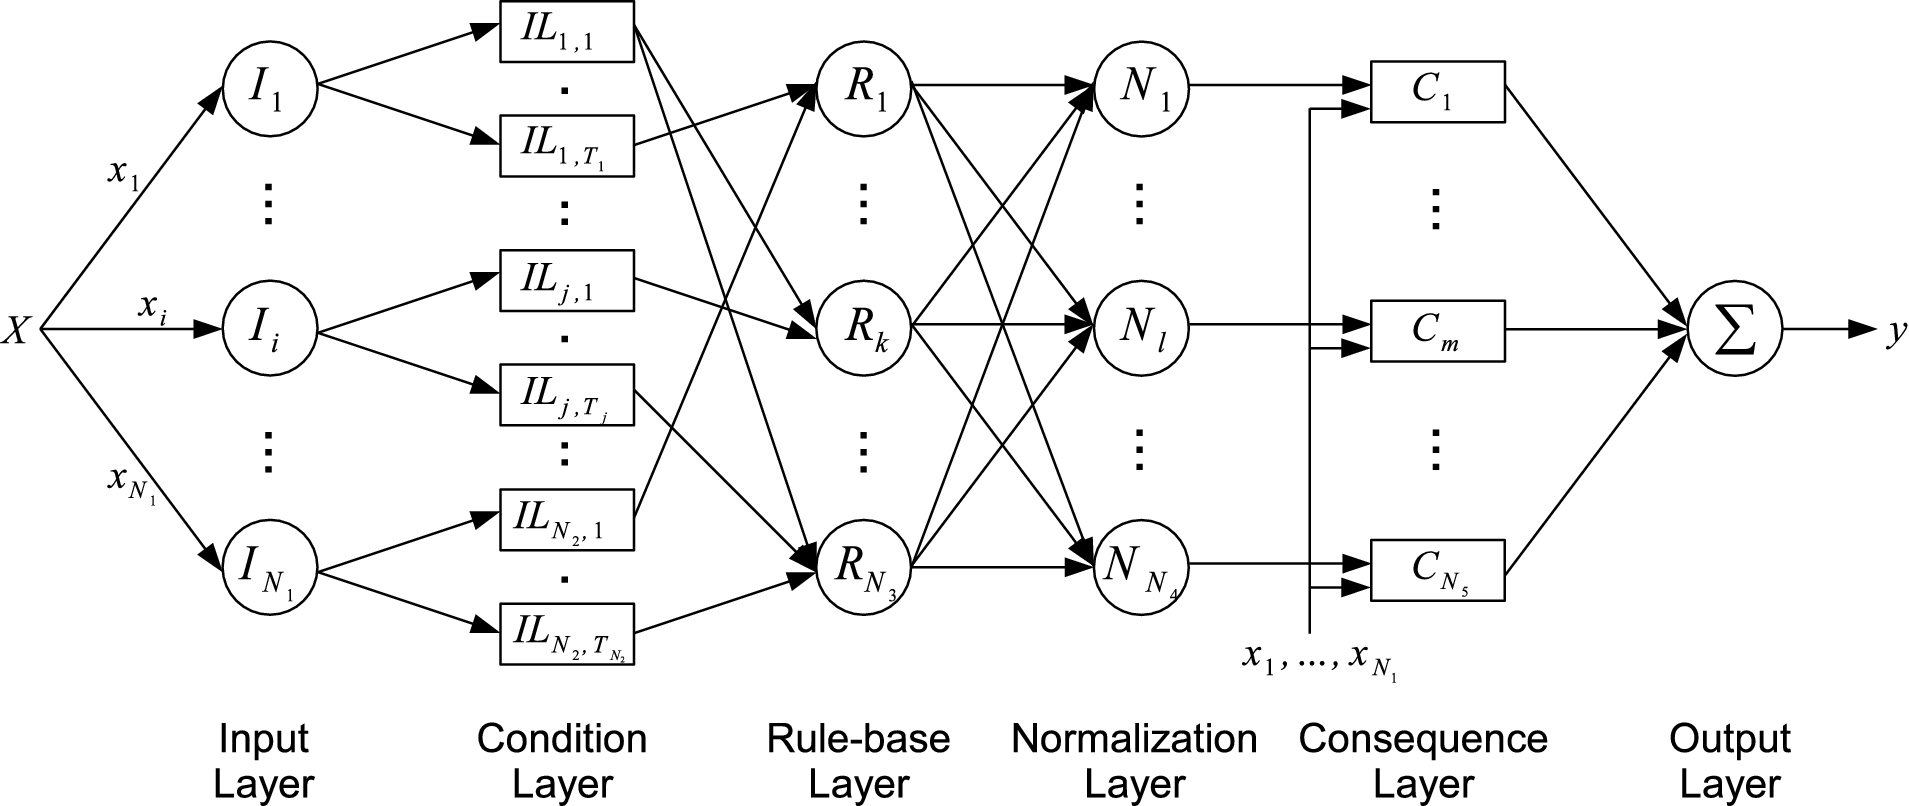
The architecture of Genetic Algorithm and Rough Set Incorporated Neural Fuzzy Inference System (GARSINFIS) is illustrated in Fig. 4. GARSINFIS is a six-layered, feed-forward, and partially connected architecture. In each layer, neurons are not connected to each other, but only connected to neurons in the adjacent layer(s).
Each layer of GARSINFIS performs respective fuzzy or non-fuzzy operations, which are described as follows. Input layer receives the input data vector and translates it into fuzzy singletons in each dimension. Because feature selection is applied, not all given linguistic variables are presented to the connected neurons in the next layer. Condition layer stores respective fuzzy membership functions with respect to each selected linguistic variable and subsequently presents the activation values to the connected neurons in the next layer. Rule-base layer performs fuzzy reasoning and subsequently presents the activation value of the corresponding fuzzy rule to all the neurons in the next layer. Normalization layer scales the activation values of all fuzzy rules to the same level of reference and subsequently presents the normalized values to the connected neuron in the next layer. Consequence layer computes the prediction of each rule and subsequently present it to the only neuron in the next layer. Output layer consists of only one neuron, which aggregates all the inputs received and presents the result as the overall inference output.
In Fig. 4, the rectangular boxes used to represent neurons in condition layer and consequence layer denote the antecedent and consequent parts of the employed fuzzy rules respectively. Because this paper focuses on bank failure prediction, which has a relatively high accuracy rate, GARSINFIS employs zero-order TSK type of fuzzy rules [36,37] to achieve the maximum level of interpretability by minimizing the consequent part of each fuzzy rule. Zero-order TSK type of fuzzy rule is functionally equivalent to Mamdani type of fuzzy rules [23] if fuzzy singletons are used for simplicity [43]. Both types of simple fuzzy rules can be defined by Eq. (14).
Because zero-order TSK type of fuzzy rule is employed for a higher level of interpretability, the general function of mapping input
When the implication operator is selected as the min operator, then
Input features of bank failure prediction data set
Input features of bank failure prediction data set
Because GARSINFIS directly employs the fuzzy rules derived by Genetic Algorithm based Rough Set Clustering (GARSC) technique, GARSINFIS self-organizes its network structure. Moreover, because GARSC systematically derives simplified fuzzy inference rules, the network size of GARSINFIS is smaller than that of the other similar models such as ANFIS [15]. Unlike ANFIS, GARSINFIS is not fully connected. Because feature selection is performed, not all input dimensions in the given data set are utilized. Because the maximum number of fuzzy membership functions in each dimension is constrained by GARSC, the number of neurons employed to represent the derived membership functions is also constrained. Because attribute selection in the antecedent part of fuzzy rules is performed, the derived fuzzy rules may not necessarily employ all the fuzzy membership functions in every selected dimension. Because rule pruning is performed during the clustering process, the number of neurons used to represent the fuzzy rule set is also minimized. The compact GARSINFIS architecture is now ready for performance evaluations to predict bank failures.
Bank failure prediction data set
The bank failure prediction data set used in this paper is extracted from the financial statements of 3635 banks in United States, which are publicly available [10]. Based on the annual financial statements, nine financial covariates are extracted to categorize whether a bank has failed or survived. The selected features are inspired by the works of financial experts [5,19]. All the nine selected financial covariates are listed in Table 5 with their expected impacts on bank failures. Most financial experts in banking finance run regressions on these covariates. However, it is stated in [41] that soft computing models overcome the deficiencies of traditional statistical models whose results do not possess semantic meanings. The data set used in this paper has been analyzed by different NFISs in the literature [25,30,39–41] for different purposes with different configurations. In this paper, we focus on the balance between accuracy and interpretability (not studied in the previous works) of the constructed model and the effectiveness to generate early warnings for potentially failing banks.
Design of experiments
The objective of the experiments is to evaluate the capability of GARSINFIS to systematically derive a small number of rules from the training data set and subsequently perform accurate inferences on a large number of unforeseen instances. Sensitivity and specificity, which are defined in Eqs. (17) and (18) respectively, are reported besides accuracy on the testing data set. In bank failure prediction, sensitivity is critical because successful early warnings of poor performing banks buy more time to prevent unnecessary consequences and specificity is critical because false alarms to good performing banks create unnecessary panics.
There are three scenarios studied in this bank failure prediction application. Numbers of all available data samples in each scenario are listed in Table 6. In scenario-1, each model actually identifies whether a bank is failed. While in scenario-2 and scenario-3, each model predicts whether a bank will fail in one and two years respectively.
Data distributions in the bank failure prediction data set
Data distributions in the bank failure prediction data set
To demonstrate that GARSINFIS utilizes only the most essential knowledge to perform accurate inferences, in each scenario and in each experiment, 100 instances from each class are randomly selected for training and all the other instances consist of the testing data set. In such a way, the ability to derive a correct inference knowledge base from a relatively small training data set is ultimately assessed. Please note that the fuzzy rules derived by GARSC are of zero-order TSK type without adaptively tuning the parameters of Gaussian membership functions. Instead, only numerous sets of membership functions and fuzzy rules are iteratively evaluated and the set with the most promising performance is used to construct the system when GA terminates.
Summary of applying GARSINFIS on bank failure prediction scenario-1 data set
Nof: number of features; Nor: number of rules; Noa: number of (total) arguments.
For all scenarios and all experiments (10 experiments are conducted in each scenario to remove randomness and to assess the stability), the population size of GA is set to 300 and the number of generations is set to 20. Elitism ratio is set to 0.1, which means in every generation, 30 chromosomes with the highest fitness values are directly brought into the next generation. Tournament size is set to 2 to ease the stress during selection. The maximum number of separation boundaries allowed in any input dimension is set to 2. Therefore, the maximum number of fuzzy membership functions in any input dimension is 3. This guarantees a high level of interpretability because there are at most three linguistic labels, small, medium, and large, assigned in any input dimension. The number of control parameters or constraints required by GARSINFIS to automatically obtain optimal or satisfactory suboptimal solutions is limited. GARSINFIS systematically construct simple yet accurate inference rule base without human intervention and expert guidance.
When presenting the experimental results, other than accuracies (including sensitivity and specificity) on the testing data sets and training time spent, other measures such as the number of employed features, rules, and arguments are also recorded for comparison purposes. The number of features utilized by GARSINFIS is the actual number of features selected from the given data set to perform inferences. The number of rules employed by GARSINFIS is the actual number of rules in the simplified rule set after the removals of redundancies and inconsistencies. The number of arguments is defined by the total number of arguments in the antecedent part of all the employed rules after attribute reduction.
When benchmarking the experimental results, some well-established models such as C4.5 decision tree [31], Naive Bayes classifier [32], Multi-Layer Perceptron (MLP) network [13], Radial Basis Function (RBF) network [13], Adaptive Network-based Fuzzy Inference System (ANFIS) [15] and Dynamic Evolving Neural-Fuzzy Inference System (DENFIS) [17] are used for comparisons. All these models are applied to the same pairs of training and testing data sets, which are applied to GARSINFIS. In this way, their performances are fairly compared on the same references.
In terms of comparisons on the selected features, only GARSINFIS and C4.5 decision tree are discussed, because all the other models utilize all given features without preferences. Even if the associated weights of certain input dimensions can be significantly small in some models, it is still not considered as feature selection.
In terms of the size of the employed rule set, the actual number of employed rules is recorded for GARSINFIS, ANFIS, and DENFIS. For C4.5 decision tree, the number of tree leaves is recorded because it is equivalent to the number of crisp decision rules. For Naive Bayes classifier, the number of rules is not applicable. For MLP network, the number of hidden neurons, which is systematically determined by the total number of input dimensions and the number of output classes, is recorded. For RBF network, the number of radial basis neurons, which is pre-determined by the number of clusters in every output class, is recorded.
In the comparison tables, the winner of any particular column is highlighted in bold. The winner is either the largest accuracy value or the least amount of information employed. Because multiple experiments are conducted on each model for each scenario, stability (standard deviations) of every model is also recorded and compared. Winners in stability are also highlighted in bold.
In this paper, ANFIS utilizes clustering results derived by the employed Fuzzy C-Means (FCM) clustering technique [4]. In this way, ANFIS is more comparable to GARSINFIS because the number of rules employed by ANFIS is greatly reduced. However, extra efforts are taken to carefully select the optimal number of pre-defined clusters through trial-and-error. This is a great disadvantage of ANFIS, because its network structure is not self-organized, but has to be pre-defined by employing additional knowledge. The Evolving Clustering Method (ECM) [35] employed by DENFIS constructs clusters based on the distances between data samples in the high-dimensional space. ECM often derives a large number of clusters and as a result DENFIS employs a large number of rules. Generally speaking, DENFIS often fails to alleviate the curse of dimensionality problem [8].
Scenario-1: Last year available
Table 7 reports the performance of GARSINFIS on bank failure prediction scenario-1 data set. On average, GARSINFIS utilizes 4 input features and employs 4.9 rules (3 negative ones and 1.9 positive ones) to achieve 96.49% accuracy on the testing data sets. Each rule employs averagely

One set of the derived fuzzy membership functions of bank failure prediction scenario-1 data set. (a) Derived membership functions on CAPADE. (b) Derived membership functions on PLAQLY. (c) Derived membership functions on GROWLA.
One set of the derived fuzzy rules of bank failure prediction scenario-1 data set
Benchmarks on bank failure prediction scenario-1 data set
Experiment-5 utilizes three input features and two rules for each class to achieve the accuracy of 97.21% on the testing data set. It is more encouraging to learn that the rules shown in Table 8 are consistent with the expert knowledge presented in Table 5 that if CAPADE and GROWLA are large and PLAQLY is small, then the probability of bank failure is small. Therefore, Fig. 5 and Table 8 present an excellent example of how GARSINFIS constructs a highly comprehensive yet accurate fuzzy inference rule base.
Table 9 reports the performance comparisons of GARSINFIS against other benchmarking models on bank failure scenario-1 data set. In terms of accuracy, ANFIS performs the best, but it has the lowest sensitivity. In bank failure prediction application, sensitivity is more important than specificity because the consequence of no early warnings is more serious than that of false alarms. Therefore, although ANFIS achieves the highest accuracy on the testing data set, it is not the most reliable model in this particular application. MLP also performs better than GARSINFIS. However, trained MLP network does not possess semantic meanings of the inference process. In terms of interpretability, C4.5 decision tree utilizes the least number of input features. However, its accuracy is lower than that of GARSINFIS and it employs more number of rules than GARSINFIS does. ANFIS employs the least number of rules. However, it utilizes all the input features and requires extra efforts to determine the number of clusters for the employed FCM clustering technique through trial-and-error. Based on the benchmarks on bank failure prediction scenario-1 data set, GARSINFIS does not lead in any performance measure yet. We can only state that the performance of GARSINFIS is satisfactory and it needs to be further evaluated on more challenging scenarios.
Table 10 reports the performance of GARSINFIS on bank failure prediction scenario-2 data set. Comparing Table 10 to Table 7, performance of GARSINFIS decreases because accuracy decreases with more number of features utilized, more number of rules employed, and more computational time spent. However, this is within expectation because prediction of bank failures is naturally more difficult based on one year prior data. On average, GARSINFIS utilizes 5.1 input features and employs 7.9 rules (5 negative ones and 2.9 positive ones) to achieve 92.39% accuracy on the testing data sets. Each rule employs averagely
Summary of applying GARSINFIS on bank failure prediction scenario-2 data set
Summary of applying GARSINFIS on bank failure prediction scenario-2 data set
Nof: number of features; Nor: number of rules; Noa: number of (total) arguments.
Benchmarks on bank failure prediction scenario-2 data set
Table 11 reports the performance comparisons of GARSINFIS against other benchmarking models on bank failure scenario-2 data set. In terms of accuracy on the testing data set, ANFIS and MLP again perform better than GARSINFIS, but their sensitivities are lower than that of GARSINFIS, which achieves the highest value among all models. Although Naive Bayes classifier also performs better than GARSINFIS on accuracy, Naive Bayes classifier is not reliable to generate early warnings to potentially failing banks because its sensitivity is the lowest among all models. In terms of interpretability, C4.5 decision tree utilizes a slightly lesser number of input features and the same number of rules when comparing to GARSINFIS. However, C4.5 decision tree performs worse on every accuracy measures. Again, ANFIS employs the least number of rules. However, it utilizes all the input features, requires extra efforts through trial-and-error and is not reliable because its sensitivity is low. By employing a compact inference knowledge base, GARSINFIS achieves the highest sensitivity and satisfactory specificity on bank failure prediction scenario-2 data set.
Summary of applying GARSINFIS on bank failure prediction scenario-3 data set
Nof: number of features; Nor: number of rules; Noa: number of (total) arguments.
Benchmarks on bank failure prediction scenario-3 data set
Table 12 reports the performance of GARSINFIS on bank failure prediction scenario-3 data set. Comparing Table 12 to Table 10, performance of GARSINFIS further decreases because prediction of bank failures is naturally even more difficult based on two years prior data. On average, GARSINFIS utilizes 6.1 input features and employs 10.9 rules (6.8 negative ones and 4.1 positive ones) to achieve 89.91% accuracy on the testing data sets. Each rule employs averagely
Table 13 reports the performance comparisons of GARSINFIS against other benchmarking models on bank failure scenario-3 data set. The performance comparisons of different models are similar to that of Table 11, except that DENFIS performs better than GARSINFIS in terms of accuracy and specificity. However, DENFIS is less reliable than GARSINFIS because DENFIS has lower sensitivity. Moreover, DENFIS utilizes all input features and employs
Summary of selected features on bank failure prediction data sets
Summary of selected features on bank failure prediction data sets
In the bank failure prediction application, although only number of rules is defined in the fitness function besides accuracy terms, GARSINFIS still utilizes a relatively small number of features and a small number of arguments (no more than 3 on average) in the antecedent part of each rule. High level of interpretability is achieved. Although it employs a slightly larger amount of knowledge, GARSINFIS outperforms C4.5 decision tree in almost every accuracy measures (only lower sensitivity in scenario-1). This implies that GARSINFIS performs better than C4.5 decision tree on the inference process of unforeseen data. Moreover, this is a possible piece of evidence that fuzzy rules employed by GARSINFIS perform better than crisp rules employed by C4.5 decision tree. Based on Fig. 5 and Table 8, we are proud to state that GARSINFIS automatically obtains highly interpretable fuzzy rules that match the expert knowledge. Furthermore, when comparing against other benchmarking models, GARSINFIS systematically constructs simple yet accurate fuzzy inference rules without human intervention and expert guidance and are highly reliable (high accuracy and sensitivity) and comprehensible (compact knowledge base) to human users.
Performances of all models decrease with an increase of the prediction time of bank failures. GARSINFIS utilizes more number of features and employs more number of rules to deal with the increasing complexity. It is encouraging to learn that GARSINFIS becomes more reliable with the increase of the prediction time because more positive rules are employed to achieve the highest sensitivity among all models. In bank failure prediction, sensitivity is more critical than specificity. Hence, GARSINFIS is the most reliable model (it generates the most number of correct early warnings to failing banks) to predict bank failures in one or two years’ time.
Table 14 summarizes the input features selected by GARSINFIS and C4.5 decision tree. If a feature is utilized more than half of the time, then its value is highlighted to denote the importance. Although in all the three scenarios, GARSINFIS utilizes more number of input features than C4.5 decision tree, features selected by GARSINFIS are more concentrated. Among all nine financial covariates, CAPADE and PLAQLY are utilized in all GARSINFIS experiments and most C4.5 decision tree experiments. It is also noteworthy that PLAQLY in the Asset (Loan) Quality category (see Table 5) is significantly selected more times than the other two features in the same category and ROE in the Earnings category is significantly selected more times than NINMAR in the same category. Because financial covariates in the same category are highly correlated, they often contain highly overlapped knowledge. Therefore, feature selection and attribute reduction is necessary and desired for a simple yet accurate inference rule base and GARSINFIS is shown to be reliable by employing such a compact knowledge base.
It is stated earlier in this paper that there are other NFIS models applied to the same bank failure prediction data set for different purposes with different configurations. Their performances are not compared and benchmarked again in this paper, but we highlight their pros and cons as follows. Tung et al. [41] first study this data set and compare their results to the traditional Cox’s model [5]. Although the results are promising, the systematically generated trapezoidal shaped fuzzy membership functions overlap too much between each other and the number of fuzzy membership functions are unnecessarily large in some features (there are seven membership functions defined in GROWLA while only two defined by GARSC as shown in Fig. 5). Tan et al. [39] study this data set and compare their results to five other models. Although they managed to achieve 100% specificity and utilize simple fuzzy rules, the average sensitivity is less than 53%. Furthermore, the fuzzy membership functions overlap too much between each other and the number of fuzzy membership functions are unnecessarily large in some features (there are seven membership functions defined in CAPADE while only three defined by GARSC as shown in Fig. 5). Teddy et al. [40] study this data set and compare their results to four other models. Although the results are promising and improvements are clearly shown, the architecture employs a large number of synthesized memory cells (over 6000), which are impossible for human users to comprehend. Nguyen et al. [25] study this data set using a bio-inspired architecture, but the architecture still employs a large number of memory cells, which are incomprehensible. Quek et al. [30] study this data set with different configurations on the formation of training data sets. However, their sensitivity is significantly worse than specificity (especially for the two years prior scenario). Generally speaking, when comparing to the above mentioned models, GARSINFIS maintains a well balance between sensitivity and specificity, achieves highly competitive overall prediction accuracy and has an outstanding level of interpretability.
Conclusion and future work
Bank failure prediction is an important study to a bank’s policy-makers, regulators and clients, especially when there is an increasing number of deteriorating or failed banks in the past several years. Generally speaking, bank failures are normally due to financial distress and it is believed that financial distress does not develop out of the blue. The deterioration of the financial condition of distressed banks can be observed over time. Thus, the performance of a bank may be tracked and studied from its annual financial statements over a period of time. Many traditional statistical methods are applied to predict bank failures in the literature. However, they cannot explicitly specify what constitutes a financial distress and the intrinsic relationship between financial distress and failed banks. In this paper, we propose a novel neural fuzzy inference system to function as an early warning system, which is able to identify the inherent traits of financial distress based on nine financial covariates derived from publicly available annual financial statements. In contrast to other benchmarking models, our proposed early warning system provides a great level of interpretability and a highly competitive level of accuracy.
Our proposed self-organizing model is denoted as Genetic Algorithm and Rough Set Incorporated Neural Fuzzy Inference System (GARSINFIS), which utilizes the inference rule base automatically obtained by our proposed Genetic Algorithm based Rough Set Clustering (GARSC) technique. To systematically construct an early warning system, users only need to define a limited number of control parameters and constraints and there are no human intervention and expert guidance required. Empirical studies on the prediction of bank failures using GARSINFIS show encouraging results. GARSINFIS is shown to be a reliable system because it generates the most number of correct early warnings to failing banks in one or two years’ time. It is also shown that the inference rules employed by GARSINFIS are accurate and straightforwardly comprehensible to all users because the rule base is compact. Furthermore, it is encouraging to learn that the employed rules are consistent with expert knowledge and the selected features are representative in their respective financial categories. Although genetic algorithm (an iterative optimization process) is incorporated, we managed to obtain a competitive level of prediction accuracy within 34 min of training time (testing time is negligible). In summary, GARSINFIS maintains a well balance between sensitivity and specificity, achieves a highly competitive overall prediction accuracy, and has an outstanding level of interpretability. GARSINFIS is definitely in the front of the queue, which consists of all competent early warning systems to predict bank failures.
Although empirical results show the capability of GARSINFIS, further improvements are still required for more accurate prediction of bank failures. One possible improvement is to include more features other than the financial covariates used in this paper. For instance, Sarkar and Sriram [33] use several audit evidences such as the bank size, ownership characteristics, and management deficiencies to predict bank failures. Another possible improvement is on the formation of membership functions. As the statistical models do, we also assume the financial covariates are normally distributed. However, they are actually positively skewed [6]. Using membership functions with asymmetric geometry is expected to better describe the actual data distribution. A possible approach is to employ asymmetric Gaussian type of membership function [21], which allows two different widths defined on the opposite sides of the center. In the future, we will continue to improve GARSINFIS for a better prediction of bank failures and we will apply GARSINFIS to other financial forecasting applications as well.