
Abstract
Perthes’ disease is a destructive hip joint disorder characterized by malformation of the femoral head in young children. While the morphological changes have been widely studied, the biomechanical effects of these changes still need to be further elucidated. The objective of this study was to develop a method to investigate the biomechanical alterations in Perthes’ disease by finite element (
Introduction
Perthes’ disease is a childhood disorder primarily affecting the femoral head of the hip joint. During the course of the disease, the femoral head undergoes a significant loss of bone mass leading to gradual deformation, collapse, and loss of sphericity. Perthes’ disease, if left untreated, can lead to inequality of leg length, reduced muscle size, bone fracture, severe pain and arthritis [1]. Perthes’ disease is not a common musculoskeletal disorder. The epidemiological record indicates the annual incidence rate ranges from 0.4 per 100,000 to 29 per 100,000 children under 15 years of age [2,3]. The precise etiology of the disease remains unclear despite of many years of research [1,4]. However, it is demonstrated that the interruption of the blood supply network to the hip joint contributes significantly to the structural changes on the developing femoral head [5]. The prevailing consensus is that, Perthes’ disease is a multifactorial disease in which various genetic and environmental factors may contribute to the disruption of blood supply, i.e. thrombophilia or abnormal blood clots, bone fracture, maternal smoking and genetic mutations [4]. Understanding the underlying biomechanical alterations of Perthes’ disease is crucial to attain an effective clinical management. Several studies have investigated the biomechanical alterations of Perthes’ disease through finite element modeling. It is worth to note the pioneering studies on finite element modeling of Perthes’ hips conducted by Brown et al. [6,7]. Using two-dimensional finite element model of the femurs, they investigated the load transfer on necrotic hips and found that the region of intact bone surrounded by necrotic bone takes up extra loads. They also found the two distinct locations of failure in a form of bone collapse, i.e. at the necrotic subchondral bone layer and cancellous bone in the deeper region near the necrotic-intact cancellous bone interface. Ueo et al. [8] conducted a study on two-dimensional finite element model of a hip joint to examine the role of swelling articular cartilage on the development of Perthes’ disease. They concluded that swelling of the articular cartilage by an increase in the imbibitional pressure contributed to increase in stresses within the epiphysis, which could lead also to destruction of the epiphyseal bone. Another study by Ueo et al. [9] also strengthened the hypothesis that cartilage swelling did not only intensify the stress level but also altered the stress distribution particularly the concentration of the stress in the lateral portion of the epiphysis. Brown et al. [10] conducted three-dimensional finite element modeling of the femoral bone to test whether an uncompromised subchondral plate could provide stress protection to a weakened underlying segmental infarction. Their findings suggest that a fully healthy subchondral plate did not provide stress protection to the weakened infarction in the cancellous region. On the contrary, weakening of the necrotic cancellous bone in the infarction region markedly increased the stresses in the overlying subchondral plate. Yang et al. [11] investigated the influence of the size of the necrotic portion on the stress distribution in the femoral head. Their study showed that Perthes’ disease tends to become more aggravated when it becomes severe as indicated by the proportional increase of the maximum stress and size of necrotic bone. Furthermore, a recent study conducted by Volokh et al. [12] on prediction of femoral head collapse in osteonecrosis patients suggests that the deteriorating cancellous bone is unable to prevent the cortical shell from buckling and the critical pressure decreases together with the decreasing stiffness modulus of the necrotic bone. All of these studies helped deepen the understanding of the biomechanical consequences of Perthes’ disease. However, some of these finite element studies were only two-dimensional [6–9], assumed axisymmetric and idealized femoral head geometry [11,13]. The loss of femoral head sphericity and axisymmetry imply that Perthes’ disease affects the femoral head in three-dimensions. Thus, a better understanding of the biomechanical alterations of Perthes’ disease can be achieved only if the three-dimensional change in femoral head geometry is included. The various contact pressure patterns obtained by Anderson et al. [14] suggest that the load transfer mechanism of the hip joint can be realistically attained by contact modeling rather than by individual modeling of the femur without the articulating tissues. However, previous three- dimensional studies did not perform contact modeling [10,15]. In the study of Yang et al. [11], they applied the hip load to a uniform and single contact area. This assumption may not reveal the real contact mechanism because the contact areas in a malformed hip may in fact consist of several disconnected contact area which may be also dependent on the geometry of the articulating surfaces (can vary individually or patient-specific) and the magnitude of applied load or displacement. Thus, finite element analysis through contact modeling is required to obtain the actual contact mechanics of the hip joint. Although it has already been well established by numerous studies that the shape of necrotic bone in the femoral head is irregular [16–19], previous studies [11,12,20–22] still assumed that the necrotic bone in the femoral head is a regular conical shape. Furthermore, these previous studies on Perthes’ disease did not include the actual geometry of the femoral and acetabular cartilages. Excluding the real shape of the cartilages from the model may alter the contact mechanics of the hip joint. Indeed, recent studies on contact modeling of the healthy human hip joint showed that the thickness of the cartilage have the greatest effect on the contact mechanics because the peak pressure were overestimated when a uniform cartilage thickness was assumed and implemented to a subject-specific bone geometry [23,24].
In order to include the actual shape of the articulating cartilages and bones, the main objective of this study was to develop a method to investigate the biomechanical alterations in a Perthes’ hip joint by finite element contact modeling using MRI. The MRI slices were used to obtain the three- dimensional geometry of the acetabular and femoral cartilages, likewise the femur, pelvis, and necrotic bone in the femoral head. The influence of the increase in displacement to the shape and amount of the contact area was investigated. The biomechanical alterations such as the changes in location of stress concentrations, displacement, load-bearing capacity and contact area in the Perthes’ hip were determined.
Methods
Three-dimensional solid modeling
The study was conducted in accordance with the Danish regulatory requirements and legislation. Planar radiographs were taken from an 8-year old female (30 kg) of the pelvic bone as shown in Fig. 1. This shows an acetabular index of 13 degrees on both healthy and the diseased hip while Reimer’s migration index of 8% on the healthy hip and 26% on the diseased hip. This validates that the diseased hip does not have secondary acetabular dysplasia. The patient is classified as Herring type B and Stulberg type IV–V. There were some signs of lateral subluxation and a lateral hump. This led us to an indication of surgery where osteotomy for femoral varisation was performed. The imaging data from the patient was carried out as part of the clinical treatment protocol, and their acquisition therefore did not pose additional risk to the patient who participated in this study. The MRI data of a unilateral Perthes’ case were obtained. The patient’s left hip was healthy (unaffected) while the right hip was affected by Perthes’ disease (Fig. 2(a)). In order to standardize the three-dimensional coordinate system, the positive x-axis, y-axis, and z-axis are directed toward the left lateral side, posterior, and superior direction, respectively. The MRI data of both hips were used to develop the three-dimensional solid models. The slice thickness of the MRI data at the frontal plane was 0.8 mm. The field of view was 250 mm × 171 mm and the pixel size was 0.784 mm/pixel. A set of MRI DICOM images was imported into ScanIP +FE 5.1 (Simpleware Ltd., Exeter, UK) to segment the necrotic bone in the femoral head, pelvic bone, acetabular cartilage, femoral cartilage, and femoral bone (Fig. 2(b) and Table 1). The segmentation process of the tissues was supervised and validated by a senior orthopaedic surgeon (one of the authors C. Wong). The location of the necrotic bone in the unilateral Perthes case was identified as the resorbed bone compared to the healthy hip. A series of points were selected covering the area where the necrotic bone appears bright on the image. All image slices were analyzed to compare both healthy and diseased hip to segment the necrotic bone. The adjacent image slice were also checked to confirm the continuity of bone necrosis on each image slice before the necrotic area is segmented. The segmented parts were exported to SolidWorks 2013 (Dassault Systèmes SolidWorks Corp., Massachusetts, USA) as a Point Cloud data (∗.xyz) (Fig. 2(c)). The automated noise removal feature of the ScanTo3D tool was used to remove the surface artefacts. The Point Cloud data of each tissue was converted into the three-dimensional solid model (Fig. 2(d)). The solid models were exported from SolidWorks to Comsol using the SolidWorks LiveLink Interface™.
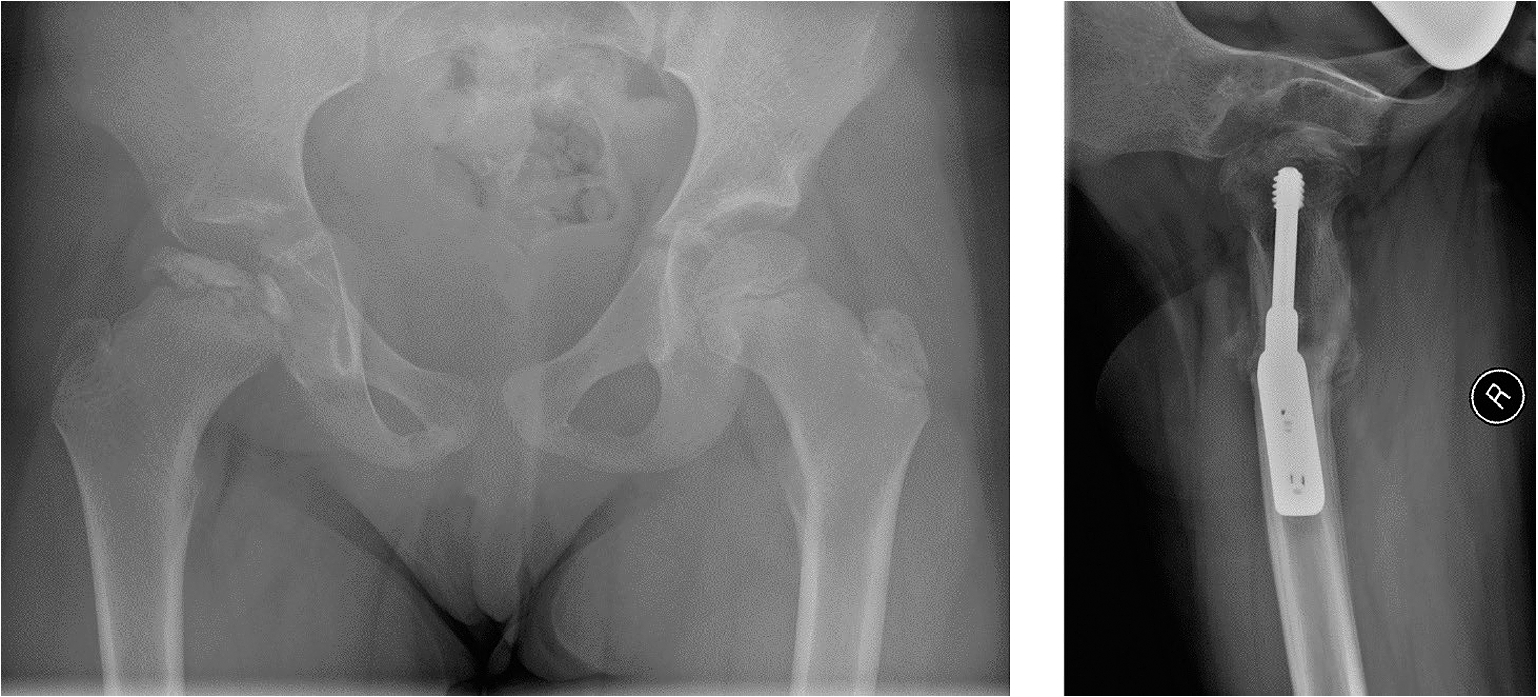
Frontal radiograph of the Perthes patient (left). Postoperative lateral radiograph of the patient (right).
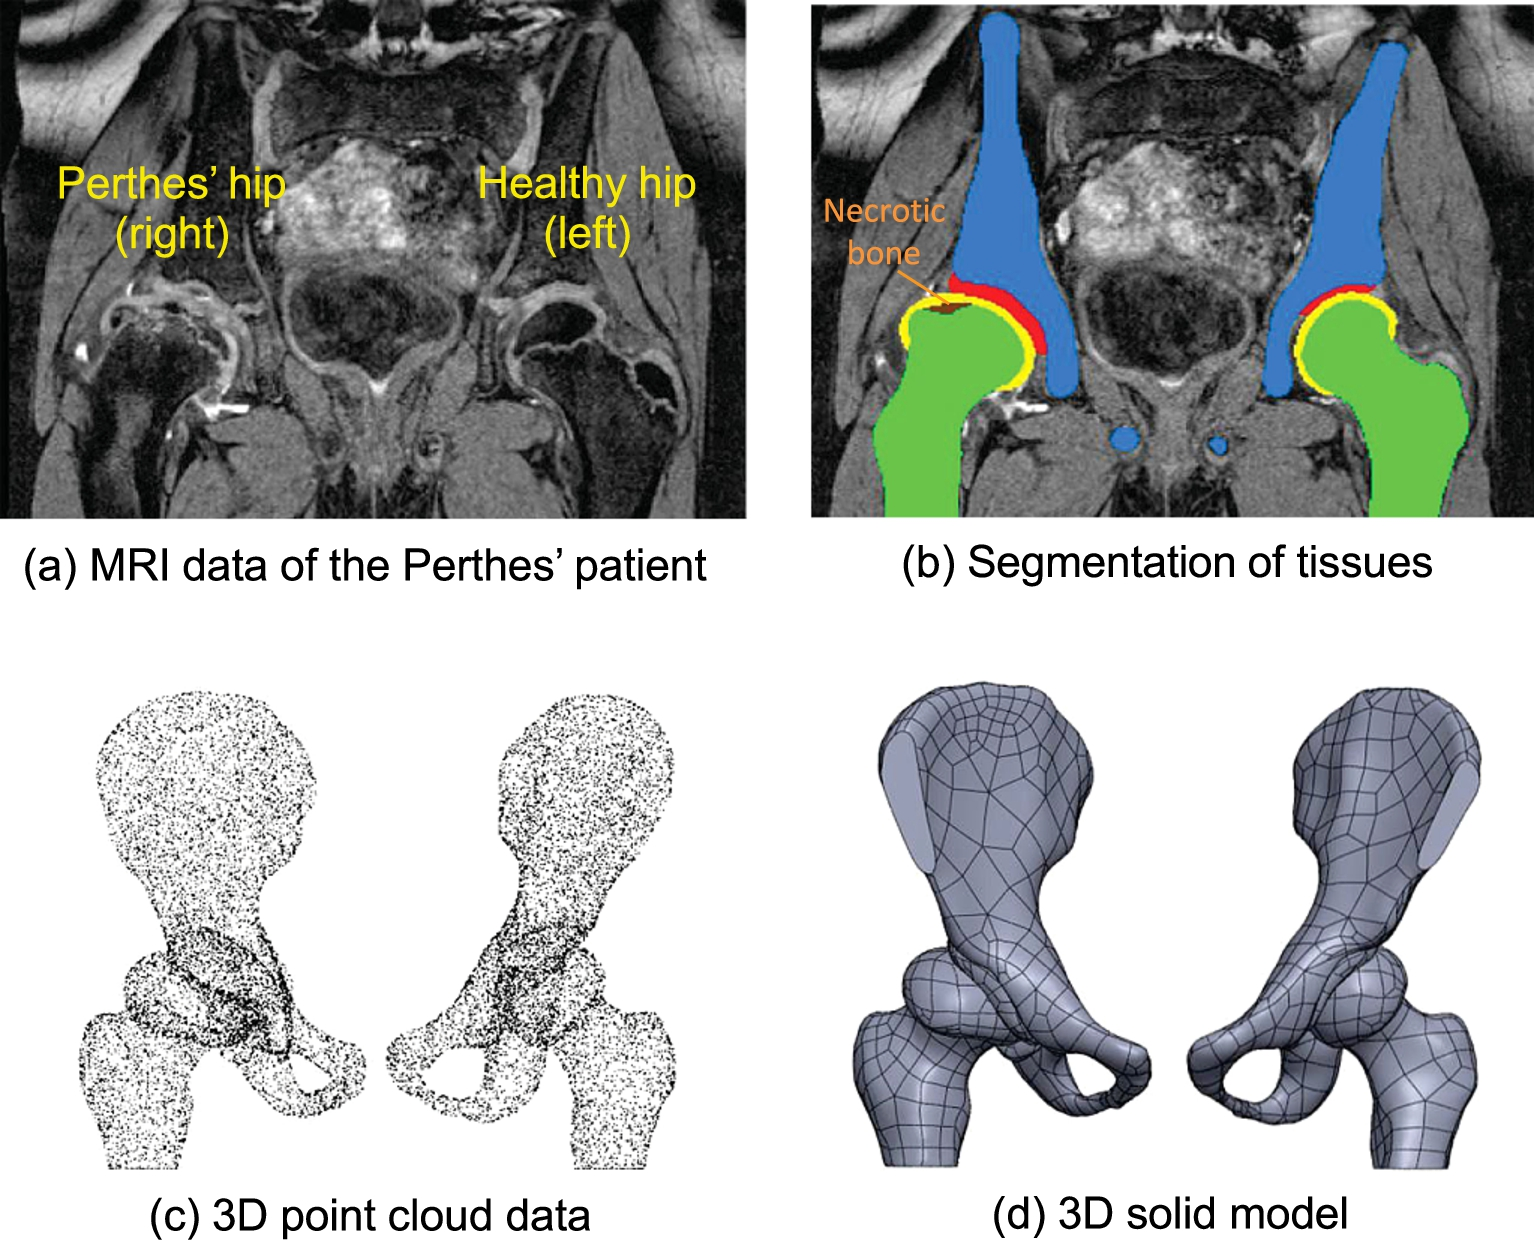
Development of the three-dimensional solid model of the hip joint using MRI (front view).
The three-dimensional solid models were imported to Comsol Multiphysics 4.4 (Comsol AB, Stockholm, Sweden). The element type used was a tetrahedral solid element for all models. The finite element mesh of both hips is shown in Fig. 3. For the healthy hip, the finite element model includes the pelvic bone, acetabular and femoral cartilage, and femur, Fig. 3(a), (b) right side. For the Perthes’ hip, the finite element model includes the pelvic bone, acetabular and femoral cartilage, femur and necrotic bone in the femoral head, Fig. 3(a), (b) left side. The necrotic bone is located at the superior part of the femoral head (in darker color, femoral cartilage was hidden in the figure). The interface between the bones and cartilages was connected as “union” to simulate fusion of the interconnecting bodies. The contact pair was set as the frictionless surface between acetabular and femoral cartilage. The material properties of the tissues were taken from the previous studies of Ueo et al. [8] and Volokh et al. [12]. The material properties were assigned as listed in Table 1. All material properties were modeled as homogeneous and linear elastic material manifesting isotropic behavior.
Material properties and number of elements of the finite element model
Material properties and number of elements of the finite element model
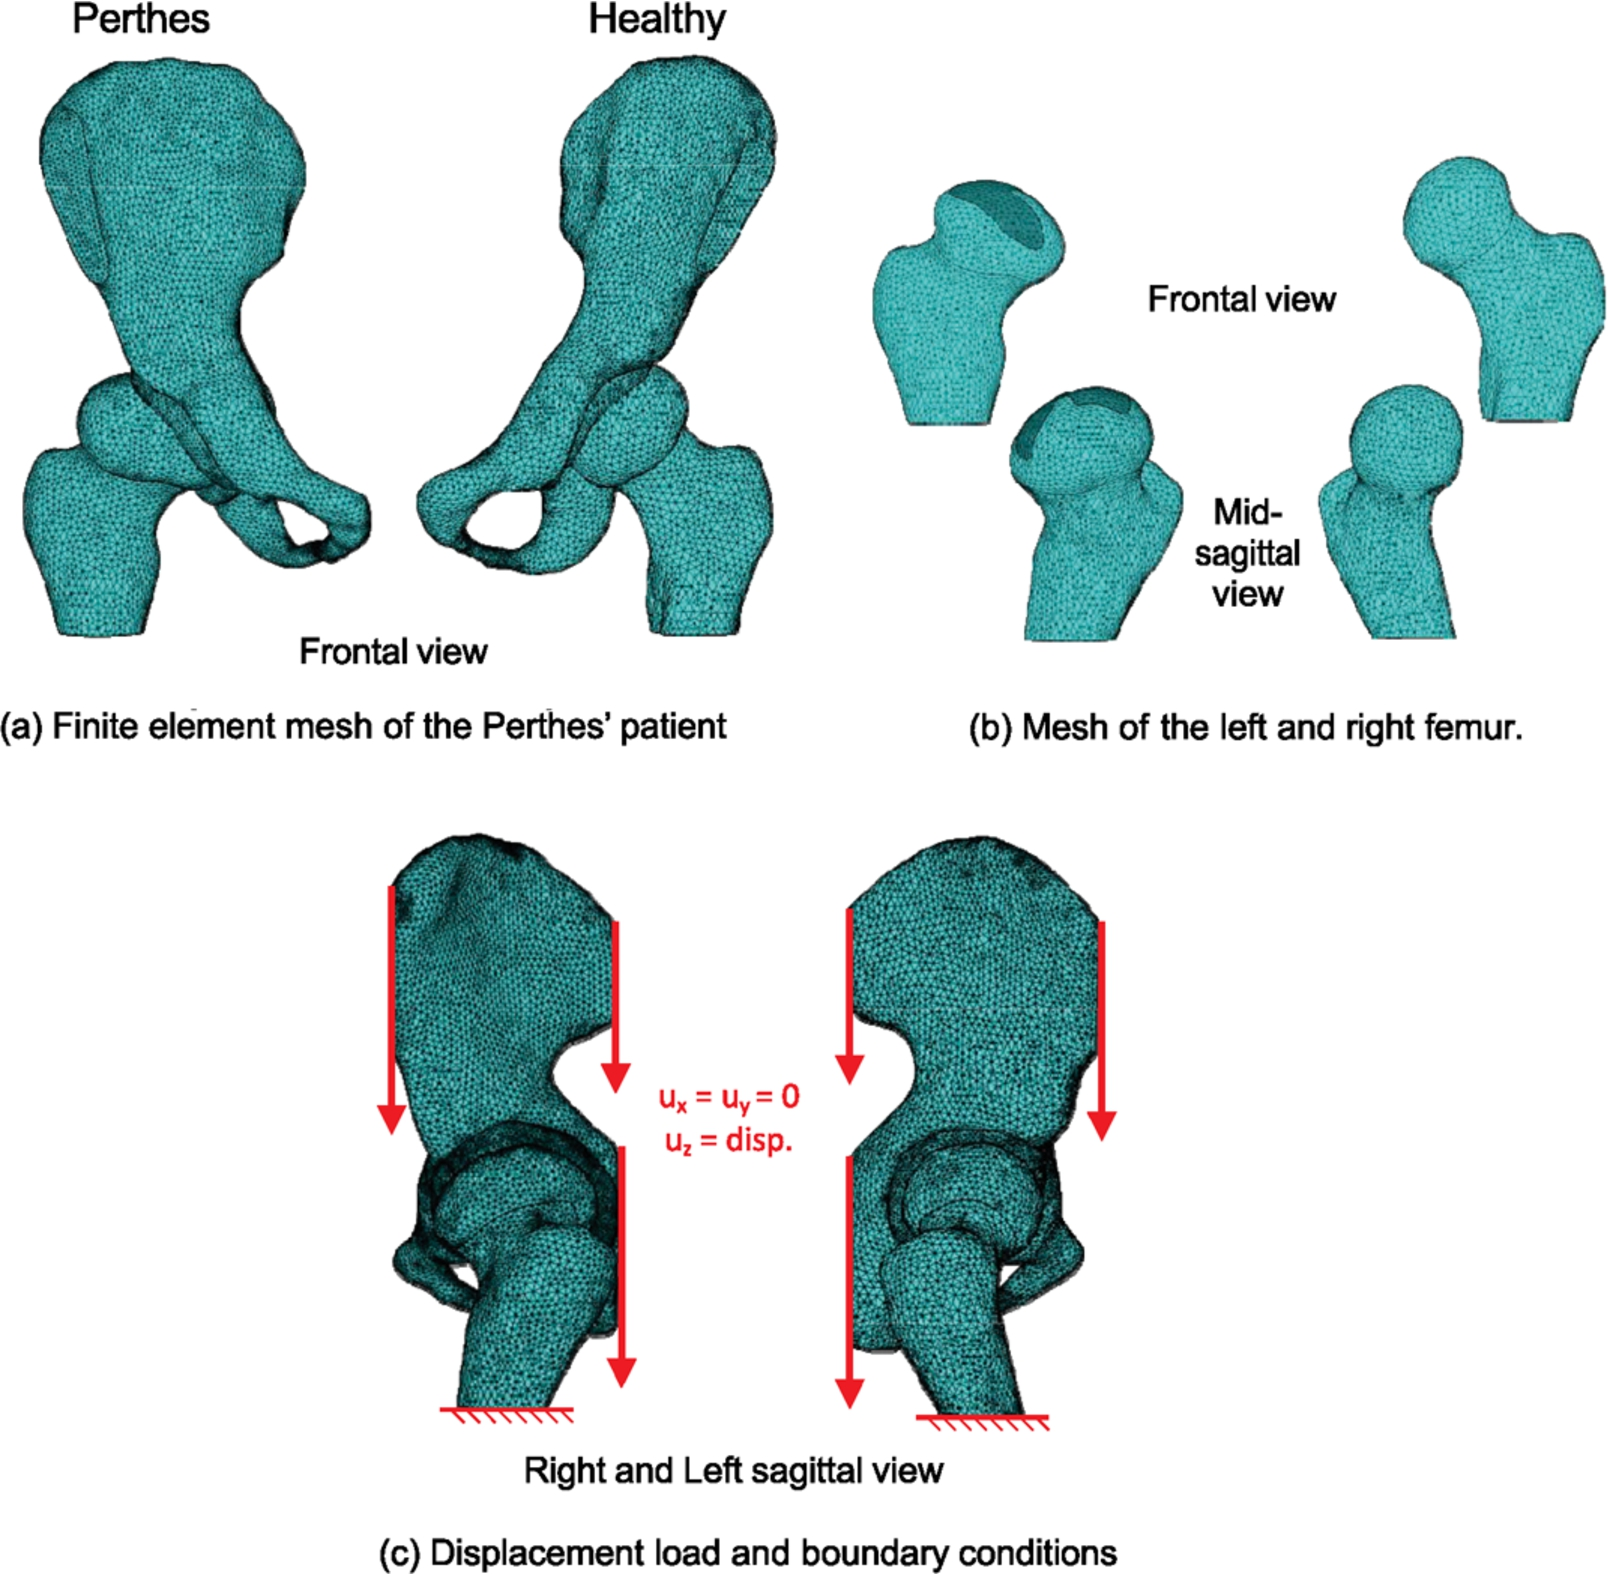
Three-dimensional finite element mesh of the hip joint, boundary and load conditions.
For contact analysis, a convergence study was performed by mesh refinement of the articulating cartilages (femoral and acetabular) until a less than 5% change in the maximum contact pressure and contact area were obtained. For the bony parts, mesh refinement of the pelvis, femur and necrotic bone was also performed until a less than 5% change in the maximum von Mises stress was obtained. The mesh refinement was conducted by reducing the element length to increase the number of elements. This resulted in a total number of elements from 25,541, 41,889, 76,165, 102,951, and to 116,501 elements for the unaffected hip and from 45,560, 65,481, 107,167, 146,765, and to 157,400 elements for the Perthes’ hip. See Table 1 for details.
For the boundary conditions, the distal portion of the femur was fixed (ux = uy = uz = 0) (Fig. 3(c)). A displacement constraint was applied on the flat surfaces (ux = uy = 0 = uz = d) to displace the pelvis downward in the axial direction. The assumption of a fixed contact region/area adopted by previous studies [11,13] may not reveal the actual biomechanical environment in a Perthes’ hip. The contact area could be dependent on the three-dimensional geometry of the tissues and also the magnitude of displacement or load. Thus, three different magnitudes of displacement in the axial direction was implemented, i.e.
Biomechanical alteration (healthy hip vs. Perthes’ hip)
To investigate the biomechanical alterations, the contact pressure, contact area, von Mises stress, contact pressure distribution and displacement, load-bearing capacity at −1.5 mm displacement of the healthy hip and Perthes’ hip were analyzed and compared. Since the articulating surface area of the femoral cartilage is continuous and the contact pressure distribution is not uniform in shape, the contact area was computed using surface integral by setting a certain minimum contact pressure (i.e. lower limit). The lower limit was set to 5% of the maximum contact pressure. The lower limit indicates that the computed contact area is equal to the total area of the femoral cartilage experiencing at least 5% of the maximum contact pressure (i.e. 5.3 MPa max. found at
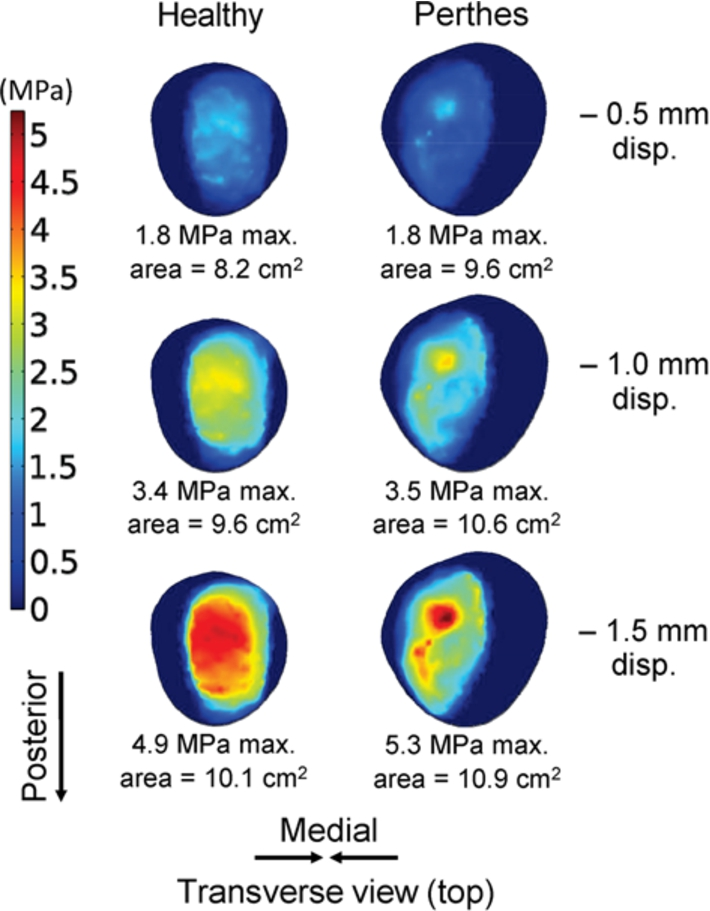
Femoral cartilage contact pressure distribution of the Perthes’ case.
Contact pressure and contact area
Figure 4 shows the femoral cartilage contact pressures at different magnitudes of displacements. As expected, the contact pressure increased when the displacement was also increased. All in all, the magnitude of contact pressures between the Perthes’ hip and healthy hip did not show a significant difference. The highest contact pressure 5.3 MPa was found in the Perthes’ hip at −1.5 mm displacement. The maximum contact pressure in the healthy hip was 4.9 MPa, which is slightly lower than the Perthes’ hip (7.5% lower). At a higher level of contact pressure, the contact pressure distribution in the Perthes’ hip was more localized compared to the healthy hip, whereas the healthy hip had a more distributed and an elliptic-shape contact pressure distribution. Since the same displacement was used to the affected and non-affected hip, the magnitude of reaction force acting at the most distal part of the femur was computed and compared. The magnitude of reaction force indicates the load-bearing capacity of the healthy and Perthes’ hip. The reaction force in the Perthes’ hip in z-direction was 1992 N at −1.5 mm displacement. For the healthy hip, the reaction force was 2073 N at −1.5 mm displacement indicating a higher load-bearing capacity than the Perthes’ hip.
The lower limit for the femoral cartilage contact area experiencing at least 5% of the highest contact pressure was evaluated (5% × 5.3 MPa = 0.265 MPa). The contact area experiencing at least 0.265 MPa on the femoral cartilage of the healthy hip (left side) was 8.2 cm2, 9.6 cm2 and 10.1 cm2, at −0.5 mm, −1.0 mm, and −1.5 mm displacement, respectively (Fig. 4). Similar to the Perthes’ hip (right side), the femoral cartilage contact area was 9.6 cm2, 10.6 cm2 and 10.9 cm2, at −0.5 mm, −1.0 mm, and −1.5 mm displacement, respectively. The femoral cartilage contact area was higher in the Perthes’ hip than in the healthy hip. The contact area increased also upon the increase of displacement. This indicates that the assumption of a fixed or uniform contact area of previous studies may not be a realistic method to investigate the biomechanics of human hip joints.
Stress distribution and displacement
The von Mises stress was used to evaluate the stresses distribution. Despite of the small difference in contact pressure observed between the Perthes’ hip and healthy hip, the stress (3.9 MPa highest) found in the femoral cartilage of Perthes’ hip was significantly greater (1.6 times) than the healthy hip (2.4 MPa), in Fig. 5. Similar to the contact pressure patterns, localization of von Mises stress was found in the femoral cartilage of the Perthes’ hip. This is contrary to the healthy hip because the stress was significantly lower and more evenly distributed.
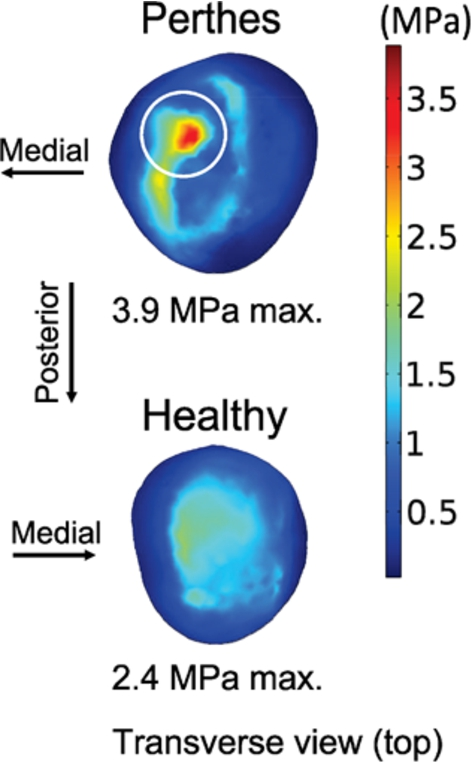
von Mises stress distribution of the femoral cartilage.
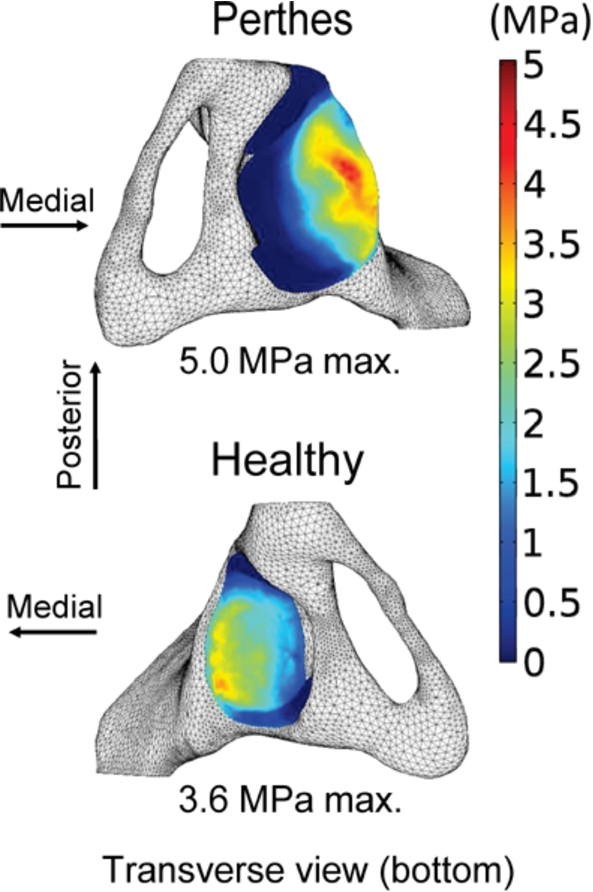
von Mises stress distribution of the acetabular cartilage.
Figure 6 shows the von Mises stress distribution of the acetabular cartilage (bottom view, pelvic bone attached). The highest stress was 5.0 MPa found in the Perthes’ hip. The maximum stress in the healthy hip was 3.6 MPa. The highly stressed region was located at the superior part of the acetabular cartilage. The stress distribution was slightly similar in both hips. However, it showed that the magnitude and area of high stress regions were much greater in the Perthes’ hip than in the unaffected hip.
The maximum von Mises stress of the femur was 16.6 MPa and 16.5 MPa, for the Perthes’ hip (necrotic bone is hidden) and healthy hip, respectively (Fig. 7). The maximum von Mises stress of both femurs was similar but very local for the Perthes’ hip. The maximum von Mises stress in the healthy hip was located at the femoral neck. The maximum von Mises stress in the Perthes’ hip was concentrated at the top of the femoral head. Conversely, the magnitude of stress in the femoral head of the healthy hip is low and well distributed whereas concentrated also in some regions specifically in the necrotic-healthy bone interface. The stress distribution also shows that the healthy bone takes up more of the load due to increased stress magnitude.
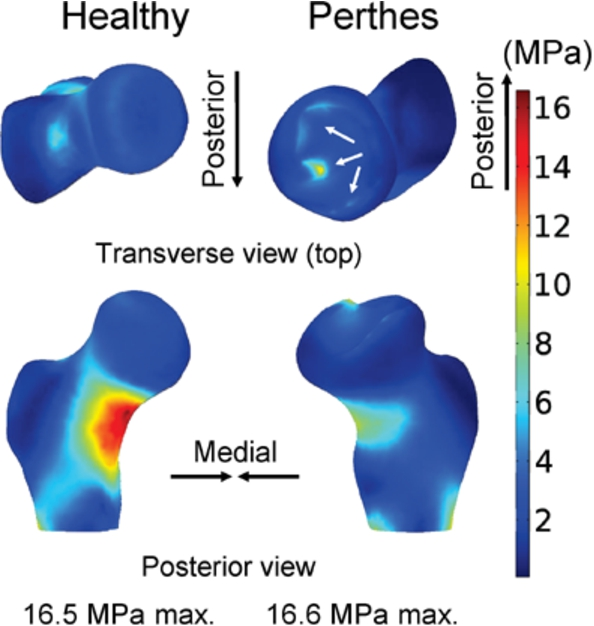
von Mises distribution of the femoral bone.
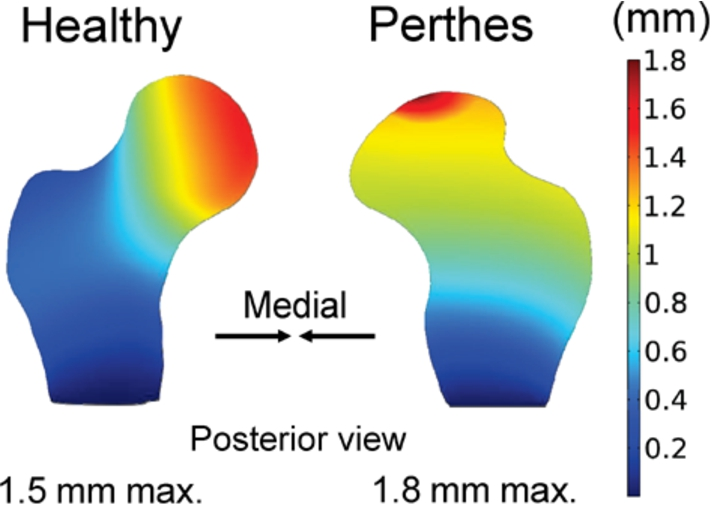
Figure 8 shows the distribution of the total displacement vector on the outer surface of the femoral bone. The highest displacement 1.8 mm was found in the Perthes’ hip while 1.5 mm in the healthy hip. The displacement pattern of the healthy hip showed that most of the displacement occurred at the medial side of the femoral head as opposed to the Perthes’ hip, where most of the displacement occurred at the superior part of the femoral head and gradually reduced towards the distal part of the femur. To investigate the internal displacement patterns, section-cut views at the frontal plane of the femoral bones were made, Fig. 9. The internal displacement patterns were similar to the outer surface displacement patterns. The results can be explained by a mechanical analogy. The healthy hip is experiencing a bending load similar to a curved-cantilever beam where the maximum displacement is located at the end. On the other hand, the Perthes’ hip resembles a column structure where the load is transmitted through compression.
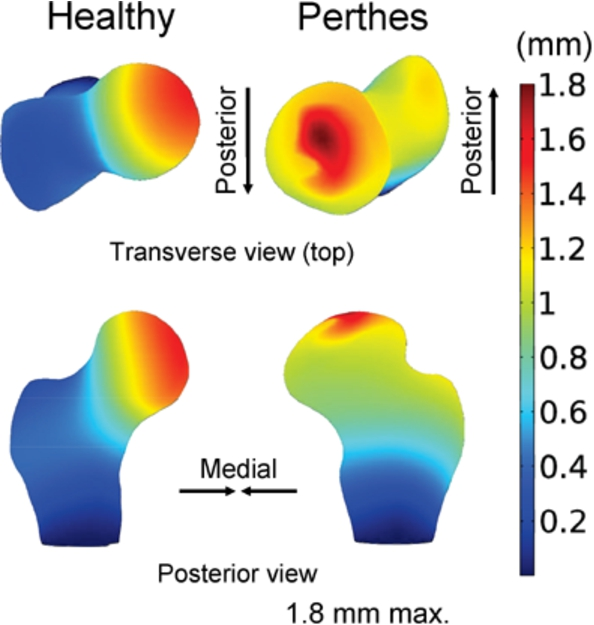
Total displacement vector on the outer surface of the femoral bone.
Total displacement vector on the inner surface of the femoral bone.
Since in vivo or experimental studies during daily activities of the hip joint are usually difficult to obtain, computer modeling through finite element analysis is a better alternative to understand the biomechanics of Perthes’ disease. The results of this study showed that the contact pressure on the femoral cartilage ranges from 1.8 MPa to 5.3 MPa (Fig. 4). Afoke et al. [28] conducted in vitro experiment by attaching a pressure-sensitive film to the cartilage interface of five healthy cadaver hip joints. They removed the excess soft tissue and labrum. This is similar to the included tissues in the finite element model of our study. A compressive load amounting to 1.3 to 2.2 times the body weight (764 N to 1538 N) was applied to analyze the contact pressure. Their calculated contact pressures ranged from 2.9 MPa to 8.6 MPa. This value is similar to the contact pressures obtained in this study. The results are also within the range of previous in vitro experiment of 17 healthy hip joints instrumented by pressure transducers in the femoral head cartilage [29]. The average contact pressure they measured was 2.9 MPa and the average local contact pressure was 8.8 MPa at 2700 N applied load. However, factors such as differences in tissue geometry, material properties, age, gender, body weight and more may affect the current comparison. Thus, these factors need to be considered to attain a more detailed comparison.
The contact pressure distribution in the healthy hip resembles an elliptic-shape (Fig. 4). The elliptic-shape is in good agreement with the in vitro experiment using a healthy hip joint cadaver conducted by Bae et al. [30]. This is opposed to the Perthes’ hip that had a pressure distribution with a clear point peak pressure. The femoral cartilage contact area in the Perthes’ hip was 14.3% larger (i.e. calculated at −1.5 mm displacement) than the healthy hip. The increase of contact area might be due to the significant morphological changes in the hip joint. This significant morphological changes could be the result of bone tissue remodeling triggered after the femoral head collapse. It can be readily observed from the MRI that the femoral head of the Perthes’ hip was larger than the unaffected hip. Thus, the increase in contact area is due also to the hypertrophy of the femoral head and articulating cartilages. It has been reported that the acetabulum and femoral head size could increase from 4.0 to 6.8 mm on the affected side observed from the unilateral cases of Perthes’ hips [31]. Despite of the increase in contact area observed in the Perthes’ hip, the maximum contact pressure and von Mises stress were still higher than the healthy hip. From a mechanical point of view, decrease of stress and contact pressure should be expected when an increase of material contact area is subjected to the same displacement or load. In this case, however, the maximum stress and contact pressure was found directly below the interface between the necrotic and healthy bone. This is due to the difference in the material properties of the tissues because during the initiation of contact, the stiffer material has to take much of the load and thus will be subjected to higher stresses and contact pressure. The periphery of the necrotic bone showed elevated stresses (Fig. 7).
It has been previously established that the bone stiffness is highly correlated to the ultimate strength [32]. Thus, increase in compliant/flexibility or decrease in stiffness could indicate a reduction of load-bearing capacity. Our results show that the magnitude of reaction forces in the z-axis of the healthy hip was higher than the Perthes’ hip at all levels of displacement (4.1% at −1.5 mm displacement). These results imply that the load-bearing capacity of the Perthes’ hip was reduced. A mechanical analogy of the reduction of load can be explained by two mechanical structures of the same geometry but having different stiffness or elastic modulus (one is stiffer than the other). At the same displacement, the structure that has a higher elastic modulus will obtain a higher load or reaction force than the structure that has a lower elastic modulus.
The highest von Mises stress in the femoral cartilage was 3.9 MPa and found in the Perthes’ hip (1.6 times higher than the healthy hip), Fig. 5. The current stress magnitude is similar to a previous study (5.5 MPa max.) involving finite element modeling using a cadaver hip joint without any skeletal disease [33]. It is reasonable that the magnitude of stress was higher in their study because the patient weight (40 kg) was heavier than the 30 kg patient in this study. Likewise, the von Mises stress distribution in the acetabular cartilage indicates a significant increase (1.4 times the healthy hip) in the stress level experienced by the Perthes’ hip. Knowledge on the location of localized contact pressure and stress concentrations are important for preoperative planning. Using this knowledge, orthopaedic surgeons can pinpoint the most affected area and may be able to suggest effective treatment plan for a particular case.
There was no significant difference between the maximum von Mises stress of the femoral head in the Perthes’ hip and healthy hip, 16.6 MPa and 16.5 MPa, respectively. However, there is an obvious difference between the stress distribution patterns. For the healthy hip, the highly stressed part was located at the femoral neck and this stress pattern is similar to the previous finite element studies involving healthy subjects [34,35]. On the other hand, the Perthes’ hip had stress concentrations in the femoral head. The stress concentration is located at the periphery of the necrotic bone. This result is in good agreement with the earlier findings of Brown et al. [6]. They showed that the healthy bone surrounded by a weakened necrotic bone takes up an extra load. This finding entails that obtaining stress relief on these highly stressed or vicious areas shall be the main focus of the treatment plan. It is well-known that the decrease in mechanical properties of the necrotic bone with a subsequent collapse in the femoral head is an inevitable consequence of Perthes’ disease [36].
Ideally, a healthy hip (if healthy for both left and right) should exhibit axisymmetric stress pattern, and the pathological difference in displacement pattern could be used as a guide for orthopaedic surgeons in developing new strategies or devices which could allow displacement of the affected femoral bone in a way that a more symmetric or balanced displacement is achieved. The results of the displacement patterns indicate that the healthy hip can be visualized as a curved-cantilever beam where the displacement is gradually increasing and reaches the maximum at the far end where the load is applied. This is however contrary to the Perthes’ hip where the maximum displacement was located at the necrotic bone and resembles a compressed column. This was expected because the necrotic bone is apparently a softer material than the healthy bone. The compressed column is observed as one of the biomechanical alterations caused by the structural changes in the proximal part of the femur in the Perthes’ hip. This alteration may aggravate the disease because bone overloading by compression may occur. Recent clinical studies suggest that mechanical overloading of bone may compress the blood vessels passing through bone thereby reducing the blood flow [37,38]. It has been demonstrated that the interruption of the blood supply network to the hip joint contributes to the development of Perthes’ disease. The current study investigated the biomechanical alterations in a Perthes’ hip joint using contact modeling. The method can be used as a potential tool for the orthopaedic surgeons to understand how the disease alters the hip joint by describing for example the stress distributions. However, this is limited only to understanding the biomechanical alterations of the disease. This method does not involve patient-specific pre-operative planning especially for cases that requires surgical intervention. Thus, future studies on pre-operative modeling of various surgical strategies involving different types of implants and varisation of the hip joint could help surgeons understand the effects of instrumentation. This could help the pediatric orthopaedic surgeons on their decision making on which implant type and varisation may result to a better clinical outcome. The present study involves only a single Perthes’ case. This is because Perthes cases are quite rare as described by the incidence rate of previous studies [2,3]. This entails that future studies involving more patients will help us elucidate the underlying biomechanical alterations of Perthes’ disease in young children.
Thus, a more objective knowledge of the biomechanical effects of Perthes’ disease and its corresponding clinical implications can be established using this method. This study demonstrated that the biomechanical alterations in Perthes’ disease can be evaluated individually by patient-specific finite element contact modeling using MRI.
Conclusions
In this study, the biomechanical alterations in a Perthes’ case were investigated through patient-specific contact modeling using a method based on finite element analysis. The concentration of contact pressure and stress was observed and located in the Perthes’ hip. Understanding the underlying biomechanical changes in Perthes’ disease is important for the improvement of the clinical treatment.
Conflict of interest
There is no conflict of interest to be reported. No benefits in any form have been or will be received from a commercial party related directly or indirectly to the manuscript.