
Abstract
BACKGROUND:
Mesenchymal stem cell (MSC)-based therapies offer potential for bone repair. MSC spheroid cultures may harbor enhanced therapeutic potential over MSC monolayers through increased secretion of trophic factors. However, the impact of spheroid size on trophic factor expression is unclear.
OBJECTIVE:
We investigated the effect of spheroid size on trophic factor-related gene expression.
METHODS:
KUM10, a murine MSC line was used. RNA-seq was used to screen the transcriptional profiles of MSC monolayer and spheroid cultures. Differentially expressed genes identified in RNA-seq were evaluated by q-PCR in cultures of 5 × 10⁴ (S group), 5 × 10⁵ (M group), 5 × 10⁶ (L group) cells/well.
RESULTS:
Comparison of expression levels between KUM10 monolayer and spheroid cultures identified 2140 differentially expressed genes, of which 1047 were upregulated and 1093 were downregulated in KUM10 spheroids. Among these, 12 upregulated genes (Bmp2, Fgf9, Fgf18, Ngf, Pdgfa, Pdgfb, Tgfb1, Vegfa, Vegfc, Wnt4, Wnt5a, Wnt10a) were associated with secretory growth factors. Of these, expression of Fgf9, Fgf18, Vegfa and Vegfc was elevated in the L group, and Pdgfb and Tgfb1 was elevated in the S group.
CONCLUSIONS:
Spheroid size may impact trophic factor expression. Our results will be useful for future studies assessing the utility of MSC spheroids for treating bone injury.
Introduction
Bone regeneration constitutes a significant medical hurdle, as inadequate healing can lead to trauma, tumor development, and osteomyelitis. Mesenchymal stem/stromal cells (MSCs) are multipotent somatic stem cells with the potential to differentiate into various mesodermal cells, including osteoblasts and chondrocytes [1]. In addition, MSCs produce a number of trophic factors that can contribute to bone repair [2]. Therefore, MSCs have become an attractive cell source and are widely employed in the development of bone repair strategies [3–5].
Despite being a commonly used and traditional culture method, two-dimensional (2D) monolayer cell cultures do not offer a physiologically comparable environment for cell growth. In fact, the artificial culture conditions of cell monolayers can cause a reduction or loss of characteristics and traits in vitro, including self-renewal, replication, colony-forming efficiency, and differentiation capacity. Three-dimensional (3D) spheroid cultures, on the other hand, are better able to recapitulate the conditions found in vivo, and are thus better able to maintain these characteristics [6]. Further, MSCs cultured in spheroids have enhanced trophic activity compared to MSCs in monolayers. Therefore, MSC spheroids are a potential therapeutic source for bone regenerative medicine. However, while it is known that bone regeneration requires a complex interplay between molecules such as FGF, PDGF, TGF-β, VEGF, Wnt [7], factors that increase trophic factor expression in MSC spheroids are not fully understood.
A previous study that examined the link between cell density and alterations in MSC function in monolayer culture revealed elevated levels of proliferation-related genes at low cell density, and immunosuppression, migration, and cell motility-related genes at high cell density [8]. Thus, spheroid size may influence the expression of trophic factors. Although various spheroid sizes have been used in MSC spheroid research, the impact of spheroid size on trophic factor expression has not been fully investigated.
Here, we investigated the differential expression of genes in monolayer and spheroid cultures and the effect of cell number on trophic factor expression in the mouse MSC cell line, KUM10.
Materials and methods
Cell culture
KUM10, an MSC line established from the bone marrow of C57/BL6 mice, was obtained from the RIKEN BioResource Center (Tsukuba, Ibaraki, Japan). KUM10 cells were maintained in culture medium comprising minimum essential medium alpha supplemented with 10% fetal bovine serum (FBS) and 1% penicillin/streptomycin (Sigma Aldrich, St. Louis, MO, USA) in a humidified incubator at 37 °C and 5% CO2.
To generate spheroids, subconfluent cells were treated with trypsin, before being washed and resuspended in culture medium and cultured in an ultra-low attachment Nunclon Sphera plate (Thermo Scientific, Nunclon Sphera, Roskilde, Denmark). After culturing for 5 days to allow for sphere formation, the cross-sectional area of each spheroid was measured using NIH ImageJ image analysis software. Subsequently, RNA-seq and real-time PCR were performed.
RNA isolation and RNA-seq analysis
RNA-seq was used to screen the transcriptional profiles of monolayer and spheroid cells. To identify genes that were differentially expressed between monolayer and spheroid cells, total RNA extracted from 3 monolayer and 3 spheroid culture samples cultured at 5 × 10⁵ cells for 5 days was isolated using Trizol (Thermo Scientific) and a spin column (Direct-zol MicroPrep kit, Zymo Research, Orange, CA, USA). The amount of RNA was measured using a spectrophotometer (Denovix, DE, USA) and the quality was checked on the Agilent 2100 BioAnalyzer (Agilent Technologies, Santa Clara, CA, USA) using an RNA 6000 Nano Chip. RNA-seq was performed on the extracted RNA and RNA sequencing was conducted using DNBSEQ (DNBSEQ Technology platform) before sending the RNA samples to BGI Japan for RNA-seq analysis. Differentially expressed genes were defined by default as genes with an false discovery rate (FDR) ≤ 0.001 and fold change >2 in RNA-seq analysis [9,10].
Primer sequences
Primer sequences

RNA-seq analyses of DEGs in mesenchymal stem cell monolayers and spheroids. Venn diagram analysis of DEGs. The region of overlap among the three circles represents the common but DEGs among the three datasets. DEGs, differentially expressed genes.
The effect of spheroid size on 12 secretory growth factor-related genes found to be upregulated by RNA-seq were evaluated using qPCR. We performed a pilot study in which wells were seeded with various cells numbers (5 × 10³–5 × 10⁷ cells/well). Spheroid formation was insufficient at 5 × 10³ cells/well. In contrast, ratio of dead cells in spheroids were markedly increased at 5 × 10⁷ cells/well. Therefore, RNA was extracted from cultures incubated at 5 × 10⁴ (S group), 5 × 10⁵ (M group), 5 × 10⁶ (L group) cells/well for 5 days, as described above (n = 5 each). First-strand cDNA synthesized using superscript III RTTM (Invitrogen, Carlsbad, CA, USA) was applied to real-time PCR analysis with SYBRTM Green (Qiagen, Valencia, CA, USA). Primer sequences are provided in Table 1. The housekeeping gene Gapdh and delta–delta Ct method were used to calculate relative mRNA expression. Relative expression was further normalized to mean values from the M group.
Statistical analysis
Differences among the S, M, and L groups were analyzed using one-way ANOVA with Tukey’s multiple comparisons test in SPSS software (Version 19.0; SPSS Inc., Chicago, IL, USA). p < 0.05 was considered significant.
Results
Differentially expressed genes (DEGs) between KUM10 monolayer and spheroid cultures
We compared the expression levels determined by RNA-seq between KUM10 monolayer and spheroid cultures and identified 2140 DEGs, of which 1047 were upregulated and 1093 were downregulated in KUM10 spheroids (Fig. 1). Among these, 12 genes that were upregulated in KUM10 spheroids and associated with secretory growth factors were selected for further analysis (Table 2).
Secretory growth factor-related genes upregulated in spheroid culture
Secretory growth factor-related genes upregulated in spheroid culture
The cross-section area of spheroids increased with the number of seeded cells (Fig. 2A–C). Spheroids in the M and L groups had significantly larger areas than those in the S group (Fig. 2D). Further, spheroids in the L group had significantly larger areas than those in the S and M groups (Fig. 2D).
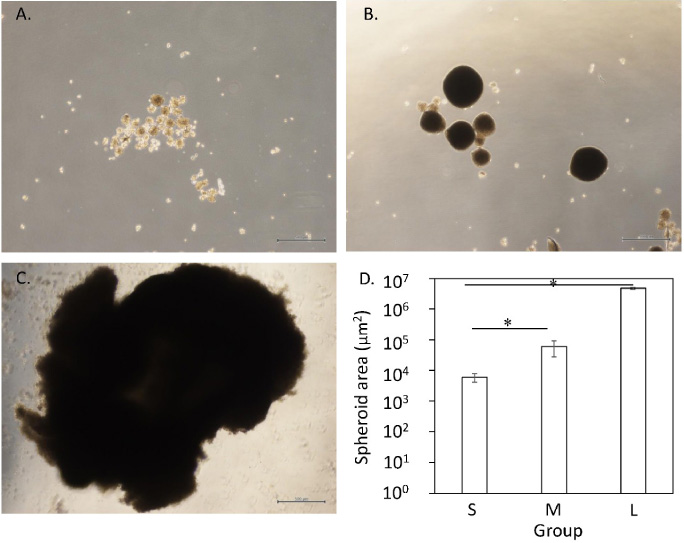
Spheroid morphology and size. Morphology (A–C) and area (D) of spheroids. Scale bar = 500 μm.
The effect of spheroid size on trophic factor-related gene expressions is shown in Fig. 3. Although no significant differences were observed in Bmp2 levels (Fig. 3A), Fgf9 and Fgf18 were significantly elevated in the L group compared to the S and M groups (Fig. 3B, C), while Ngf expression was significantly increased in the S group compared to the M group (Fig. 3D). No significant differences were noted in Pdgfa levels (Fig. 3E). However, Pdfb was significantly elevated in the S and M groups compared to the L group (Fig. 3F). Meanwhile, Tgfb1 levels were significantly higher in the S group than the M and L groups, Vegfa and Vegfc was significantly increased in the L group compared to the S group (Fig. 3H, I), and Wnt4 was significantly elevated in the S and L groups than the M group (Fig. 3J). While no significant differences were noted in Wnt5a expression (Fig. 3K), Wnt10a levels were significantly increased in the L group compared to the S and M groups (Fig. 3L).
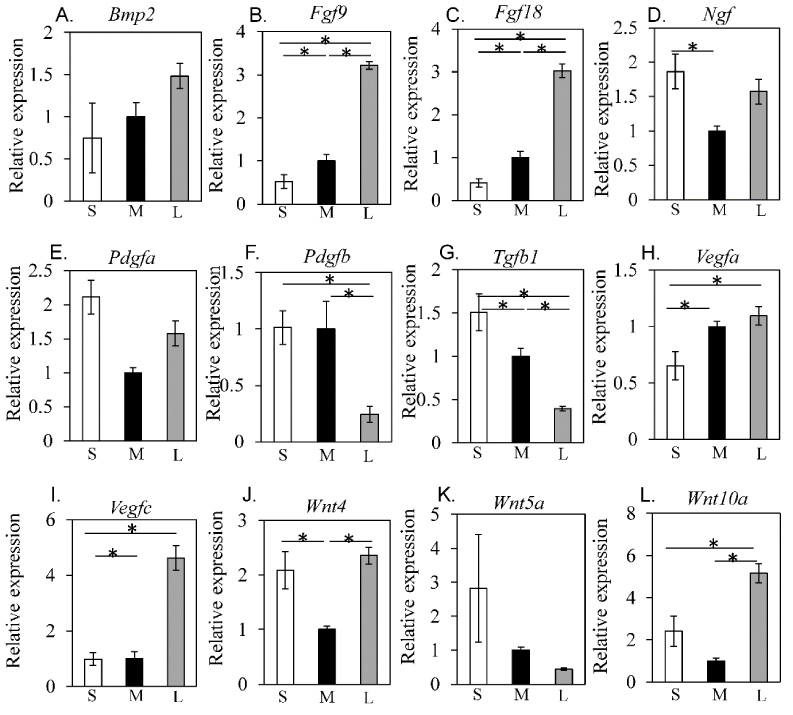
Effect of spheroid size on trophic factor-related gene expression. qPCR analysis results for Bmp2 (A), Fgf9 (B), Fgf18 (C), Ngf (D), Pdgfa (E), Pdgfb (F), Tgfb1 (G), Vegfa (H), Vegfc (I), Wnt4 (J), Wnt5a (K), and Wnt10a (L).
RNA-seq analysis of KUM10 monolayer and spheroid cultures revealed significantly elevated expression of Bmp2, Pdgfb, Tgfb1, Vegf, and Wnt5a in spheroid compared to monolayer cells. Expression of Fgf9, Fgf18, Ngf, Pdgfa, Vegfc, Wnt4b, and Wnt10b was also increased in spheroid compare to monolayer cultures. Further, large spheroids showed higher expression of Fgf9, Fgf18, Vegfa, Vegfc, and Wnt10a than small spheroids. In contrast, small spheroids showed higher expression of Pdgfb and Tgfb1 than large spheroids. Thus, spheroid size is an important regulator of the expression of several trophic factors.
Previous studies have reported that multiple pathways contribute to bone regeneration via bone formation and angiogenesis. While members of the TGF-β superfamily play an important role in bone regeneration [11,12], VEGF/PDGF families are pivotal for mesenchymal proliferation, chemotaxis and angiogenesis during the bone repair process [13,14]. Wnt ligands, on the other hand, contribute to bone development and homeostasis via both β-catenin-dependent and -independent pathways [15–17]. For example, Wnt-β-catenin signaling plays a crucial role in committing precursors to the osteoblast lineage and facilitates the proliferation and differentiation of osteoblast precursors [18–21]. Previous studies have reported that BMP-2, TGF-β1, VEGF, Wnt5a and PDGF-BB levels increase in spheroid cultures [22–26]. Consistent with these reports, we observed elevated levels of Bmp2, Tgfb1, Pdgfb, and Vegfa in spheroid compared to monolayer cultures. In addition, RNA-seq analysis revealed increased levels of Fgf9, Fgf18, Ngf, Pdgfa, Wnt4, and Vegfc in spheroid cultures. FGF9 and FGF18 are known to induce the proliferation and differentiation of MSCs into osteoblasts [27,28]. Further, the combination of FGF9 and VEGF promotes both bone formation and angiogenesis in vivo [29]. Co-administration of FGF18 with BMP2 has been shown to strongly enhance bone formation in critical size bone defects [30]. Meanwhile, NGF stimulates osteoblast proliferation in vitro [31] and promotes the repair of rabbit mandible fracture in vivo [32]. Further, MSC-derived VEGFC promotes angiogenesis and skin wound healing [33], while VEGF-C facilitates osteogenic differentiation and mineralization of MSCs [34]. PDGF-AA and Wnt-4 promote osteogenic differentiation of MSCs [35,36], while Wnt10a inhibits adipogenesis and stimulates osteoblast genesis through β-catenin [37]. Thus, the trophic factors found to be increased in spheroid culture play a pivotal role in bone regeneration.
As there is no standardized spheroid size, various sized spheroids have been applied to bone regeneration studies in animal models [38–40]. In our study, we evaluated the impact of spheroid size on trophic factor gene expression and found that some trophic factor-related genes exhibit spheroid size-dependent profiles. Elevated levels of angiogenic factors such as Fgf9, Vegfa and Vegfc and the osteogenic factor Fgf18 were observed in large spheroids. In contrast, Pdgfb and Tgfb1, which play an important role in bone healing, especially in the early phase, were elevated in small spheroids. PDGF-BB strongly stimulates chemotaxis in MSCs [41,42], while TGF-β promotes mesenchymal condensation of osteogenic progenitor cells [43,44]. Our results suggest that size may affect the therapeutic potential of spheroids, indicating the need to standardize spheroid size to optimize therapeutic conditions.
A previous study reported that cell density in monolayer culture affects β-catenin signaling: β-catenin was located at the adherens junction at low cell density, but was translocated to the nucleus at high density in mouse embryonic stem cells [45]. β-catenin-translocated nuclei show increased FGF9, FGF18 and VEGF production [46–48]. Moreover, β-catenin suppress TGF-β signaling [49]. Therefore, alternation of β-catenin signaling may partly explain the spheroid size-dependent differential gene expression profile in our study. Further investigation of the signal pathway underlying this mechanism, including β-catenin signaling, is needed.
Conclusions
We found that several trophic factors were elevated in MSC spheroids using RNA-seq and that spheroid size may impact trophic factor expression. Our results will be useful for future studies assessing the utility of MSC spheroids for treating bone injury.
Footnotes
Author contributions
Akiyoshi Kuroda, Kentaro Uchida, and Masashi Takaso conceived and designed the study. Ayumi Mineo, Shoji Shintaro, Gen Inoue, Wataru Saito, Hiroyuki Sekiguchi, and Masashi Takaso analyzed and interpreted the data. Akiyoshi Kuroda and Kentaro Uchida drafted the manuscript. All authors contributed to data analysis, drafting or revising the article, have agreed on the journal to which the article will be submitted, gave final approval of the version to be published, and agree to be accountable for all aspects of the work.
Conflict of interest
None to report.
Funding
This investigation was supported in part by Grant-in-Aid for Scientific Research (B) No. 21H03059, Grant-in-Aid for Young Scientists (Start-up) No. 21K20978, research grants from the Parents’ Association of Kitasato University School of Medicine, Kitasato University Research Grant for Young Researchers, and a Medical Research Grant from The General Insurance Association of Japan.