
Abstract
BACKGROUND:
Systemic-to-pulmonary shunt is a palliative procedure used to decrease pulmonary blood flow in congenital heart diseases. Shunt stenosis or occlusion has been reported to be associated with mortality; therefore, the management of thrombotic complications remains a challenge for most congenital cardiovascular surgeons. Despite its importance, the optimal method for shunt anastomosis remains unclear.
OBJECTIVE:
The study investigates the clinical benefits of the punch-out technique over conventional methods in the anastomosis process of Systemic-to-pulmonary shunt, focusing on its potential to reduce shunt-related complications.
METHODS:
Anastomotic models were created by two different surgeons employing both traditional slit and innovative punch-out techniques. Computational tomography was performed to construct three-dimensional models for computational fluid dynamics (CFD) analysis. We assessed the flow pattern, helicity, magnitude of wall shear stress, and its gradient.
RESULTS:
The anastomotic flow area was larger in the model using the punch-out technique than in the slit model. In CFD simulation, we found that using the punch-out technique decreases the likelihood of establishing a high wall shear stress distribution around the anastomosis line in the model.
CONCLUSION:
The punch-out technique emerges as a promising method in SPS anastomosis, offering a reproducible and less skill-dependent alternative that potentially diminishes the risk of shunt occlusion, thereby enhancing patient outcomes.
Keywords
Introduction
Systemic-to-pulmonary shunt (SPS) is a common surgical option for children with cyanotic heart diseases [1–3]. SPS connecting the cervical branch of the aorta and the pulmonary artery increases pulmonary blood flow. Several factors such as shunt stenosis and occlusion are associated with morbidity and mortality in SPS. Shunt stenosis and obstruction, occurring in 0%–15% of the cases, remain major complications of SPS [4,5]. Stenosis or thrombosis at the anastomosis site of SPS decreases pulmonary blood flow and can lead to shunt obstruction, requiring emergency intervention [6].
Previous studies have reported several perioperative factors associated with graft obstruction, including low weight, small graft diameter, and platelet activation [7]. However, some studies have shown that graft geometry and flow patterns can contribute to shunt obstruction [8–12]. The anastomosis technique is one of the most important factors influencing the flow pattern after SPS [13,14]. However, few studies have investigated the differences in flow pattern during anastomosis. Over the past few decades, SPS has been performed by experienced surgeons. Typically, a longitudinal straight incision is made on the cervical branch and pulmonary arteries before anastomosis. In recent years, we have established and performed a punch-out technique using a 2 × 4-mm aortic punch to create a larger anastomosis site. In this study, we aimed to investigate the clinical efficacy of the punch-out technique using SPS flow dynamic analysis. We created and studied graft models using three-dimensional computational fluid dynamics (CFD). Graft models were created with or without the punch-out technique by two surgeons: an attending surgeon and a senior resident.
Materials and methods
Mock vascular anastomosis model
A vascular anastomosis model was constructed by end-to-side anastomosis of an artificial blood vessel to a mock silicone vessel with inner and outer diameters of 3 mm and 4 mm, respectively (Fig. 1). In this study, the model was constructed by two surgeons: an attending surgeon and a senior resident (surgeons 1 and 2), each using two different methods. One method is to make a straight incision (SI) on the side of the vessel, and the other is to punch out (PO) the vessel in an oval shape with short and long diameters of 2 mm and 4 mm, respectively. Then, a 3.5 mm-expanded polytetrafluoroethylene (ePTFE) graft (GORE PROPATEN; W. L. Gore & Associates, Inc., Tokyo, Japan) was anastomosed to the SI and PO anastomosis site using 7-0 polypropylene continuous sutures. The Young’s moduli of the silicone container and ePTFE grafts are approximately 2 MPa and 0.5 GPa, respectively, and their Poisson’s ratios are approximately 0.4 and 0.3. The model number was defined as shown in Table 1, where SI and PO represent the type of arteriotomy, and numbers 1 and 2 represent surgeons 1 and 2, respectively.

Procedure of computational fluid dynamics analysis of the anastomosis model.
Model numbers of the anastomosis models
A dental impression material (Exafine injection type; GC Corp., Tokyo, Japan) was injected into the mock vascular anastomosis models, resulting in a pressurized shape inside the models. The lumen shape of the models was measured by X-ray computed tomography (CT) (TOSCANER-32300 μFD; Toshiba, Tokyo, Japan).
The procedure for constructing anastomosis models is summarized in Fig. 1. Blood vessel models with a straight incision and an oval hole were prepared by the following procedure. A blood vessel model with an inner diameter of 3 mm, an outer diameter of 4 mm, and a length of 100 mm was created using computer-aided design (CAD) software (Inventor 2023; Autodesk, Inc., San Francisco, CA, USA). A model with a rectangular hole of 6.4 mm × 0.5 mm to mimic a straight lateral incision and a model with an oval hole of 4 mm long and 2 mm short diameters to mimic a punch-out hole were prepared. The blood vessel model was divided into computational grids and imported into structural analysis software (Ansys Mechanical; ANSYS, Inc., Canonsburg, PA, USA), and the density, Young’s modulus and Poisson’s ratio were set to 1000 kg/m3, 2.0 MPa and 0.40, respectively. These values are the physical properties of the blood vessel [15]. A static pressure of 6650 Pa (= 50 mmHg) was applied to the luminal surface of the blood vessel model to compute the deformation of the model. The internal domain of the deformed blood vessel model was used for the following CFD analyses.
Three-dimensional anastomosis models were constructed using CT data. A smoothing process was applied to the model for removing surface roughness caused by CT measurement noise. The anastomosis models were edited using a design modeler (SpaceClaim; ANSYS, Inc., Canonsburg, PA, USA) to create a geometry suitable for CFD analysis as follows.
The models were converted to computer-aided design geometries. Anastomotic sites were extracted from these models and merged into the deformed blood vessel model with a hole created by either a straight incision or punch-out method. All tube ends were extended by 10 times their respective diameters to minimize the effect of boundary conditions on anastomotic flow during CFD calculation. Computational meshes were generated to discretize the entire domain within the anastomosis model. Ten thin layers of triangular prism elements were generated near the wall region to resolve the flow field with a high-velocity gradient, and tetrahedral elements were generated in the remaining region.
The constructed model had three end faces: one end of the graft and both ends of the vessel model (Fig. 2). A Cartesian coordinate system was introduced. The coordinate origin was placed at the junction of the graft and vessel, and the z-axis was taken in the distal direction of the central axis of the vessel. The end surface of the graft was defined as the inlet, and a uniform velocity corresponding to a flow rate of 80 mL/min was applied to the plane. One end of the blood vessel model was defined as the outlet plane, and a flow rate of 60 mL/min was applied to the outlet plane. The other end of the blood vessel model was defined as the opening plane, and a static pressure of 0 Pa was applied to the opening plane.

Computational model of a mock vascular anastomosis model and boundary conditions for computational fluid dynamics analysis.
Assuming that blood is an incompressible Newtonian fluid, the density and viscosity of working fluid were set to 1,060 kg/m3 and 3.60 mPa⋅s, respectively. Navier–Stokes equations with a turbulent model of k-𝜔 SST model were solved using a commercial CFD code (ANSYS CFX 2021R2; ANSYS, Inc., Canonsburg, PA, USA), and steady-state analyses were performed. In addition, transient analyses were also performed to investigate the effect of the pulsatile flow on the stress at the anastomotic site. A time-varying flow rate with a period of 1 s, as shown in Fig. 3, was applied to the end surface of the graft, and the 75% of the flow rate was applied to the outlet plane of the blood vessel mode, and transient Navier–Stokes equations were calculated with a time step of 0.01 s. Three cycles of blood flow calculations were conducted, and the results of the last cycle were used for evaluation.
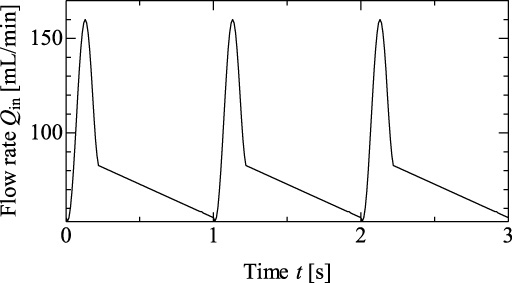
Time-varying flow rate applied to the inlet plane for transient analysis.
In this study, flow field was evaluated using helicity H, the magnitude of the wall shear stress (WSS), and the spatial gradient of WSS (WSSG) for the static analyses results, and time-averaged WSS and WSSG (TAWSS and TAWSSG) for the transient analyses results.
H was calculated from the following volume integral:
WSS was calculated from Eq. (2),
The strain rate tensor
WSSG was calculated from Eq. ((4)).
CT measurements of the mock vascular anastomosis model
The cross-sectional shapes of the anastomosis models are shown in Fig. 4. The shape varies depending on the surgical procedure and surgeon. The anastomotic cross-section shape of SI-1 was close to an ellipse; on the other hand, the anastomosis of SI-2 was narrowed, and the cross-sectional shape was close to a rectangle. The shape of the anastomotic cross-section of the PO model was oval, with a slightly smaller ratio of long-to-short diameter (L∕S) than that of the puncher (L∕S = 3) used to excise a part of the vessel wall. The L∕S ratios of the anastomosis models are summarized in Table 2. This shape was observed in both PO-1 and PO-2.

Shape of the cross-section including the anastomotic line of each model.
Shape of anastomotic opening
The flow fields in the mock vascular anastomosis models are shown in Fig. 5. A stagnation point is observed on the floor of the vessel. A relatively high flow velocity region was found around the junction of the graft and vessel in SI-1. Similarities in flow patterns between PO-1 and PO-2 were confirmed.

Flow fields on the central cross-section in anastomosis models.
Three-dimensional flow patterns of the anastomosis models are shown in Fig. 6. A pair of Dean vortices was created on the distal side of the vessel.

Three-dimensional flow pattern in anastomosis models.
Helicity, which represents the degree of linkage of the vortex lines of a flow, was calculated. Changes in the maximum absolute value of helicity |H|max in the direction distal to the junction are shown in Fig. 7. The |H|max of the SI-1 model was higher than that of the PO models. The decrease in |H|max was faster for PO-1 than for PO-2.

Maximum absolute value of helicity in the vessel.
WSS distributions over the walls of the anastomosis models are shown in Fig. 8. Its distribution on the vessel floor was similar for all models. WSS was locally low at the stagnation point. The relatively high WSS region surrounding the stagnation point was distributed slightly more toward the distal side than toward the proximal side. The WSS around the anastomotic line was high for SI-1. The TAWSS distribution for each model is almost similar to the WSS distribution in the steady-state analysis.

Wall shear stress and time-averaged wall shear stress distributions of anastomosis models.
A significant difference in WSSG distribution was observed for all models (Fig. 9). Although a high WSSG area was distributed over a wide area around the anastomotic line in the SI-1 model, high WSSG area is limited to a small portion of the PO model. In particular, the high WSSG area was small in the PO-1 model. The TAWSSG distribution for each model is similar to the WSSG distribution in the steady-state analysis, although there are some differences in values.

Wall shear stress gradient and time-averaged wall shear stress gradient distributions of anastomosis models.
In this study, CFD analysis of the anastomotic model assuming pulsatile flow was performed, and it was confirmed that the distribution patterns of WSS and WSSG in the steady-state analysis are almost the same as those of TAWSS and TAWSSG in the transient analysis, respectively (Figs 8, 9). This result indicates a certain validity of the evaluation based on the results of the steady-state flow analysis.
This study demonstrated two important issues. The punch-out method resulted in lower blood flow velocity at the anastomosis site and less energy loss than the conventional method. This novel SPS method can prevent morphological changes in the anastomosis caused by differences in the skill levels of surgeons.
Although the mechanism of shunt occlusion remains unclear, several studies have pointed out the contribution of peripheral (graft-to-pulmonary artery) anastomosis. Waniewski et al. [12] reported that platelet aggregation occurs at the graft outlet. Arnaz et al. [16] suggested that shunt occlusion is usually caused by an acute thrombus in peripheral anastomosis. Based on these reports, we believe that peripheral anastomosis plays a prominent role in shunt occlusion. Therefore, we created SPS-mock vascular peripheral anastomosis models and performed CFD simulations using two different anastomosis methods.
In the punch-out technique, the sectional area at the anastomosis site is larger and more rounded, with an oval shape, than in the slit technique, regardless of whether the surgeon was fully experienced or not. To the best of our knowledge, no clinical studies have investigated the influence of anastomotic techniques on SP shunt patency. The technique depends on the experience of the institution and surgeon, and slit arteriotomy has been performed conventionally. Although slit arteriotomy is the most common technique in which a scalpel is used to make a longitudinal incision, suturing is difficult due to the closed margins [17,18]. Tsukui et al. [19] reported that the anastomosis shape would not be perfectly round even if it was sutured by an experienced surgeon. In contrast, the punch-out technique allows surgeons to perform symmetrical, sharp, clean, and oval arteriotomy [17,20]. Therefore, the punch-out technique can contribute to an easy anastomosis procedure and help prevent technical errors.
In our study, a locally elevated distribution of the WSS around the anastomotic line of the SI-1 model was due to an increase in the velocity gradient associated with a decrease in the cross-sectional area. In the PO models, a locally elevated distribution of WSS similar to that of the SI-1 model was not observed. However, an elevated WSSG distribution around the anastomosis line was identified in all models. The area of the region where WSSG exceeds 9.5 kPa/mm was the largest in SI-1, followed by PO-2 and PO-1. Intimal hyperplasia (IH) is believed to occur in areas exposed to nonphysiological WSS patterns (disturbed shear) [21], and studies using CFD [22,23] have suggested that WSS distribution is associated with plaque formation, endothelial vessel layer damage, and platelet activation [24]. Waniewski et al. [12] reported that platelets can be activated by high shear stress, leading to thrombosis. Furthermore, a high shear stress enough to activate platelets is present in the SPS configuration. Therefore, the risk of stenosis formation around anastomosis can be considered the highest in SI-1. Furthermore, the risk of stenosis in PO-1 was lower than that in PO-2.
However, there were no significant differences in WSS and WSSG distributions on the vessel floor for any of the models (Figs 8 and 9). The risk of IH on the vessel floor was comparable in all models. Helical flow is believed to suppress the disturbed shear [25]. If this empirical observation is correct, the risk of IH occurrence would be higher on the proximal side than on the distal side, as is the case for all models, because the intensity of the helical flow is lower on the proximal side, as shown in Fig. 6. Thus, from the viewpoint of reducing stenosis formation and improving the patency rate, the PO method is superior to the SI method.
Previous studies have reported the factors that increase shear stress, e.g., the length and curvature of the graft, as well as the anastomotic angle [8,12,16,26]. However, there is limited space to place the shunt, which is mostly determined by the structure of the patient [26]. We believe that the anastomotic technique is one of the most essential components of the SPS procedure for preventing shunt thrombosis. Anastomotic distensibility and narrowing due to the presence of sutures can influence hemodynamics and shunt patency [14]. Using the punch-out technique, surgeons can create a larger cross-sectional area at the anastomosis site that is similar to the shape and size of the graft. Thus, this can contribute to establishing an appropriate WSS distribution and preventing shunt obstruction.
Research into the problems surrounding the anastomosis site caused by compliance mismatch due to material differences between native vessels and artificial blood vessels has a long history and remains a critical topic. For example, the studies by Yokobori et al. have explored the comparative strength and endurance of anastomosis using different vascular graft materials [29]. These studies provide valuable insights into how the physical properties of materials affect the mechanical response and long-term outcomes at the anastomosis site, making a comparative analysis with our CFD results highly meaningful. We believe that re-examining these classical issues using advanced analytical methods like CFD is essential for improving surgical techniques in modern vascular surgery.
Limitations
This study focused on the effect of the anastomotic shape of the blood flow field in vascular anastomosis models. There are limitations associated with the computation by assuming rigid walls and a Newtonian fluid. However, the sensitivity of WSS to rheological models (reference high-shear Newtonian viscosity, non-Newtonian rheology models, and Newtonian viscosities based on characteristic shear rates or, equivalently, assumed hematocrits) has been shown to be nearly seven times less than that of geometric uncertainty. Although ignoring the shear-thinning property of blood reduces the accuracy of the analysis, it is acceptable for the purposes of this study.
Studies have shown that wall compliance and motion in the systolic phase enhance helical flow in the vessel. The enhancement of helical flow has been shown to reduce shear disturbance and the risk of stenosis formation. Therefore, the worst-case scenario for stenosis formation is assumed by not considering pulsatile flow and the compliance of the vessel wall. These assumptions make it reasonable to simply compare the risk of stenosis between the models.
Further research is required to evaluate the clinical hemodynamics of patients who underwent SPS using the punch-out technique. For example, Young’s moduli of blood vessel and graft are approximately 2 MPa and 0.5 GPa, respectively [15]. The compliance mismatch between the vessel and the graft is large and expected to result in vessel shape changes during the cardiac cycle, thereby causing fluctuations in WSS. Such flow is thought to contribute to the triggering of intimal hyperplasia [27,28]. To reproduce this phenomenon, a fluid-structure interaction analysis considering the compliance of the vessel and graft is required. Additionally, we did not analyze the impact of the angle between the graft and the vessel on hemodynamic outcomes. Recognizing this as a limitation, future studies are necessary to explore how different angles might influence flow dynamics and stress distribution at the anastomosis site. This aspect is crucial for a more comprehensive understanding of graft-vessel interactions and their implications on surgical outcomes.
Conclusion
We demonstrated that the punch-out technique can reduce the possibility of a high WSS distribution using CFD simulations. Moreover, a clean and oval arteriotomy is performed using this technique, contributing to ease in performing anastomosis. From both hemodynamic and technical perspectives, this study suggests that the punch-out technique is efficient in preventing obstruction during SPS.
Footnotes
Acknowledgements
The authors have no acknowledgments.
Conflict of interest
The authors declare that they have no conflict of interest.
Funding
The authors report no funding.
Author contributions
SY and RK created the anatomical models. SY and TY collected the data and drafted the manuscript. RK, KD, and MM reviewed the manuscript. All authors have read and approved the final version of the manuscript.