
Abstract
BACKGROUND:
Kinematic analysis has been a dominant tool for addressing the neuromuscular and proprioceptive alterations that occur in Low Back Pain (LBP) patients. Movement variability is a crucial component of this analysis. In the recent years application of non-linear indices seems to be showing the way.
OBJECTIVE:
The aim of the study was to compare movement variability, as expressed mainly by non-linear indices, at the pelvis and lumbar spine between LBP patients and healthy participants during gait.
METHODS:
Sixteen (16) LBP patients and thirteen (13) healthy control subjects (non-athletes) participated in the study. Participants walked on a treadmill at different walking conditions while recorded by a 6-infrared camera optoelectronic system. Kinematic variability of pelvic and lumbar movement was analyzed using linear (standard deviation – SD) and non-linear indices (Maximal Lyapunov Exponent – LyE and Approximate Entropy – ApEn).
RESULTS:
Healthy subjects were found to have significantly greater mean values than LBP patients at seven pelvic and lumbar components in LyE, ApEn and SD. Specifically, the calculated LyE at the pelvis during normal gait was proven to have a sensitivity of 92.3% and a specificity of 90% in the discrimination of healthy subjects from LBP patients. Female subjects presented with higher variability in gait measures than males.
CONCLUSION:
Healthy participants presented with higher movement variability in their kinematic behavior in comparison to LBP patients. Lower variability values may be partly explained by the attempt of LBP patients to avoid painful end of range of motion positions. In this perspective non-linear indices seem to relate to qualitive characteristics of movement that need to be taken into consideration during rehabilitation.
Keywords
Introduction
Low Back Pain (LBP) has been the most common health problem in western countries [1, 2]. LBP incidence is 18.6% in general population while at ages between 30 and 50 years it is the most expensive health care problem [3, 4]. Kinematic analysis has been a dominant tool for addressing the neuromuscular and proprioceptive alterations that occur in LBP patients [5, 6]. Movement variability is a crucial component of this analysis and can be described as the physiological alterations of human performance [7]. From a certain perspective abnormal human movement variability includes all the unorthodox kinematic behavior and can be minimized by continuous training [8]. Human movement can be described by complex non-linear systems with underlying patterns, constant feedback loops, repetition, self-similarity, fractals, and self-organization [9]. However, is all this variability unnecessary noise or is it the basis of efficient and unperturbed gait?
Linear mathematics rather fail to describe the amount of variability since they average data and ban any unwanted ‘noise’ thus missing the temporal variation of movement structure [10, 11]. On the contrary, non-linear tools can effectively describe these aspects as they measure both randomness and periodicity of a time series. The most commonly used non-linear statistical tools in human gait are Approximate Entropy (ApEn) and the Maximal Lyapunov Exponent (LyE). They both describe regularity and, subsequently, the amount of randomness. Higher ApEn values describe a more irregular and non-repetitive system usually with decreased movement control and neuromuscular coordination [12]. LyE is widely used in measuring gait stability [13, 14]. It measures the structure of variation and is particularly sensitive to data with periodic nature [10, 15].
According to a relatively recent theoretical frame [7], every system is characterized by a state of Optimal Movement Variability which is defined by the ideal amount of normal variations that a specific task includes with a specific temporal structure of variability. Less amount of variability entails a more rigid system, highly predictable and less adaptable to external perturbations, while higher variability describes a more unstable, noisy and unpredictable system. Various biological systems like heart beats, blood pressure and gait function according to chaotic rhythms [10]. Human gait should be analyzed in terms of fractal dynamics and deterministic chaos: human gait is not limited by determinism but is constantly readapted to environmental demands in ways that cannot be foreseen [16]. Pathological gait models present either with excessive periodicity and predictability or extended randomness and irregularity [17, 18].
Stergiou et al. [10] investigated movement variability in (10) participants with unilateral anterior cruciate ligament (ACL) deficiency during normal gait. Local knee stability in the sagittal plane was assessed by comparing the largest LyE values of the intact knee to the injured one. Regardless of the walking speed the injured knee had significantly higher LyE values indicating a more locally unstable knee, less able to adjust to random perturbations.
Zampeli et al. [19] attempted to verify the above results in backward walking. 15 ACL arthroscopically confirmed deficient patients were compared to 10 healthy subjects in backward walking at their self- selected speed. The maximum LyE of both knees was calculated. The control group had significantly higher LyE values than the experimental group in both knees. In addition, the intact knee of the experimental group had higher LyE values in comparison to the ACL deficient knee. The experimental group presented with a more rigid movement behavior indicating restricted neuromuscular coordination and limited adaptability in environmental perturbations [19]. Quadriceps inhibition and the loss of mechanoreceptors are the reason for these kinematic variations [20, 21, 22]. The lower LyE of the intact knee of the experimental group is attributed to biomechanical changes of the entire limb [10, 23].
Steele et al. [24] investigated movement variability of the lumbar spine using a 10 camera 3D analysis system in normal gait (8 meters distance) after applying a 12-week muscle strengthening program of lumbar extensors once a week. The outcome measures included angular displacement, kinematic waveform pattern (CVp) and offset (CVo) variability. No differences were identified in the frontal and transverse plane. However, differences reached statistical significance in the sagittal plane in the control groups indicating an improved repeatability of the movement pattern. However, the reflective markers were placed only in T12 and S1 spinous processes rather failing to sufficiently describe the movement of the lower back. In addition, the frequency of the intervention protocol was clinically inadequate.
A particularly comprehensive clinical trial was conducted by Papadakis et al. [25] who investigated movement variability of 35 patients with lumbar stenosis in comparison to healthy individuals during a 40 m normal walking. A 3-axial accelerometer at 128 Hz was placed on the spinous process of L5. Only the vertical z-axis acceleration was used and differential entropy algorithm – which is an extension of Shannon’s entropy to continuous variables – was implemented. The experimental group indicated higher values of entropy exhibiting higher ‘movement irregularity’ levels. These findings are attributed to a possible reformation of the gait pattern resulting in irregular and unpredictable movement behavior [25]. Furthermore, the Receiver Operating Characteristic (ROC) (graphical plot that illustrates the diagnostic ability of a binary classifier system as its discrimination threshold is varied) successfully identified 97.1% of the LBP group and 80.0% of the healthy participants reaching a 97.6% in distinguishing the two groups.
In the present study, it is expected that the LBP group will present with lower ApEn and/or LyE values, underlying less variability in the temporal structure of their gait pattern.
Materials and methods
Participants
Sixteen (16) LBP patients and thirteen (13) healthy control subjects (non-athletes) participated in the present study. This number of participants is quite sufficient for performing gait analysis [17]. The subjects were sufficiently matched in terms of somatometric features, gender (10/16 (62.5%) vs 8/13 (61.5%) males in the LBP and healthy group respectively) and age (45.6
Measurement procedures
Participants walked barefoot on a motorized treadmill for 30 seconds [29] (Pegasus
Condition A: Walking at a speed chosen by the subject with no inclination of the treadmill. Condition B: Walking at a speed of 5 Km/h with no inclination of the treadmill. Condition C: Walking at a speed of 5 Km/h with an inclination of a 7
Two attempts were performed for each condition. Prior to the initiation of the recording participants had a 6 min familiarization period on the treadmill [34].
Measurements were acquired for two body segments: pelvis and lumbar spine simultaneously for three components (X, Y, and Z). In the lumbar spine the X component signifies the lateral flexion, the Y component is flexion-extension and the Z component measures the axial rotation. In the pelvis the X component is the lateral tilt (elevation-depression), the Y component is the anterior-posterior tilt and the Z component is again the axial rotation.
Each measurement was performed for 30 seconds and the recording was performed at a rate of 100 frames per second, yielding in each case a time series of around 3000 values. From each time series a time window of 2800 values were taken from 101 to 2900 frames. For each time window three parameters were evaluated: the linear parameter of Standard Deviation (SD) and the non-linear parameters of (ApEn) and (LyE). All calculations were performed in the R software package.
Data acquisition
The 6-infrared camera optoelectronic system Vicon (Vicon Motion Systems Ltd, UK) of ELEPAP (Gait & Motion Analysis Lab-Athens) was used for the 3D kinematic data acquisition using the Vicon Nexus software. The specific system has been characterized as the ‘gold standard’ in gait analysis and has been used by numerous researchers in the last years [24, 25]. The sampling rate was set at 100 Hz and the data were used unfiltered to avoid unnecessary normalization. Reflective markers were placed on specific anatomic landmarks according to the “Plug-In-Gait model” by the same examiner. More specifically, markers were placed (for both limbs) on the skin surface of anterior superior iliac spine, mid-thigh, lateral femoral epicondyle, mid-tibia, lateral malleoli, outsole of the foot, at the second metatarsal head and heel. As far as the lumbar spine is concerned reflective markers were placed on the spinous processes of the 1
Statistical analysis
Reliable measurements throughout a total time window of 2800 frames were obtained from 29 subjects, 13 controls and 16 LBP patients. Each of the three measured parameters (SD, ApEn and LyE) yielded 18 calculated variables (3 conditions X 2 body segments X 3 components), where conditions, body segments and components have been explained above. Thus, there were 54 variables, each calculated twice. Preliminary analysis proved that the repeated measurements for each variable did not differ significantly, thus providing a further validation of the measurement and calculation methods. Consequently, the average values for each of the repeated values were taken.
The between groups and between gender differences of the calculated measurements were evaluated with the independent samples
System and kinematic evaluation.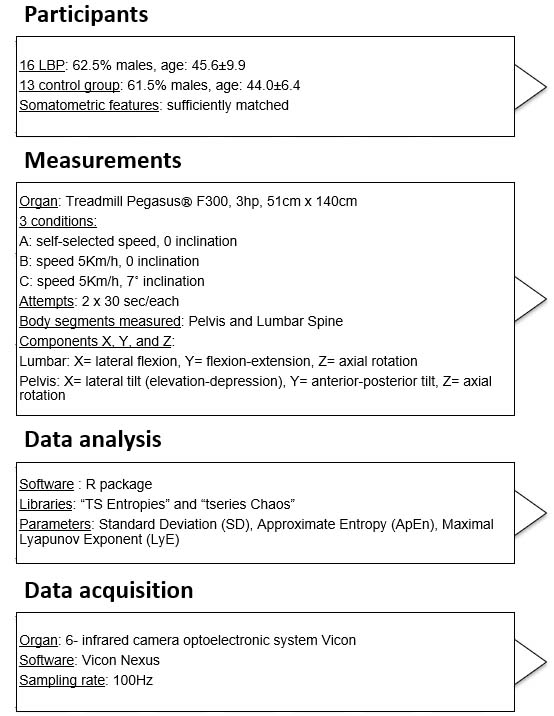
Seven (7) variables from a total of fifty four (54) yielded statistically significant differences between the means of the control and LBP subjects’ independent samples
Statistically significant differences in all 3 components (X, Y, Z) between LBP and controls in descending order of significance. In all the seven (7) findings the mean values for the controls were significantly greater than that of the LBP subjects (Fig. 2)
Statistically significant differences in all 3 components (X, Y, Z) between LBP and controls in descending order of significance. In all the seven (7) findings the mean values for the controls were significantly greater than that of the LBP subjects (Fig. 2)
Mean values of the two groups for the seven components. The axis labels (e.g. A, Pelvis, X) show the condition, body segment and component. The error bars are the standard errors of the means.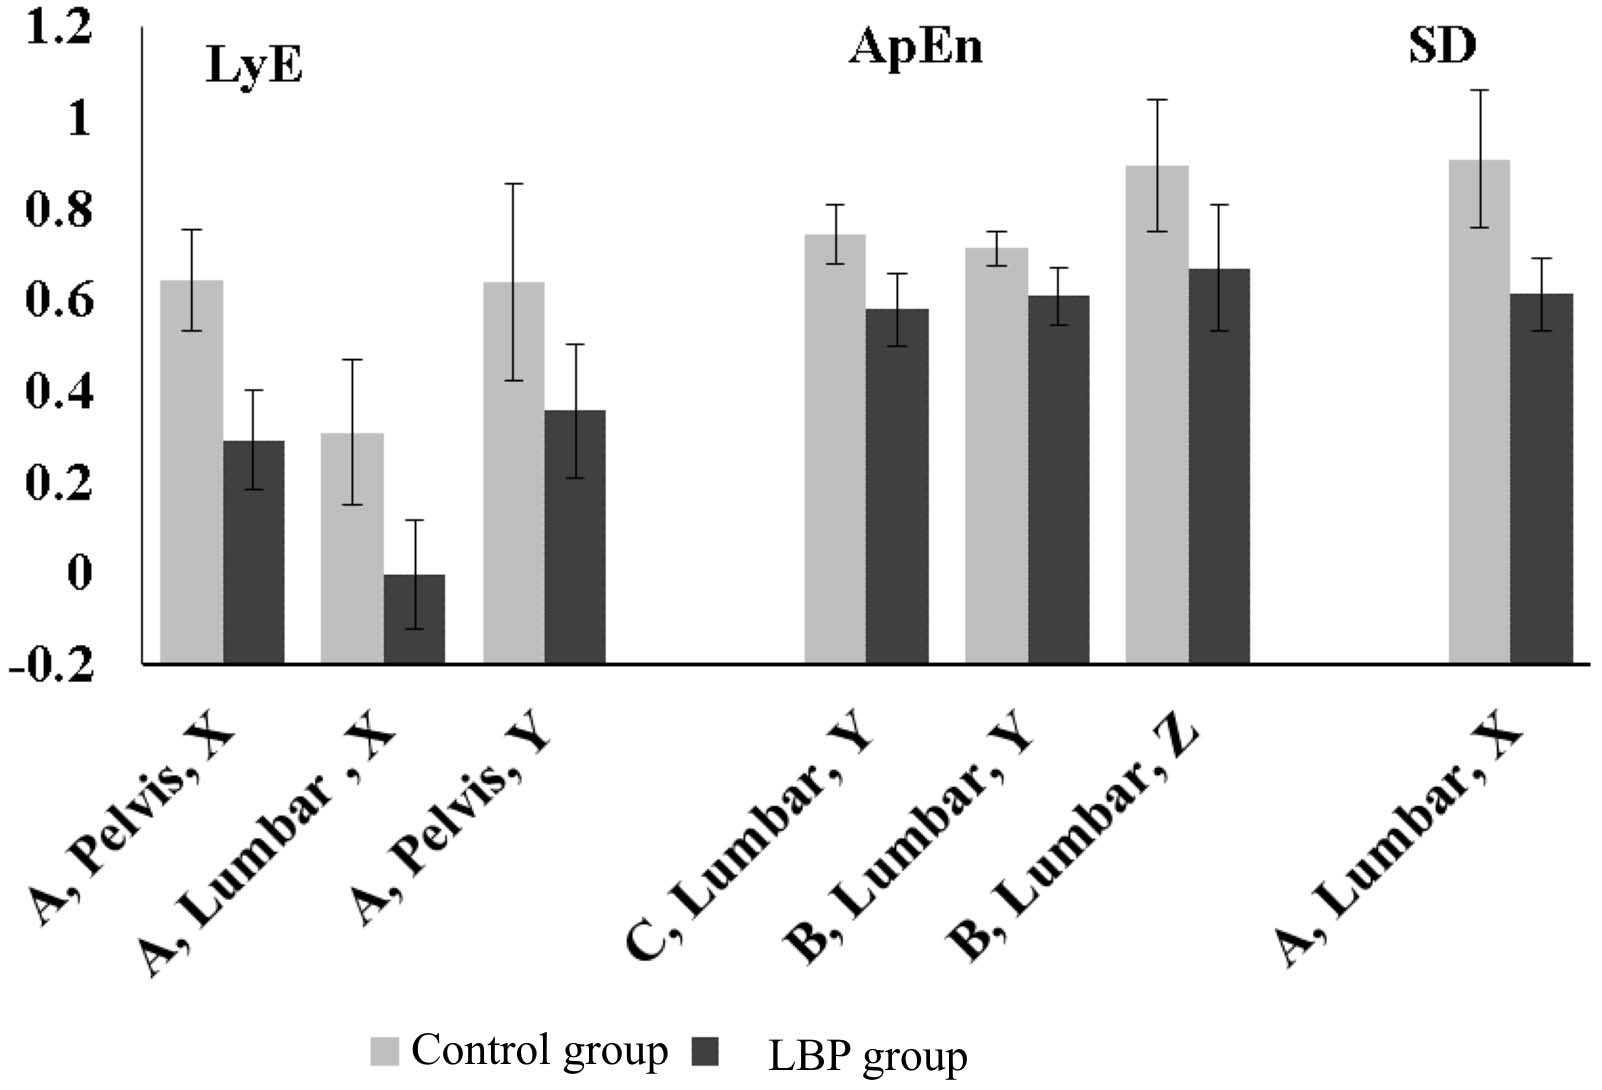
It is interesting that all the above findings were also dependent on gender, with females having statistically significantly greater mean values than males. For example, for the Lye parameter, in condition A, body segment Pelvis, component X the mean value for the eleven female subjects was 0.60
Mean values of the females and males of controls and experimental subjects for the Lye parameter, in condition A, body segment Pelvis, component X. The error bars are the standard errors of the means.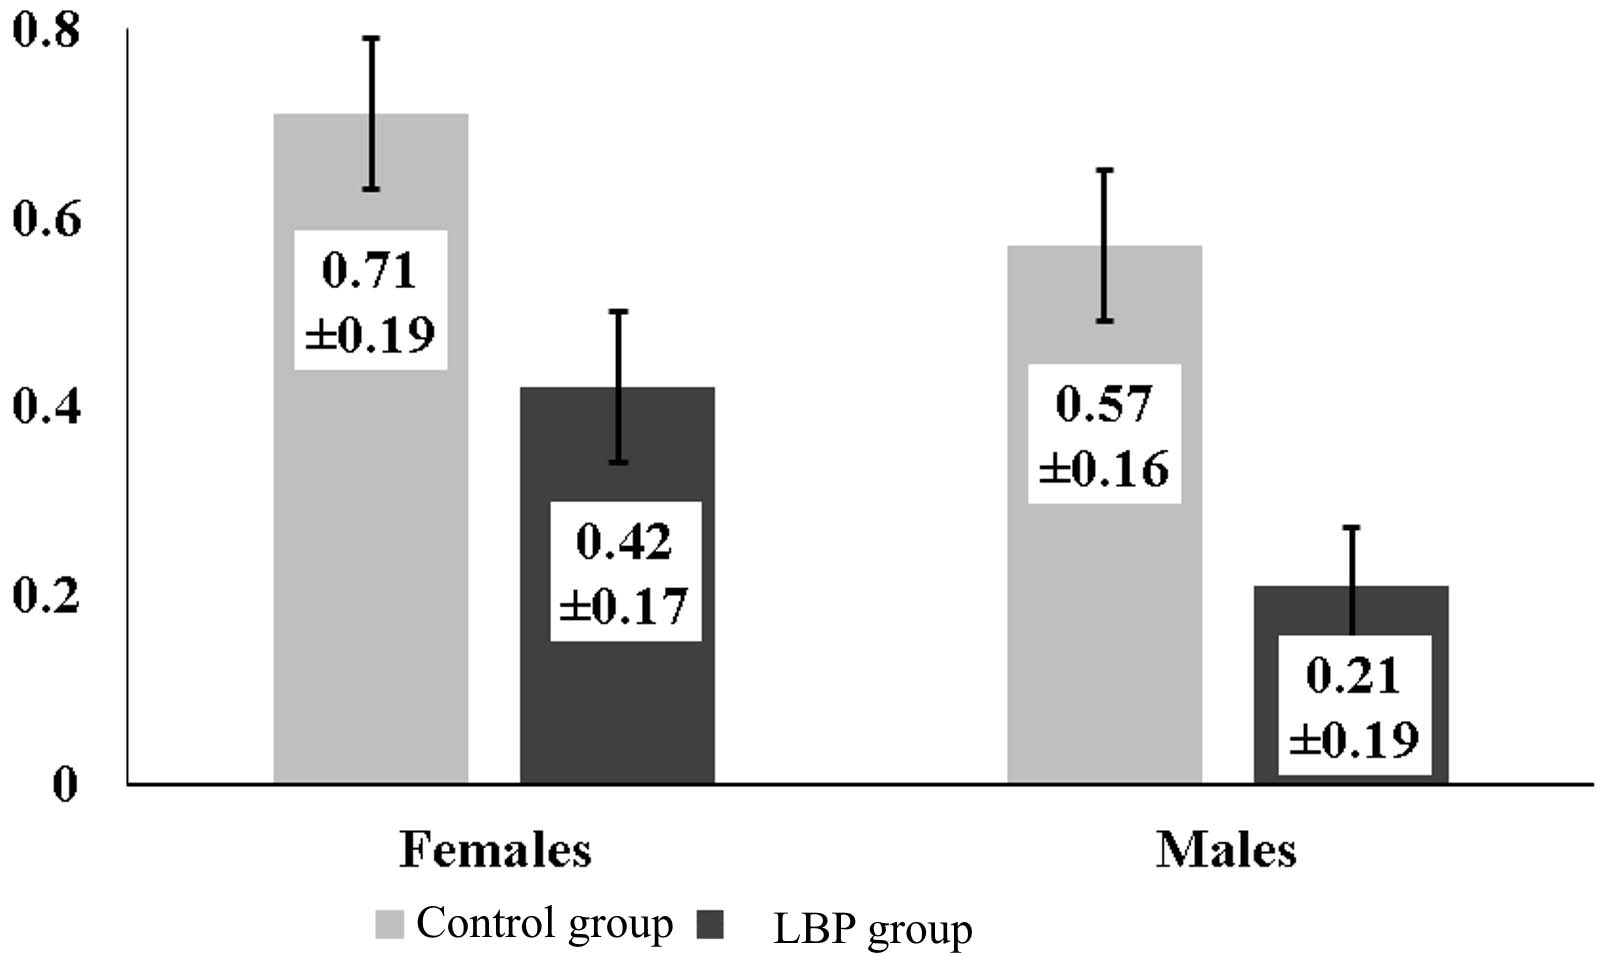
The Lye parameter, in condition A, body segment Pelvis, component X by itself has a very significant ability to discriminate healthy controls from LBP subjects (Fig. 4). The area under the curve (AUC) was 0.900,
ROC curve for the discrimination ability of the Lye parameter, in condition A, body segment Pelvis, component X. Shown are the area under the curve (AUC) and its 95% confidence intervals (CI) and its significance.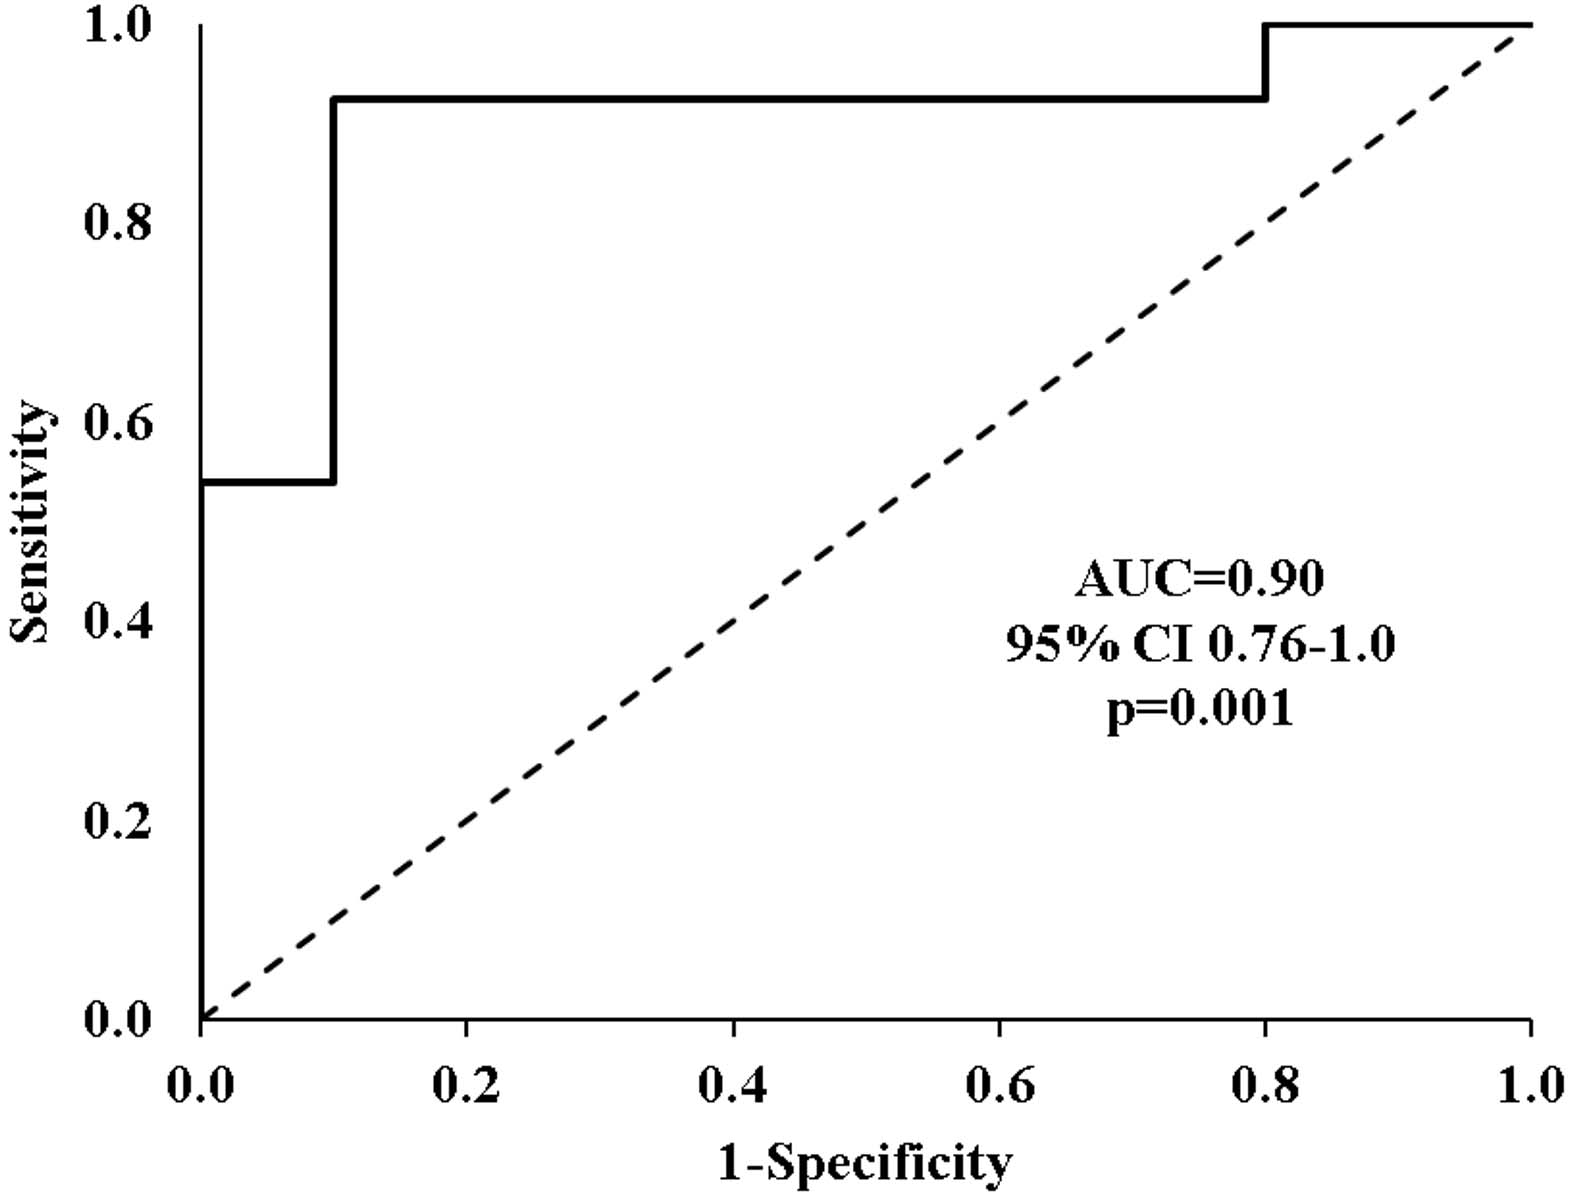
Youden index depending on the LyE values of the Lye parameter, in condition A, body segment Pelvis, component X.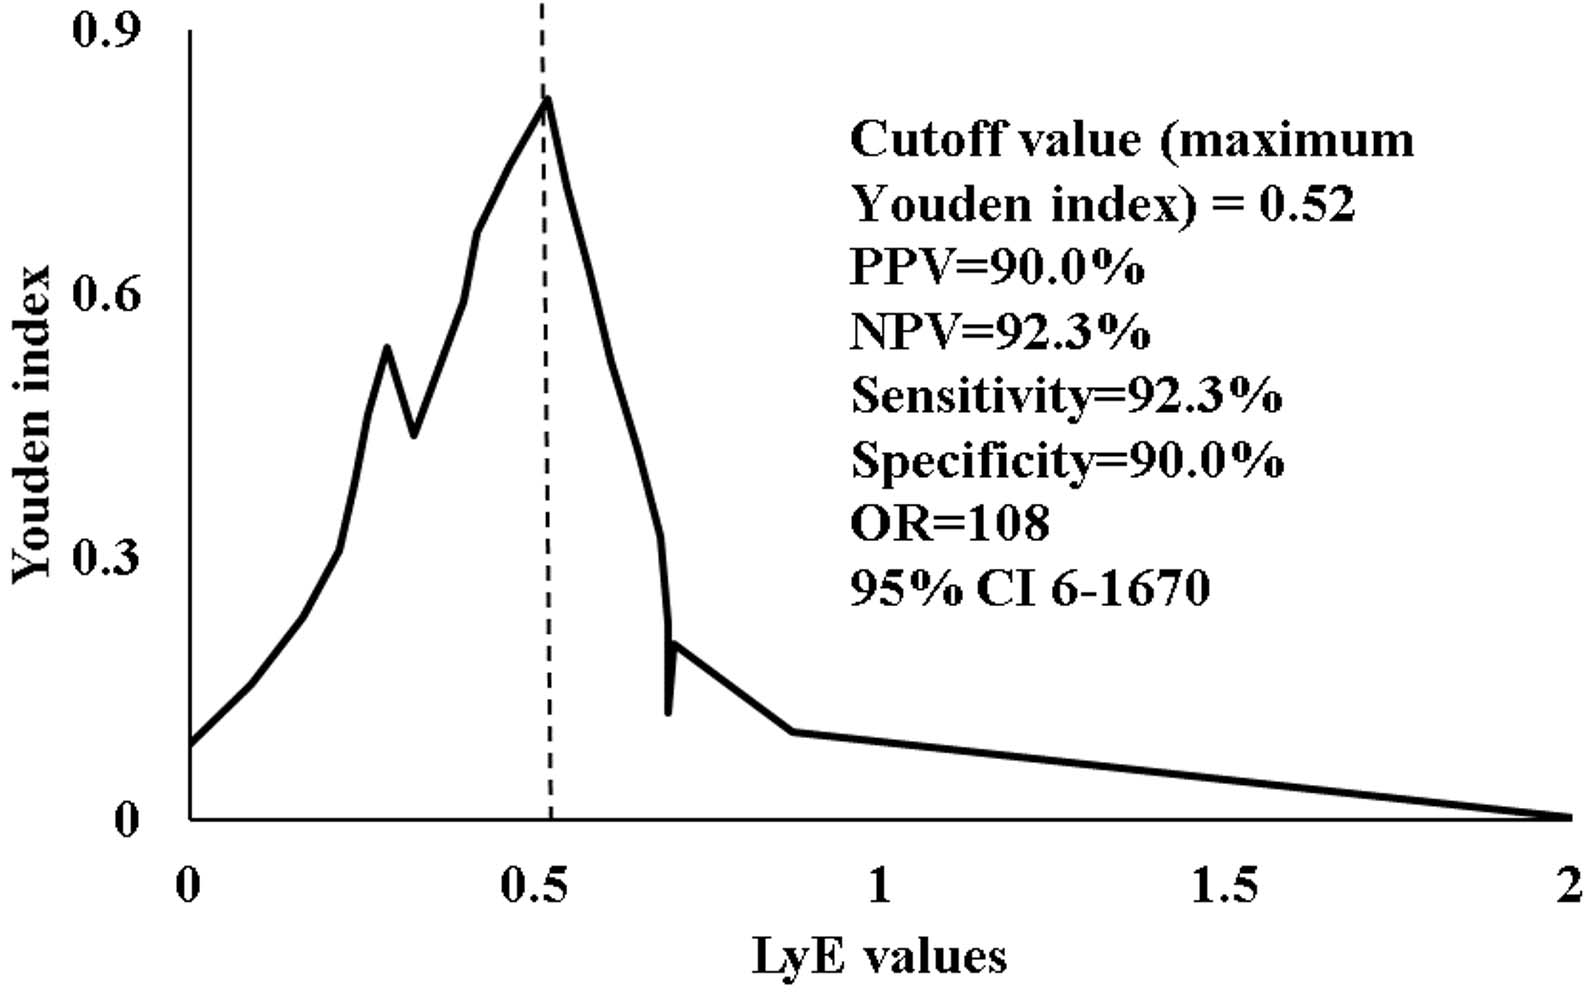
According to the Youden index the cutoff value that yielded the best tradeoff between sensitivity and specificity for the discrimination ability between controls and LBP subjects was 0.52 (Fig. 5).
Ten (10) subjects with LyE value greater than 0.52 were identified, nine (9) of which belonged to the control group. This gives a negative predictive value (NPV) of 90%. Similarly, there were thirteen (13) subjects with a LyE equal to or less than 0.52, twelve (12) of which were LBP subjects, yielding a positive predictive value of 92.3%. The sensitivity and specificity were also quite high (92.3% and 90% respectively). This means that the calculation of just one LyE value in condition A, body segment Pelvis, component X can practically lead to an almost perfect differential diagnosis of the presence of LBP.
The aim of the present study was to investigate movement variability in LBP population in comparison to healthy subjects during gait using linear (SD) and non-linear (Lye and ApEn) indices. Results showed that healthy participants presented with higher LyE, ApEn and SD values indicating higher variability levels and, therefore, a more elaborate kinematic behavior in comparison to LBP patients.
The outcomes of the present study align with Optimal Movement Variability perspective since the results demonstrated a more intricate movement pattern for healthy participants in comparison to LBP sufferers. As far as the lumbar spine is concerned the control group presented with higher LyE and ApEn values indicating higher variability levels and, therefore, a richer movement repertoire which is the outcome of an enhanced somatosensory feedback. LyE values of the lumbar spine are in absolute accordance to the pelvis, both describing the movement pattern of the lumbo-pelvic complex. The differences are found in both the coronal and frontal plane. The ApEn values for the control group decrease in conditions B and C where the neuromuscular activation and coordination demands are higher and a more integrated proprioceptive feedback is essential. During gait healthy individuals are capable of dealing with more ‘unstable’ situations as they can apply a wider number of kinematic responses. On the contrary, LBP sufferers seem to adopt a stiffening strategy which disables them from adapting to random environmental disturbances render them susceptible to injury.
Similar to the results of the present study, Williams et al. [35] supported that participants with LBP avoid end of range of motion (ROM) positions in an attempt to minimize the emerging pain by modifying their movement pattern as a result of inhibition or in order to achieve better active control. The absence of movement regularity-smoothness is the outcome of reduced proprioceptive income which derives from the underlying pathology [35]. Angular velocity and acceleration are significantly decreased in LBP population. However, ROM does not correlate with functional capability [36, 37, 38]. Williams et al. [35] also outlined that the quality of the lumbar movement pattern defines the incidence of LBP rather than the absolute ROM values or any other descriptive kinematics [35]. The use of non-linear mathematics seems to correlate better to the qualitative characteristics of movement rather than quantitative parameters as it is also shown in the present study.
Using a linear tool (Winter’s Coefficient of Variation – CoV) that measures the repeatability of a movement pattern Vogt et al. [39] reported increased stride-to-stride variability in LBP patients in the thorax and pelvis. The results of Vogt et al. [39] are in correlation to this study’s findings which also describes a more unstable and less effective movement pattern for the LBP group to all planes. However, in the present study the correlates to the pelvis while in the above mentioned study is connected to the thorax. In addition, Vogt et al. attributed the chronicity of the disease to neuro-muscular dysfunction like agonist-antagonist coordination which entails an amplified energy consumption [39]. According to Dingwell et al. [40] reduced or inadequate time, space or movement afferent feedback directly affects gait coordination resulting in an increase in the movement variability. Pain inhibition causes poor coordination in the entire lower limb-pelvis-lumbar spine complex, decreasing muscle efficacy and increasing fatigue levels [8]. Nevertheless, LBP patients counterbalance these deficits by recruiting compensatory movements during gait managing to reduce energy expenditure [41].
Clinical reverberations
From a clinical perspective, the effects of LBP are both muscular and neurological-proprioceptive [5]. As the muscular function is concerned, muscle inhibition is a main LBP disorder. LBP patients fail to support their torso and lower limb in an effective way. As a result, agonist muscle groups face fatigue much sooner than healthy individuals. Thus, a rehabilitation protocol must include muscle strength and endurance exercises in order to minimize any muscle inhibition muscle pattern. However, strength levels require normal mobility of the lumbo-pelvic girdle which directly affects the position of the pelvis (anterior-posterior, lateral and axial tilt) and, therefore, movement variability levels.
Another effect of LBP pathology is the alteration of muscle firing times due to nerve root compression at the intervertebral foramen section [6]. In this case, muscle coordination is affected. The effect on the movement pattern is inevitable and would result in different movement variability levels. Decompression of the pathologic intervertebral disc would enable transmission optimization of the nerve signals restoring normal movement of the pelvis and reduce muscle fatigue by enabling normal agonist-antagonist succession. In our opinion, muscle strength enhancement should be a follow-up to the restoration of neurological integrity since a disabled movement pattern can only be camouflaged by a vigorous musculature.
Inherent system variability
According to the theory of Optimal Movement Variability [7, 16] the ideal connection between predictability and complexity in gait is described as an inverted U-shape. The ideal movement variability is placed on top of the U-shape suggesting that reducing variability does not axiomatically entail reduction in gait stability. Kaipust et al. [16] demonstrated that the incremental modification of the fractal properties during gait becomes less complex when a stable and periodic auditory stimulus is imposed. In our study, auditory stimulus is replaced by LBP condition. LBP participants presented lower variability values possibly in an attempt to avoid painful ROM or in order to effectively control locomotion [16].
According to numerous researchers each system is characterized by an inherent variability of deterministic nature which is defined by the system’s underlying mechanisms [15, 42, 43]. This variability states the formation and perception of the movement pattern transfusing complexity to the system and enabling it to counterbalance random external perturbations [43]. Pathologic perturbations as well as age are connected to lower variability levels resulting in complexity reduction and insufficient functional adaptability [43].
Limitations of the study
One main limitation of the present study concerns to the markers’ placement. Athough the ‘Plug-In-Gait model’ provided by Vicon Motion Systems Ltd was thoroughly applied, the magnitude of measurement errors to L1-S1 region due to subcutaneous tissue transition cannot be precisely identified. However, any possible errors are minimized by the fact that the marker placed on L3 was used only as a guide marker. In addition, differentiating upper from lower lumbar spine was not technically possible. Future studies are called to describe the biomechanical alterations of each part of the lumbar spine and their impact on pathological gait adaptations. Correlation of lower limb kinematic behavior to pelvic movement would be of great scientific interest. Nevertheless, such analysis was not performed due to the amount of data required to be processed. Furthermore, the use of a motorized treadmill could add some bias to the data acquired [15]. However, Matsas et al. concluded that the collection of kinematic data on a treadmill can be generalized to overground walking [44].
Suggestions for future research
Deterministic chaos is definitely an essential component of healthy gait pattern. However, what is the ideal amount of variability that a kinematic system should have? Does higher variability entail a more stable kinetic behavior? The concept of Optimal Movement Variability seems to provide a sufficient theoretical frame for the above questions. However, defining the exact boundaries of the amount of variability for a given movement pattern yet remains to be done.
In various pathologies, like in LBP, the amount of variability is altered. The question yet remains whether variability increases or decreases. Researchers support either ways. Future studies are called to quantify the exact movement variability fluctuations each pathology induces.
From a clinical perspective, restoring the ideal amount of variability after its loss is the aim of every rehabilitation protocol. Proprioception training seems to be showing the way. Nevertheless, exercise programs are rather ‘blind’ since the clinician fails to evaluate the amount and quality of the training needed. Measuring movement variability in a clinical environment in a valid and reliable way has to be a future priority for the research community.
Conclusion
In conclusion, healthy participants presented with higher LyE, ApEn and SD values indicating higher variability levels and, therefore, a more intricate kinematic behavior in comparison to LBP patients. Lower variability values may be partly explained by the attempt of LBP patients to avoid painful end of range of motion positions. In this perspective non-linear indices seem to relate to qualitive characteristics of movement that need to be taken into consideration during rehabilitation.
Footnotes
Acknowledgments
We would like to express our gratitude to Onassis Foundation for its kind and valuable ethical and economic support to the accomplishment of the present study.
Conflict of interest
We hereby declare that there is no conflict of interest regarding the content of the present manuscript.