
Abstract
OBJECTIVE:
To evaluate the diagnostic performance of shear wave speed (SWS) within the lesion, fat-to-lesion speed ratio (FLR), and gland-to-lesion speed ratio (GLR) for differentiation between benign and malignant breast lesions using a novel SWS imaging technique.
METHODS:
From April 2016 to June 2016, 182 breast lesions were prospectively included in the study. For each lesion, SWS-lesion, FLR, and GLR were calculated. Pathological results were used as the reference standard. Receiver operating characteristic curves (ROC) were plotted to assess the diagnostic performance.
RESULTS:
Of the 182 lesions, 142 (78.0%) were benign and 40 (22.0%) were malignant. Significant differences were found between benign and malignant lesions in SWS-lesion, FLR and GLR (2.12±0.64 m/s vs 3.87±1.45 m/s, 1.63±0.61 vs 2.60±1.04, and 1.33±0.39 vs 2.08±0.78, respectively. All P < 0.001). The optimal cut-off values of SWS-lesion, FLR, GLR were 2.88 m/s, 2.31 and 1.51, respectively. The diagnostic performance of SWS-lesion in terms of AUC was the highest (i.e. AUC = 0.845), in comparison with FLR and GLR alone or their combination. The associated sensitivity, specificity, and accuracy for SWS-lesion were 75.0%, 89.4%, and 86.3%, respectively.
CONCLUSION:
SWS-lesion is a valuable and sufficient method for differentiation between benign and malignant breast lesions.
Keywords
Introduction
Ultrasound (US) in breast imaging, as a supplement to mammography, is widely used to distinguish malignant from benign lesions. Compared with mammography, conventional US is free of radiation and easy-performance. Besides conventional US, US elastography has recently emerged to detect malignant breast lesions from benign ones by assessing the stiffness of breast tissue, with the hypothesis that malignant lesions are stiffer than benign ones [1–3]. In 1991, Ophir et al. firstly proposed strain imaging as a noninvasive tool to estimate the stiffness of tissue [4]. In a published study with 550 patients, strain imaging has been shown useful for differentiation between malignant and benign breast lesions with a sensitivity of 78.0%, a specificity of 98.5%, and a accuracy of 93.8% [5]. However, strain imaging is a qualitative method for evaluating tissue stiffness, which has some limitations such as poor reproducibility and lack of quantitative information. Furthermore, several studies reported that strain ratio as a semi-quantitative method was used to differentiate malignant from benign breast lesions, which was calculated by dividing the mean strain of the reference normal breast tissue by the mean strain within the lesion [6–9]. In general, the normal breast tissue includes fatty tissue and glandular tissue. A vitro study by Krouskop et al. showed that fatty tissue and glandular tissue had different stiffness [10]. So far, there has been no consistency in selecting the reference tissue to calculate the strain ratio. Zhou et al. compared the diagnostic performances of the strain ratio using different reference tissue (i.e. fatty tissue and glandular tissue) and found that the fatty tissue was better for calculating strain ratio in breast elastography [7]. The strain ratio is a semi-quantitative method based on a 5-point elasticity scoring system (i.e. one main type of strain imaging) which is a qualitative method with some limitations as mentioned above.
Recently, shear wave speed (SWS) imaging has been introduced into clinical practice with an aim to avoid the shortcomings of strain imaging, of which the elasticity of tissue can be quantitatively reflected through the measurements of the transverse shear wave propagation (m/s) under the acoustic radiation force impulse emitted from the transducer. In a published study by Li et al., adding SWS imaging to conventional US could improve the diagnostic performance in terms of the area under the curve (AUC) from 0.730 to 0.861 [11]. In comparison with previous studies using fat-to-lesion ratio (FLR) and gland-to-lesion ratio (GLR) with qualitative strain imaging, FLR and GLR based on quantitative SWS imaging might be more accurate to reflect the elasticity of tissue. Therefore, we hypothesized that FLR and GLR on SWS imaging might be useful for differentiation between benign and malignant lesions. The aim of the prospective study was to evaluate the usefulness of SWS within the lesion, FLR, and GLR on SWS imaging in the differential diagnosis between malignant and benign breast lesions.
Materials and methods
Patients
The prospective study was approved by our institutional ethics committee with informed consent obtained from all the patients. A total of 208 consecutive women with breast lesions which were palpable by clinicians or were noted incidentally during a prior imaging study were enrolled from April 2016 to June 2016. Each patient underwent US-guided core needle biopsy and/or surgery. The inclusion criteria for the breast lesions were as follow: (1) breast lesions with both conventional US and elastography evaluation before core needle biopsy and/or surgery; (2) solid or predominant solid lesions (<25% cystic); and (3) enough normal breast tissue surrounding the lesion. 26 patients were excluded because of the following reasons: (1) lesions with incomplete US or SWS imaging data (n = 18); and (2) lesions with treatments performed before enrollment (n = 8). Only one lesion per patient was included. For patients with multiple lesions (n = 68), the largest one in diameter or the highly suspicious of malignancy on US was analyzed. Finally, 182 breast lesions in 182 women (mean age, 45.9 years±14.6; range, 21–85 years) comprised the cohort. The flowchart for the selection of patients is presented in Fig. 1.
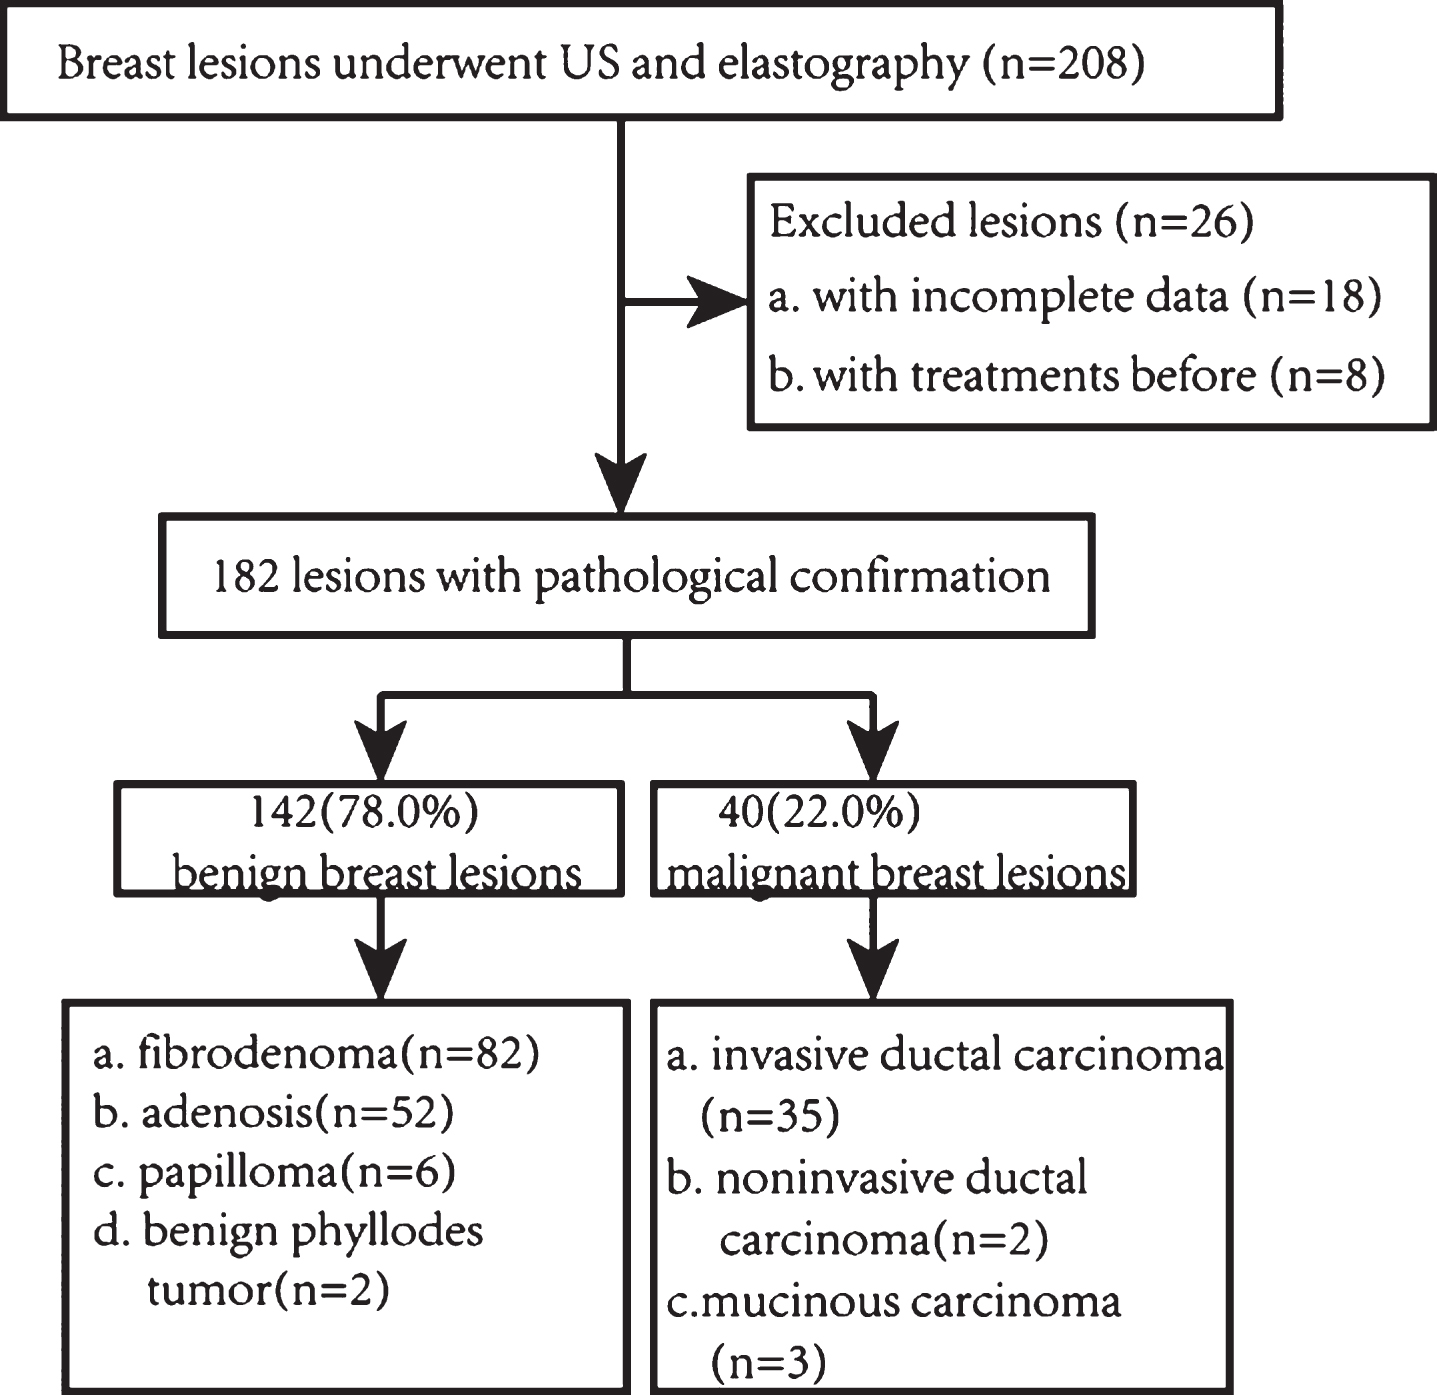
Flowchart of the selection of the breast lesions.
Conventional US and SWS imaging were performed with the same Aplio500 machine (Toshiba Medical System, Tochigi, Japan). All examinations were performed by the same operator who had more than 3 years of experience on US elastography with a 14L5 liner array transducer (frequency range, 5–14 MHz). The scanning was performed according to the American Institute of Ultrasound in Medicine practice guideline [12]. All the transverse and longitudinal US images were obtained firstly with the patients in the supine position. Subsequently, SWS imaging examinations were carried out with the same transducer at the longest length of target lesions. The transducer was fixed and kept perpendicular to the skin with pressure as slight as possible. The lesion was placed in the center of the screen, and some surrounding normal breast tissues including fatty tissue and glandular tissue were set in the sampling box. All images were obtained with the patients holding their breath for 3–5 seconds. The propagation mode map (i.e. shear wave arrival time contours) was firstly obtained as a shear wave quality mode to evaluate the reliability of the data. The propagation mode map displays high quality in areas where the contour lines are parallel to one another. Otherwise the quality of the propagation mode map is low. When the latter is encountered, another elastography is necessary to gain reliable data. SWS imaging displays a SWS map to show the stiffness distribution of lesions. The SWS is displayed by the different colors of the SWS map from high (red), intermediate (yellow or green), to low (blue). The SWS is expressed in m/s and the range is 0–8 m/s. The scale for the SWS map is set at default value of 8 m/s and it will not change thereafter. Furthermore, related SWS values within the lesion and adjacent normal fatty and glandular tissue were measured. The region of interest (ROI) is generally placed on areas corresponding parallel contour lines on propagation mode map. The first ROI for the lesion stiffness was manually drawn covered the entire lesion and the calcified, cystic and necrotic regions were avoided to the greatest extent. The second ROI for the stiffness was placed in the adjacent fatty tissue. The third ROI for the stiffness was placed in the adjacent glandular tissue at a depth similar to the lesion. All data were recorded and stored for further analysis.
Image interpretation
Two blinded investigators, both with approximately 5 years of experience in breast conventional US and 3 years in breast US elastography, were asked to analyze the images. Both investigators were trained to analyze the images before the study. Appearing discordance was solved in consensus. For conventional US image, it was necessary to assess the lesion using the Breast Imaging Reporting and Data System (BI-RADS), which could provide standardized terminology to describe US features, assessments, and recommendations [13]. BI-RADS final assessment for each lesion (BI-RADS 2, benign; BI-RADS 3, probably benign; BI-RADS 4a, low suspicion for malignancy; BI-RADS 4b, moderate suspicion for malignancy; BI-RADS 4c, high suspicion for malignancy; BI-RADS 5, highly suggestive of malignancy) was recorded [13]. In the current study, we regarded the BI-RADS category 4, 5 lesions as malignant. The values of FLR and GLR were calculated thereafter. To investigate whether the lesion size would affect the diagnostic performance on breast lesions, the total lesions were divided into three subgroups: group 1: lesion ≤10 mm; group 2: lesion 10–20 mm; and group 3: lesion >20 mm.
Statistical analysis
Statistical analyses were performed using MedCalc software (Mariakerke, Belgium) and a software package (SPSS, version 20.0 for Windows; SPSS, Chicago, IL, USA). Means±standard deviation (SD) were used for quantitative data if normal distributioin was achieved. Independent sample t test was used to compare the continuous variables between benign and malignant breast lesions. Receiver operating characteristic curves (ROC) were plotted to assess the diagnostic performance of SWS-lesion, FLR, and GLR alone or their combination. When FLR or/and GLR and SWS-lesion were combined, the lesion was considered malignant as long as meeting one of the following two conditions: (1) FLR or GLR was greater than or equal to the cut-off value; and (2) SWS-lesion was greater than or equal to the cut-off value. The diagnostic performance for each variable was expressed as AUC. The diagnostic performance was shown as different levels from high (AUC > 0.9), moderate (AUC = 0.7–0.9), to low (AUC = 0.5–0.7). A univariate Z score test was used for comparisons of AUC. ROC analysis was used to assess sensitivity, specificity and accuracy. The best cut-off value for each significant independent variable was obtained when Youden index (YI) was maximum (sensitivity + specificity –1). P < 0.05 was considered as statistical significance.
Results
Final diagnoses
The final diagnoses of the 182 breast lesions are shown in Fig. 1. 25.3% (46/182) lesions were confirmed by US-guided core needle biopsy, 57.1% (104/182) lesions were confirmed by surgery, and 17.6% (32/182) lesions were confirmed by US-guided core needle biopsy and surgery. Among them, 142 (78.0%) were benign (Fig. 2) and 40 (22.0%) were malignant (Fig. 3). The mean age was 41.6 years±11.8 (range, 21–81 years) for patients with benign lesions and 61.5 years±13.2 (range, 31–85 years) for patients with malignant lesions (P < 0.001).
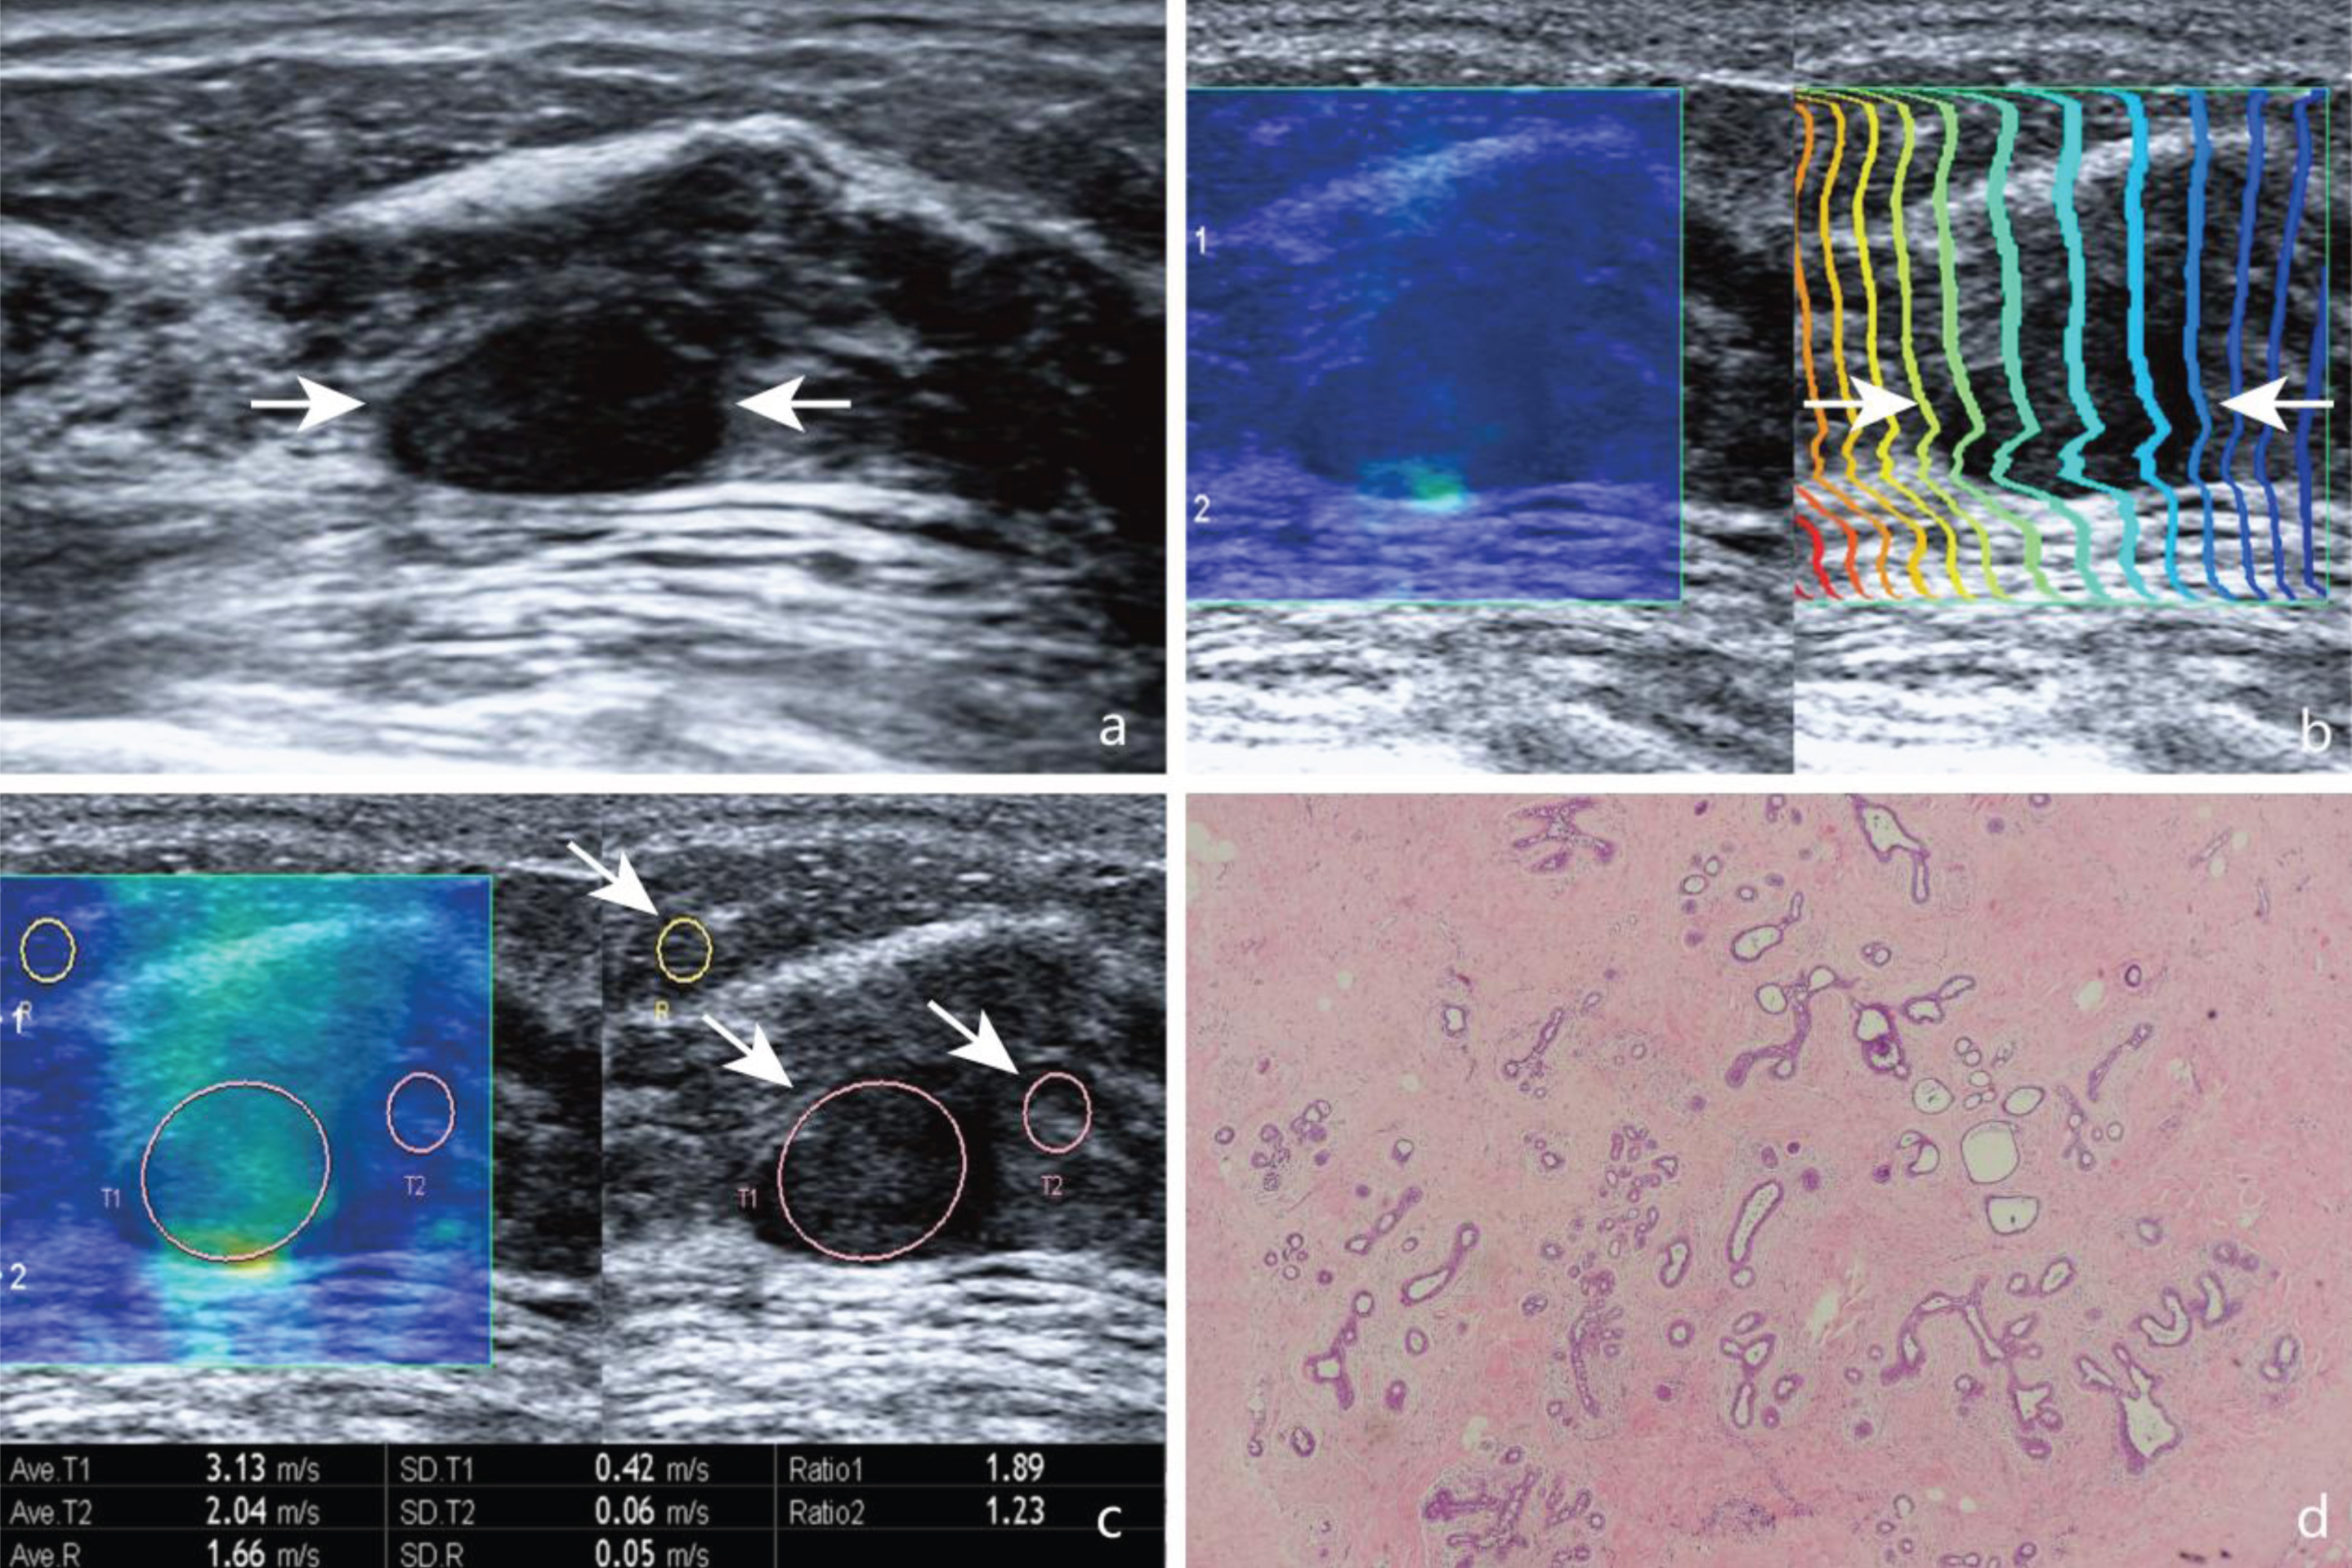
Images in a 46-year-old woman with breast fibroadenoma. (a) A solid, hypoechogenic, well-defined, regular lesion (arrows) is shown on US. (b) In areas (arrows) where the contour lines are parallel to one another. (c) On SWS map, SWS values in the lesion (T1, arrows), adjacent fatty tissue (R, arrows), and glandular tissue (T2, arrows) were measured. The SWS values were 3.13 m/s, 1.66 m/s, and 2.28 m/s, respectively. (d) Pathological examination confirms the diagnosis of fibroadenoma (Hematoxylin-eosin stain, x100).
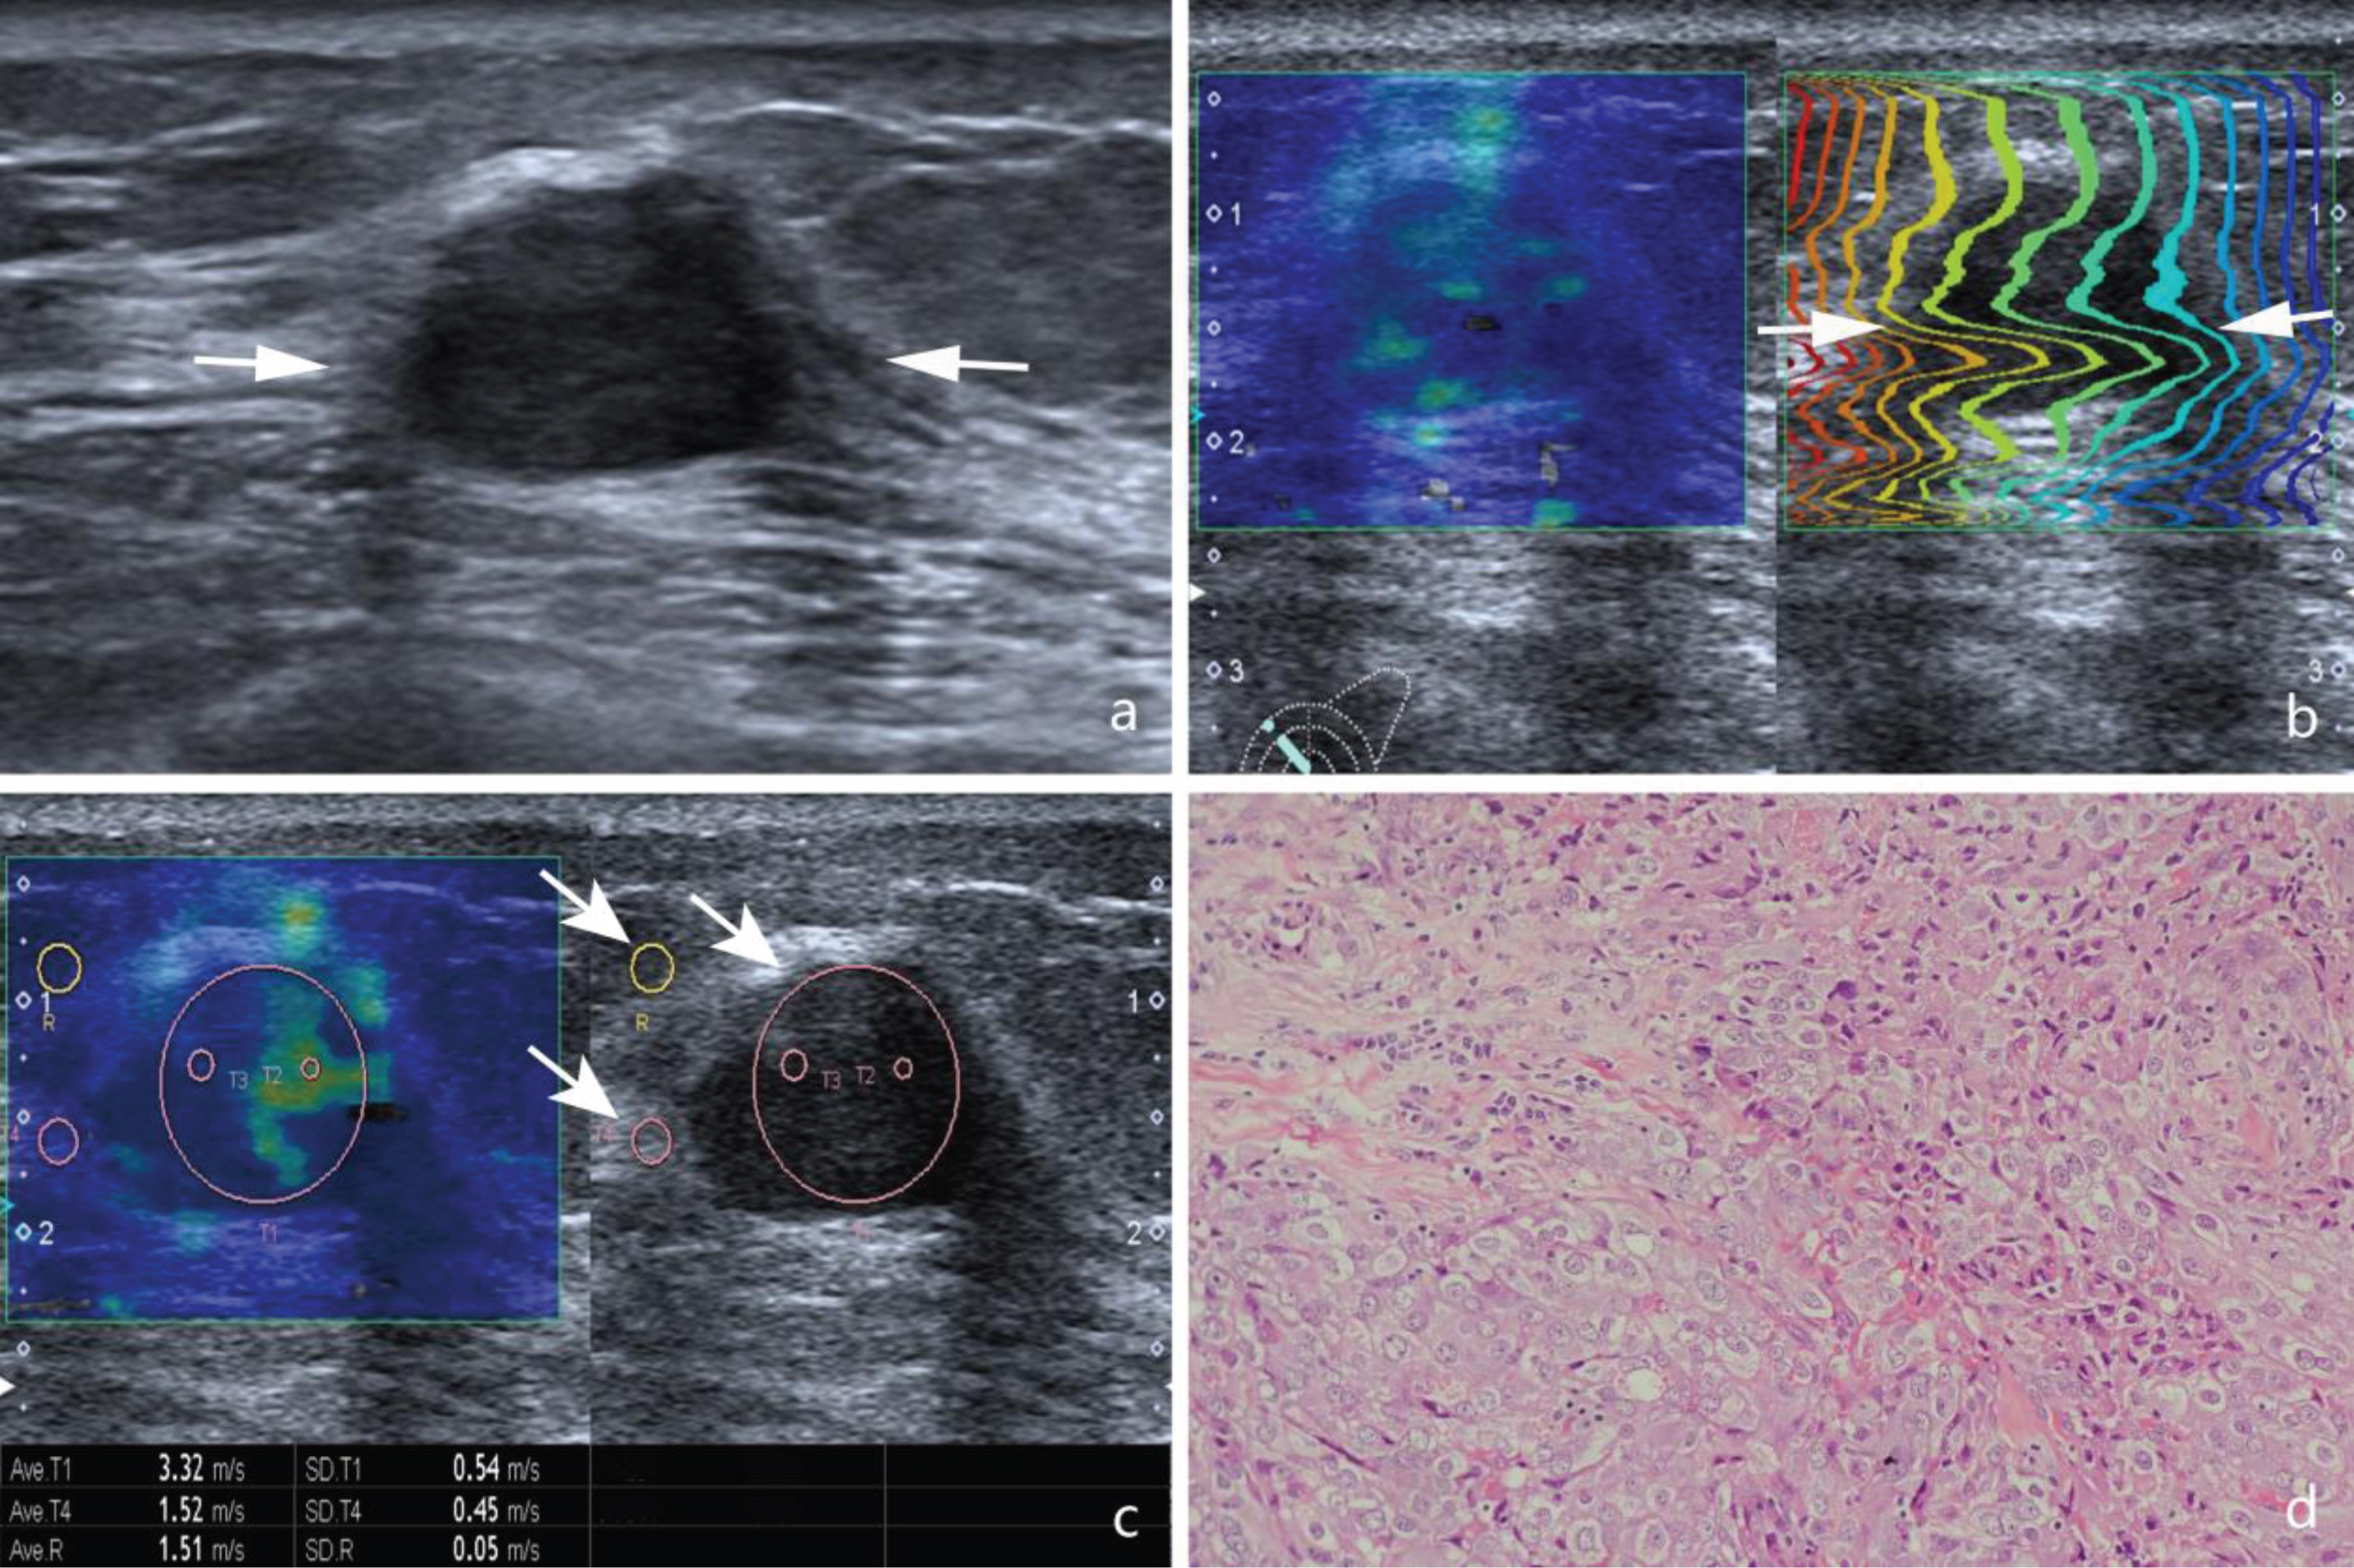
Images in a 68-year-old woman with invasive ductal carcinoma. (a) A solid, hypoechogenic, irregular shaped, poor-defined margin lesion (arrows) is shown on US. (b) In areas (arrows) where the contour lines are parallel to one another. (c) On SWS map, SWS values in the lesion (T1, arrows), adjacent fatty tissue (R, arrows), and glandular tissue (T4, arrows) were measured. The SWS values were 3.32 m/s, 1.51 m/s, and 1.52 m/s, respectively. (d) Pathological examination confirms the diagnosis of invasive ductal carcinoma (Hematoxylin-eosin stain, x100).
In conventional US images, 78 (42.9%) lesions were classified as BI-RADS category 3, 95 (52.2%) lesions were classified as BI-RADS category 4, and 9 (4.9%) lesions were classified as BI-RADS category 5. BI-RADS categories details are summarized in Table 1. The diameter of breast lesions ranged from 5 to 65 mm (mean diameter, 16.6±11.5 mm). The mean size of the malignant lesions tended to be larger than that of benign ones (22.4 mm±11.6; range, 6.7–65.0 mm vs. 14.8 mm±8.6; range, 5.0–52.0 mm) (P < 0.001). To the whole lesions involved, the mean SWS value of the malignant lesions was higher than benign ones (3.87±1.46 m/s vs 2.11±0.64 m/s) (P < 0.001). Elasticity parameters in benign and malignant breast lesions are shown in Table 2.
BI-RADS categories details of breast lesions
BI-RADS categories details of breast lesions
Numbers in parentheses are percentages. BI-RADS, Breast Imaging Reporting and Data System.
Elasticity parameters in benign and malignant lesions
Data are means±standard deviations, with range in parentheses. SWS, shear wave speed; FLR, fat-to-lesion speed ratio; GLR, gland-to-lesion speed ratio; *indicates statistically significant difference.
Since the lesions of BI-RADS category 4, 5 were regarded as malignant, conventional US achieved 97.5% (39/40) of sensitivity, 54.2% (77/142) of specificity and 63.7% (116/182) of diagnostic accuracy. ROC analysis showed that the AUC for conventional US was 0.759. For the total lesions, the best cut-off values for SWS-lesion, FLR, GLR were 2.88 m/s (YI = 0.644), 2.31 (YI = 0.526), and 1.51 (YI = 0.547), respectively. In terms of AUC, SWS-lesion (AUC = 0.845) achieved the highest overall diagnostic performance in comparison with FLR (AUROC = 0.752), and GLR (AUROC = 0.808), which was associated with sensitivity of 75.0% and specificity of 89.4%. Diagnostic performance of SWS-lesion, FLR, and GLR in the differentiation of benign and malignant lesions of variable sizes is shown in Table 3. The combination of FLR and SWS-lesion (AUC = 0.817), or the combination of GLR and SWS-lesion (AUC = 0.775), or the combination of FLR, GLR and SWS-lesion (AUC = 0.768), however, did not show improved diagnostic performance. The diagnostic performances for differentiation between malignant and benign lesions with combinations of SWS-lesion, FLR and GLR are shown in Table 4. In the current study, SWS-lesion was lower than the cut-off value of 2.88 m/s in 25% (10/40) malignant lesions. Among them, six lesions were invasive ductal carcinomas, one was noninvasive ductal carcinoma, and three were mucinous carcinomas.
Diagnostic performances of SWS-lesion, FLR and GLR in the differentiation of benign and malignant lesions of variable sizes
Diagnostic performances of SWS-lesion, FLR and GLR in the differentiation of benign and malignant lesions of variable sizes
SWS, shear wave speed; FLR, fat-to-lesion speed ratio; GLR, gland-to-lesion speed ratio; YI, Youden index; AUC, area under the ROC curve; *P < 0.05 in comparison with SWS-lesion; †P < 0.05 in comparison with FLR; ‡P < 0.05 in comparison with GLR.
Diagnostic performances between benign and malignant breast lesions for the combinations of FLR, GLR and SWS-lesion
SWS, shear wave speed; FLR, fat-to-lesion speed ratio; GLR, gland-to-lesion speed ratio; YI, Youden index; AUC, area under the ROC curve.
When dividing the lesions into three subgroups with different sizes, for the lesion ≤10 mm, AUC was 0.889 with SWS-lesion (95% CI: 0.777–0.958), 0.836 with FLR (95% CI: 0.725–0.929), and 0.827 with GLR (95% CI: 0.702–0.915); for the lesion sized 10–20 mm, AUC was 0.831 with SWS-lesion (95% CI: 0.725–0.909), 0.747 with FLR (95% CI: 0.549–0.775), and 0.766 with GLR (95% CI: 0.661–0.863); for the lesion ≥20 mm, AUC was 0.814 with SWS-lesion (95% CI: 0.683–0.908), 0.711 with FLR (95% CI: 0.563–0.821), and 0.777 with GLR (95% CI: 0.635–0.875). Consequently, for the lesion ≤10 mm, SWS-lesion achieved the highest overall diagnostic performance with a sensitivity of 75.0% and specificity of 94.2%. For the lesion sized 10–20 mm, SWS-lesion achieved the highest overall diagnostic performance with a sensitivity of 80.0% and specificity of 87.9%. For the lesion ≥20 mm, SWS-lesion achieved the highest overall diagnostic performance with a sensitivity of 81.0% and specificity of 84.4%.
In the present study with 182 breast lesions, BI-RADS category 3, 4a, 4b, 4c, and 5 had malignancy rates of 1.3%, 7.8%, 48.2%, 80.0% and 100%, similar with a published study (BI-RADS category 3, >0% but ≤2% likelihood of malignancy; BI-RADS category 4a, >2% but ≤10% likelihood of malignancy; BI-RADS category 4b, >10% but ≤50% likelihood of malignancy; BI-RADS category 4c, >50% but <95% likelihood of malignancy; BI-RADS category 5, ≥95% likelihood of malignancy;) [13].
Conventional strain imaging relies on manual compression and decompression applied by the operator, which leads to questionable reproducibility [14]. SWS imaging has gained increasing attention in recent year, which can reflect tissue stiffness quantitatively and is more reproducible and operator-independent. The idea of differentiation between malignant lesions and benign ones via evaluation of strain ratio was suggested by Waki et al., who firstly reported that strain ratio was in accordance with elasticity ratio [15]. Zhi et al. used the breast glandular tissue as the reference point to conduct strain ratio measurements of breast lesions [16] while Zhou et al. suggested that fatty tissue as the reference achieved better diagnostic performance than glandular tissue when evaluating breast lesions [7]. Until now, there is no consistency in selecting the reference tissue for evaluation of tissue stiffness. In addition, many East Asian women lacked normal breast fatty tissue [17], thus glandular tissue had to be selected as the reference tissue. Therefore, in the present study, we used both fatty tissue and glandular tissue as the reference to conduct SWS measurements. Our results revealed that the FLR and GLR of malignant lesions were both significantly higher than those of benign ones, which was consistent with the results in the study by Zhou et al. [7], although SWS imaging was used in the current study whereas conventional strain imaging was used in their study. In the present study, FLR achieved sensitivity and specificity of 57.5% and 83.8% respectively, while GLR yield a sensitivity of 80.0% and a specificity of 76.1%. It suggested that 42.5% of malignant lesions would be missed if FLR was used as the standard to differentiate benign from malignant lesions. Furthermore, the GLR provided better diagnostic performance than FLR (AUC = 0.809 vs AUC = 0.752, P = 0.027), which might due to the fact that the reference points of fatty tissue in the present study were at different depths. Yerli et al. suggested that use of normal breast tissue at the same depth may obtain more accurate data [9].
In the present study, the results showed that the diagnostic performances of SWS-lesion, FLR, and GLR were moderate (all AUC = 0.7–0.9). SWS-lesion (AUC = 0.845) achieved the best overall diagnostic performance, which was similar with conventional US in the study (AUC = 0.845 vs AUC = 0.759, P = 0.1069). In a multicenter experience study with 939 breast lesions reported that elastography has the same diagnostic performance as conventional US [2]. What is more, for the three subgroups, the lesion size did not affect the diagnostic performance. After evaluation of the lesions with SWS, additional measurements of FLR and GLR did not contribute to the differentiation between malignant lesions and benign ones. However, FLR and GLR requires additional calculation and time. This is similar with the study of Yerli et al. using strain imaging, who showed that additional measurement with the strain index was not mandatory for differentiation between benign and malignant breast lesions [9].
In the present study, the mean SWS-lesion cut-off value was 2.88 m/s, with associated sensitivity and specificity of 75.0% and 89.4% respectively, which was consistent with the previous studies that the sensitivities ranged from 75% to 93% with specificities of up to 93% [16, 18–20]. Several published studies reported the cut-off values ranged from 3.36 m/s to 4.39 m/s [9, 22], which were higher than the result of our study. The cut-off value was associated with the lesion size, with relatively low value for those ≤20 mm in diameter in the present study. A recent study of 139 lesions by Liu et al. showed that the cut-off value of lesions >20 mm was higher than those ≤20 mm [21]. The different pathological components between lesions >20 mm and those ≤20 mm might be the reason for different stiffness. The cut-off value is likely related to the selection bias in the present study included 70.9% lesions ≤20 mm. In addition, the different measuring methods with the different machines may be the other reason for the difference. According to the several studies [9, 22], the mean SWS value of the 5–7 measurements using a Siemens S3000 scanner (Siemens Medical Solutions, Mountain View, CA, USA) on each lesion was computed while the ROI covered the entire lesion in our study. The measurement method in the present study may be more accurate to reflect the mean tissue stiffness. After we performed SWS-lesion, ten malignant lesions were missed. Six invasive ductal carcinomas were all smaller than 10 mm in diameter. The reason may be that small breast cancer (<10 mm) has a tendency to show benign features as reported by Vinnicombe et al. [23]. For one noninvasive ductal carcinoma, duct ectasia in the lesion may affect the measured accuracy [24]. For three mucinous carcinomas, lots of jelly-like substance contained in the lesion may be the reason and it is softer than breast cancer [23].
There were several limitations in this study. First, breast lesions with size <5 mm in diameter were not included in the present study, resulting in the bias in the results. Second, although all elastic images were obtained by one skilled examiner, image acquisition and image evaluation were still affected unavoidably by the calcification areas when the calcifications were diffused in the nodule, which might increase stiffness [25]. Third, inter-operator and intra-operator variability for acquisition of the SWS-lesion, FLR, and GLR existed. The SWS within the lesion, fatty and glandular tissue might vary by operators. However, a study by Yang et al. with the same machine reported that the reproducibility of SWS imaging in breast was also favorable with the associate correlation coefficient of inter-operator consistency was 0.894 and 0.948 for intra-operator consistency [26]. Therefore, a multicenter study should be carried out to validate the present study results.
In conclusion, SWS-lesion is a sufficient method to differentiate between benign and malignant breast lesions and additional measurement with FLR or GLR does not contribute to the quantitative SWS-lesion evaluation.
Footnotes
Acknowledgments
Supported in part by the Shanghai Hospital Development Center (Grant SHDC 12014229) and the Science and Technology Commission of Shanghai Municipality (Grants 14441900900, 15411969000 and 16411971100).