
Abstract
OBJECTIVES:
To prospectively evaluate the diagnostic performance of three-dimensional (3D) shear wave elastography (SWE) for breast lesions with quantitative stiffness information from transverse, sagittal and coronal planes.
METHODS:
Conventional ultrasound (US), two-dimensional (2D)-SWE and 3D-SWE were performed for 122 consecutive patients with 122 breast lesions before biopsy or surgical excision. Maximum elasticity values of Young’s modulus (Emax) were recorded on 2D-SWE and three planes of 3D-SWE. Area under the receiver operating characteristic curve (AUC), sensitivity and specificity of US, 2D-SWE and 3D-SWE were evaluated. Two combined sets (i.e., BI-RADS and 2D-SWE; BI-RADS and 3D-SWE) were compared in AUC. Observer consistency was also evaluated.
RESULTS:
On 3D-SWE, the AUC and sensitivity of sagittal plane were significantly higher than those of transverse and coronal planes (both P < 0.05). Compared with BI-RADS alone, both combined sets had significantly (P < 0.05) higher AUCs and specificities, whereas, the two combined sets showed no significant difference in AUC (P > 0.05). However, the combined set of BI-RADS and sagittal plane of 3D-SWE had significantly higher sensitivity than the combined set of BI-RADS and 2D-SWE.
CONCLUSIONS:
The sagittal plane shows the best diagnostic performance among 3D-SWE. The combination of BI-RADS and 3D-SWE is a useful tool for predicting breast malignant lesions in comparison with BI-RADS alone.
Introduction
Breast cancer is the leading cause of cancer death in women around the world, and its occurrence is increasing recently [1]. For patients with breast lesions, imaging examinations such as mammography and ultrasound (US) provide important diagnostic information. While the negative predictive value (NPV) of mammography is similar with US for the diagnosis of breast lesions, the sensitivity of mammography is lower than US in dense breast [2–5]. With the additional benefits such as real-time scanning and free of radiation, US is widely used as a complementary examination to mammography in clinical practice for breast lesion imaging.
US features including echo pattern, lesion shape, marginal characteristics, calcifications, orientation and posterior features are useful for differentiating benign breast lesions from malignant ones [6–8]. However, US scanning cost a lot of time in image acquisition. Automatic breast scanning, on the other hand, decreases the acquisition time, while the associated false-positive rate is high [9]. The stiffness information of the tissue is useful for the diagnosis of breast lesions, whereas it is not available for conventional US [10, 11]. To overcome the limitations of the conventional US, US elastography has been introduced to measure the breast lesion stiffness to aid diagnosis [12, 13]. Many studies have demonstrated that US strain elastography improved the specificity and sensitivity of diagnosis in comparison with conventional US for breast solid lesions [14, 15]. However, US strain elastography relies on manual compression and thus has disadvantages of operator-dependence and lack of quantitative information [16]. More recently, shear wave elastography (SWE) emerged as a more reproducible US technique, which can obtain the quantitative elasticity measurements in terms of shear wave speed (SWS) in meter per second (m/s) or Young’s modulus in kilopascals (kPa). Several studies have showed promising results of SWE in differentiating breast lesions [10, 17].
It has been noted that the stiffness distribution in breast lesions might be inhomogeneous, particularly in malignant tumors [18, 19]. To better understanding the stiffness distribution in the lesion, 3D-SWE may reveal more anatomic and pathological features in comparison with 2D-SWE alone [20–23]. 3D-SWE offers quantitative elasticity values of Young’s modulus in three orthogonal planes: transverse, sagittal and coronal planes. A recent study qualitatively analyzed the color pattern of three orthogonal planes of 3D-SWE for diagnosis of breast lesions, which highlighted the diagnostic value of coronal plane from the color pattern [24]. However, evaluation of color patterns is subjective, thus, quantitative analysis of SWE elasticity values such as Young’s modulus for more objective diagnosis might be desirable. Therefore, the purpose of this study was to prospectively investigate whether quantitative 3D-SWE could improve the diagnostic performance for breast lesion.
Materials and methods
Patients
This study was approved by the institutional review board of the university hospital. All participating patients provided informed consent for the examinations.
The inclusion criteria for breast lesions were as follows: (a) solid breast lesions or mixed lesions (cystic part <25 %) detected by US; (b) completion of conventional US, 2D-SWE and 3D-SWE examinations; and (c) scheduled to undergo surgery or biopsy. The exclusion criteria were as follows: (a) the diameters of breast lesions were over 4 cm, because those lesions could not be completely covered by the sampling box of 3D-SWE; (b) with history of chemotherapy (the stiffness of lesion might be changed after chemotherapy); (c) image data loss (images improperly stored and could not be retrieved); (d) poor SWE quality; (e) no histopathological results; and (f) with a history of surgery before US and SWE examinations (a scar would increase the stiffness of breast tissue) (Fig. 1). Histological diagnoses of all the lesions were confirmed through surgical excision and/or US-guided percutaneous core needle biopsy (CNB). When the patient had multiple lesions, the lesion which was the most suspicious one for malignancy at US was selected. When no lesions were suspicious for malignancy at US, the largest lesion was selected.
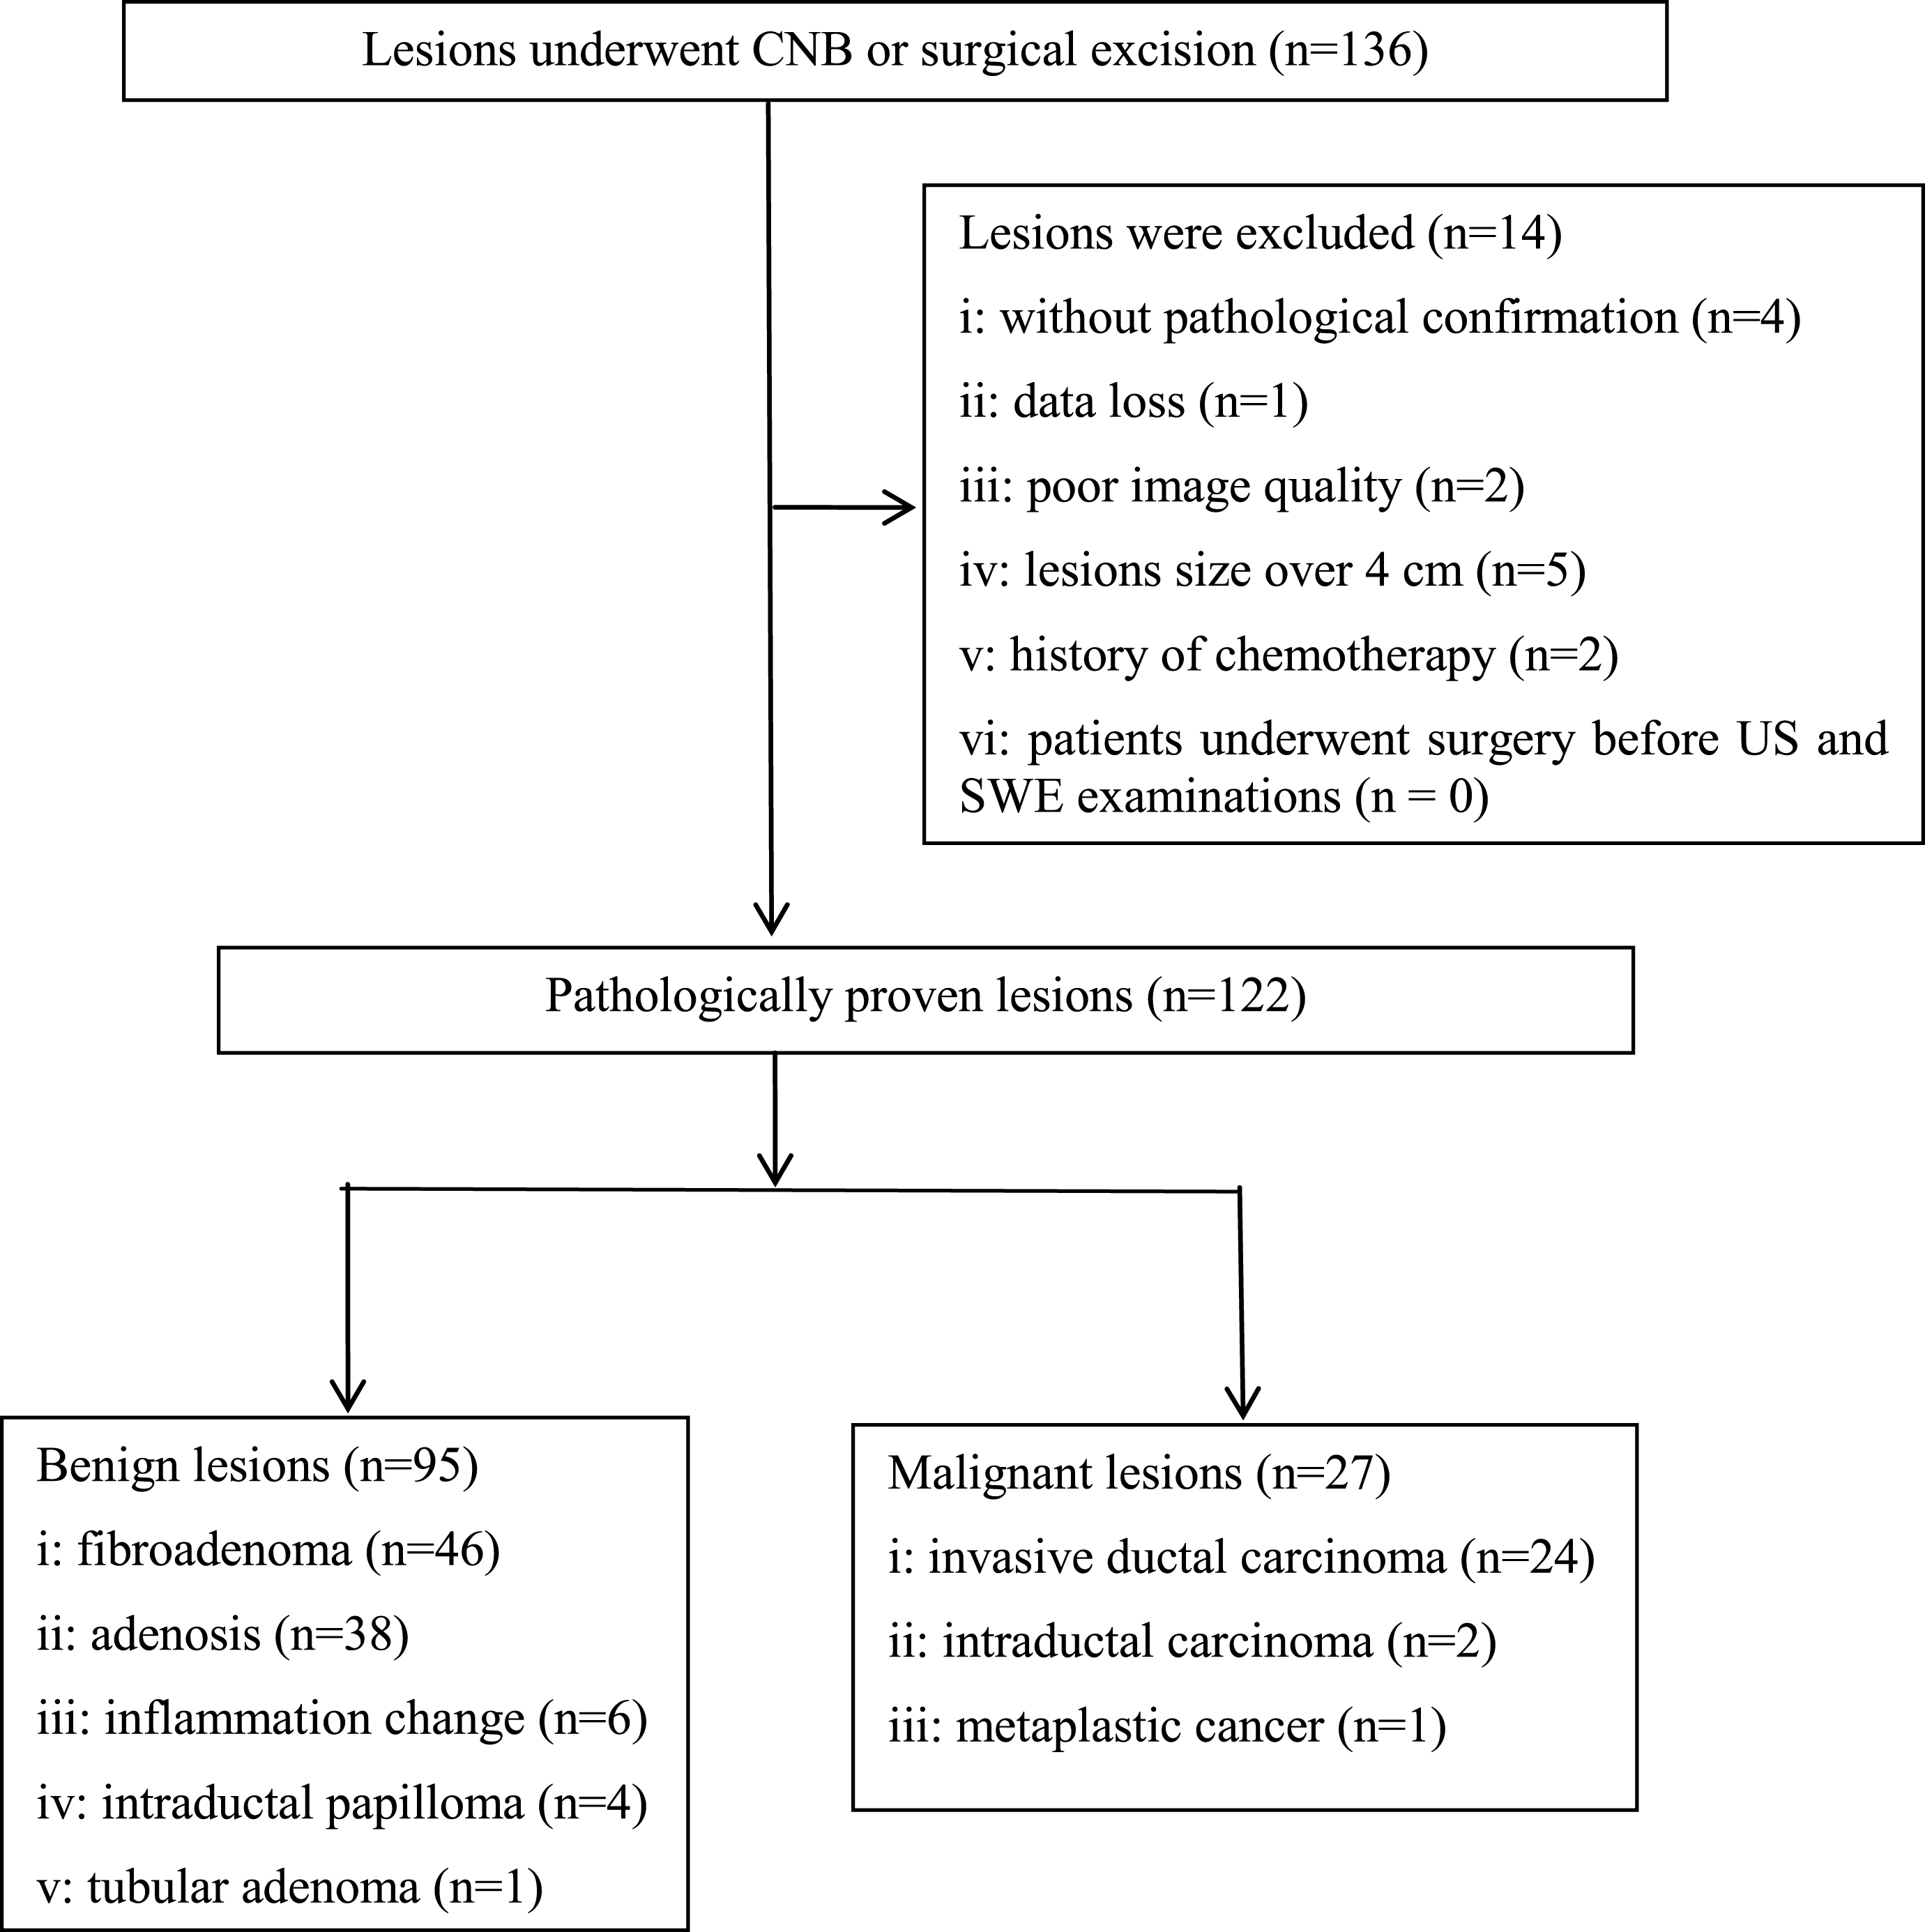
Flowchart showing the selection of breast lesions. US = ultrasound, SWE = shear wave elastography, CNB = core needle biopsy.
Conventional US and SWE images were obtained with the Aixplorer US system (SuperSonic Imagine, Aix-en-Provence, France) by one of four radiologists with at least 20 cases’ experience in US elastography.
All the patients were scanned in supine position. The target lesion was placed at the center of the US screen during US examinations. For conventional US, two orthogonal planes’ gray-scale and color Doppler images of each target lesion were obtained according to standard scanning guideline [25]. The gain, frequency, depth, and focus were adjusted to ensure that the lesion was displayed clearly on the US screen. The location, size, shape, echo pattern, orientation, margin on US B-mode images, and vascularity on color Doppler images of the lesion were recorded.
2D-SWE was then carried out with the L15-4 linear array transducer in a plane showing the largest size of the lesion. The transducer was placed with sufficient coupling agent and care was taken to minimize pressure on the skin to avoid possible effect of precompression. SWE image was obtained by setting a square sampling box which included the target lesion and surrounding breast tissue. The range of Young’s modulus was set from 0 (dark blue; soft) to 180 kPa (red; hard). For 2D-SWE, three transverse and longitudinal color maps of each target lesion were obtained. Then we selected one optimal color map on which there was no evidence of compression pressure (identified as red color at the top of square sampling box). If there were several images with no compression pressure, we selected the image on which the stiffest area was present according to the color map.
Afterwards, 3D-SWE was performed with the SLV16-5 volume transducer. The transducer was placed slightly on the skin to avoid precompression. 3D-SWE images were obtained automatically by activating the button of “3D acquisition”. Three orthogonal color maps (transverse, sagittal, and coronal planes) were shown simultaneously on the US screen as a multi-plane mode. Then multi-slice mode (slice distance, 1.00 mm; slab thick, 0.25 mm) was applied to obtain a comprehensive view. The range of Young’s modulus was also set at 0 (dark blue; soft) to 180 kPa (red; hard).
Image interpretation
Conventional US images of all lesions were reviewed independently by two readers who were not involved in acquisition of US and SWE images. Both readers had more than 2 years of experience in breast US. BI-RADS categories were assessed according to the American College of Radiology (ACR) Breast Imaging Reporting and Data System (BI-RADS) by the two readers [26]. When the two readers were not concordant, another experienced reader with more than 5 years’ experience in breast US was invited to evaluate the images together with the 2 readers to reach a consensus.
For SWE images, quantitative elasticity values of Young’s modulus were obtained by the operator who performed B-mode US examinations. The quantitative elasticity values of Young’s modulus were measured by placing one ROI (Q-Box; SuperSonic Imagine) over the color maps of 2D-SWE and three planes of 3D-SWE. 3D-SWE obtained a series of images in 3 planes and we selected the image which showed the stiffest portion of the lesion according to color pattern (stiff portion was displayed as red, while soft portion was displayed as blue). The ROI was adjusted to encompass the lesion without surrounding normal tissue when the lesion was homogeneous (lesion displayed as dark blue or light blue on the color map); while the ROI was adjusted to encompass the stiffest part when the lesion was heterogeneous (adjacent tissue or halo displayed as red, orange or yellow on the color map) (Figs. 2 and 3). The US system could automatically calculate the elasticity values of Young’s modulus in kPa. For 2D-SWE and three planes of 3D-SWE, the maximum elasticity values (Emax) of Young’s modulus is the best parameter among SWE features according to previous studies [27, 28], thus, we recorded the Emax for the subsequent data analysis.

Grade II invasive ductal carcinoma in a 65-year-old woman. (A) At the bottom of this image, a 14 mm breast lesion shows marked hypoechogenicity, irregular shape, nonparallel orientation and posterior shadowing which is classified as BI-RADS category 4c. At the top of this image, 2D SWE shows that the margin of the lesion has moderate stiffness (Emax 127.5 kPa). (B) Three orthogonal planes of 3D SWE. (C) Multislice transverse images of 3D SWE shows the stiffest region (red color) at the top of the lesion (Emax 182.2 kPa). (D) Multislice sagittal images of 3D SWE show the stiffest region (red color) at the top of the lesion (Emax 171.8 kPa). (E) Multislice coronal images of 3D SWE shows the stiffest region (red color) at the bottom of the lesion (Emax 166.4 kPa). (F) Histological specimen confirms the diagnosis of invasive ductal carcinoma (haematoxylin-eosin stain; original magnification,×200).
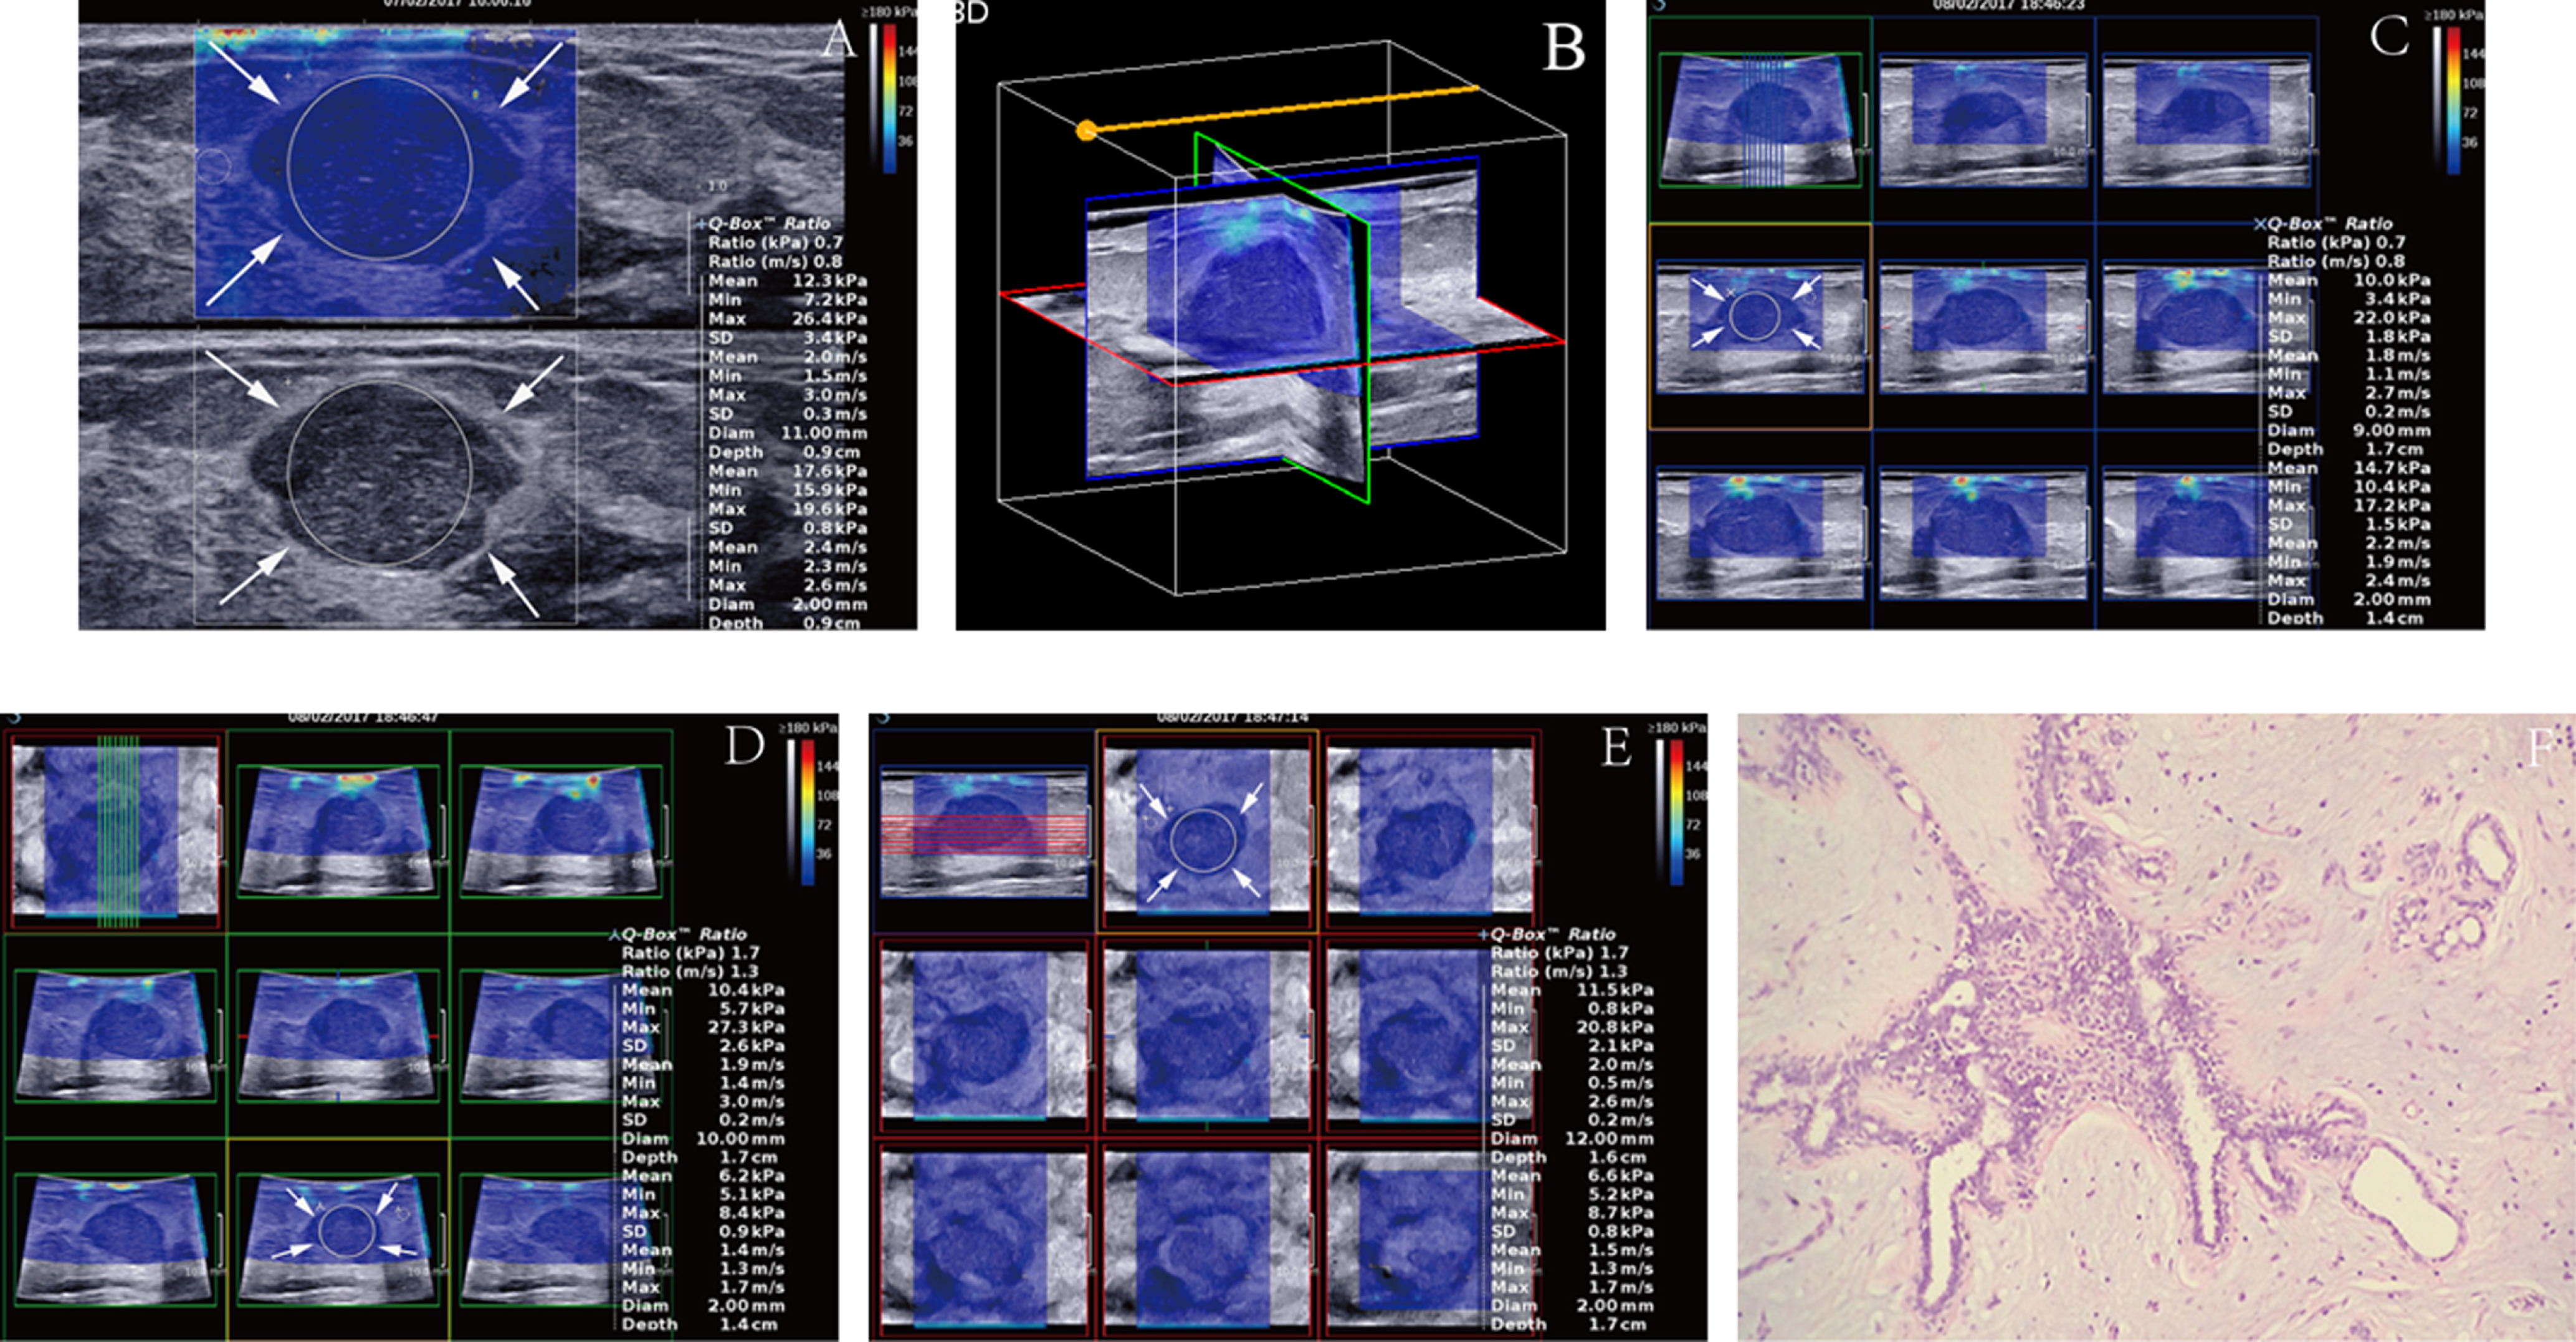
Breast fibroadenoma in a 65-year-old woman. (A) At the bottom of this image, a 18 mm breast lesion shows marked hypoechogenicity and parallel orientation which is classified as BI-RADS category 3. At the top of this image, 2D SWE shows that the lesion and surrounding tissue are homogeneous and soft (Emax 26.4 kPa). (B) Three orthogonal planes of 3D SWE. (C, D and E) Multislice images of 3D SWE shows a homogeneously soft lesion in transverse (Emax 22.0 kPa), sagittal (Emax 27.3 kPa) and coronal (Emax 20.8 kPa) planes. (F) Histological specimen confirms the diagnosis of breast fibroadenoma (haematoxylin-eosin stain; original magnification,×200).
To evaluate the inter and intra-operator agreement in 2D-SWE and three planes of 3D-SWE, another 30 breast lesions were scanned by two independent skillful operators in breast US and SWE. The measurement procedure was the same as described above. The 30 additional non-random cases were not used to analysis the diagnostic performance.
Statistical analysis
All the statistical analyses were calculated using the SPSS statistics software (version 20.0; SPSS, Chicago, IL) and MedCalc software (version 15.6; Mariakerke, Belgium). Because samples calculated by the Kolmogorov-Smirnov test did not confirm normal distribution, the nonparametric Mann-Whitney test was performed to compare the continuous variables. All data were expressed as medians and interquartile ranges (IQR). Area under the ROC curve (AUC) was obtained to evaluate the diagnostic performances of 2D-SWE, three planes of 3D-SWE, and the two combined sets. Sensitivity, specificity, positive predictive value (PPV), negative predictive value (NPV), and accuracy were calculated and compared using chi-squared test or McNemar test when appropriate. The comparisons of AUCs were performed using the method of DeLong et al. [29]. The optimal cutoff values were obtained when the Youden index (sensitivity + specificity - 1) was maximum. Inter-operator and intra-operator consistency of 2D-SWE and 3D-SWE were calculated by intraclass correlation coefficient. Two tailed P < 0.05 was considered statistically significant.
Results
Pathological diagnoses
Between November 2016 and February 2017, 136 consecutive patients with 136 breast lesions detected by clinical palpation and/or imaging examinations were enrolled in the study. Of them, 14 lesions were excluded because of the following reasons: without final pathological results (n = 4); data loss (n = 1); poor image quality (n = 2); lesions size over 4 cm (n = 5); history of chemotherapy (n = 2). Finally, a total of 122 breast lesions in 122 women (median age, 45 years; interquartile range [IQR], 32.8–56.3 years) were included in the present study (Fig. 1). Pathological results of the 122 lesions were shown in Fig. 1:27 (22.1%) were malignant and 95 (77.9%) were benign. The median lesion size at conventional US was 14.0 mm (IQR: 10.0–19.3 mm). The size was significantly different between malignant lesions (median 18.0 mm [IQR: 7.0–29.0 mm]) and benign lesions (median 13.0 mm [IQR: 10.0–18.0 mm]) (P = 0.012). In addition, the median age of patients with malignant lesions (median 58.0 years [IQR: 51.0–63.0 years]) were significantly greater than patients with benign lesions (median 41.0 years [IQR: 31.0–52.0 years]) (P < 0.001).
Conventional US, 2D-SWE, and 3D-SWE
On conventional US, 45 (36.9%) lesions were classified as BI-RADS category 3, 74 (60.7%) lesions were classified as BI-RADS category 4 (category 4a, 48; category 4b, 14; category 4c, 12), and 3 (2.5%) lesions were classified as BI-RADS category 5. The details of BI-RADS categories for the 122 lesions are summarized in Table 1. The maximum elasticity values of Young’s modulus on 2D-SWE for benign and malignant breast lesions are shown in Table 2, as well as those on transverse, sagittal, and coronal planes on 3D-SWE. All elasticity values of Young’s modulus were significantly higher in malignant lesions than those in benign lesions (all P < 0.05). Additionally, elasticity values of Young’s modulus in all the three planes were higher than those in 2D-SWE for the same breast lesions (Table 2). For all the benign lesions, Emax in transverse (57.5 kPa [IQR: 28.0–91.5 kPa]), sagittal (63.0 kPa [IQR: 31.4–95.6 kPa]), and coronal planes (58.7 kPa [IQR: 29.3–104.3 kPa]) was significantly higher than that in 2D-SWE (37.7 kPa [IQR: 26.8–59.6 kPa]) (all P < 0.05). However, significant difference for malignant lesions was only found between sagittal plane and 2D-SWE (180.7 kPa [IQR: 134.1–195.1 kPa] vs. 130.3 kPa [IQR: 94.0–192.0 kPa]) (P < 0.05).
Distribution of B-mode US BI-RADS categories
Distribution of B-mode US BI-RADS categories
BI-RADS = Breast Imaging-Reporting and Data System; US = ultrasound.
Emax of malignant and benign lesions on 2D-SWE and three views of 3D-SWE
SWE = shear wave elastography; P < 0.05 indicates significant difference; *Indicates significant difference compared with 2D-SWE.
For conventional US, 63.1% (77/122) lesions of BI-RADS categories 4 (n = 74) and 5 (n = 3) were classified as malignant in the present study, with the associated sensitivity, specificity, PPV, NPV, and accuracy of 100%, 47.4%, 35.1%, 100%, and 59.0%, respectively. ROC analysis showed that the AUC for conventional US was 0.737.
The cut-off value, AUC, sensitivity, specificity, PPV, NPV, and accuracy for 2D-SWE and transverse, sagittal, coronal of 3D-SWE are shown in Table 3 and Fig. 4. Cut-off values of Young’s modulus on 2D-SWE and transverse, sagittal, coronal planes of 3D-SWE were 77.7 kPa, 101.9 kPa, 119.3 kPa and 96.2 kPa, respectively. For 3D-SWE, the diagnostic performances of different planes (i.e., transverse, sagittal, and coronal planes) were compared. The AUC and sensitivity of sagittal plane were significantly higher than those of transverse (AUC: 0.895 vs. 0.854; sensitivity: 88.9% vs. 81.5%) and coronal planes (AUC: 0.895 vs. 0.816; sensitivity: 88.9% vs. 77.8%) (both P < 0.05). Significant difference for specificity was only found between sagittal and coronal plane (84.2% vs. 71.6%, P < 0.05). Overall, sagittal plane showed the best diagnostic performance in the three planes of 3D-SWE with sensitivity, specificity, PPV, NPV, and accuracy of 88.9% (24/27), 84.2% (80/95), 61.5% (24/39), 96.4% (80/83), and 85.3% (104/122), respectively.
The diagnostic performances of BI-RADS, 2D-SWE and three planes of 3D-SWE
The diagnostic performances of BI-RADS, 2D-SWE and three planes of 3D-SWE
BI-RADS = Breast Imaging-Reporting and Data System; SWE = shear wave elastography; PPV = positive predictive value; NPV = negative predictive value; AUC = Area under the receiver operating characteristic curve; *Indicates significant difference compared with transverse and coronal planes, P < 0.05; ∧Indicates significant difference compared with BI-RADS and coronal planes, P < 0.05; †Indicates significant difference between BI-RADS and 2D-SWE, P < 0.05.
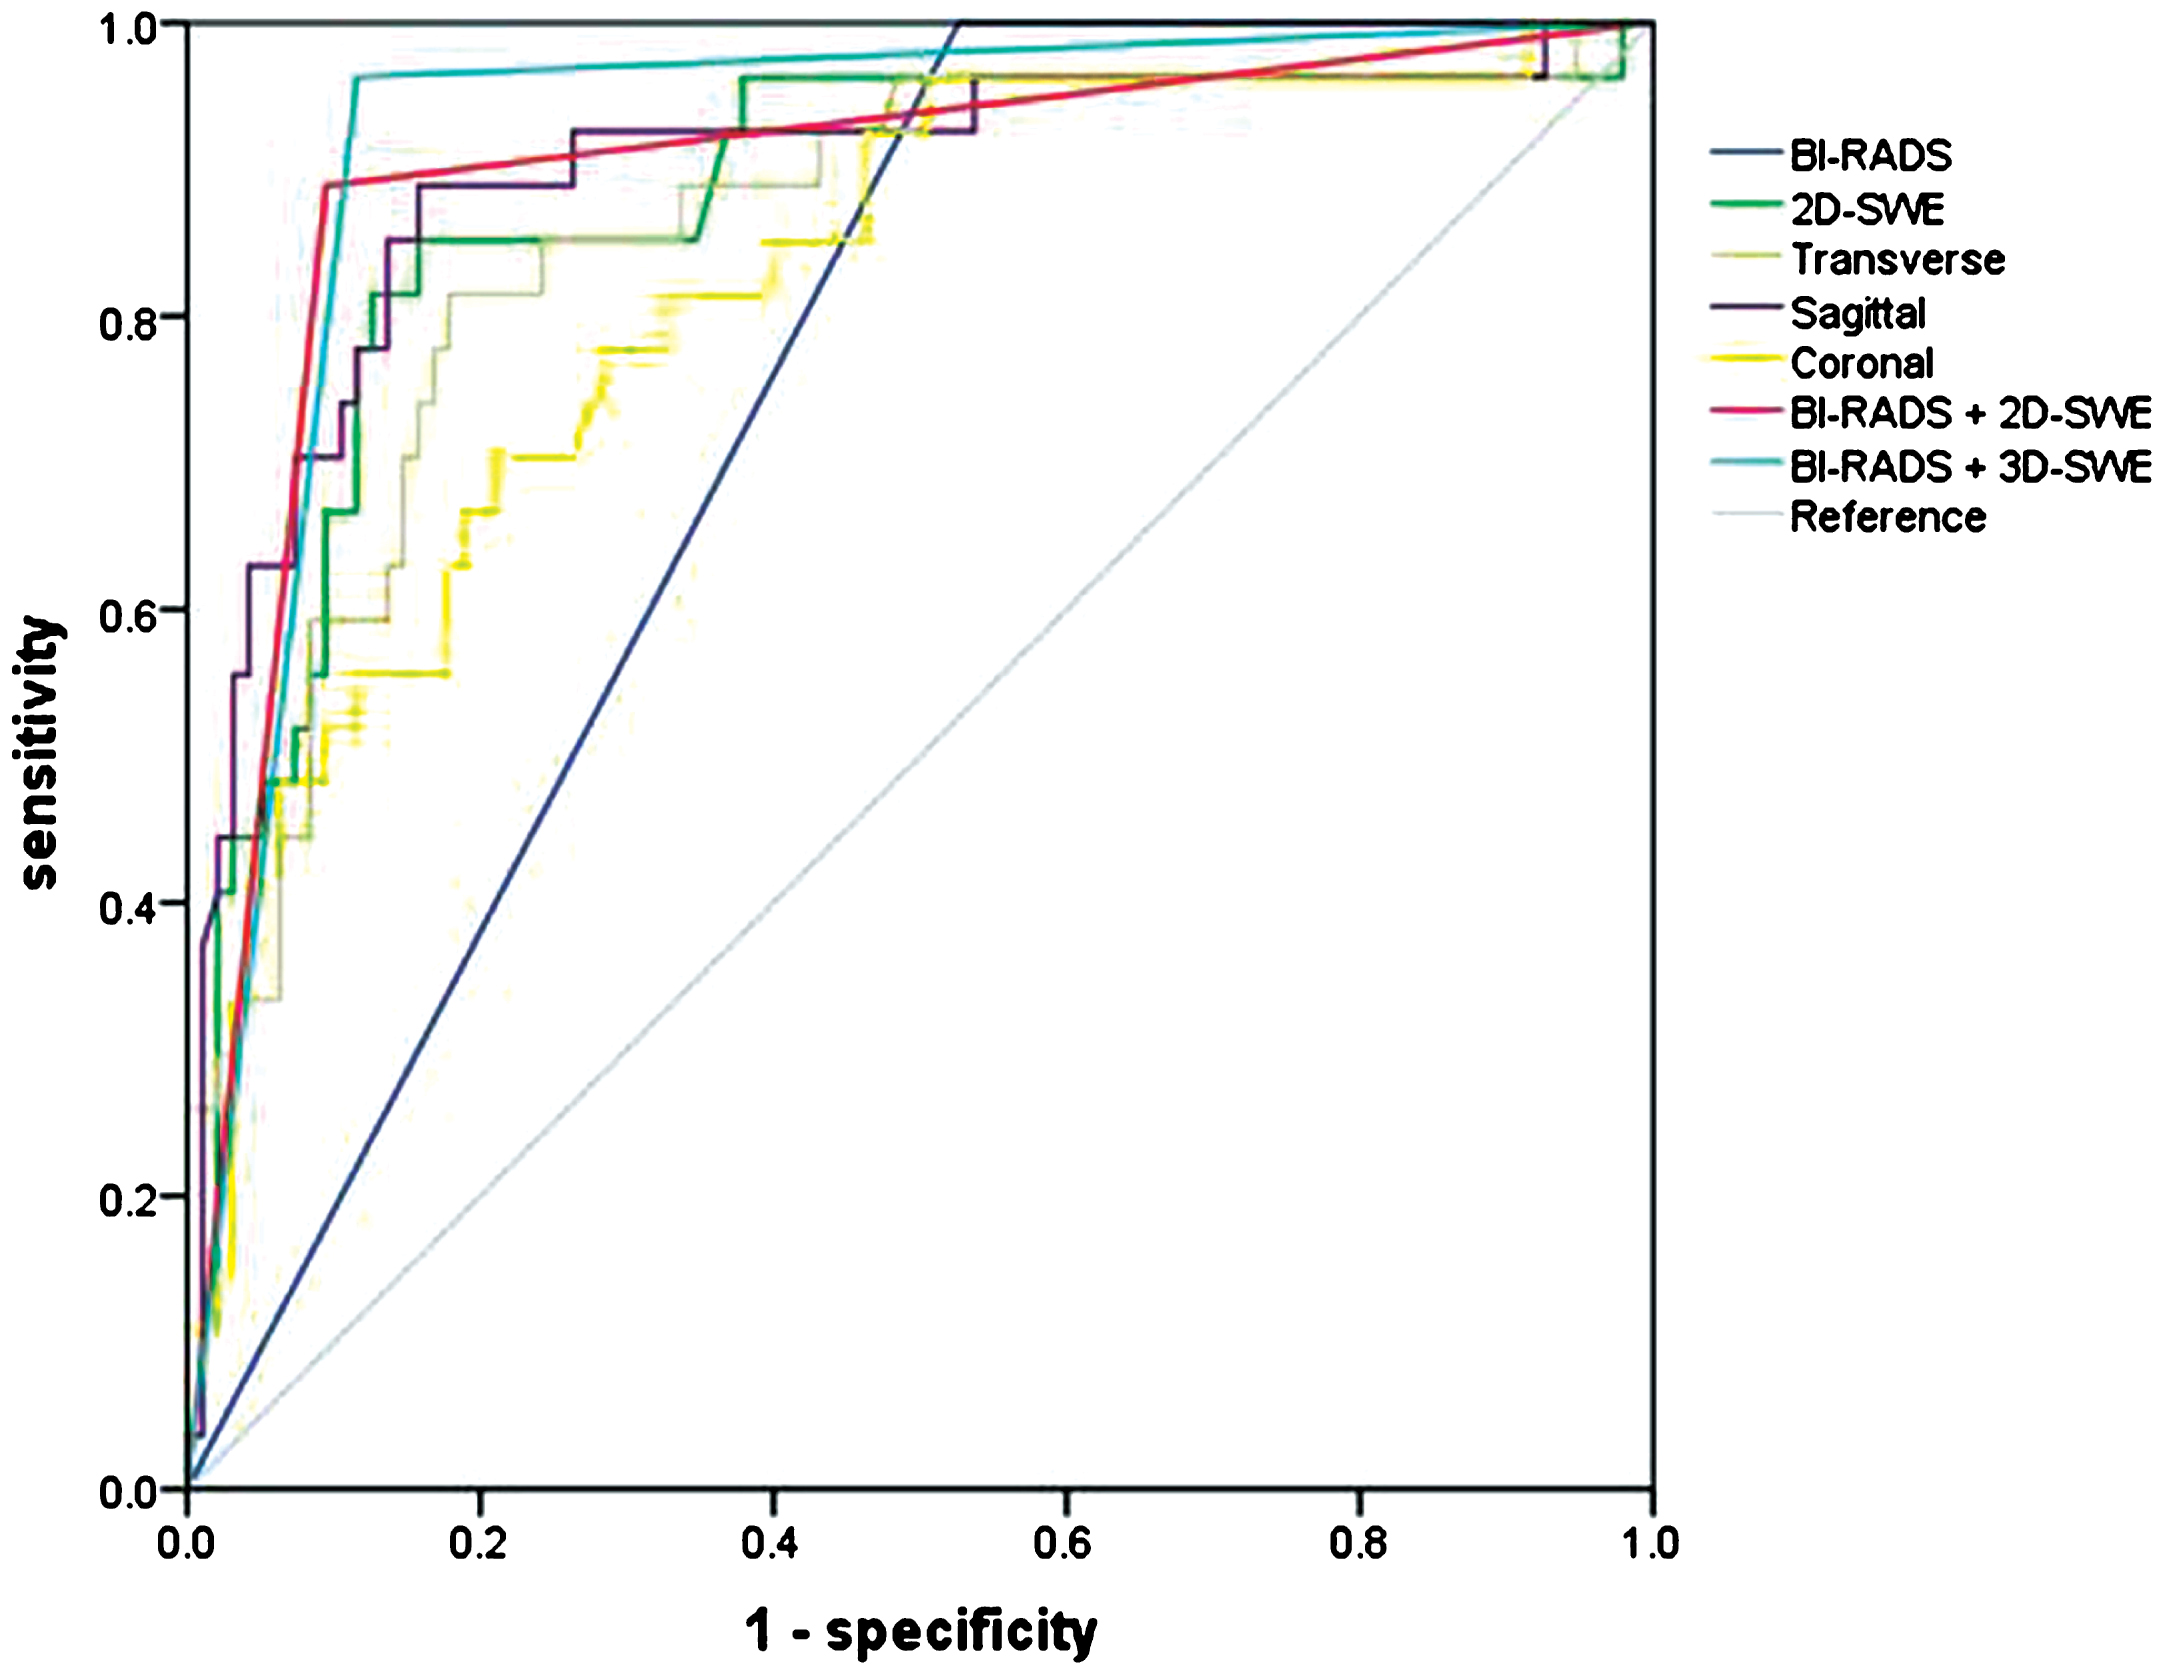
AUC analysis for 2D-SWE and transverse, sagittal, coronal planes of 3D-SWE were 0.737, 0.873, 0.854, 0.895 and 0.816 respectively.
There were two combined sets for diagnosis in this study. The sets were as follows: set 1, BI-RADS + 2D-SWE. When 2D-SWE features and BI-RADS features were combined, lesions were considered as malignant when they met both conditions: (1) BI-RADS ≥ 4a; (2) Elasticity value of Young’s modulus for 2D-SWE was higher than or equal to the cut-off value. Otherwise, lesions were considered as benign. Set 2, BI-RADS + 3D-SWE. A plane with the best diagnostic performance of 3D-SWE (transverse, sagittal or coronal) was selected to be combined with BI-RADS. When 3D-SWE and BI-RADS features were combined, lesions were considered as malignant when they met both conditions: (1) BI-RADS ≥ 4a; (2) Elasticity value of Young’s modulus for the selected plane of 3D-SWE was higher than or equal to the cut-off value.
Data distribution is shown in Fig. 5 and the diagnostic performances of the two combined sets are shown in Table 4. AUCs and specificities of the two combined sets increased significantly compared with BI-RADS alone (P < 0.05). However, compared with BI-RADS alone, significant decreased sensitivity was found in set BI-RADS + 2D-SWE (88.9% vs. 100%) (P < 0.05). AUCs between the two combined sets showed no statistically significant differences (0.897 vs. 0.924) (P > 0.05). The sensitivity of the combined set of BI-RADS + 3D-SWE (96.3%) was significantly higher than that of the combined set of BI-RADS + 2D-SWE (88.9%) (P < 0.05).
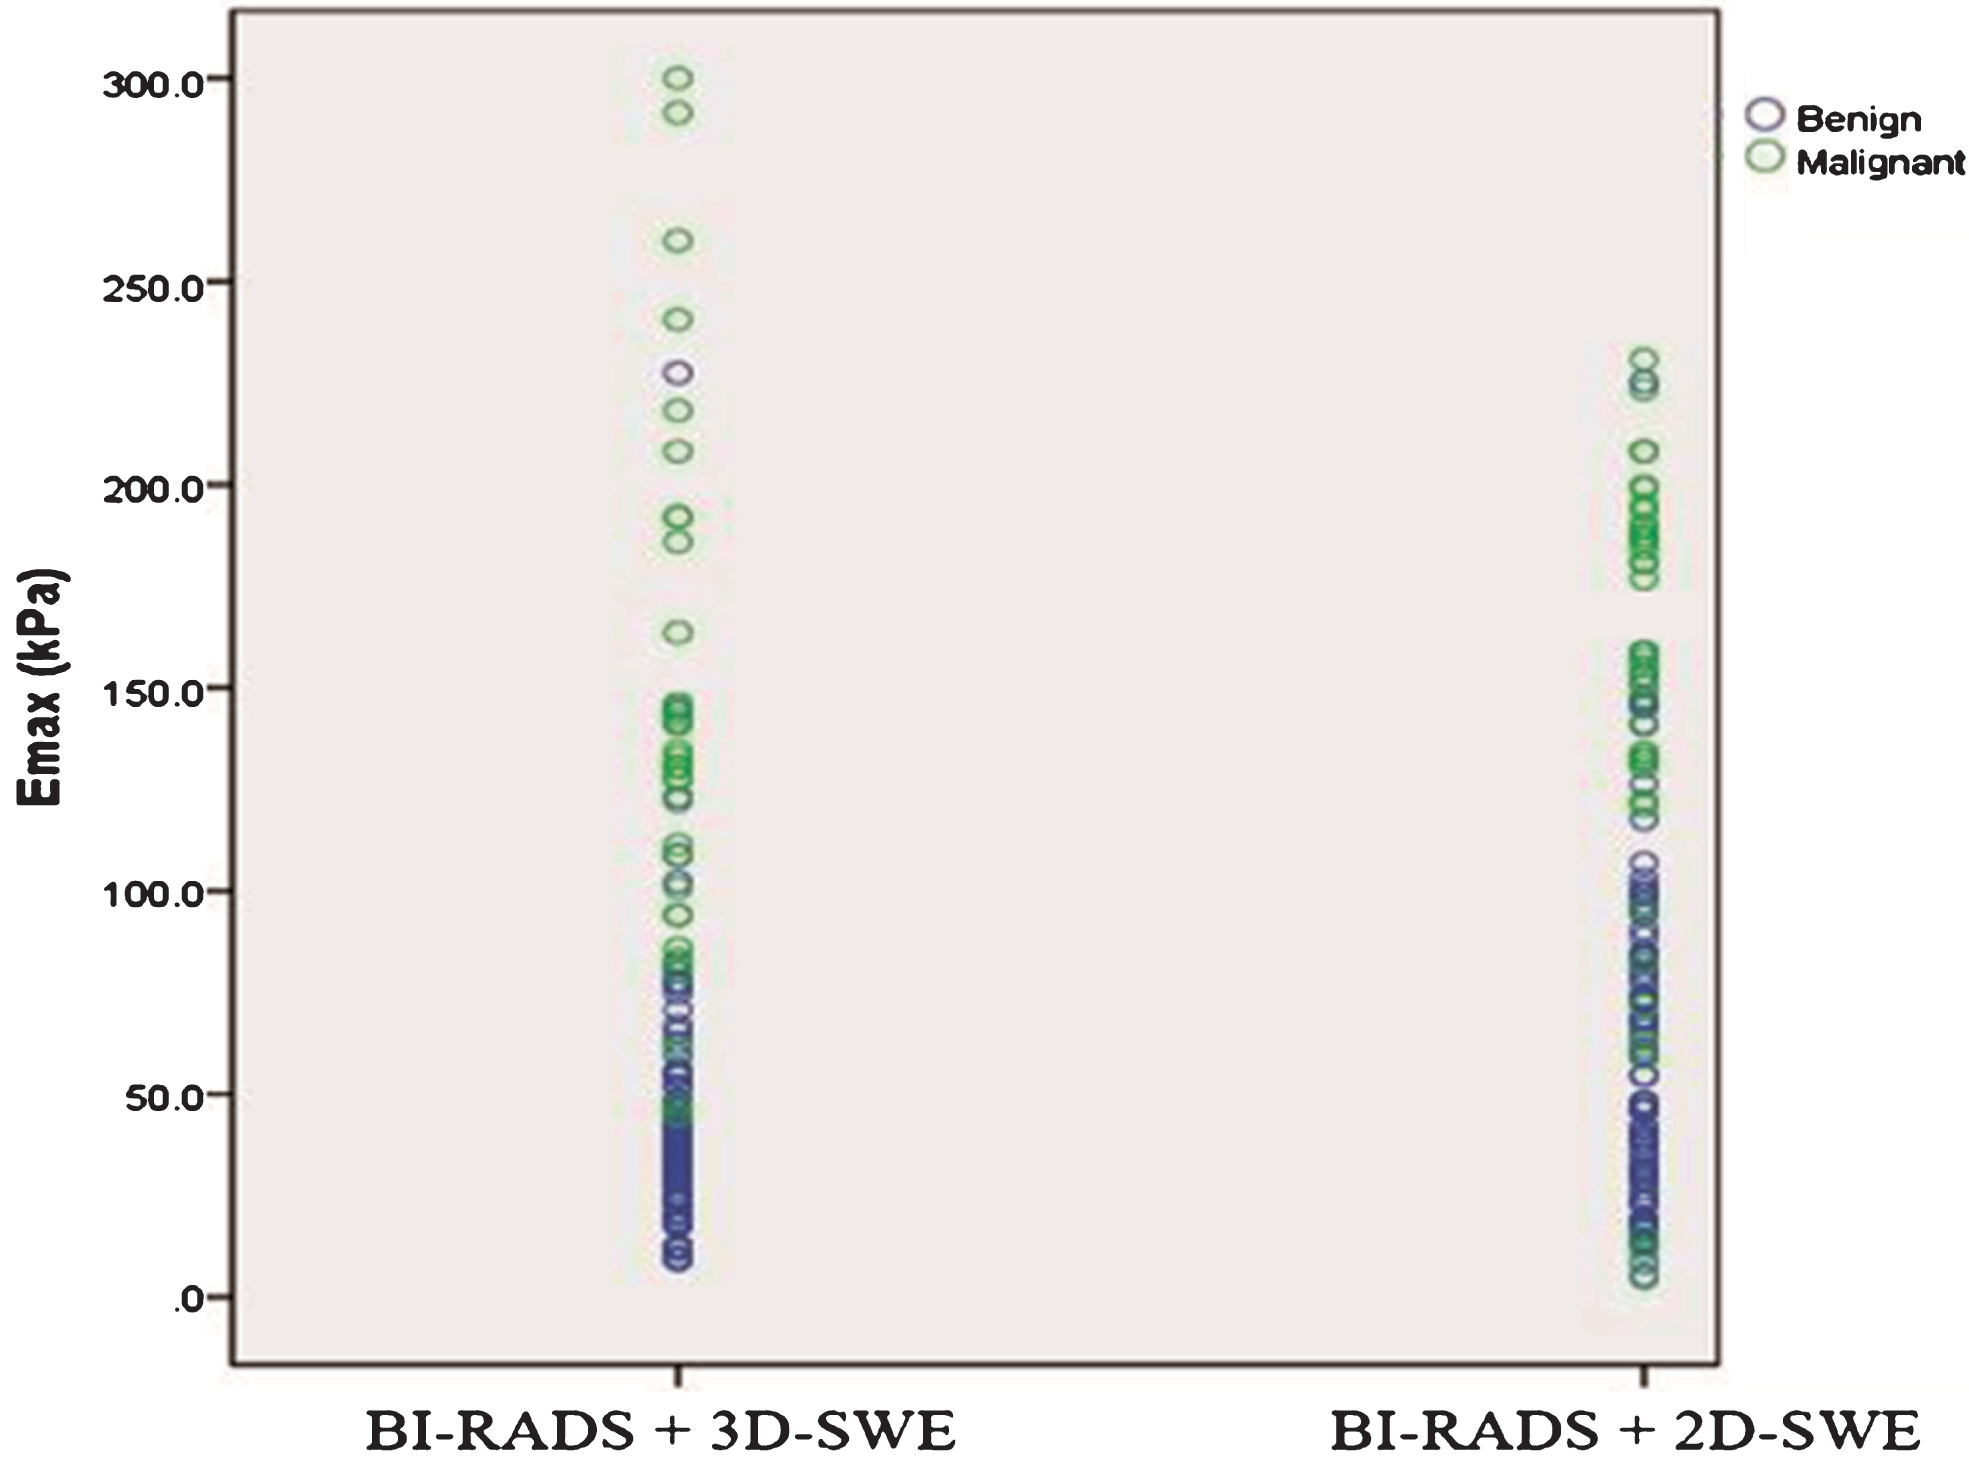
A scatter diagram shows the Emax distribution between BI-RADS + 2D-SWE and BI-RADS + 3D-SWE for breast lesions.
The diagnostic performance using BI-RADS alone and the two combined sets
BI-RADS = Breast Imaging-Reporting and Data System; SWE = shear wave elastography; AUC = Area under the receiver operating characteristic curve; *In comparison with US BI-RADS, P < 0.05; ★Comparisons between two combined sets show a significant difference, P < 0.05; AUCs of the two combined sets show no significant differences, P > 0.05.
For 2D-SWE, the correlation coefficients were 0.874 for intra-operator and 0.851 for inter-operator consistencies. For 3D-SWE, the correlation coefficients were 0.862, 0.846 and 0.843 for intra-operator consistency while 0.844, 0.839, and 0.815 for inter-operator consistency for transverse, sagittal, and coronal planes, respectively.
Discussion
2D-SWE provides quantitative stiffness information of breast lesion, while 3D-SWE provides more comprehensive stiffness information from the three orthogonal planes. It has been noted that malignant breast lesions tend to be stiffer than benign ones on US elastography [18, 30]. The median age of patients with malignant lesions was higher than that of patients with benign lesions in the present study which was consistent with a previous study [31].
According to the results of the present study, the elasticity values of Young’s modulus for benign and malignant lesions were significantly different on both 2D-SWE and three planes of 3D-SWE (all P < 0.05). The result demonstrated the usefulness of SWE in differentiating benign lesions from malignant ones. Additionally, Emax in the three planes of 3D-SWE were higher than that in 2D-SWE for the same breast lesion. One possible reason might be the more unavoidable precompression caused by the heavy 3D-SWE transducer compared with 2D-SWE [31], which led to increased stiffness. Moreover, the sensitivity of 2D-SWE in the present study was inferior or equal to that of three planes of 3D-SWE, which might also be associated with increased stiffness caused by the heavy transducer [32]. These results were concordant with the findings of previous studies [24, 34].
The present study showed that the sagittal plane of 3D-SWE was better than transverse and coronal plane in terms of diagnostic performance, which was inconsistent with several previous studies that demonstrated the advantages of coronal plane [24, 35] (Figs. 4 and 6). Chen et al. qualitatively analyzed the diagnostic performance of 3D-SWE. They found that the coronal plane of 3D-SWE depicted well the typical sign of “stiff rim” for malignant lesions, while at the same time, transverse and sagittal planes only showed the sign of “Horseshoe”. They regarded those with “stiff rim” as malignant while others as benign. Therefore, they believed that the coronal plane of 3D-SWE was better than transverse and sagittal planes. However, the qualitative analysis was subjective and might be operator-dependent [24]. In addition, the plane with “Horseshoe” sign on color map might include the stiffest portion, which should not be ignored. In the present study, even if the lesion showed “Horseshoe” sign on transverse or sagittal plane, quantitative analysis was performed so that the stiffest information would not be ignored. On the other hand, Choi et al. reported that the coronal plane was inferior to transverse and sagittal planes [34]. The sagittal plane showed the best diagnostic performance among the three planes of 3D-SWE in the present study, while transverse plane exhibited the best diagnostic performance in the study by Choi et al. [34]. One possible reason for this difference might be that sagittal plane was superior to displaying breast lesions compared to transverse and coronalplanes.
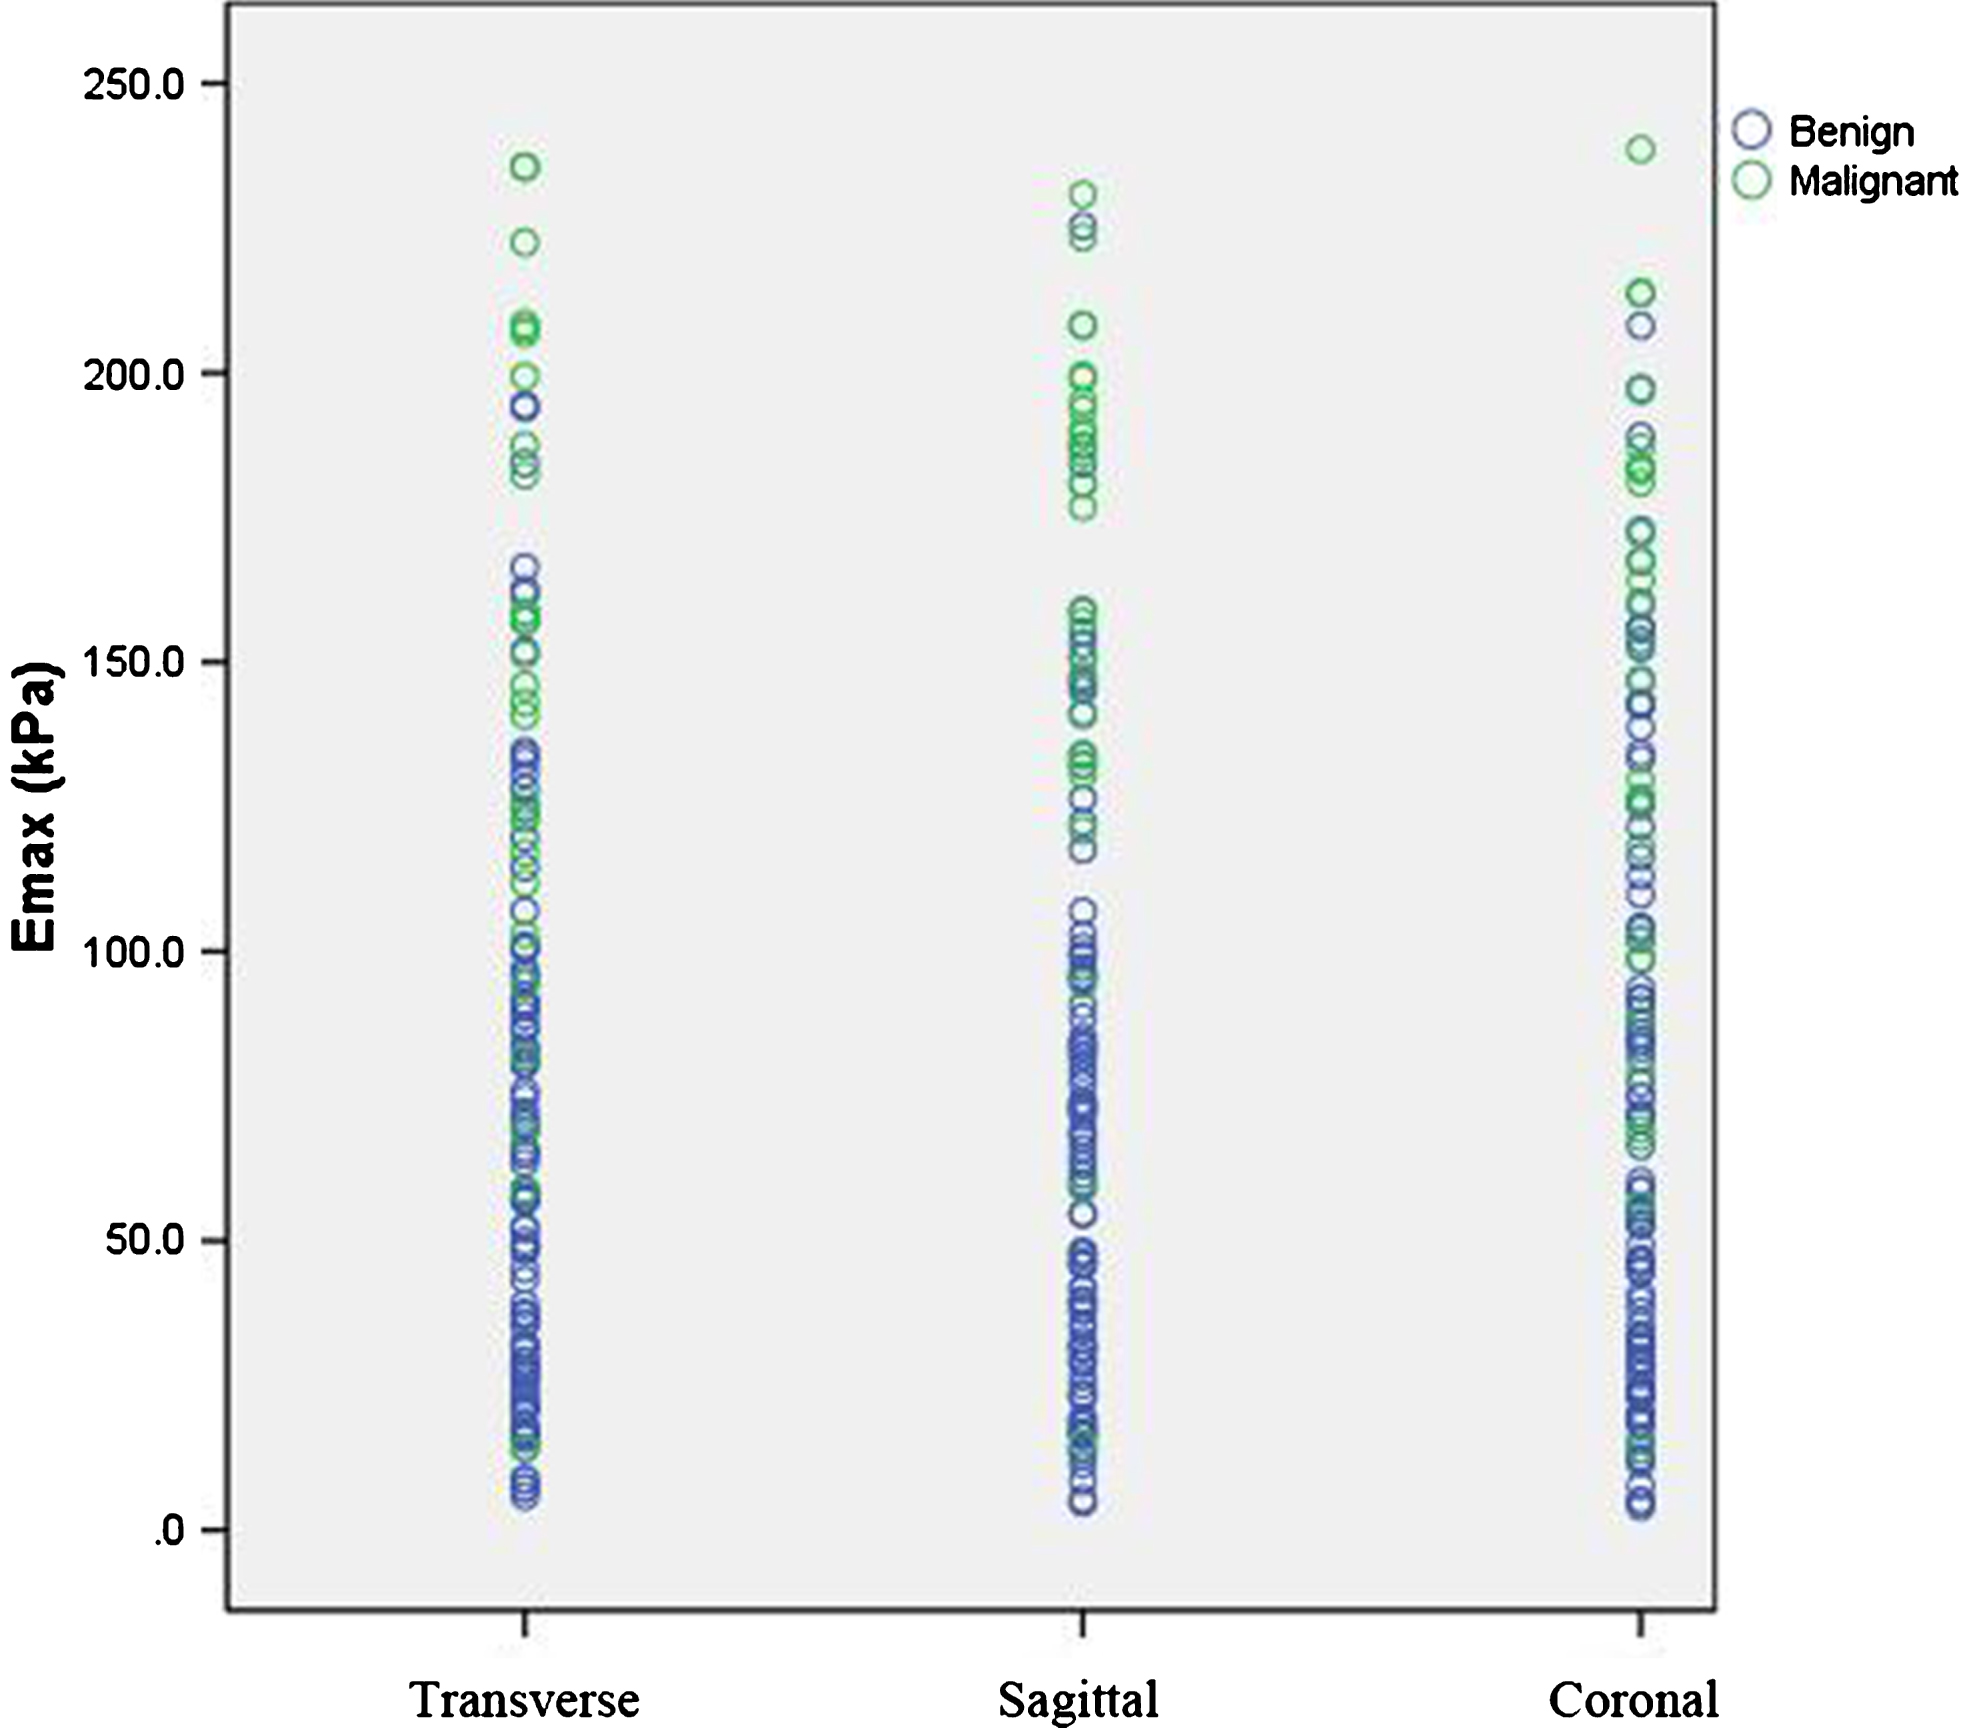
A scatter diagram shows the Emax distribution among transverse, sagittal, and coronal planes.
When combining either 2D or 3D SWE with BI-RADS, the AUCs and specificities increased in comparison with BI-RADS alone. These results were concordant with previous studies [33, 35]. However, there was no significant difference in AUC between the two combined sets (BI-RADS + 2D-SWE; BI-RADS + 3D-SWE). On the other hand, BI-RADS + 3D-SWE showed higher sensitivity compared to BI-RADS + 2D-SWE (96.3% vs. 88.9%). One reason for higher sensitivity in 3D-SWE might be that higher amount of stiffness information obtained in the volume data for 3D-SWE compared with single slice and single image for 2D-SWE [20, 21]. The other reason, as mentioned above, might be the unavoidable precompression artifact in 3D-SWE [32]. Higher sensitivity is important for clinical practice because it is best not to miss any malignant tumors. Therefore, BI-RADS + 3D-SWE may be better than BI-RADS + 2D-SWE because of higher sensitivity, even though their AUCs are similar. With BI-RADS + 3D-SWE, only one malignant lesion (3.7%) was misdiagnosed. The only false negative lesion was a grade 2 invasive ductal carcinoma with a diameter of 7 mm. Vinnicombe et al. reported that tumor size had significant effect on tissue stiffness measurement: small breast cancers (≤10 mm) were more likely to show benign features on quantitativeSWE [36].
This study had several limitations. First, the sample size is relatively small, and all the enrolled patients were referred to surgical excision or CNB. Usually all the lesions had at least BI-RADS category 3 or above, which might lead to additional selection bias. Second, lesions with size over 4 cm were excluded in the present study because the maximal range of 3D-SWE could not completely cover those large lesions. Vinnicombe et al. reported that tumor size and tissue stiffness had correlation [36]. Small lesions might be softer and large lesions might have higher stiffness. The exclusion of large lesions might also lead to selection bias of the study cohort. Third, SWE is sensitive to compression, thus external compression might affect the SWE results. Although the operators were instructed to use minimal compression during SWE data acquisition, compression from the heavier 3D transducer may be hard to be avoided in 3D-SWE acquisitions. Fourth, the study evaluate the value of 3D-SWE in differentiating breast benign lesions from malignant lesions. In regard to the difference among subtypes of malignant breast lesions for 3D-SWE, we did not perform further investagation due to the limited smaple size. Finally, correlations among US with SWE, MRI, and mammography findings were not performed, which should be evaluated in furtherstudies.
Combining either 2D or 3D SWE with BI-RADS, the AUCs and specificities increased compared to BI-RADS alone. The combination of BI-RADS and quantitative elasticity information in sagittal plane of 3D-SWE has better sensitivity compared with combination of BI-RADS and 2D-SWE. Future studies with larger sample size may be needed to confirm these findings.
Footnotes
Acknowledgments
The scientific guarantor of this work is Hui-Xiong Xu. The work was supported in part by the Shanghai Hospital Development Center (Grants SHDC12014229, 16CR3061B, and SHDC22015005), the Science and Technology Commission of Shanghai Municipality (Grant 16411971100), and the National Nature Science Foundation of China (Grants 81671695, 81725008 and 81501474).