
Abstract
Introduction
With an increasing number of breast cancers detected in the recent years [1, 2], more and more attention has been paid in improving the diagnostic performance for breast cancers [3–5]. In patients with breast lesions, clinical palpation has always been a vital approach, whereas it is restricted in patients with small and deep lesions and it is subjective [6]. As a main imaging diagnostic technique, mammography has been widely recommended for diagnosis of breast lesions, which is sensitive to calcification in the lesions [7, 8]. However, mammography is short for its radiation exposure and limitation to dense tissue. To avoid this restriction, ultrasound (US) has become a complementary method to mammography [8, 9]. However, conventional US showed a low specificity (70%) in the diagnosis of breast lesions [10]. Moreover, conventional US cannot reflect tissue stiffness. To avoid these limitations, elastography was proposed by Ophir et al. in 1991 [11], and strain imaging was used for the diagnosis of breast lesions, which includes strain elastography (SE) and acoustic radiation force impulse (ARFI) imaging. The sensitivity of strain imaging for diagnosis of breast lesions ranges 84.2–99% and the specificity ranges 74.1–91.5% [12–16]. SE and ARFI imaging are semi-quantitative methods to show the tissue stiffness. In addition, SE needs manual pressure thus it is operator dependent and the reproducibility is questionable [17]. In recent years, shear wave elastography (SWE) has become popular with an improvement in specificity without loss of sensitivity [18], which shows a sensitivity of 88.6–97% and a specificity of 82–97.5% [19–22]. It provides us quantitative information of tissue stiffness. SWE is produced by acoustic radiation force or mechanical external vibration, which can provide information about the distribution of stiffness and the instant shear wave speed (SWS) through tissues simultaneously. SWE has gained increasing attention in recent years. In addition, SWE is more operator-independent in comparison with SE for diagnosis of breast lesions [3].
Currently, several manufacturers have released SWE techniques. Of them, the tissue stiffness information is denoted by Young’s modulus (kPa), or SWS (m/s), or both. In clinical practice, it is noted that same lesion might show different quantitative values of tissue stiffness with different US machines. This fact might be due to the different imaging principles for the machines. For example, Toshiba shear wave elastography (T-SWE; Aplio500, Toshiba Medical System, Tochigi, Japan) can select “continuous scan” or “one-shot scan”. In “continuous scan”, the frame rate can be selected in three steps (0.4, 0.7 and 1.0 frames per second), and continuous scan is advantageous for evaluating areas that are likely to be affected by cardiac motion. In “one-shot scan”, higher image quality is obtained. In addition, T-SWE can be viewed as a propagation map, in which the shear wave arrival time is presented as contour lines. The map shows where the shear waves are generated and propagate properly in a single still image and it can be used as a quality measurement. For Supersonic shear wave elastography (S-SWE; Aixplorer US system, SuperSonic Imagine, Provence, France), shear waves are magnified in a Mach cone shape, which is able to increase the propagation distance of shear waves and minimize acoustic power simultaneously. It is equipped with an ultrafast platform that can acquire images 200 times faster than conventional US.
Until present, there have been no comparative studies on SWE in comparing the parameters of T-SWE and S-SWE for diagnosis of breast lesions. This study is aimed to analyze the diagnostic performance of T-SWE and S-SWE in distinguishing malignant breast lesions from benign ones and to evaluate whether T-SWE and S-SWE are equivalent for distinguishing the breast lesions.
Materials and methods
Patients enrollment
This retrospective study was approved by our institutional review board and all participating patients’ informed consent was waived. From March 2016 to May 2016, 184 consecutive patients with US-detected breast lesions or with palpable breast lesions were referred to US, T-SWE and S-SWE examinations in the tertiary university hospital. If more than one lesion was present, the most suspicious lesion or the largest lesion was chosen.
The inclusion criteria for the breast lesions were as follows: (a) breast lesions were US-detected or palpable; (b) no previous treatment, such as breast surgery, radiotherapy or chemotherapy; (c) solid or mixed with more than 75% solid part. Breast lesions were excluded according to the following criteria: (a) data was incomplete (n = 7); (b) without pathological examination results (n = 24).
Eventually, 153 patients (mean age, 46.4 years±15.1; age range 20–86 years) with 153 breast lesions (mean diameter, 16.8 mm±10.5; range 4.1–90.0 mm) were included.
In addition, another 30 patients were included to evaluate the inter-operator consistency and they were not enrolled in the comparison analysis.
Measurement protocol of T-SWE
Conventional US and elastography examinations were performed by one of three operators with more than 2 years of experience. The conventional US examinations were performed to obtain the transverse and longitudinal US images for each breast lesion with the patient in the supine position. T-SWE was then performed at the longest length of breast lesions with the Aplio500 machine (Toshiba Medical System, Otawara, Tochigi, Japan), equipped with a 14L5 liner array transducer (frequency range 5–14 MHz). The transducer was required to be placed vertically on the surface of the breast as slight as possible to reduce artifactual stiffness. Immobilization was maintained for several seconds and the patients were asked to hold their breath for a few seconds to acquire stable SWE images.
T-SWE can be displayed as elasticity mode, speed mode and propagation mode. It can show the stiffness distribution of lesions not only with speed mode in m/s (range 0–8 m/s) but also with elasticity mode in kPa (range 0–180 kPa). In order to compare with S-SWE in this study, the elasticity mode was analyzed. The propagation mode is referred to assess the quality and reliability of images by scanning the contour lines, for which high quality of images is obtained with parallel contour lines, and the wider the contour interval is, the stiffer the lesion is.
Lesions were often set in the middle of the sampling box and the region of interest (ROI) was artificially set to include the lesions. The layout of ROI was based on the image obtained under the propagation mode, which was often placed on the area with parallel contour lines. To ensure the reliability of SWE, distorting factors such as calcification, obvious cystic parts or surrounding tissue of breast lesions were avoided when placing the ROI box on the image.
Then, shear wave elasticity values were acquired with two ROI boxes according to the propagation mode. One ROI was adjusted according to the lesion contour to encompass the maximum lesion area to get the mean (Emean) and the standard deviation (ESD) of elastic modulus values in kPa for the lesion, the other was placed on the stiffest area to obtain the maximum (Emax) elastic modulus in kPa according to the color map on which stiff tissues were coded with red, with areas of decreasing stiffness coded with orange, green, light blue, and dark blue (Fig. 1).
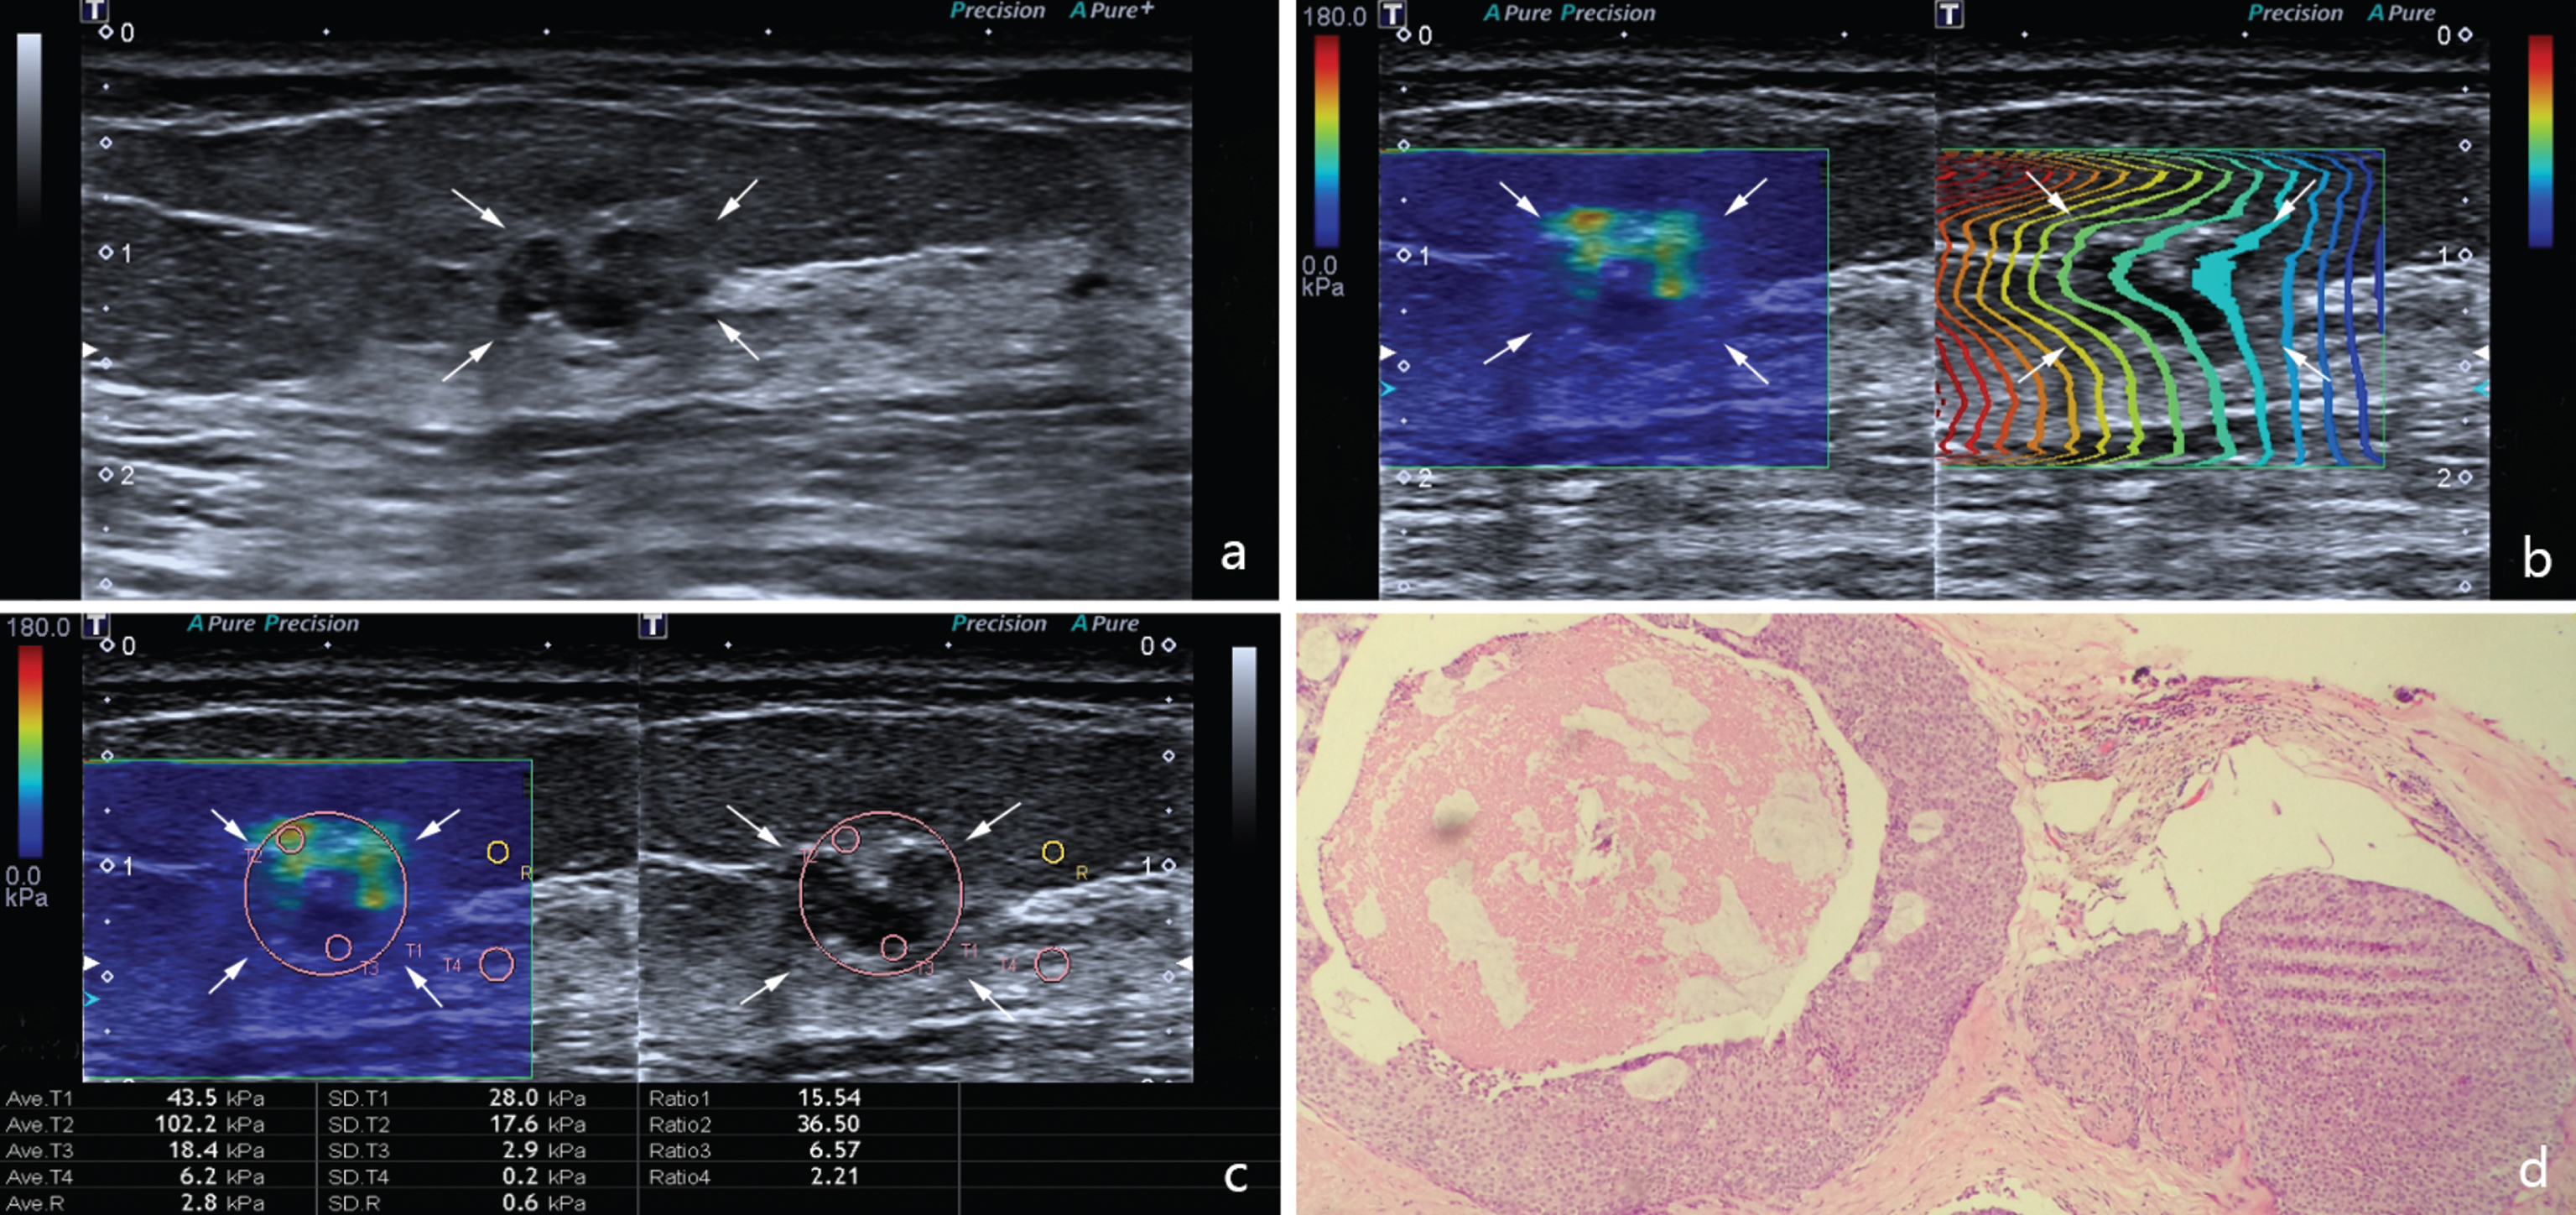
Images in an 84-year-old woman with ductal carcinoma. (a) The lesion (arrows) is shown on B-mode ultrasound.(b) The lesion (arrows) shows regularly parallel contour lines on the shear wave propagation mode. (c) The Emax, Emean, and ESD of the lesion (arrows) on elasticity mode are 102.2 kPa, 43.5 kPa and 28 kPa respectively. (d) Pathological examination confirms the diagnosis of ductal carcinoma (haematoxylin-eosin stain; original magnification, ×100)
S-SWE examination was carried out by the same operator as above with the Aixplorer US system (SuperSonic Imagine, Aix-en-Provence, France), which was equipped with a linear array transducer of 4–15 MHz. The patient position and breath holding were the same as those mentioned in T-SWE.
According to the value of the elastic modulus at each pixel, S-SWE also appeared as a color map consistent with T-SWE. Areas of black demonstrate a lack of shear wave. Meanwhile, Q-box (i.e. ROI) ranges from 0 (soft) to 180 (stiff), which is expressed as kilopascal. The layouts of the sampling box and Q-box were the same as T-SWE. However, in S-SWE, elasticity values were acquired as Emax, Emean and ESD with only one Q-box.
In both T-SWE and S-SWE, Emax, Emean, and ESD were calculated for the following analysis. To further compare the diagnostic performances of T-SWE and S-SWE in breast lesions with different sizes, all the lesions were divided into group 1 (i.e. diameter ≤20 mm) and group 2 (i.e. diameter >20 mm).
Inter-operator and Intra-operator consistency of T-SWE and S-SWE
Another 30 patients were included to evaluate the inter-operator consistency of T-SWE and S-SWE by two other independent operators who have similar experience on SWE. SWE was also carried out by the same operator to evaluate the intra-operator consistency while the time interval of the two examinations was 1 day. All the measurement was conducted as the method mentioned above and these lesions were not enrolled to analyze the diagnostic performance.
Statistical analysis
All statistical analysis was conducted with the SPSS 20.0 software (SPSS, Chicago, IL) and MedCalc (Mariakerke, Belgium)software. Mean±standard deviation was used for continuous data with a normal distribution while counts and percentages were used for categorical data. Comparisons of SWE values between benign and malignant breast lesions were performed by the independent-samples or paired-samples t test, as well as which between T-SWE and S-SWE. Receiver operating characteristic (ROC) curves were performed to obtain the areas under the receiver operating characteristic curves (AUROCs), cutoff values, sensitivity, specificity, positive predictive value (PPV) and negative predictive value (NPV). The diagnostic performance was referred as high (AUROC > 0.9), moderate (AUROC = 0.7 – 0.9), or low (AUROC = 0.5 – 0.7). The optimal cutoff values were determined by the Youden index (maximum of sensitivity + specificity – 1). The comparisons of AUROCs for Emax, Emean and ESD of T-SWE or S-SWE and the comparisons between T-SWE and S-SWE were both performed with the method proposed by DeLong et al. [23]. The comparisons of sensitivity, specificity, accuracy, PPV and NPV were conducted by the McNemar test or chi-square test. Intra-class correlation coefficient (ICC) was used to test the inter- and intra-operator consistency of T-SWE and S-SWE. A two-tailed p < 0.05 was considered to show a significant difference.
Results
Basic characteristics
Eventually, 153 breast lesions (mean diameter, 16.8 mm±10.5; range 4.1–90.0 mm) in 153 patients (mean age, 46.4 years±15.1; age range 20–86 years) were enrolled, which included 112 (73.2%) benign lesions and 41 (26.8%) malignant lesions. All the lesions were confirmed by US-guided core needle biopsy (n = 26), surgery (n = 122) or both (n = 5). 109 lesions were ≤20 mm in diameter, and 44 lesions were >20 mm.
Benign lesions included fibroadenoma (n = 17), adenosis (n = 30), fibroadenomatous hyperplasia (n = 50), intraductal papilloma (n = 8), benign phyllodes tumour (n = 2), ductal hyperplasia (n = 3), and inflammation change (n = 2). Malignant lesions contained invasive ductal carcinoma (IDC) (n = 29), invasive adenocarcinoma (n = 5), intraductal carcinoma (n = 3), invasive lobular carcinoma (n = 1), intraductal papillary carcinoma (n = 1), apocrine carcinoma (n = 1), and mucinous carcinoma (n = 1).
Diagnostic performances of T-SWE and S-SWE
In T-SWE and S-SWE, Emax, Emean and ESD were significantly higher in malignant lesions than in benign lesions (p < 0.05) (Table 1). Among Emax, Emean and ESD, ESD showed the best diagnostic performance in T-SWE (Fig. 2), and its cut-off value was 18.5 kPa, with a sensitivity of 95.1% (39/41) and a specificity of 90.2% (101/112). While in S-SWE, Emax showed the best diagnostic performance (Fig. 3), its optimal cut-off value was 73.6 kPa and its sensitivity and specificity were 92.7% (38/41) and 92.0% (103/112) respectively. It showed no significant differences in comparisons of the AUROC-max, AUROC-mean and AUROC-SD between T-SWE and S-SWE separately (all p > 0.05) (Table 2). The difference between the AUROC-SD in T-SWE and the AUROC-max in S-SWE was not significant. The AUROC-max, AUROC-mean and AUROC-SD in T-SWE and S-SWE were also compared in subgroups with different diameters (Table 3).
SWE findings in benign and malignant lesions
SWE findings in benign and malignant lesions
Data are mean±standard deviation, and range are numbers in parentheses. T-SWE = Toshiba shear wave elastography. S-SWE = Supersonic shear wave elastography. Emax = Maximum elastic modulus. Emean = Mean elastic modulus. ESD = Standard deviation of the elastic modulus. *Indicates a significant difference.
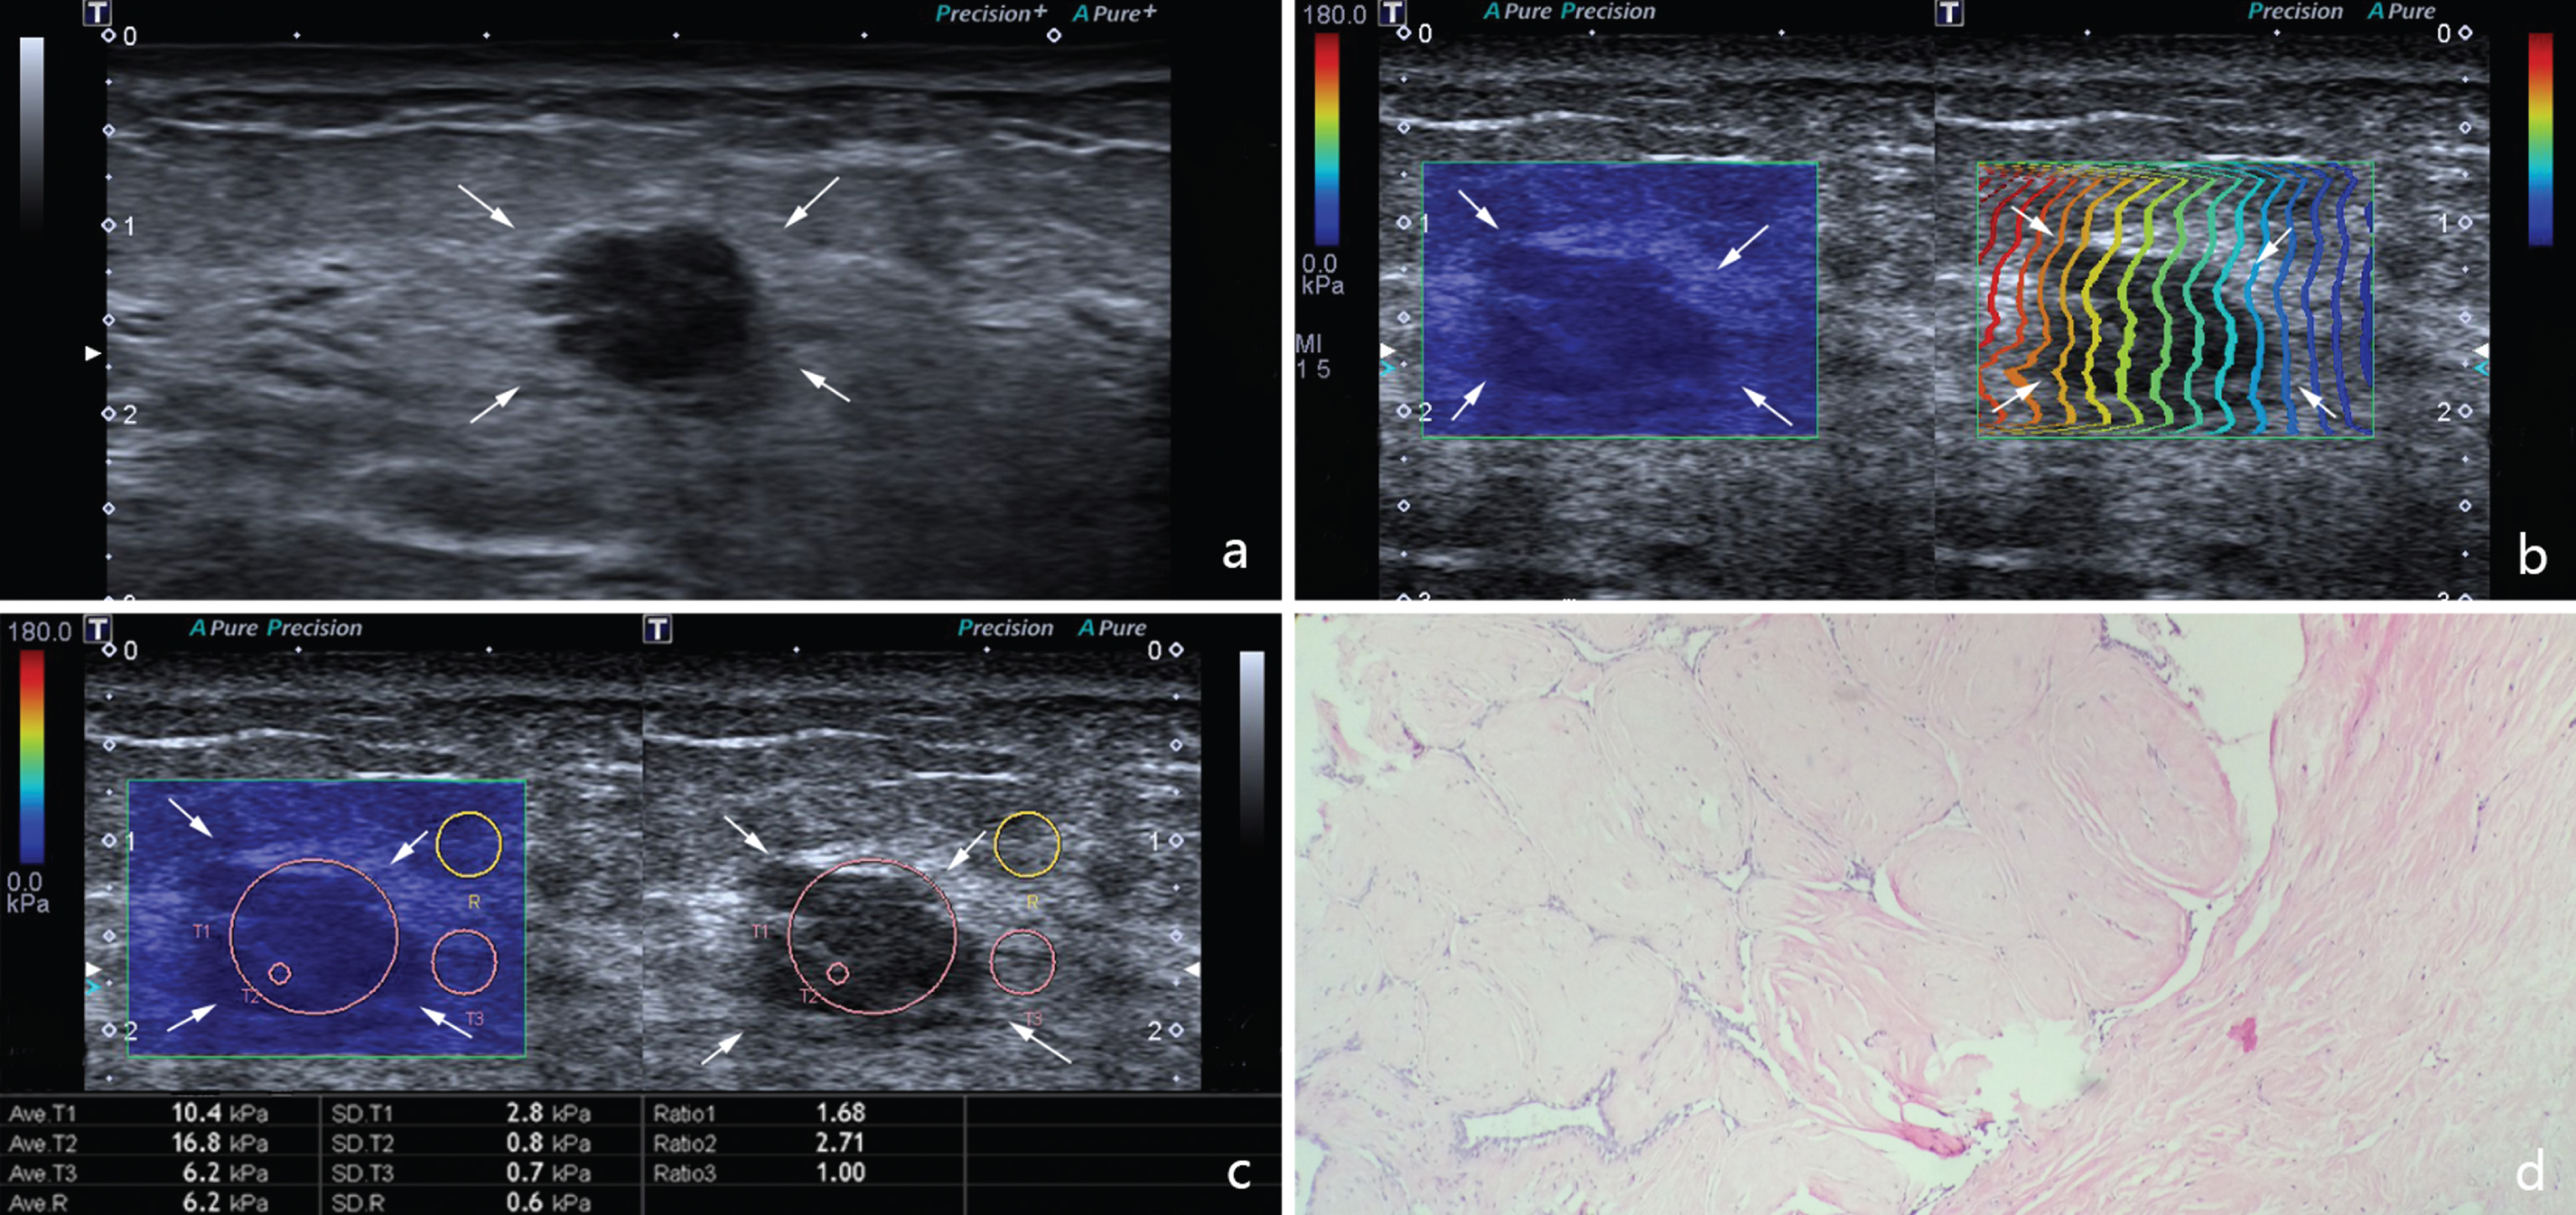
Images in a 47-year-old woman with fibroadenoma. (a) The lesion (arrows) is shown on B-mode ultrasound. (b) The lesion (arrows) shows regularly parallel contour lines on the shear wave propagation mode. (c) The Emax, Emean, and ESD of the lesion (arrows) on elasticity mode are 16.8 kPa, 10.4 kPa and 2.8 kPa respectively. (d) Pathological examination confirms the diagnosis of fibroadenoma (haematoxylin-eosin stain; original magnification, ×100).
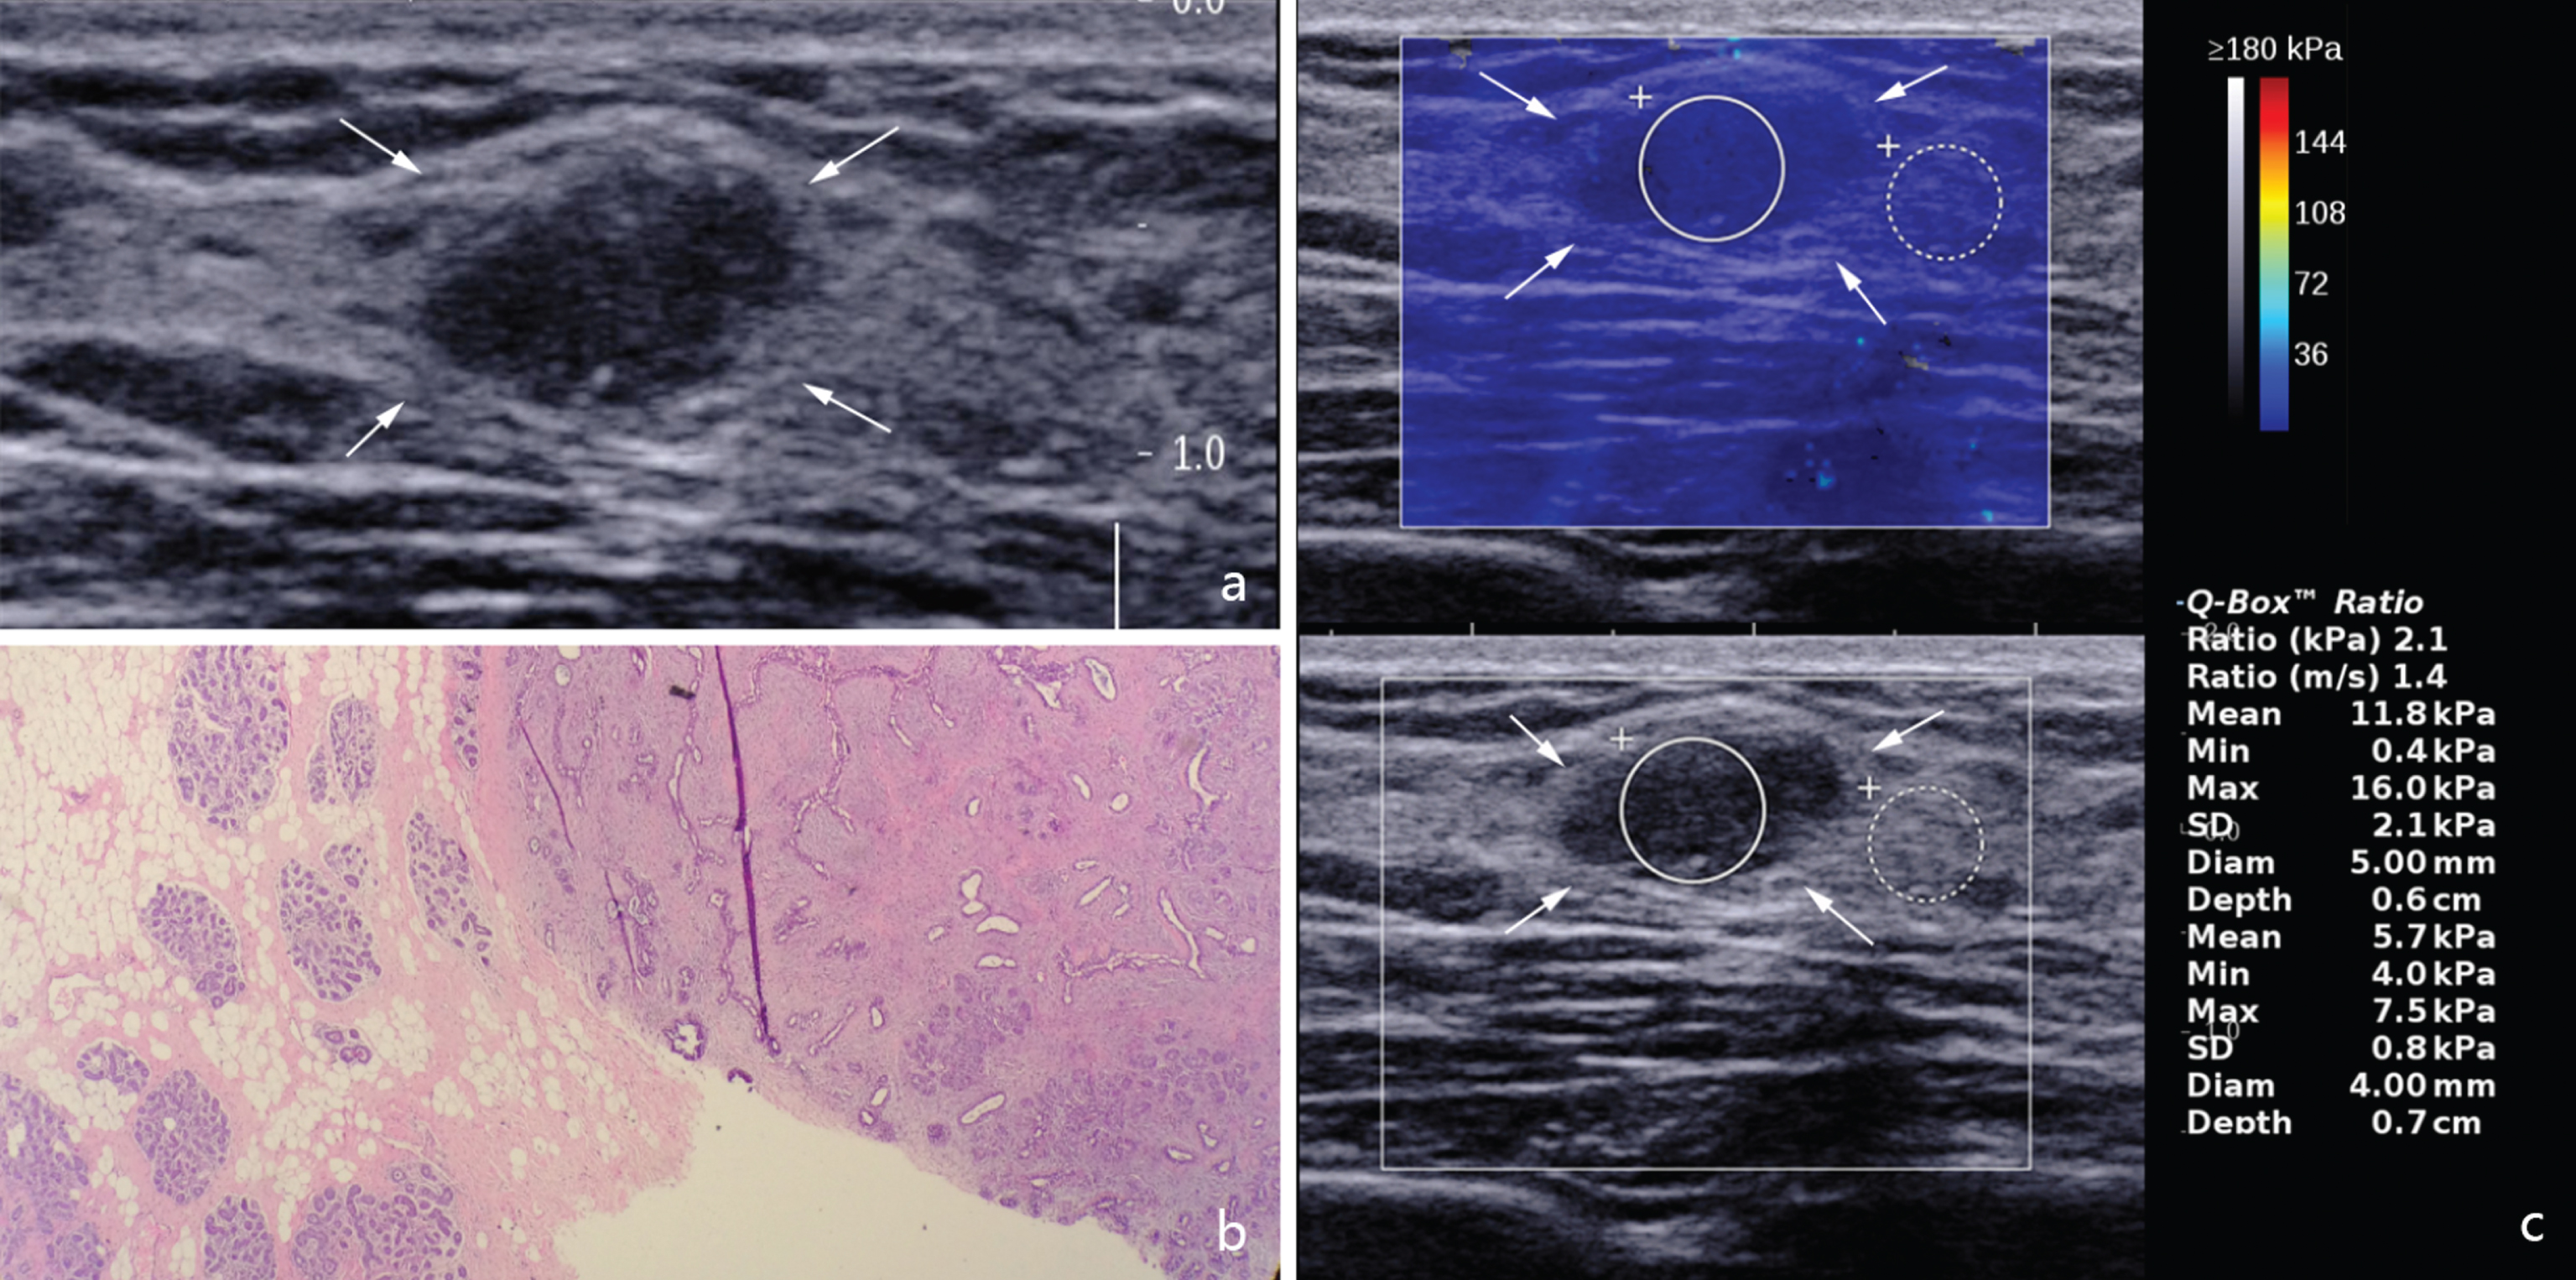
Images in a 24-year-old woman with fibroadenomatous hyperplasia. (a) The lesion (arrows) is shown on B-mode ultrasound. (b) Pathological examination confirms the diagnosis of fibroadenomatous hyperplasia (haematoxylin-eosin stain; original magnification, ×40) (c) The Emax, Emean, and ESD of the lesion (arrows) on SSI are 16 kPa, 11.8 kPa and 2.1 kPa respectively.
Comparison of diagnostic performances between T-SWE and S-SWE parameters
T-SWE = Toshiba shear wave elastography. S-SWE = Supersonic shear wave elastography. PPV = positive predictive value; NPV = negative predictive value. AUROC = Area under the receiver operating characteristic curve. Emax = Maximum elastic modulus. Emean = Mean elastic modulus. ESD = Standard deviation of the elastic modulus. *P < 0.05 versus Emax in T-SWE. †P < 0.05 versus Emean in T-SWE. ‡P < 0.05 versus ESD in T-SWE. ¶P < 0.05 versus Emax in S-SWE. ¢P < 0.05 versus Emean in S-SWE.
Diagnostic Performances of SWE in differentiating benign from malignant lesions in different size groups
T-SWE = Toshiba shear wave elastography. S-SWE = Supersonic shear wave elastography. AUROC = Area under the receiver operating characteristic curve. 95% confidence intervals are in parentheses.
In T-SWE and S-SWE, the inter-operator difference was 0.9±11.2 kPa (range 24.1–33.2 kPa) versus 0.2±10.1 kPa (range 17.4–34.8 kPa), while the intra-operator difference was 0.5±6.5 kPa (range 10.7–19.6 kPa) versus 0.5±7.4 kPa (range 8.1–32.4 kPa) respectively. In T-SWE, the correlation coefficients were 0.898 for inter-operator while 0.961 for intra-operator. In S-SWE, the correlation coefficients of inter-operator and intra-operator were 0.897 and 0.954 respectively.
Discussion
Elastography technology has developed for decades, which can evaluate tissue stiffness. In strain imaging, only qualitative or semi-quantitative data of tissue stiffness can be obtained. In SWE, quantitative shear wave data of tissue can be obtained and it is referred as Young’s modulus and the SWS, including the maximum, the mean, the minimum, the standard deviation, and the ratio values. Several studies have proven that quantitative parameters of S-SWE can be applied in the diagnosis of breast lesions with promising diagnostic performance [18, 24]. However, different parameters show different diagnostic performance in various machines, it is challenging for clinicians to choose an appropriate parameter among them.
In the current study, Emax, Emean, and ESD of malignant lesions were significantly higher than those of benign ones both for T-SWE and S-SWE, which was consistent with previous studies [19, 20]. According to our result, Emax in S-SWE had the highest diagnostic performances in comparison with Emean and ESD. In a meta-analysis including 33 studies, SWE was used to evaluate 5838 breast lesions in 5397 patients. The most accurate threshold for Emax in S-SWE showed wide disparity from 50 kPa to 106 kPa with AUROC ranged from 0.843 to 0.961 [19]. Among them, Youk et al. [2] reported that the optimal cutoff value of Emax in S-SWE was 78.5 kPa to distinguish malignant lesions from benign ones, which was similar to ours (73.6 kPa). In addition, the sensitivity, specificity, and AUROC of elastography is 92.7%, 92.0%, and 0.961 respectively, in their study, which was consistent with 91.7%, 92.2%, and 0.967 respectively in the current study. However, Evans et al. [20] reported that Emean was the most useful elasticity value, which was different from ours. This diversity may be due to the discordance in elastic modulus measurement, a round ROI was placed on the stiffest part of the lesion in their study, while in our study, an ROI was adjusted to cover the whole lesion to ensure that lesion heterogeneity could be depicted.
Several other studies also confirmed that Emax showed better performance in distinguishing malignant breast lesions from benign ones in comparison with Emean and ESD [25–27]. However, in the present study, we found that ESD had the highest diagnostic performances in comparison with Emean and Emax in T-SWE, and its sensitivity and specificity were 95.1% (39/41) and 90.2% (101/112) respectively. The probable explanations for this result may be as follows: Firstly, ESD is a parameter which can show the heterogeneity of stiffness distribution [28], while Emax shows the stiffness of the stiffest part of the lesion and Emean indicates the average stiffness. The higher the ESD is, the more suspicious the lesion is. Secondly, in T-SWE, Emean and ESD can be computed automatically when a round ROI adjusted to the lesion was placed. We can only measure the Emax by observing the colors of the lesion visually that blue and red represent soft and stiff, which may result in the deviation. Therefore, ESD is more objective than Emax in T-SWE. The comparisons of AUROCs among the three parameters between T-SWE and S-SWE showed no statistically difference respectively, and there were no significant differences between ESD in T-SWE and Emax in S-SWE, indicating that the two SWE systems were comparable in diagnosing malignant breast lesions.
In the present study, both in T-SWE and S-SWE, there were no significant differences between the lesions ≤20 mm and >20 mm in the diagnostic performances of three elasticity parameters suggesting no importance of a lesion’s size. This result can be compared with the meta-analysis by Sadigh et al. [29], which reported that the diagnostic performance of elastography was not significantly related to the diameter of lesions. In addition, several studies have confirmed that SWE is a highly reproducible elastography technique [26, 30]. Consistent with the results of these studies, our results showed well inter- and intra- operator consistency of T-SWE and S-SWE.
To our knowledge, there was no previous study focusing on T-SWE to evaluate the breast lesions. Besides, it was also the first time to compare the diagnostic performance of T-SWE and S-SWE in breast lesions. However, there were several limitations to our study. First, SWE and conventional US images were displayed on the same screen, so the evaluation of the SWE may be influenced by the conventional US images. Second, although all elastic images were obtained by one skilled operator and SWE is known to be highly reproducible, image acquisition was still affected subjectively by the operator, such as the misplacement of the ROI. Third, because it was a retrospective study with patients who had pathological results included, selection bias may exist, indicating a high breast malignancy rate with 26.8%. In addition, the sample size was relatively small, larger prospective studies are needed to validate our results in the future.
Conclusion
To conclude, in T-SWE, ESD was the best parameter, while in S-SWE, Emax was the best parameter, respectively, there were no significant difference between ESD in T-SWE and Emax in S-SWE. T-SWE was identical with S-SWE in distinguishing the breast lesions with Emax, Emean and ESD. Excellent repetitiveness was accessible to the operation of T-SWE and S-SWE. In the future, multi-center and large sample studies for further research are needed, as well as the evaluation of combing elastography in T-SWE or S-SWE with conventional US.
Footnotes
Acknowledgments
Supported in part by the Shanghai Hospital Development Center (Grant SHDC12014229), the Science and Technology Commission of Shanghai Municipality (Grants 14441900900, 15411969000 and 16411971100), and the National Natural Scientific Foundation of China (Grant 81401417).