
Abstract
BACKGROUND:
Pathomechanism and optimal renoprotective protocol for remote ischemic preconditioning (RIPC) have not been completely revealed yet.
OBJECTIVE:
To investigate micro-rheological effects of early and delayed RIPC in renal ischemia-reperfusion (I/R) in the rat.
METHODS:
In Control group the left femoral artery was cannulated and the left kidney was gently exposed. In the I/R group 45-minute renal ischemia with 120-minute reperfusion period was monitored. In the RIPC groups a 3×10-minute protocol was applied using tourniquet around the right hind-limb 1 hour (RIPC-1) or 24 hours (RIPC-24) prior to the I/R. Blood samples were taken for testing blood gas, acid-base, metabolic and hemorheological parameters.
RESULTS:
Lactate and potassium concentration significantly increased in I/R that could be reduced by RIPC, especially in RIPC-24. Creatinine concentration increased further in RIPC groups. I/R and RIPC-1 decreased the pH, RIPC-24 increased. RIPC-24 reduced the drop in base excess. Erythrocyte deformability worsened by renal I/R. In RIPC groups deformability decreased additively. However, RIPC-1 could improve the condition. RIPC-24 showed the highest erythrocyte aggregation values during reperfusion.
CONCLUSIONS:
Renal I/R worsened metabolic and micro-rheological parameters that could be modulated by RIPC protocols. However, it could not be decided whether the early or the delayed protocol is better.
Keywords
Introduction
Ischemia-reperfusion (I/R) of the kidney – which organ is sensitive to I/R injury due to its vasculature and high metabolic rate– may result in acute kidney injury, in transplantation delayed graft function, elevated risk of acute rejection and chronic graft dysfunction. Renal I/R injury is a significant cause of mortality in nephrological patients [1–5].
Pathophysiology of ischemia-reperfusion is complex, which includes metabolic alterations, free-radical pathways, inflammatory processes, activation of innate and adaptive immune responses and cell death programs, and involvement of complement system, platelets and the coagulation cascade is also known, together with the developing microvascular dysfunction [6, 7]. Herein micro-rheological parameters also play important role [8–12]. There are numerous ways (pharmacological, physical, surgical preconditioning) to protect kidneys from I/R injury, but the optimal method is still unclear. Various ischemic preconditioning techniques are known, as pre-, per- and postconditioning, depending on the timing of the preconditioning maneuvers [13, 14]. The protocol can be applied on the organ to be protected against manifest I/R injury, or on other organs. Latter is called remote organ preconditioning. Remote ischemic preconditioning (RIPC) is a process that means intermitted short-term interruptions of the blood flow to an organ or extremity before another organ’s manifest ischemia-reperfusion. RIPC can be early and delayed type depending on the time between the preconditioning and the ischemia. However, the mechanism has not been fully elucidated yet [15–19], the clinical results are controversial and the optimal protocol has not been defined [20–23].
Micro-rheological parameters change sensibly in several pathophysiological processes, such as I/R injury. Worsened erythrocyte deformability and enhanced erythrocyte aggregation – due to free-radical reactions, metabolic alterations, inflammatory processes and mechanical trauma– can lead to microcirculatory deterioration [8–10, 25]. Therefore investigation of micro-rheological and microcirculatory parameters together with metabolic parameters can provide information about the I/R and preconditioning processes. In a previous experiment partial liver ischemia-reperfusion injury with early and delayed-effect RIPC protocols were investigated in a rat model [26, 27], showing evidence that these protocols can sustain the changes caused by the I/R.
We hypothesized that micro-rheological parameters can be informative to optimize various RIPC protocols, especially in comparison of the early and delayed RIPC in renal I/R model.
Materials and methods
Experimental protocol
Male Crl:WI rats (body weight: 301.6±38.6 g) were involved with ethical approval registered by the University of Debrecen Committee of Animal Welfare (registration Nr.: 25/2016/UDCAW) in accordance with national (The Hungarian Animal Protection Act, Law XVIII/1998) and European Union regulations (EU Directive 63/2010). The rats were kept in a conventional animal facility and received rat chow and water ad libitum.
For general anesthesia thiopental was used intraperitoneally 24 hours (40 mg/bwkg) and about 1.5 hours prior to the operation (60 mg/bwkg). Since the experimental protocol includes a group with preconditioning taken 24 hours before I/R, all the experimental groups were underwent to a short anesthesia a day before. Heating pad was used to maintain body temperature during the intraoperative monitored period. The experimental groups were the followings: sham-operated control group (Control, n = 7), ischemia-reperfusion group (I/R, n = 7), early remote organ ischemic preconditioning group (RIPC-1, n = 7) and delayed remote organ ischemic preconditioning group (RIPC-24, n = 6).
The operation was the same in all the groups until the exposure of the kidney. After preparation of the operating areas, the left femoral artery was cannulated (BD NeoflonTM, 26 G) from a 1 cm long incision under operating microscope (Leica Wild M650). Via median laparotomy the left kidney and its vessels were gently exposed with atraumatic preparation. In the Control group there were no other interventions, only monitoring and measurements were performed.
In the I/R group after the exposure of the left kidney an atraumatic microsurgical clip was applied on the renal vessels for 45 minutes, which was followed by a 120-minute reperfusion period.
In RIPC groups a tourniquet was applied around the right hind-limb just below the level of the inguinal ligament for 3×10 minutes with 10-minute intermittent reperfusion periods. This process was performed one hour (in RIPC-1 group) or 24 hours (in RIPC-24 group) prior to the intervention as written above in the I/R group.
From the cannulated right femoral artery blood samples (∼0.3–0.5 ml each) were taken after the median laparotomy (base), and in the 30th, 60th and 120th minutes of the reperfusion (R-30, R-60, R-120) into tubes containing K3-EDTA (1.5 mg/ml) as anticoagulant. Physiological saline solution was given in equal amount of the samplings. At the end of the experiment the animals were euthanized.
Laboratory measurements
An EPOC Blood Analysing System (Siemens Healthcare GmbH, Germany) was used to test blood gas, acid-base parameters, electrolytes and metabolites from about 200μl blood in the base samples and in the ones taken in the 120th minutes of the reperfusion. In this manuscript pH, pO2 [mmHg], pCO2 [mmHg], HCO3– [mmol/L], base excess (BE(ecf) [mmol/L]), saturation [% ], sodium (Na+ [mmol/L]), potassium (K+ [mmol/L]), calcium (Ca2+ [mmol/L]), chloride ion (Cl– [mmol/L]), lactate (mmol/L), creatinine [mg/dL] and glucose [mmol/L] concentrations are analyzed.
A LoRRca MaxSiS Osmoscan device (Mechatronics Bv, The Netherlands) was used for testing erythrocyte deformability. Measurements were performed at 37°C. By the protocol, 10μl blood sample and 2 ml isotonic polyvinylpyrrolidone (PVP) – phosphate buffered saline (PBS) solution (Sigma-Aldrich Co. USA; PVP-PBS solution viscosity = 33.6 mPas, osmolality ∼300 mOsmol/kg, pH = 7.3) was gently mixed and injected into the Couette-system of the device. Deformability was determined by the analysis of the laser diffraction pattern of the elongated red blood cells, expressing elongation index (EI) in the function of shear stress (SS [Pa], range: 0.3–30 Pa) [28]. For comparison of EI-SS curves, EI values at 3 Pa and data from Lineweaver-Burk parameterization were used, such as the maximal EI at infinitive SS (EImax), and the shear stress at half EImax (SS1/2 [Pa]), as well as their ratio (SS1/2/EImax) [29].
Erythrocyte osmotic gradient deformability (osmoscan) parameters were determined using 250μl of blood sample that was suspended to 5 ml PVP-PBS solution. The ektacytometry method is similar as written above, but in this case the SS is constant (e.g. 30 Pa), while osmolality (O [mOsm/kg]) of the suspending medium is changing gradually from 0 to 500 mOsm/kg. The EI-O curve provides well-defined parameters, such as the minimal elongation index values measured at low-osmotic environment (EI min), the maximal elongation index values (EI max, not equal to EImax above), the half EI max at high osmolality range (EI hyper), the belonging osmolality vales (O min and O (EI max) and O hyper, [mOsm/kg]) the area calculated from the individual elongation index-osmolality curves [30]. Additionally, further parameters were calculated describing the phase between EI min and EI max in the function of osmolality such as ΔEI (difference between EI min and EI max) ΔO (difference between O min and O (EI max)), and ΔEI/ΔO [31].
Red blood cell aggregation was measured with a Myrenne MA-1 erythrocyte aggregometer (Myrenne GmbH, Germany). The anticoagulated blood sample (20μl) was disaggregated with a shear rate of 600 s–1, and then the shear rate was reduced to 0 (M mode) or to 3 s–1 (M1 mode). At the 5th (M 5 s, M1 5 s) or the 10th (M 10 s, M1 10 s) second of the aggregation process aggregation indices were determined based on light-transmission. Higher index values mean enhanced erythrocyte aggregation [28].
Statistical analysis
Data are expressed as means±standard deviation (S.D.). For single pair-wise inter-group comparison Student t-test or Mann-Whitney rank sum tests, for multiple inter-group and intra-group comparison one-way and repeated measures ANOVA tests (Dunn’s, Bonferroni’s or Student-Newman-Keuls method) were applied, depending on the normality of data distribution. A value of p < 0.05 was considered as statistically significant.
Results
Blood gas and acid-base parameters, electrolytes and metabolites
Acid-base parameters are summarized in Table 1. The pH values were stable in the Control group, moderately decreased in the I/R group, and more markedly declined in the RIPC-1 group by the 120th minute of the reperfusion (p = 0.014), and increased in RIPC-24 group (p = 0.024). During the experiment pO2 values and the saturation were relatively stable. However, in the I/R and in the RIPC-1 groups it decreased, while in the RIPC-24 group an increase was observable. Herein the respiratory compensation was the most expressed, since the respiratory rate was about 120–140% higher compared to the base values. The base values of pCO2 was higher in the RIPC-24 group (p = 0.028 vs. Control, p = 0.014 vs. I/R). During the experiment it decreased in the Control (p = 0.004 vs. base), the I/R (p < 0.001 vs. base) and the RIPC-24 group (p < 0.001). Bicarbonate concentration decreased in all groups (Control: p = 0.003 vs. base, I/R: p < 0.001 vs. base, RIPC-1: p = 0.011 vs. base, RIPC-24: p < 0.001 vs. base). The decrease was smaller in the RIPC-24 group (p = 0.041 vs. Control, p = 0.014 vs. I/R, p = 0.019 vs. RIPC-1). The base excess turned to negative values by the largest magnitude in the I/R and the RIPC-1 groups (Table 1).
Changes in the blood gas and acid-base parameters
Changes in the blood gas and acid-base parameters
means±S.D.; *p < 0.05 vs. base, #p < 0.05 vs. Control, +p < 0.05 vs. I/R, §p < 0.05 vs. RIPC-1.
Compared to their base, the relative values of electrolytes tested in the samples taken in the 120th minute of the reperfusion are shown in Fig. 1 as R-120/base data.
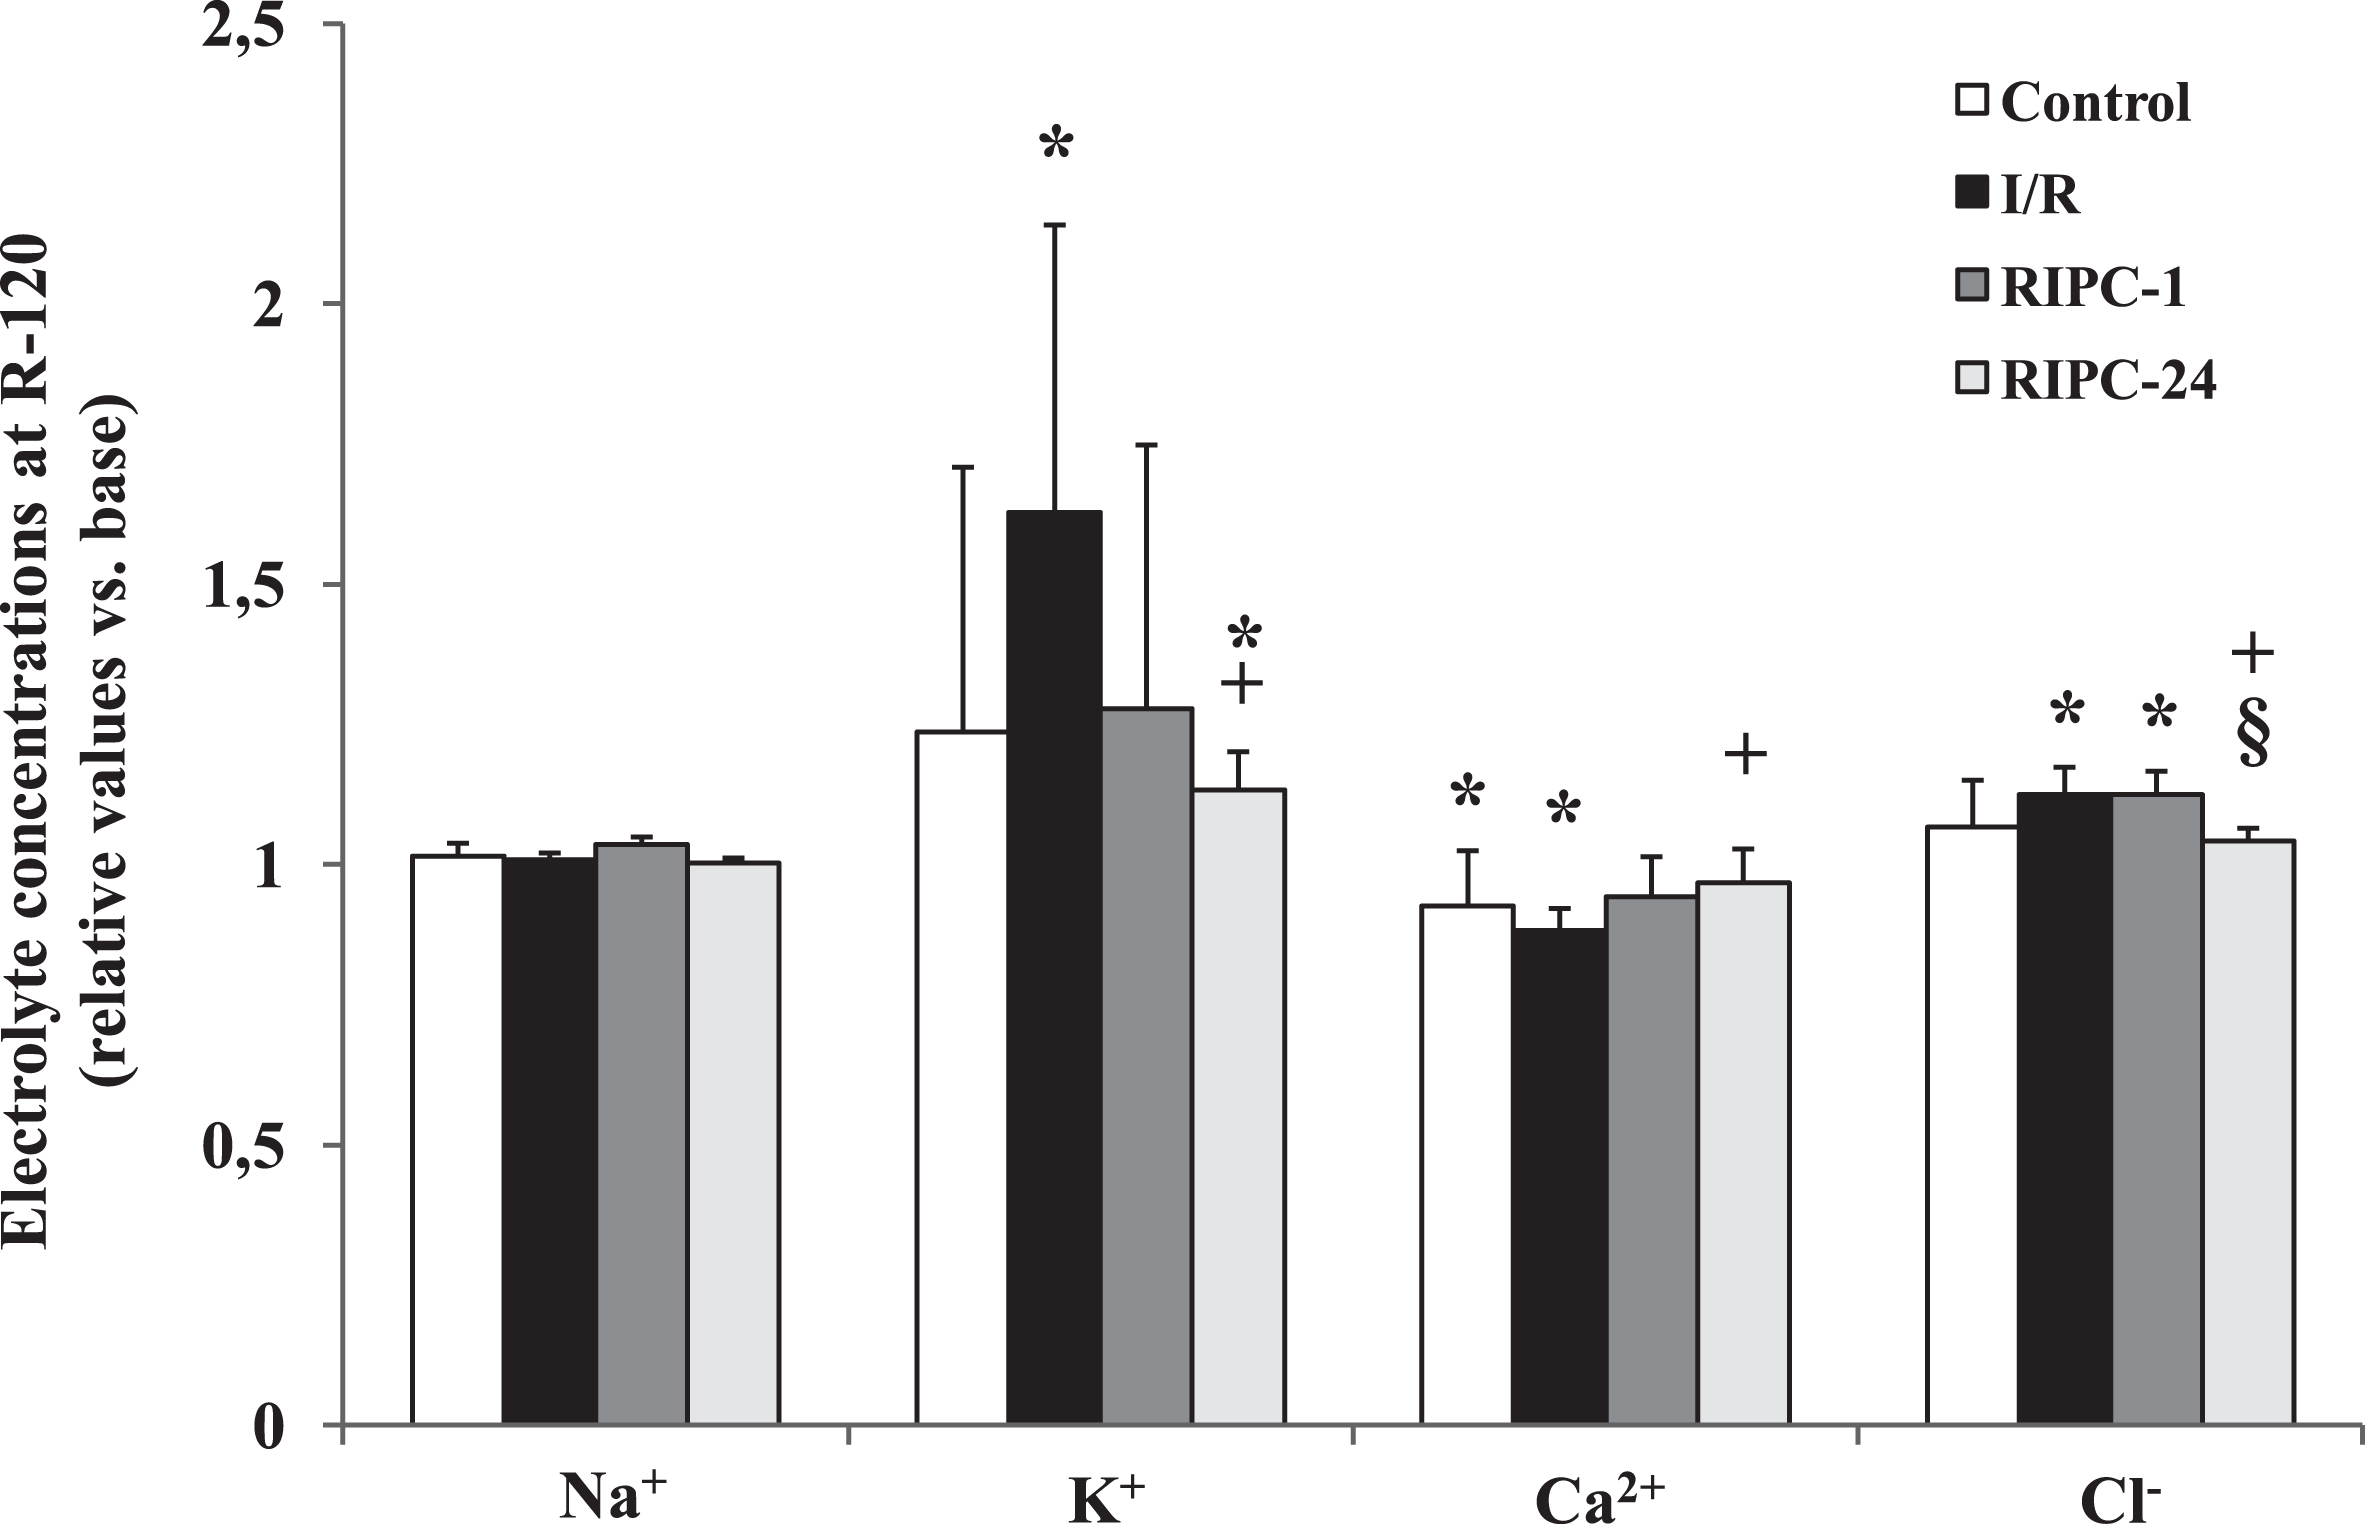
Changes in electrolyte concentrations (Na+, K+, Ca2+, Cl–) by the 120th minutes of the reperfusion expressed as relative values versus base (R-120/base). Means±S.D.; *p < 0.05 vs. base, +p < 0.05 vs. I/R, §p < 0.05 vs. RIPC-1.
Sodium ion concentration remained constant, without any significant intra- or inter-group differences. A marked increase in potassium ion concentration was observed in all groups, most obviously in the I/R group (p < 0.001 vs. base). In RIPC groups the increase was smaller: in the RIPC-24 just a mild increase was observed (p = 0.008), being significantly smaller than of the I/R group (p = 0.03). Calcium ion concentration slightly decreased in all groups compared to the base values, showing the lowest values in the I/R group (p < 0.001). Compared to the I/R group the decrease was moderate in the RIPC groups (I/R vs. RIPC-24: p = 0.015). Significant increase in chloride concentration was observed in the I/R (p < 0.001 vs. base) and in the RIPC-1 group (p < 0.001 vs. base), that was not seen in the RIPC-24 group (p = 0.005 vs. I/R, p = 0.007 vs. RIPC-1).
Figure 2 shows the relative values of metabolites as R-120/base data. Lactate concentration markedly and significantly increased in the I/R group (p < 0.001 vs. base, p = 0.011 vs. Control) and in the RIPC-1 group (p = 0.013 vs. base, p = 0.03 vs. Control), and moderately in the RIPC-24 group (p = 0.008 vs. base, p = 0.01 vs. Control). Creatinine concentration significantly rose compared to the base values in all the groups with renal I/R (I/R: p = 0.008, RIPC-1: p = 0.021, RIPC-24: p = 0.014). Glucose concentration slightly decreased except for the RIPC-24 group, where an elevation was seen (p = 0.016 vs. base) (Fig. 2).
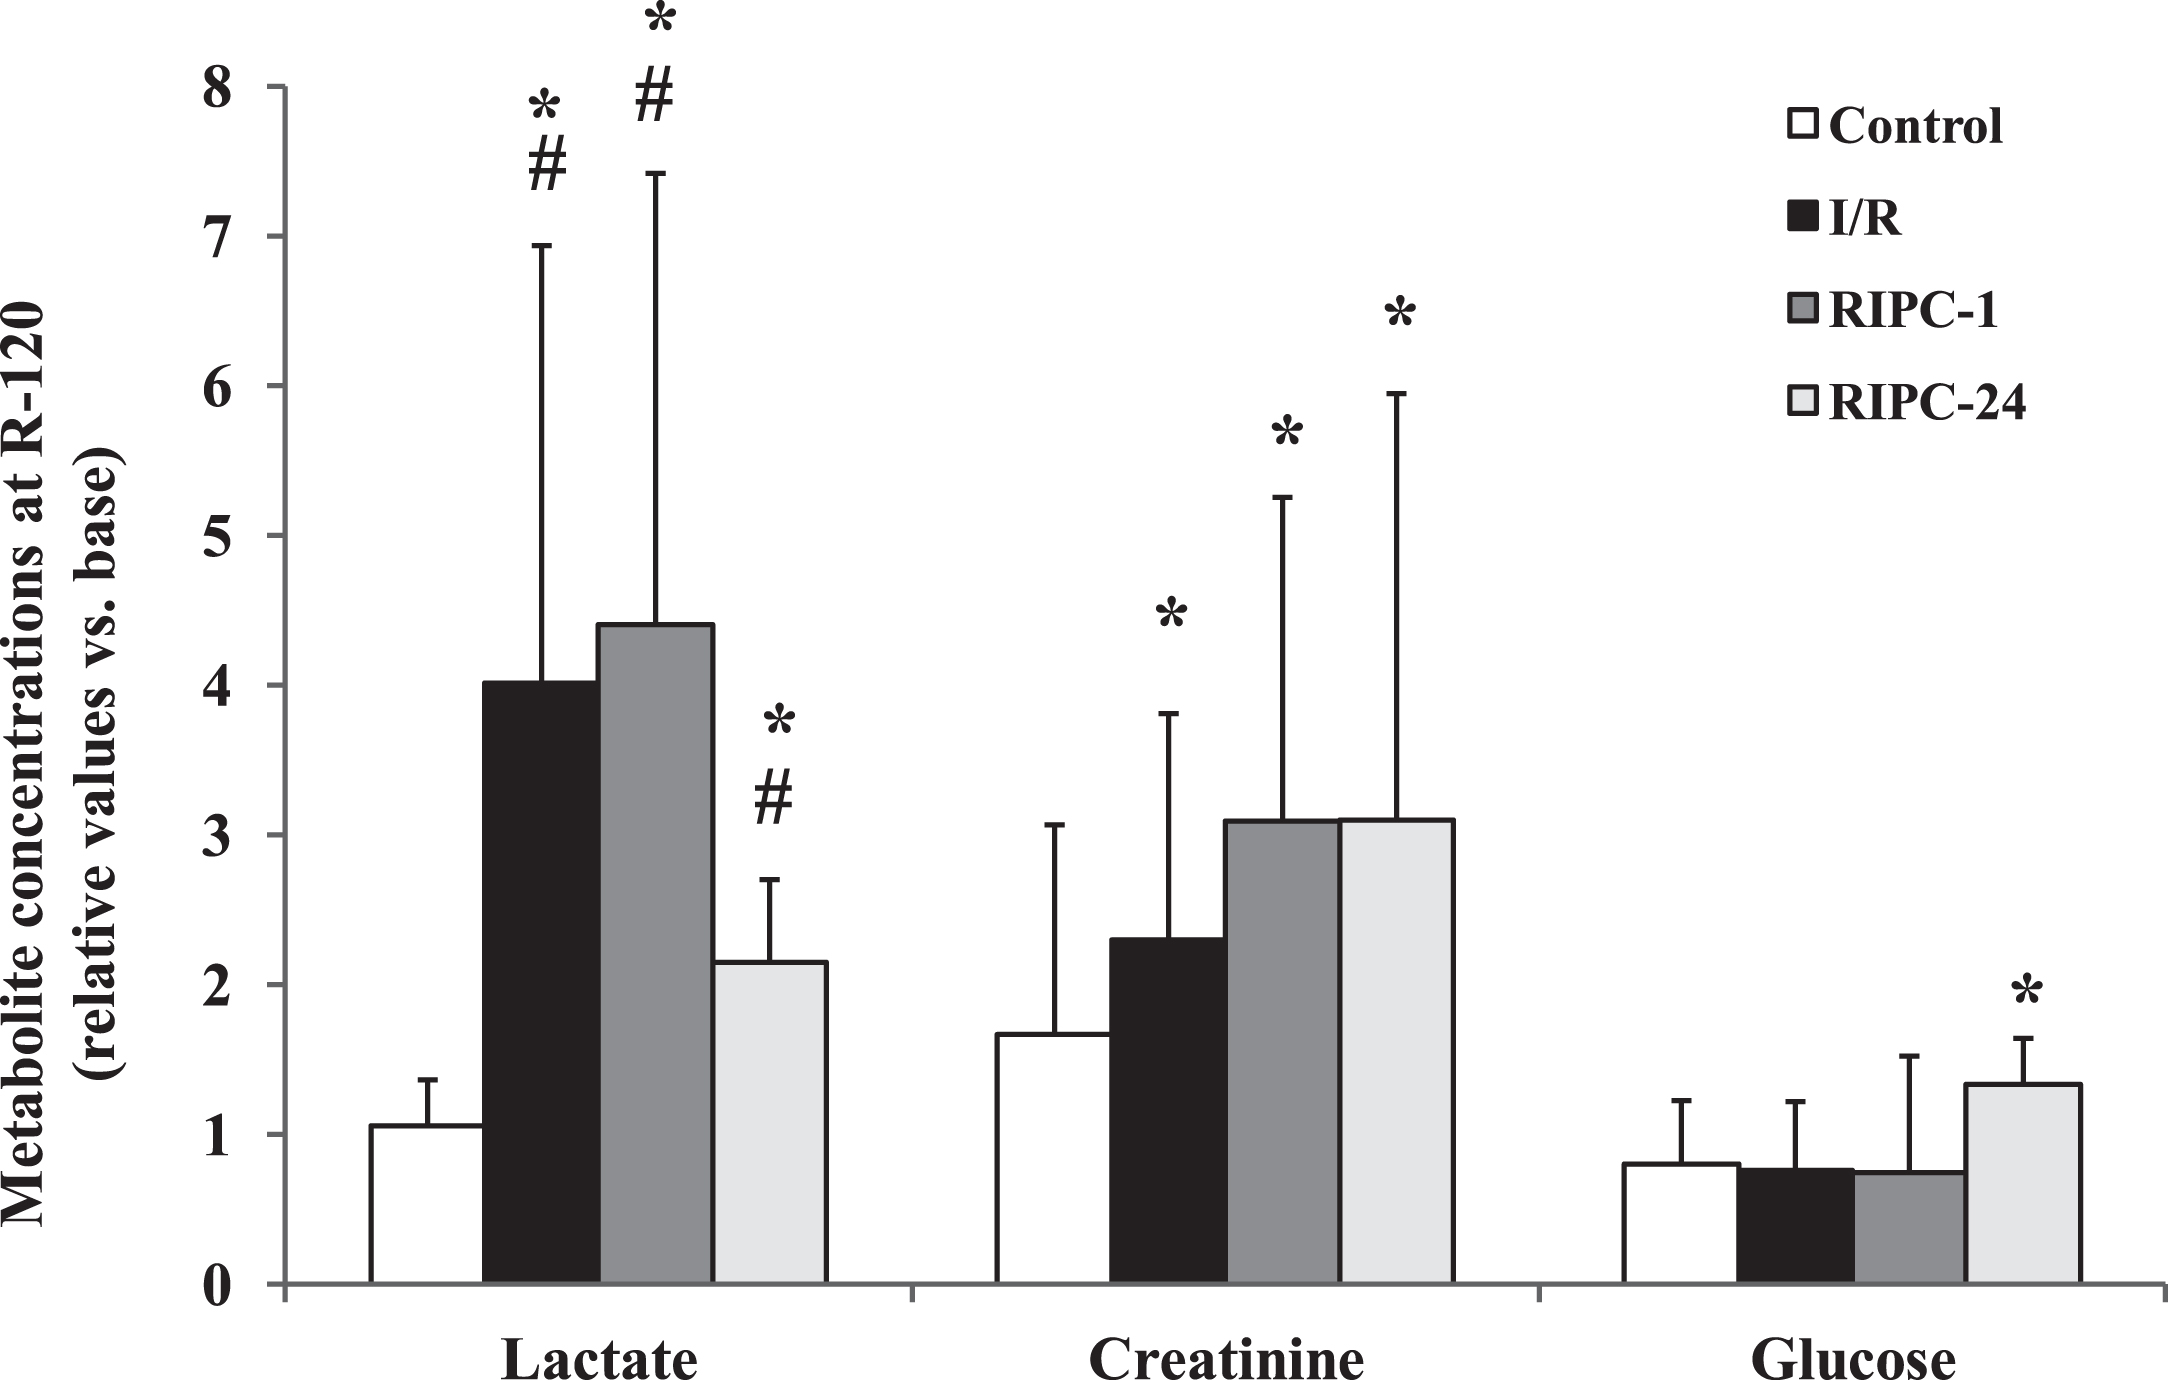
Changes in lactate, creatinine and glucose concentrations by the 120th minutes of the reperfusion expressed as relative values versus base (R-120/base). *p < 0.05 vs. base, #p < 0.05 vs. Control.
Elongation index values measured at shear stress of 3 Pa and the ratio of SS1/2 and EImax values are presented in Fig. 3. EI at 3 Pa showed certain base differences. In RIPC-1 groups the values were significantly lower compared to the Control groups (p = 0.002). Values of RIPC-1 group were relatively stable, even showing a slight increase (at R-120 p = 0.013 vs. base). During the investigative period a declination in RIPC-24 group was observed. The decreasing was significant by the 60th minute of the reperfusion compared to the Control group (p = 0.043), and by the 120th minute compared both to the Control (p = 0.001) and the RIPC-24 groups (p = 0.015) (Fig. 3A).
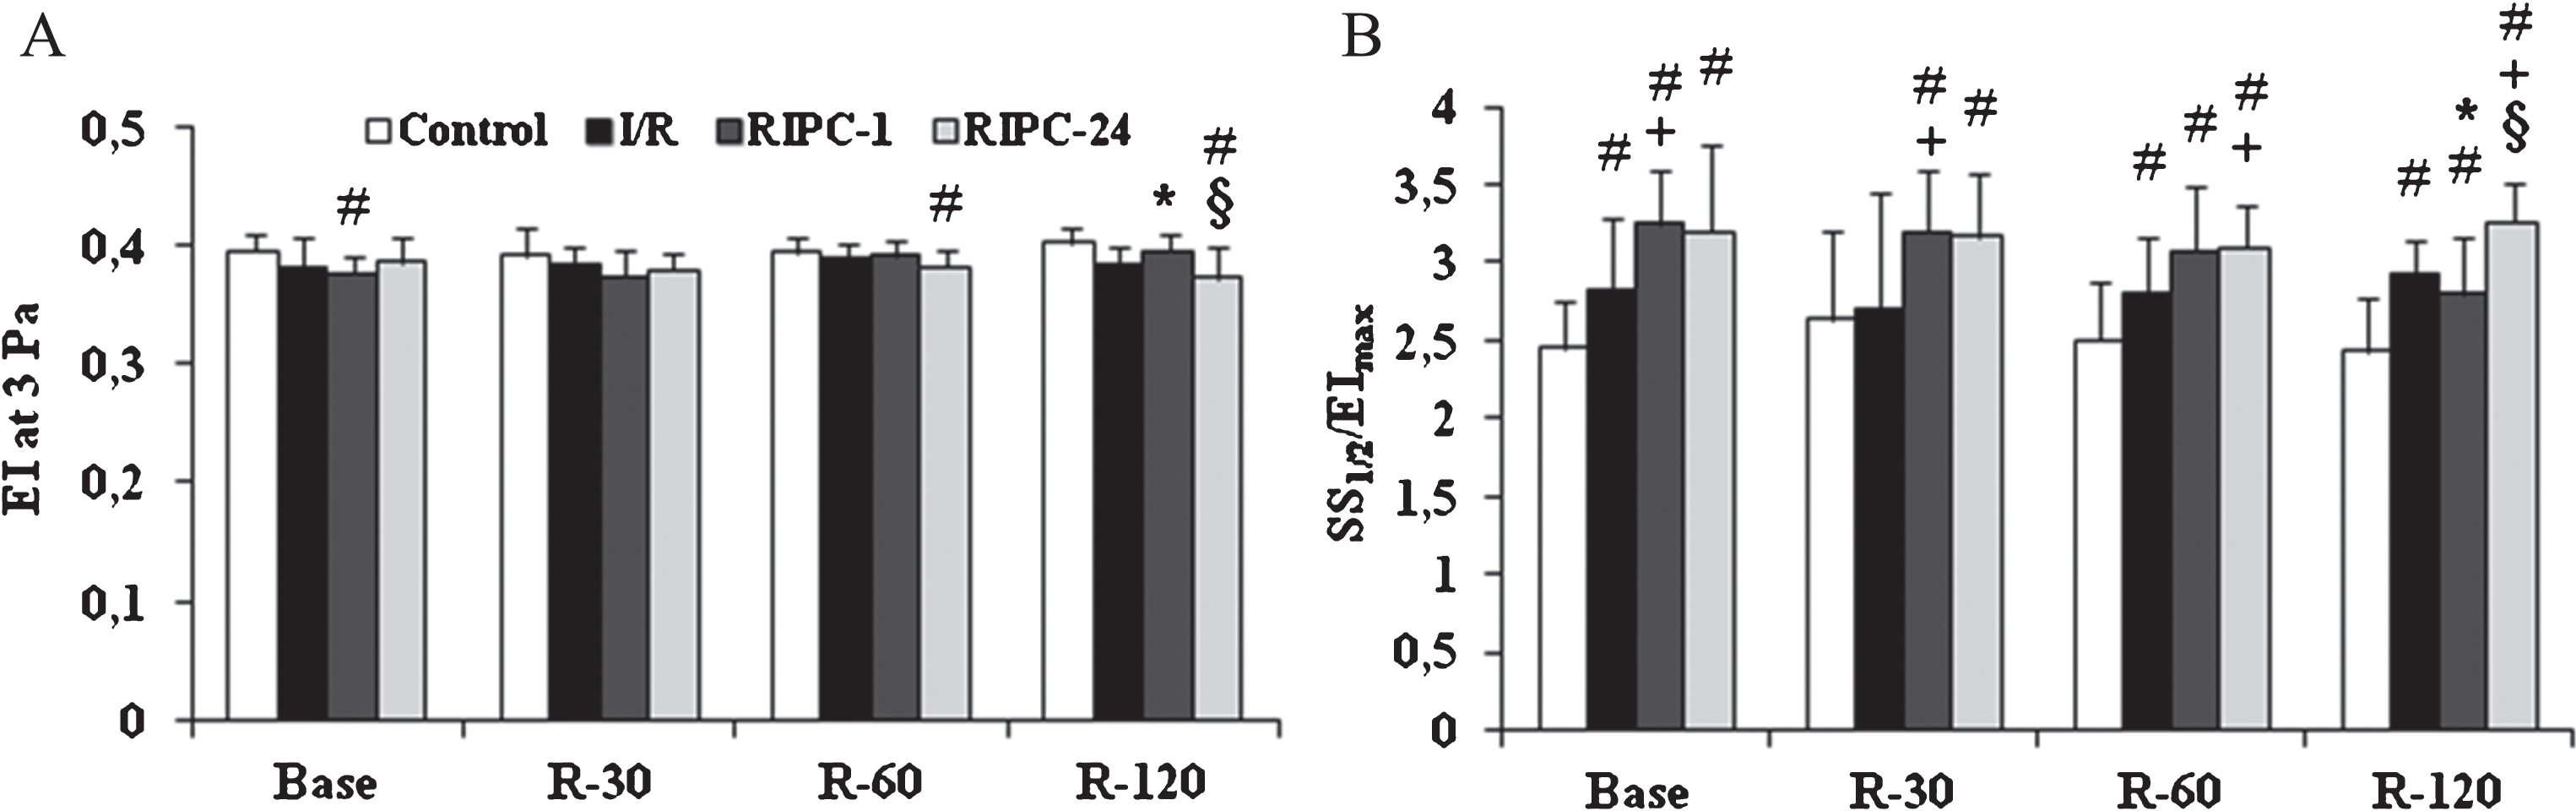
Alterations in red blood cell deformability. A: elongation index (EI) values at 3 Pa, B: ratio of maximal elongation index (EImax) and the shear stress at half EImax (SS1/2), derived from the Lineweaver-Burk parameterization of EI-SS curves. Means±S.D. *p < 0.05, #p < 0.05 vs. Control, +p < 0.05 vs. I/R, §p < 0.05 vs. RIPC-1.
When the SS1/2/EImax data were analyzed, the differences were much more obvious. At the beginning of the investigative period the values of the preconditioned groups were significantly higher compared to the Control group (RIPC-1: p < 0.001, RIPC-24: p < 0.001), and in case of RIPC-1 versus the I/R group as well (p = 0.014). In the I/R group values elevated (showing worsening red blood cell deformability), reaching the significance level by the 60th minute of the reperfusion (p = 0.041 vs. Control). RIPC-1 and RIPC-24 groups expressed elevated values over the first 2 hours of the reperfusion. By the 120th minute the highest values were found in the RIPC-24 group (p < 0.001 vs. base, p = 0.001 vs. I/R and p = 0.002 vs. RIPC-1) (Fig. 3B).
Osmotic gradient ektacytometry (osmoscan) classic parameters are shown in Table 2. In general, there were no important alterations when the values at the 120th minute of the reperfusion were compared to their base. However, in O (EI max), O hyper and Area values significant base differences were found in the RIPC-24 group versus Control. These differences remained and deepened by the 120th minute of the reperfusion, when the Area values were the smallest in the RIPC-24 group, being also significant to all the other groups (p = 0.004 vs. Control, p = 0.026 vs. I/R, p = 0.017 vs. RIPC-1).
Osmotic gradient ektacytometry (osmoscan) parameters
means±S.D.; #p < 0.05 vs. Control, +p < 0.05 vs. I/R, §p < 0.05 vs. RIPC-1.
The difference between the O (EI max) and O min were also significantly smaller in the RIPC-24 group (at R-120 p = 0.019 vs. I/R). The difference between the EI max and EI min slightly decreased in the I/R group by the 120th minute of the reperfusion, however, without significant difference.
Changes of aggregation index values (M 5 s, M 10 s, M1 5 s, M1 10 s) are shown in Fig. 4. Using the M 5 s mode the lowest values were measured in the RIPC-24 group at the base measurement (p = 0.008 vs. Control). During the reperfusion this group had the highest values (at R-30: p < 0.001 vs. base, p = 0.004 vs. I/R, p = 0.003 vs. RIPC-1; at R-60: p < 0.001 vs. base, p = 0.03 vs. Control; and at R-120: p < 0.001 vs. base, p = 0.0027 vs. Control, p < 0.001 vs. RIPC-1) (Fig. 4A).
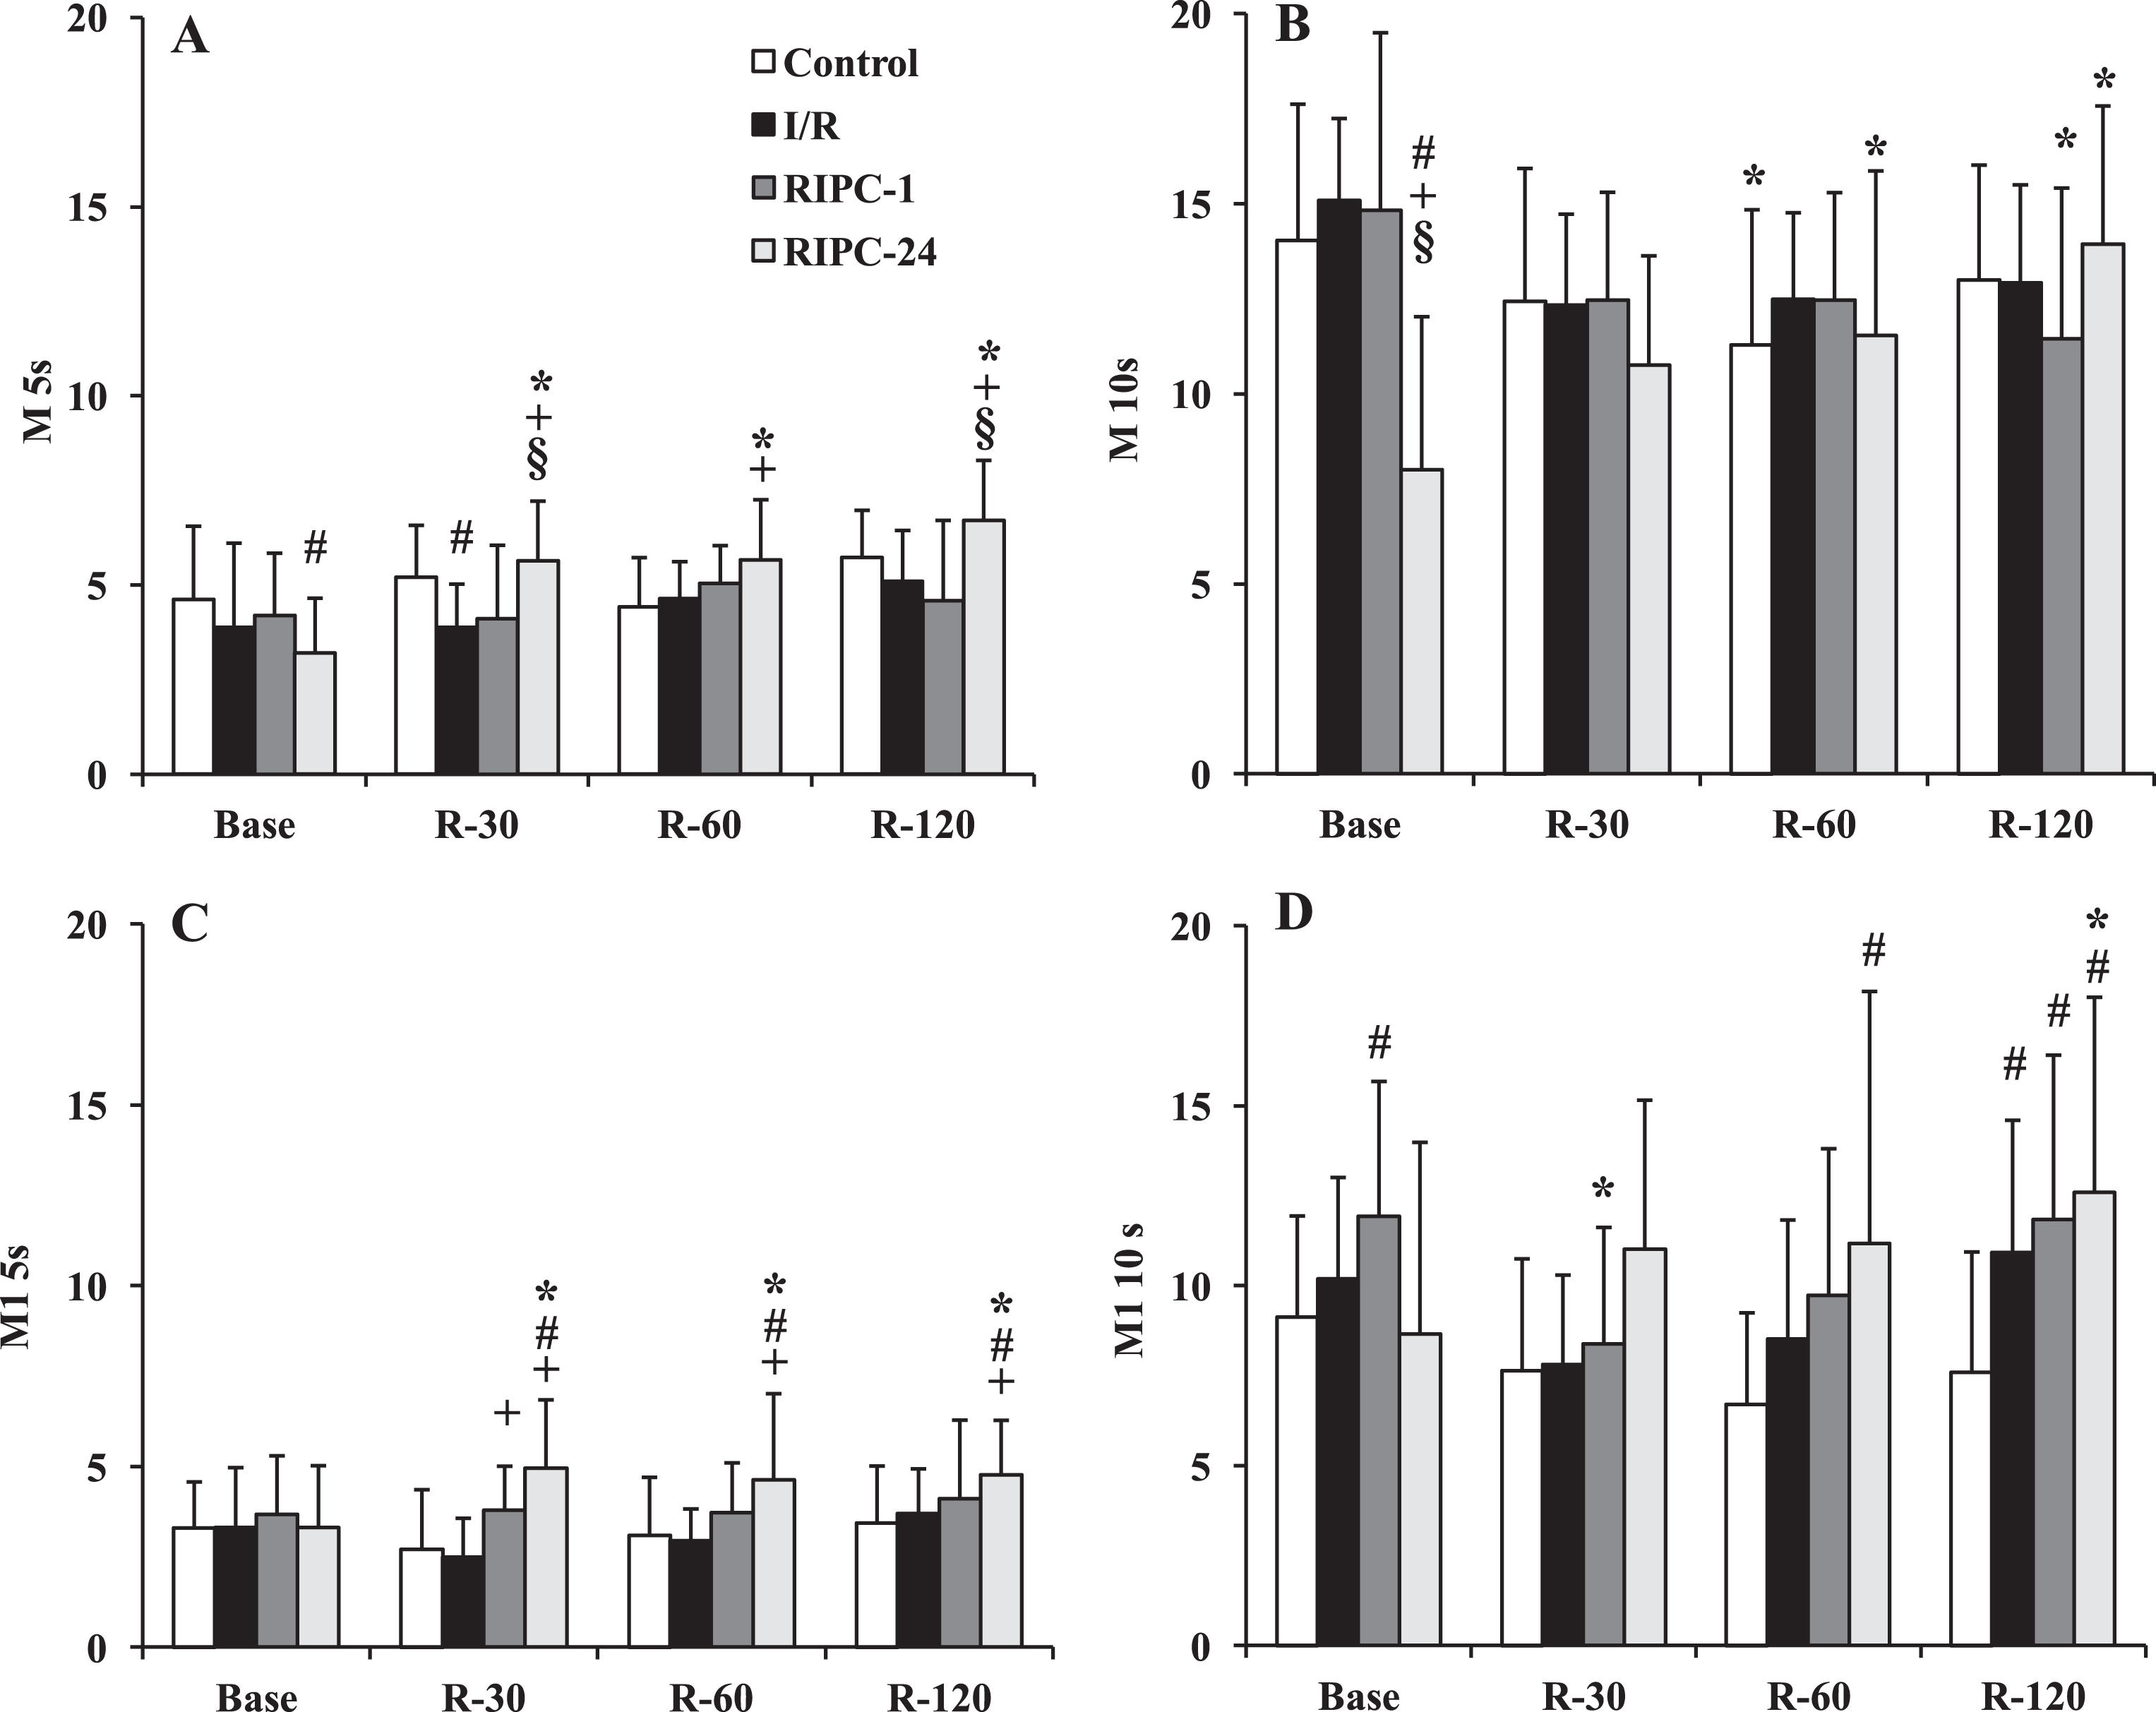
Alterations in red blood cell aggregation indices M 5 s (A), M 10 s (B), M1 5 s (C) and M1 10 s (D). Means±S.D. *p < 0.05, #p < 0.05 vs. Control, +p < 0.05 vs. I/R, §p < 0.05 vs. RIPC-1.
M 10 s index values were also the lowest in the RIPC-24 group at the base measurements (p < 0.001 vs. Control, vs. I/R and vs. RIPC-1), and increased significantly during the reperfusion (at R-60: p = 0.004 vs. base; at R-120: p < 0.001 vs. base; p = 0.013 vs. R-30) (Fig. 4B).
The highest M1 5 s values were measured in the RIPC-24 group during the reperfusion (at R-30: p = 0.0018 vs. base, p < 0.001 vs. Control and I/R; at R-60: p = 0.0018 vs. base, p = 0.0022 vs. Control, p = 0.0007 vs. I/R; at R-60: p = 0.008 vs. base, p = 0.0022 vs. Control, p = 0.0007 vs. I/R; and at R-120: p = 0.0008 vs. base, p = 0.015 vs. Control, p = 0.046 vs. I/R). (Fig. 4C).
Using M1 10 s mode the highest AI was measured in the RIPC-24 group (at R-60: p = 0.0024 vs. Control; at R-120 p = 0.0003 vs. base, p = 0.0073 vs. Control). There was a significant increase in the I/R group as well at R-120 (p = 0.027 vs. Control, p = 0.042 vs. R-30) (Fig. 4D).
Ischemic injury may occur when cessation of blood supply to tissues/organs occur (e.g., during surgery, transplantation, trauma, thrombosis). Hypoxia causes damage and during reperfusion when the oxygen enters, by free-radical reactions and initiating inflammatory processes further injury appears. However, the complex pathomechanism of ischemia-reperfusion injury still provides numerous questions to be answered [4, 13]. Several diseases lead to end-stage kidney failure when the only curative intervention is the organ transplantation. Therefore the graft rejection and chronic graft dysfunction are still significant problems to be solved. And one aspect of damages that occur during transplantation is the ischemia-reperfusion injury [2, 14].
Reducing I/R injury various ischemic preconditioning methods are known and one of them is the remote ischemic preconditioning technique. Numerous studies have demonstrated that RIPC has beneficial effect on ischemic-reperfusion injury in various organs [15, 26], however, clinical results are controversial [21, 23]. The optimal timing and duration of short ischemic periods, extension and types of the tissues/organs, metabolic conditions, vasculature, co-morbidities, are just few factors that influence the optimization of the protocol.
The general mechanism of RIPC includes effector – mediator – cell-signaling – protection sequence. The effector is the maneuver of short 5–10-minute ischemic cycles (3–4) performed dominantly on a limb (upper or lower, but can be another organ as well). It is followed by systemic release of circulating conditioning substances as mediators that modulate cell-signaling and so resulting in closure of mitochondrial permeability transition pores (MPTP) and leading to protection against the manifest I/R [32]. The mechanism includes humoral and neural pathways (exosomes, autacoids – adenosin, bradykinin, CGRP, endocannabinoids, opoids, SDF-1α), in which iNOS activation, ROS, PKC-ɛ, modulation of mKATP, sKATP channels, antioxidant enzymes and the autonomic nervous system are also involved [16, 33]. Delayed remote ischemic preconditioning means when the protocol is applied usually more than 12 hours before the I/R insults. Studies used various timings as delayed duration, such as 12, 24, 48 or 72 hours [16].
In our study, we used 45-minute left unilateral renal ischemia to perform I/R, which was followed by a 120-minute reperfusion. As a possible protecting intervention, remote ischemic preconditioning was applied 1 hour or 24 hours prior to the manifest ischemia. Main observations were: (1) Lactate and potassium concentration significantly increased in I/R that could be reduced by RIPC, especially in RIPC-24. Creatinine concentration increased further in RIPC groups. (2) I/R and RIPC-1 decreased the pH, while RIPC-24 increased. RIPC-24 reduced the drop in base excess. (3) Erythrocyte deformability worsened by renal I/R. In RIPC groups deformability decreased additively. However, RIPC-1 could improve the condition. RIPC-24 showed the highest erythrocyte aggregation values during reperfusion.
As shown in pH results, metabolic alterations were more or less compensated. The respiratory compensation was the most expressed in RIPC-24 groups, where the respiratory rate was higher, and the BE drop was much smaller compared to the I/R or RIPC-1 groups, and the pH was not decreased but increased (within the physiological range). Besides alteration in the oxygenation and energy depletion of cells, changes in acid-base conditions, pH, elevation of lactate concentration, all may lead to morphological changes of the cells and altered (worsened) red blood cell deformability and aggregation [8, 35]. The free-radical reactions and inflammatory processes result in another wave of micro-rheological impairment [8, 10].
Important to note that in RIPC-1 and RIPC-24 groups the base values presented the state after the preconditioning protocols. Short ischemic periods can cause alterations in microcirculatory and hemorheological parameters [24]. The limb ischemia alone is known to modulate hemorheological variables [24, 36]. The animals were anesthetized a day before the manifest I/R. The anesthesia itself, the immobilization (even only for 1-2 hours), the used preconditioning protocol all triggered acute phase reactions. Acute phase reactions may result in worsened red blood cell deformability and enhanced aggregation [8, 10]. This might be the reason why red blood cell deformability and aggregation showed differences at the base measurements and behaved differently during the reperfusion in the RIPC-24 group compared to the other groups (Figs. 3, 4).
The monitored period (120 minutes of reperfusion) was short to bring a strong conclusion. Because of the limited amount of blood taking, the follow-up period could not be elongated, which would have helped us to get a better comparison of the two RIPC protocols. Influencing factors include the effect of the anesthetic drug, the thiopental on circulatory parameters [37]. Compared to clinical scenarios in animal models there is a lack of co-morbidities and medication use, and experiment-specific conditions as well as inter-species variability (especially in collateral vasculature and tissue ischemic tolerance) cannot be neglected [10, 33]. Therefore, further well-planned studies investigating longer-term outcomes and more specific parameters are necessary to clarify and optimize RIPC against renal I/R.
Conclusion
Renal I/R injury caused significant deterioration in micro-rheological and certain blood metabolic parameters and electrolytes. These changes could be modulated by remote organ ischemic preconditioning protocols. However, it is still controversial and could not be decided yet whether the early or the delayed preconditioning protocol is better. Detailed histological studies and further comparative studies may reveal better this question.
Footnotes
Acknowledgments
The authors are grateful for the technical staff of the Department of Operative Techniques and Surgical Research, the Faculty of Medicine, the University of Debrecen. The study was partially supported by the ÚNKP-17-3 and ÚNKP-17-2 New National Excellence Program of The Ministry of Human Capacities, and the Bridging Fund of the Faculty of Medicine, University of Debrecen, Hungary.
The authors comply with the Ethical Guidelines for Publication in Clinical Hemorheology and Microcirculation as published on the IOS Press website and in Volume 63, 2016, pp. 1–2. of this journal.