
Abstract
Keywords
 Dr. Michael Hagemann is a seasoned top management executive with over two decades of leadership experience and has been responsible for Change Management and Transformation for the past 25 years in different contexts. With academic credentials including a Theological degree and an MBA from the esteemed University of Mannheim/ESSEC, Paris, Michael has further distinguished himself by completing a PhD on Eclectic Leadership.
His scholarly pursuits extend to encompassing areas such as Change and Transformation, Leadership, Learning and Development, Neuropsychology, and Positive Psychology, demonstrating his commitment to advancing knowledge and practice in these domains.
 Sascha Cechlovsky is a seasoned Change Management professional with over 15 years of experience in change, transformation and organizational culture. Starting his career in the banking sector, Sascha holds a Diploma in Banking & Finance and a Master’s in Leading Innovation & Change from York St. John University. His expertise lies in driving strategic change initiatives that foster operational efficiency, innovation and cultural development in the logistics industry. With his international extensive experience from project assignments in over 50 countries, Sascha has made significant contributions to this field. His research interests lie at the intersection of change management, business transformation, and organizational culture.
1 Introduction
More than half a century has elapsed since the publication of Elisabeth Kübler-Ross’s seminal work, ‘On Death and Dying’ [1] which delineated the process of dying into five stages of grief: denial, anger, bargaining, depression, and acceptance. This conceptual framework, often referred to as the change curve, has garnered widespread recognition over the years and has been applied to various contexts involving transitions from the familiar to the unfamiliar, commonly manifesting in the realm of change management. Notably, the change curve has been incorporated into seminal literature on change management, exemplified by works such as ‘Making Sense of Change Management’ [2] and Three Success Factors for Transforming Your Business [3].
Generally, one might ask why the change curve, or more broadly, why change management is important for organizations. Studies indicate that between 60 and 90% of change projects still fail to achieve their objectives [4]. The primary reasons for these failures are often attributed to the reluctance of those affected to change. The change curve illustrates the emotional response of individuals to change. If this response is not well-managed, the adaptation process takes significantly longer and often results in the failure of the change initiative. Conversely, if the curve is effectively managed, meaning that affected individuals are guided more quickly towards acceptance, the change is more likely to succeed and yield better outcomes.
From a psychological perspective, the emotional response to change is underpinned by the concept of homeostasis [5]. Throughout their lives, individuals endeavor to maintain internal equilibrium between cognitive and affective states. Disruptions to this equilibrium prompt the activation of coping mechanisms, which individuals develop and acquire to varying extents. Changes that inadvertently disturb this equilibrium (homeostasis) from external sources are perceived as threats and necessitate restoration to balance. Arguably, the most profound experience of loss for humans is the loss of life, whether one’s own or that of close associates. Consequently, additional layers of loss emerge, exhibiting considerable variability in terms of severity, breadth, and individual coping strategies (preexisting or acquired). ‘Change,’ viewed as a loss experience, thus represents the psychological domain of change management.
The delineation of the stages in this experience of loss has been graphically represented through the change curve. Despite the widespread adoption of the change curve, the scientific literature that critically evaluates and substantiates the curve through independent studies remains limited. Fundamental inquiries arise, including: Is the change curve truly grounded in empirical evidence and reflective of a linear progression in the dying process, or is it more accurately conceptualized as a depiction of psychological states? Do the distinct stages exhibit universal consistency in terms of sequence, intensity, and duration, as well as across diverse individuals undergoing them? Can the change curve be universally applied to other forms of loss experiences? Is the applicability of the change curve transferrable to change initiatives within organizational contexts? Does the conceptualization of the change curve offer sufficient guidance for managing the curve or facilitating individuals through change?
Comprehensive responses to these inquiries have yet to be systematically provided, necessitating further research to deepen our understanding of the implications of the change curve. However, this study undertakes a focused examination of one specific aspect that remains relatively underexplored— namely, an investigation into how the practical application of a specific model of the change curve, comprising four phases, materializes.
This article serves a dual purpose: firstly, through a rigorous critical analysis of existing literature, it elucidates the change curve as a theoretical construct derived from empirically grounded practical applications. It underscores that the adapted iteration of the change curve effectively encapsulates the components experienced by individuals impacted by change or facilitates their navigation through the curve. Subsequently, the article presents three case studies to exemplify the practical implementation of the change curve model. Finally, the article offers insights into the further research necessary to either validate or challenge the change curve model.
2 Literature review
The genesis of the change curve can be traced back to the pioneering studies of Elisabeth Kübler-Ross, who delineated the trajectory of grief based on five distinct stages [1]. The primary descriptions of these five stages, as expounded by Kübler-Ross E & Kessler D [6] are as follows: 1. Denial: This initial stage is characterized by a sense of shock, leading to the denial of reality. Individuals in this phase often struggle to accept the full scope of the situation, allowing only a limited amount of information to be processed. 2. Anger: Following the phase of denial, individuals typically experience a surge of anger, representing a powerful emotion that is both felt and expressed. This anger may be directed towards individuals or events perceived to be responsible for the loss. 3. Bargaining: In this phase, individuals engage in a process of negotiation, often characterized by expressions such as ‘If only.’ They may contemplate hypothetical scenarios wherein the outcome could have been different, expressing a desire to undo or alter the circumstances leading to the loss. 4. Depression: Described as a period of ‘empty feelings,’ this phase marks the acknowledgment of the irreversibility of the loss. Individuals grapple with profound sadness and despair as they come to terms with the reality of their situation. 5. Acceptance: Contrary to popular belief, acceptance in this context does not imply a state of contentment or approval. Rather, it denotes the acknowledgment and integration of the loss experience into one’s reality. It involves accepting the reality of the situation without necessarily embracing it wholeheartedly, but rather learning to live with it and adapt to the new normalcy.
Kübler-Ross E & Kessler D [6] provide explicit clarification that the stages outlined in their model exhibit variability in duration and are not strictly linear in progression. They assert, ‘The stages are responses to feelings that can last for minutes or hours as we flip in and out of one and then another. We do not enter and leave each individual stage in a linear fashion. We may feel one, then another and back again to the first one.’
Similarly, descriptions by Mosadeghrad AM & Ansarian M. [7], further substantiated by Baldwin BA [8] emanate from a medical standpoint and delineate four stages in crisis management: shock, defensive retreat, acknowledgment, and adaptation and change. The initial shock phase depicts an encounter wherein established coping mechanisms prove inadequate. The subsequent defensive retreat phase portrays a profound resistance characterized by a protective barrier against reality. The acknowledgment phase signifies the recognition of the event and its emotional profundity. Lastly, the adaptation and change phase foreshadows a future-oriented perspective, exploring potential resolutions. Analogous to Kübler-Ross’s model, these phases do not inherently follow a linear progression and may exhibit considerable variation in duration.
The depiction of the five stages in the Bible, spanning both the Old Testament in Isaiah 6 and the New Testament in Luke (Lk 3 : 21), is primarily anecdotal in nature; nonetheless, it warrants acknowledgment [9].
A six-stage model is proposed as well [10], albeit based on a relatively limited dataset of 15 interviewees. These six stages encompass denial and anger grouped together as one stage, bargaining, depression, revising, deserting, and acceptance. It is noteworthy that the sequence of the initial four stages is depicted as non-linear, whereas deserting and acceptance consistently mark the culmination of the emotional journey.
The conceptualization of the change curve can be attributed to Menninger WW [11]. Subsequent contributions [12] build upon Menninger’s framework, delineating seven stages: Immobilization; Minimization; Depression, Acceptance, Testing; Search for meaning, Internalization. Notably, it is also delineated a seven-stage model [13].
In the 1990s, the adoption of the change curve, initially rooted in the psycho-medical domain, increasingly permeated into the realm of business, as evidenced by works such as those by Grensing L [14] and Perlman D & Takacs GJ [15], the latter even delineating 10 stages. Mariotti J [16] outlines 8 distinct responses to change. Bupp N [17] employs a 10-element change curve model. This burgeoning interest in change management has led to alterations in the change curve itself [18]. Elrod PD [19] contributes to this discourse by empirically measuring and validating the change curve, paving the way for David Wilkinson to debunk the notion of the change curve as a myth, asserting: ‘The myth of the change curve is itself a myth. The change curve, on the basis of the research evidence, does exist and is a real phenomenon.’ [20].
In addition to these individual studies, two meta-analyses conducted by Corr CA [21] and Corr CA [22] delve into the adoption and reception of the change curve in American and international textbooks respectively. It is worth noting that nearly all of these studies affirm the model, albeit with certain reservations and criticisms, particularly pertaining to its universality and validity. Furthermore, it is reiterated that the change curve should not be misconstrued as a linear progression, implying a straightforward movement of individuals from one stage to another.
In sum, the synthesis of the pertinent literature yields the following observations: 1. Originating from a foundation rooted in psychological and medical paradigms, an evolutionary trajectory emerged, expanding and transposing the initial conceptualization of loss experiences within the context of death to encompass broader realms of loss. 2. Discrepancies in the detailed description of the various phases and the curve itself are evident across the literature. 3. Empirical examinations investigating the correspondence between the phases delineated and the actual experiences of loss in the context of change are notably scarce. 4. Despite nuanced differences, commonalities emerge within the phases: the initial phase of denial invariably precedes a subsequent descent into deeper psychological distress, followed by a gradual progression towards acceptance of the new reality. 5. The duration, sequencing, and qualitative impact of the phases exhibit considerable variability and are contingent upon diverse factors such as individual experiences with change, personal coping strategies, the depth of the impact, resilience levels, and the availability of support during periods of change. 6. The widespread acceptance of the change curve as a theoretical framework suggests its veracity. A meta-analysis conducted by Elrod, P. D., & Tippett, D. D. [23] underscores this certainty, revealing consistent presentation of the elements comprising the change curve in 13 out of 15 studies examined.
3 Research methodology
Yin [24] advocates that the case study method provides an opportunity to study a phenomenon within its natural context. As a result, this research adopted a multiple case study approach to provide a comprehensive understanding of the change curve phases. The three cases were selected based on their unique contexts and relevance to the change curve. All cases deal with the implications from an IT related implementation program in different levels of complexity and size.
The analysis employed a mixed-methods approach, combining both qualitative and quantitative methods, to provide a comprehensive analysis of the research problem. The mixed-methods approach was chosen due to its ability to provide a more complete understanding than either quantitative or qualitative research alone while recognizing the limitations of both at the same time [25]. The analysis is inductive and interpretative, focusing on exploring and understanding the complexity and uniqueness of the cases within their contexts [26] and to derive strategies and interventions to actively manage the journey through the phases of the change curve.
Data collection of this exploratory research was conducted utilizing a multi-faceted approach that included online surveys, semi-structured interviews, on-site observations through Gemba Walks, along with personal interactions during various meetings and workshops. The data from the 3 cases thereby follows the ‘triangulation’ in data collection by Robert E. Stake [27]. The survey gathered responses from over 500 participants across all cases, with a minimum of 100 contributors per case, invited on a voluntary basis and selected using stratified random sampling to ensure representation from all impacted stakeholder groups within the organization. Additionally, in-depth, semi-structured interviews were conducted with 94 participants chosen through purposive sampling. The interviews were conducted with managers and directly impacted employees in order to understand their perceptions and experiences with regards to the change curve. Data collected during the interviews were sorted, coded and categorized into themes.
The triangulation was employed by collecting data from multiple sources to ensure reliability and validity. For qualitative data, member checking was used where interviewees were given a chance to review and confirm the accuracy of their statements. For quantitative data, the survey was tested for reliability.
All participants were informed about the purpose of the research and their consent was obtained before data collection. Confidentiality and anonymity were assured. German privacy and data protection laws as well as International, and company internal policies on data standards were also applied.
4 Change curve in application
The global logistics industry has been reshaped by the rapid advancement of technology, and companies are compelled to adapt to these changes to maintain their competitive edge. The ensuing case studies scrutinize the implementation of the Kübler-Ross change curve within different contexts, undertaken by a prominent logistics company herein referred to as the ‘company’ to preserve confidentiality. As the case studies will demonstrate, the company consists of multiple business units and a corporate headquarters. The “locus” of each case study is detailed in the respective section.
The three cases under investigation encompass: 1) A national deployment within the warehousing business at seven sites in the UK, 2) An international implementation program within the air and ocean freight logistics division, 3) A corporate-level HR system initiative with ramifications for the entire organization.
In the company the change curve model serves as the conceptual framework to anticipate and effectively manage the human response to change. Quantitative Change Readiness Assessments are coupled with qualitative methodologies, including workshops, interviews, and on-site observations, to identify and analyse the emotional stages traversed by the workforce. The overall target for the respective change managers is to identify stages of the change curve with significant characteristics that help the organization and involved leaders to identify the stage the workforce most probably sits in, thereby facilitating the acceleration of their progress through the change curve.
For this study, three existing case studies have been reviewed, documenting the approach. The analysis is qualitative and interpretative, focusing on exploring and understanding the complexity and uniqueness of the cases within their contexts. Within these case studies, the problem is precisely outlined, followed by the applied methodology [27], and subsequently, the solution. The cases are selected to understand a particular phenomenon according to Stake RE [27].
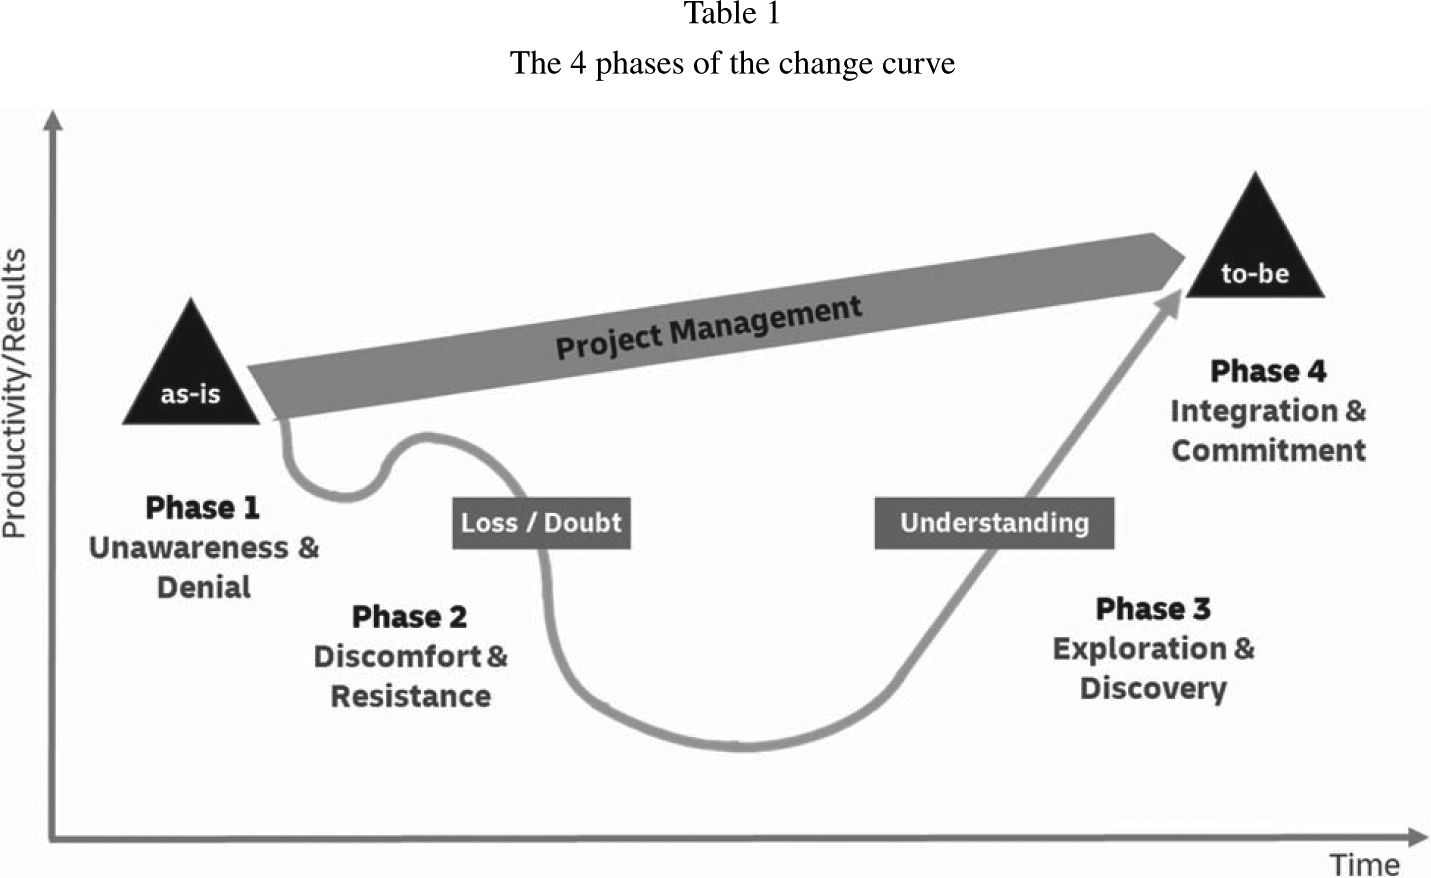
The 4 phases of the change curve

4.1 Case 1
Implementation of a new Performance Management System across seven sites in the UK commenced with a pilot at one site to establish a comprehensive blueprint for subsequent rollouts across the remaining six locations. The initial site was employing approximately 400 individuals in diverse roles, with 25 users directly impacted and around 300 operatives receiving data and reports from the new system.
For the directly impacted users, the senior management team facilitated the initial communication and announcement of the new system through a personalized on-site meeting. The project team, with a specific emphasis on change experts, promptly sought feedback from the users and extended invitations for voluntary participation in an anonymous survey. This survey was crafted around the above mentioned four phases and featured three questions for each phase. The aim was to discern the current position of users within the change curve, with an expectation that the majority would fall within the initialtwo stages.
In consecutive sessions adding to the survey results it became apparent that users in the early stages sought additional information regarding the precise nature of the change and its likely impact on each individual’s role and tasks. Interestingly, during the initial assessment, no users explicitly expressed – neither was observed- a stage of ‘denial.’ However, several weeks later, as the project and management teams worked diligently to develop more comprehensive information and communication materials, observations and personal conversations indicated that users were beginning to harbour doubts about whether the proposed system would indeed be implemented.
The initial lack of denial could be attributed to a need for clarity, which the project and management teams addressed by refining their communication approach over the subsequent weeks. As users were exposed to more detailed information about the change itself and the specifics of the rollout and implementation strategy, the reported scepticism diminished. Once users received a clearer picture of what the change entailed and how it would unfold, they transitioned from a state of unclarity and denial to a heightened awareness, dispelling any lingering doubts about the impending implementation. This communication strategy played a pivotal role in fostering awareness and understanding.
Once the details of the new system and its implications for each user’s role and tasks became more apparent— transitioning from individualized reports to standardized tasks across the user group— the users experienced concerns related to potential loss and negative consequences for their careers and reputation within the organization. This shift, from specialized tasks to more standardized and comparable responsibilities, prompted a stage marked by discomfort, resistance, and negativity. This phase, discomfort & resistance, was carefully observed, and monitored through further surveys and sessions.
Interestingly, during this period there was no clear indication of a bargaining stage among the users. The focus primarily centred on dealing with the perceived challenges and uncertainties associated with the change. The absence of a bargaining phase suggests that users were navigating the emotional landscape with a more direct confrontation of concerns and potential consequences rather than attempting to negotiate or bargain for a different outcome. Therefore the 4 phases of the company do not explicitly have a phase characterized by ‘bargaining’ as suggested by Kübler-Ross, E., & Kessler, D. [6].
The change experts and the project team leveraged the valuable insights collected from user feedback and observations. Recognizing the importance of open communication, they recommended organizing feedback and conversation sessions between managers and users. These sessions provided a platform for users to express their concerns, fears, and expectations regarding the overall implementation and the new system in particular. The direct interaction fostered a candid environment, allowing all frustrations to be articulated and facilitating constructive discussions about potential next steps.
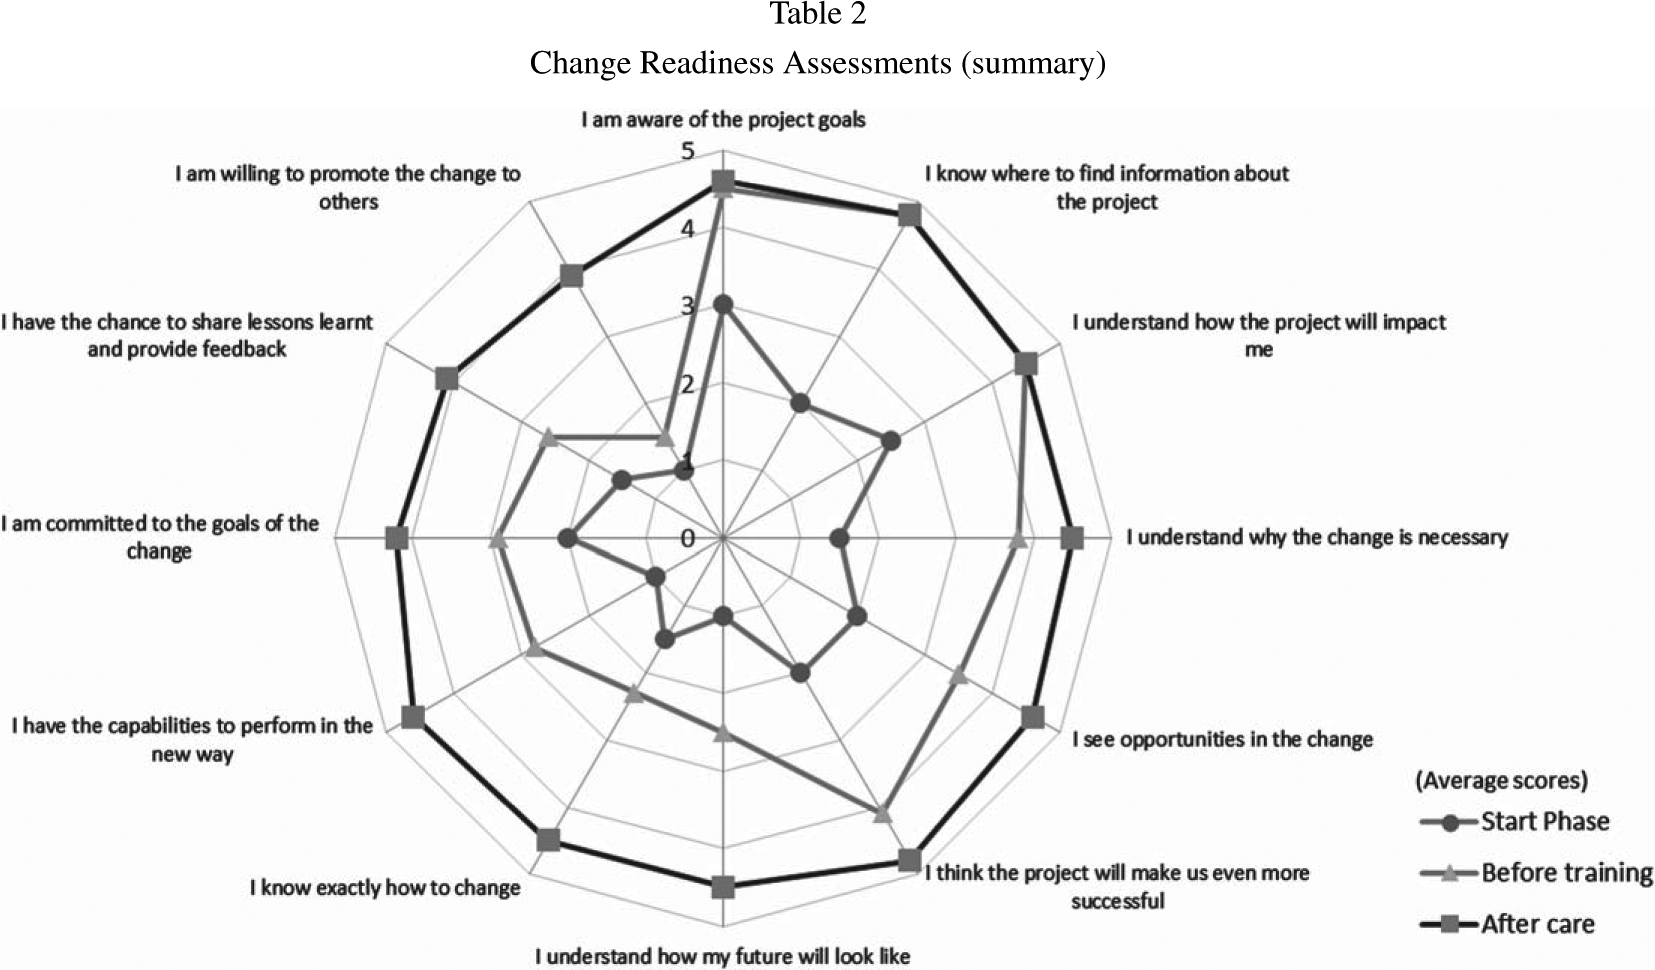
Change Readiness Assessments (summary)

Over time, a notable shift in user sentiments became apparent. Initially positioned in the ‘downwards’ phases of the change curve, users began expressing a desire for more detailed information about the system, the workflow and system features, and requested training opportunities. This shift suggested a positive trajectory in the change curve, aligning with what several authors describe as the phase of acceptance and in the company is called ‘integration & commitment’. During this period, users actively engaged with the system, exploring its capabilities, and uncovering enhanced features that contributed to a more favourable perception of the new system.
Empowered by consistent acknowledgment and positive recognition from both managers and the project team, users gained increased confidence and motivation in adapting to the new system and their revised roles and environment. This transformation translated into enhanced services for operatives, offering them more readily accessible data, reports, and customized dashboards tailored to the needs of operational teams. Surveys and comprehensive implementation review workshops further highlighted the progress made by users in their change journey. Notably, users demonstrated a significant advancement along the change curve, transitioning beyond acceptance to a stage of commitment. Remarkably, there was an evident willingness among users not only to embrace the system but also to actively promote it across the remaining sites in the country.
4.1.1 Summary descriptive statistics
All 25 users took part in the qualitative research.
With a scale from 1 (=low) to 5 for all 12 statements the survey demonstrated that: • In the “Starting Phase” the lowest average rating per question was at 1, highest at 3 The average score for this phase over all 12 questions was at 1,75. • During the “Training Phase” the lowest average rating was at 1,5, highest at 4,8 The average score for this phase over all 12 questions was at 3,32 The highest ratings were reported in the first Block with 3 questions about the change itself. The increase was from 2,5 on average for this Block of questions (in the Starting Phase) to 4,6 in the Training Phase; An increase of 84%. • In “After care” the average over all 12 questions increased to 4,47 Compared to the starting phase this is an increase of 155% (Table 2).
4.2 Case 2
An implementation of a new IT system across more than 40 countries around the globe impacting the customer handling processes for more than 25.000 agents. In comparison to the previous case, this program addressed a larger user base and diverse geographic regions worldwide. To ensure a smooth transition, the project was executed in waves across regions and countries. From the initial announcement to the technical roll-out, onboarding and training of users, and post-implementation care, each phase was meticulously scheduled, with a timeframe ranging from 4 to 6 months. The duration was tailored to accommodate the unique characteristics of each country and the amount of users impacted.
Recognizing the importance of local engagement, the central project team proactively initiated the onboarding of local representatives and leaders who willingly assumed an active role in the implementation within their respective countries. Despite the enthusiasm of local representatives and leaders, initial resistance was noted among many stakeholders. Skepticism about the project’s necessity and concerns about potential negative consequences for customer interaction and local productivity were prevalent. Doubts regarding the feasibility of the ambitious timeline also emerged, particularly in understanding the comprehensive plan. This was an indication that local representatives also went through the change curve. The central project team reacted immediately with the sponsorship and support from senior leadership level with further clarification and information about the change plan and the expected activities from local representatives. Practical measures, such as onboarding and training sessions, were implemented to equip country teams with the necessary knowledge and materials. The focus was not only on dispelling doubts but also on providing tangible support to enhance the understanding and acceptance of the implementation plan.
After the country teams were onboarded accordingly and a notable shift in their mindset was observed, the country communication (prepared by the central team) was launched, and users began to understand the nature of the change and the implication on individuals within the organization. After a few weeks of continuous communication through various channels (newsletter, emails, intranet pages, internal social media channels and personal conversations and workshops) impacted employees better understood the details of the change and went through the stage of unawareness & denial in an accelerated pace.
But as the country implementation teams delved into providing more comprehensive details about the ongoing implementation, a notable uptick in resistance surfaced during direct interactions with users. This resistance, identified through workshops and anonymized surveys aligned with the four phases of the change curve, was accompanied by a noticeable decline in productivity. Users displayed a tendency to adhere to familiar (previous) processes, often glorifying the ‘old’ system. 3 main areas were detected indicating that people are in discomfort & resistance: a relatively high absenteeism rate and decreasing productivity (data), an increased union involvement among employees (data and observation), a high frustration and even aggression in the wording and dealing with managers (observation).
Recognizing the critical need for proactive interventions, the local implementation team, and, in particular, the local management team, used centrally provided, targeted change management strategies to address the increasing resistance. A multifaceted approach was employed to engage with users and guide them through the transition: • (Change Management) Workshops: Specialized workshops were initiated to provide a deeper understanding of the benefits of the new IT system and dispel misconceptions. These sessions aimed to foster understanding about the change and to provide the platform for attendees to ask questions and raise their concerns. • (Structured) One-on-One conversations: Personalized conversations were conducted to address individual concerns and provide tailored support. This approach allowed for a more intimate exploration of challenges, fostering a sense of personalized guidance throughout the transition. • Support channels: Dedicated communication channels were established to serve as a continuous support network for users. These channels facilitated real-time assistance, ensuring that users felt supported and connected during their adaptation to the new IT system. • Encouraging open dialogue: The local teams actively encouraged open dialogue, creating a culture where concerns could be voiced without fear of reprisal. This open communication not only addressed immediate issues but also fostered a sense of shared ownership in the success of the implementation. • Feedback gathering and adjustments: Rigorous efforts were made to collect feedback through various channels. This feedback loop was instrumental in making real-time adjustments to the implementation strategy, ensuring a dynamic and responsive approach to user concerns.
Constant support for these strategies was maintained through diligent monitoring mechanisms, with a combination of surveys and focus group workshops emerging as the most effective tool for detecting the position of stakeholders within the change curve.
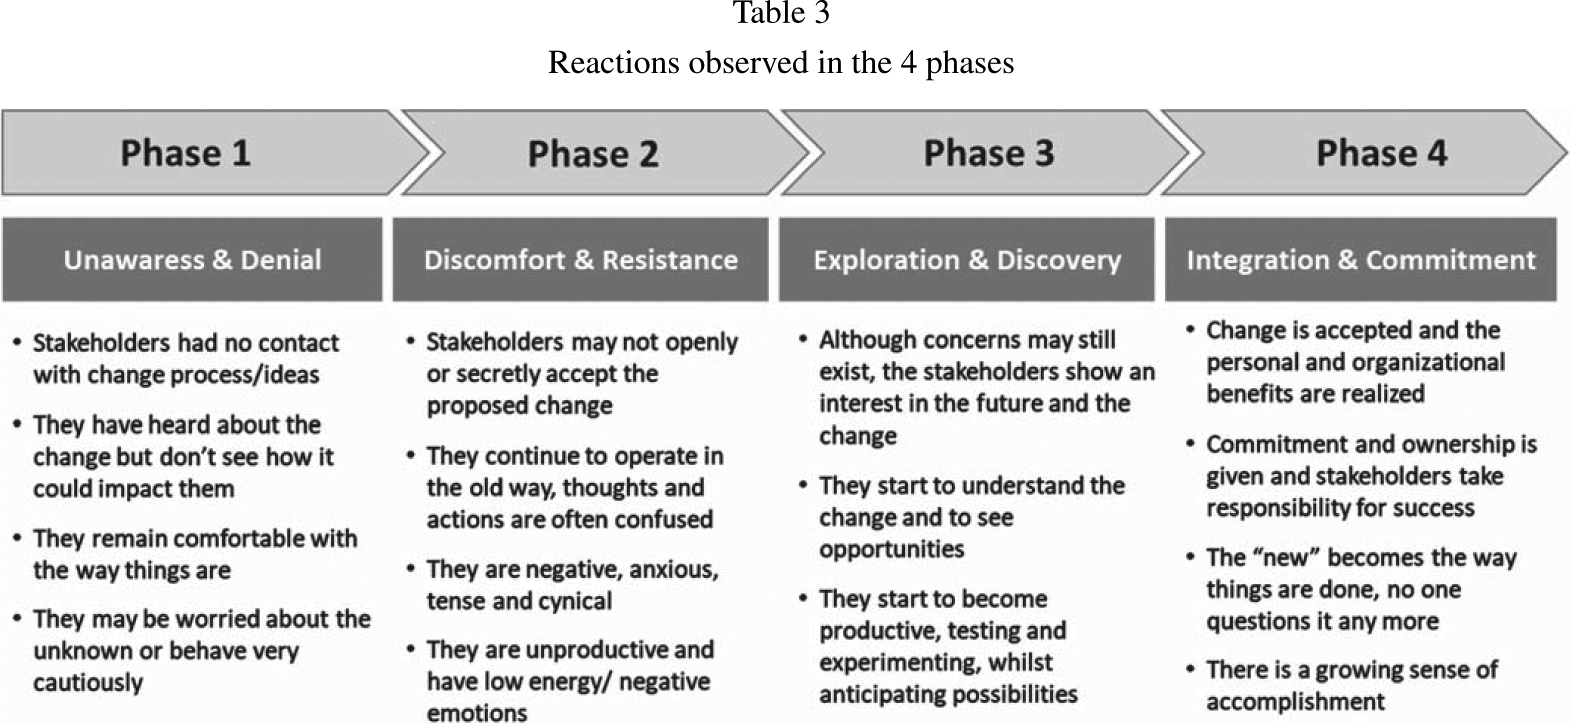
Reactions observed in the 4 phases

As (after these change interventions) skepticism and resistance faded, and users became increasingly receptive to the new system, interest rose. Certain behaviors and attitudes clearly indicated the shift to the ‘upwards’ swing of the change curve into exploration & discovery: • Questioning: more and more individuals asked questions about the changes and sought clarification on any uncertainties. They still expressed concerns but were more focused on understanding than resisting. • Curiosity and interest: impacted employees expressed interest in understanding the new IT system. They actively requested information about the system and its potential benefits. • Openness to learning: employees showed an increasing willingness to learn and acquire new skills related to the IT system and related processes. They engaged with educational resources. • Experimentation: users started experimenting with the new tool and processes. • Active participation: Individuals actively participated in discussions, workshops, or feedback sessions related to the IT implementation.
This positive shift prompted the implementation team to progress to the next phase, facilitating exploration through training and coaching sessions during the user onboarding process. The team acknowledged the users’ growing productivity as they began testing, experimenting, and independently grasping the system’s benefits.
As users advanced further into the integration & commitment phase, the implementation team and local management intensified their efforts to offer ongoing guidance, support, and feedback. Through regular recognition ceremonies and active celebration of milestones and successes, the transformative change gained momentum, gradually embedding the new IT system as the new norm. Monitoring schemes were advanced from measuring stakeholders’ readiness and acceptance of change into performance levers aiming to sustain the new normal (Table 3).
4.3 Case 3
A global implementation of a new IT system focusing on learning and career development of each employee within the entire organization across all legal entities.
In contrast to the previous cases, this program represents a significant HR-related endeavor, designed to support employee retention by establishing a robust platform for continuous learning, professional growth, and career development. Unlike conventional mandatory platforms, the program positioned itself as a voluntary benefit, emphasizing a user-centric approach. Consequently, the project team faced the unique challenge of inspiring and attracting users to engage with this platform as there was not necessarily an urgency and strong need to use this platform perceived in the first glance. This project was executed in waves across regions and countries. From the initial announcement to the technical roll-out and onboarding of users, the rollout was scheduled along the already existing HR process such as year-end feedback or target achievement procedures. The onboarding process for users was meticulously designed to be self-directed, requiring guidance, motivation, and inspiration for active engagement with the platform. The central and regional implementation teams, along with organizational leaders, played pivotal roles in facilitating this user-centric approach. A centrally dedicated communication, engagement and change team took the lead in supporting this initiative with centrally provided engagement measures and strategies. Additionally, this team supplied meticulously prepared onboarding materials and information resources tailored for local usage, ensuring a seamless and personalized onboarding for every user.
The initial stage, characterized by unawareness and denial, became evident during onboarding sessions. In these sessions, stakeholders were introduced to the platform by their respective managers, with support from HR business partners. Notably, the increased interest among users to acquire more information and their inclination to seek answers to specific, often critical questions marked the starting of their journey on the change curve within the unawareness & denial phase. A tailored monitoring scheme for user activation further underscored this phase. Even after being informed about the platform and technically onboarded, users exhibited minimal engagement. It was observed that users logged in only once to the platform without activating their profiles nor exploring the platform’s functionalities. This data served as a clear indication that users were still navigating through the early stages of the change curve, dealing with the challenges associated with unawareness and denial. So, with the centrally provided communication and engagement materials stakeholders were moved from initial skepticism and doubt to a stage where they accessed the system, but – as the monitoring has shown – not actively used it.
In order to address this, the central project team asked leaders and central ‘influencers’ to showcase support and to spread positive messages about the new system. Leaders visibly endorsed the platform, participating in informational sessions, or even sharing personal testimonials in internal social media channels. This fostered a sense of unity and reassured users that the change is endorsed and championed at all levels of the organization. In addition, regional teams offered comprehensive information about the new platform through various channels such as videos, introduction materials, and interactive onboarding sessions. This helped to increase understanding amongst users, making them see the change as a well-thought-out process, easing worries and fostering a sense of informed participation.
As the system – once fully understood by the users – was positioned as a benefit for users with the newly provided ability to master their own growth and development within the company and to better influence their own career, doubts about the impact with such a platform still existed, but denial that this system will be implemented slowly diminished.
In this phase there was a certain behavior and verbal expression noted which characterize the discomfort & resistance phase: • Negative (verbal) expressions: employees vocalize complaints, concerns, or express dissatisfaction about the IT platform. A use of negative language or critical remarks regarding the implementation and the platform as such was detected. • Avoidance and disengagement: individuals avoid participating in engagement and feedback sessions, they did not sign up for online training sessions, workshops, or other activities related to the new platform. There was a lack of interest in learning about the changes noted. • Withdrawal from communication: users withdrew from communication channels or actively avoid discussions about the changes. A lack of involvement in discussions or reluctance to share feedback was increasing. • Unwillingness to adapt: employees showed a resistance to adopting the new tool, its related processes and the technology introduced by the IT implementation. A rigid adherence to old methods was observable.
Acknowledging the challenges users face, validating their concerns, and expressing empathy by managers was one important capacity to move users further through the change curve through discomfort & denial. Acknowledgment created a supportive environment, fostering a sense of connection and understanding between stakeholders and the project/change facilitators includingmanagers.
This was identified by observation and through surveys that testified that – although doubts and concerns may still have existed – users showed an increasing interest in the new platform. They actively asked for further details and wanted to get their individual questions about the system, but also about the infrastructural and process related impact answered. By applying the centrally provided engagement strategies, the implementation team was able to make individuals progress from initial apprehension through discomfort & denial to a state of exploration and discovery.
Users exhibited a heightened interest in delving into the details and all features offered by the new platform. They started experimenting with the system, experiencing its strengths but also weaknesses. This approach extended to their enthusiastic participation in communication and feedback sessions, where users shared valuable insights to contribute to the continuous improvement of the system. These behaviors signified a notable advancement along the change curve, firmly placing users in the exploration & discovery phase.
The central and the local implementation teams supported the progress with further predefined interventions. Managers played a pivotal role by fostering an open dialogue surrounding the platform. Specifically, they were tasked with initiating regular one-to-one conversations that delved into the nuances of platform usage and its various features. Through this, managers seamlessly integrated the platform into the broader HR-related learning and growth landscape. The central team proactively scheduled feedback sessions, actively gathering improvement ideas and suggestions to refine the platform further. Complementing these efforts, a comprehensive communication strategy, robust support channels, well-crafted training materials, and clear instructions were put in place. Additionally, the ambassador community and the knowledge exchange concept served as vital pillars, fortifying the adoption of the platform and instilling a heightened confidenceamong users.
Through consecutive change readiness and feedback surveys coupled with a reporting about ‘user activation rates’, the central change team discerned a notable shift among users – a progression from the exploration & discovery phase to integration & commitment.
To facilitate this evolution from phase 3 to phase 4, the central engagement and change team executed pre-designed interventions and strategies: • Providing guidance, support, and continuous feedback: the central team established mentorship programs to offer guidance during the change process. They created support networks, ensuring that individuals have resources to navigate challenges and they also implemented a robust feedback system that encourages continuous improvement and addresses concerns promptly. • Providing frequent recognition on progress: the central team facilitated the implementation of regular recognition ceremonies or platforms to spotlight individual and team achievements. This helped to foster a culture of acknowledging both small and significant milestones. • Providing opportunities for leadership: in order to strengthen leadership support, the organization – in addition – offered leadership training and development programs to nurture emerging leaders, thereby developing mentorship circles where experienced leaders guided and empowered aspiring ones. • Celebrating progress and successes: the global management team hosted celebratory events to recognize collective accomplishments. Through the internal social media channels success stories were shared across the organization, fostering a positive and motivationalatmosphere. • Integrating the new system into the normal: related HR processes were streamlined to link to the platform. Target achievement and bonus schemes were combined with the features of the system to make the system an integral part of the entire HR process landscape. • Establishing ‘performance levers’ to sustain new behavior: throughout the implementation process a set of key performance indicators (KPIs) aligned with the desired behaviors was defined to monitor progress and to also measure success. At least the goal was to activate as many users as possible and to improve internal progress of employees as well as to improve the retention rate.
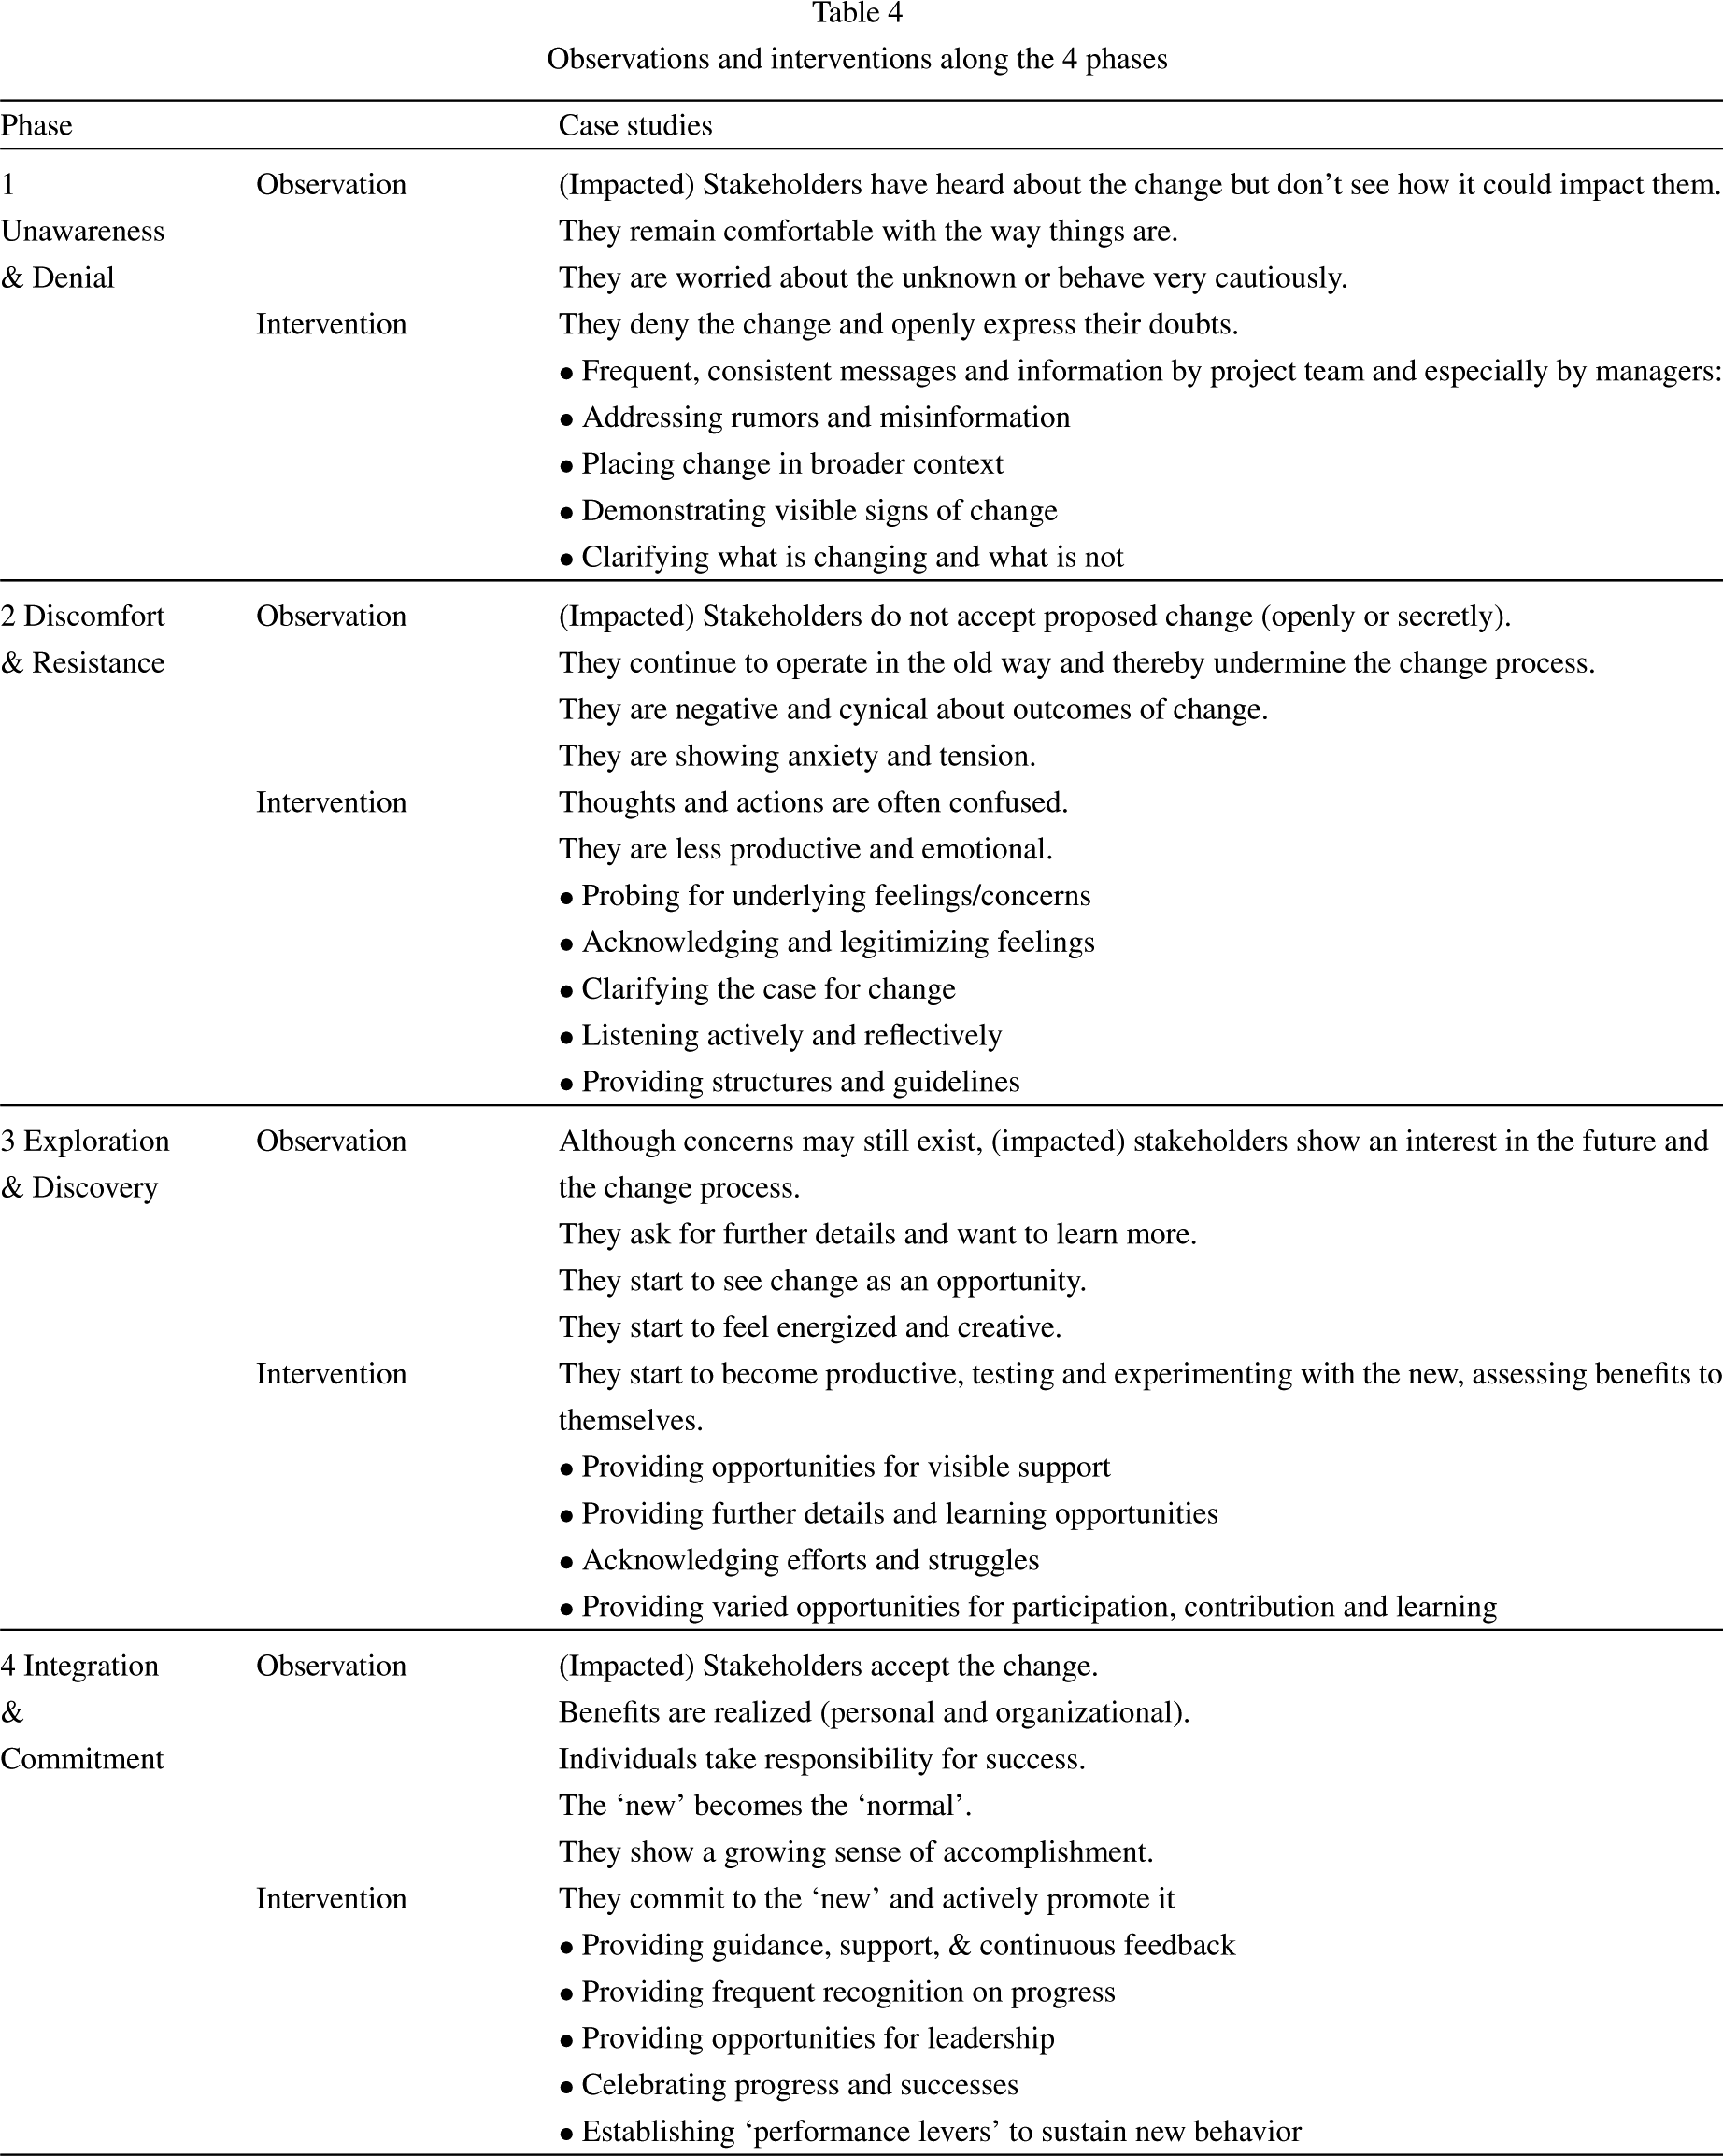
By seamlessly integrating these interventions and strategies, the central change team not only facilitated the shift from discovery to commitment but also laid the foundation for sustained engagement (Table 4).
Observations and interventions along the 4 phases
5 Results
The discerned trajectory of the Change curve reveals two principal domains: a descending trajectory characterized by emotions of loss and doubt, and an ascending trajectory denoting acceptance leading ultimately to commitment to the change.
In the initial stages of the change curve, unawareness & denial, individuals do not understand the details and specifics of what the change is all about. People dismiss and avoid the change, due to lack of awareness and understanding and comfort with the status quo. A lack and limit of clear and consistent information in the early stage of the change often leads into a denial of the whole change. People express their doubt that the change, however it will look like, would ever happen and -if so – succeed. In the analysis of the 3 cases, it is reported that there is a high relation between the level of complexity of the change (from a national implementation program in 7 sides in UK up to a global corporate implementation program impacting the whole company) and the testified level of unawareness and denial. The higher the complexity of the change, the higher the need for clear and consistent information about the change. Denial increases proportionally to the complexity of the change idea.
Once the impacted workforce has a satisfying level of awareness about the change and assurance of the change’s inevitability, people exhibited heightened emotions, manifesting as anxiety, anger, and resistance, aligning with Kübler-Ross’s stages of anger and depression [6]. Within this phase of the change implementation the workforce constantly registers elevated levels of discomfort & resistance across all three analysed cases.
Throughout both phases, unawareness & denial and discomfort & resistance, it is discerned that individuals dynamically oscillate between stages, presenting challenges for stakeholders such as the project team, change management experts, and the leadership team to unequivocally ascertain the current stage of a specific stakeholder or stakeholder group. Consequently, the company streamlined its approach by identifying and employing only two phases within the descending trajectory of loss and doubt, recognizing their pivotal impact on the change and communication strategy. While in phase 1, characterized by unawareness & denial, clear messages, comprehensive information, and consistent communication is key to success, in phase 2 – resistance & discomfort –, regular engagement, attentiveness to feedback, and proactive communication by the leadership team assumes greaterrelevance.
A critical turning point was observed after a designated period of soliciting and accommodating employee feedback, allowing space for the expression of fears and opinions, and providing a platform for emotional release. This pivotal juncture saw the impacted workforce transition from the descending trajectory to an ascending trend, demonstrating an augmented interest in the change and a receptivity to explore the new IT system. It is in this third phase – exploration & discovery – that individuals express a desire for training and guidelines on the utilization of the new system.
In the final stage of the change curve – integration & commitment – individuals start to accept the change by integrating the new way of working and manifesting a dedicated commitment to the transformative initiative. Phase 4 entails a nuanced appreciation of their efforts, the provision of affirmative feedback, and the cultivation of an environment that supports continued learning and adaptation.
6 Conclusion
This study aims to examine the theory and practical application of the change curve. Through a comprehensive literature review, we have identified distinct phases within the change curve, albeit with notable similarities in their core components. Case studies employing a four-phase model demonstrate the effectiveness of a simplified conceptualization of the Kübler-Ross change curve in managing significant organizational changes.
Utilizing the Kübler-Ross change curve facilitated more effective management of the transition within the company. Preparedness for various stages of employee reactions enabled the provision of necessary support and resources, thereby smoothing the transition process. Subsequently, employees adapted to the new system, resulting in improved communication and accelerated implementation.
Proactively anticipating the four delineated phases allows enterprises to better mitigate the impact of change on employees and operations, thereby enhancing their ability to oversee transitions effectively.
6.1 Future implications
Both from a scientific and practical perspective, this work points forward: As shown, there are only a few studies on the change curve. This calls for more in-depth research, as will be demonstrated. Moreover, the practical implications should be further explored: A deeper understanding of the change curve and its managerial implications can help those affected by change to more easily accept it, thereby aiding companies in more effectively implementing changes. The proficient application of the four-phase change curve, as expounded upon in this paper, suggests its promising adaptability for analogous employment in diverse change management scenarios within and beyond the logistics industry. Given these observations, it is recommended to undertake further empirical investigations to systematically examine the scalability of this conceptual framework. This endeavor would contribute to the refinement of change management methodologies and facilitate a more nuanced comprehension of its potential applicability across a spectrum of organizational contexts. Additionally, there is a need to address various queries, including those concerning evidence-based validation, the transposition of the curve from its original medical milieu to the business domain, as well as considerations related to universality, linearity, coherence, and its relevance across heterogeneous change environments.
Footnotes
Acknowledgments
We would like to express our gratitude to the company with whom we have collaborated, as well as to all the project managers and leaders whom we have had the privilege of supporting on their journey of change.
Author contributions
CONCEPTION: Hagemann and Cechlovsky
METHODOLOGY: Hagemann and Cechlovsky
DATA COLLECTION: Cechlovsky
INTERPRETATION OR ANALYSIS OF DATA: Hagemann and Cechlovsky
PREPARATION OF THE MANUSCRIPT: Hagemann
REVISION FOR IMPORTANT INTELLECTUAL CONTENT: Hagemann and Cechlovsky
SUPERVISION: Hagemann and Cechlovsky