
Abstract
A new method to measure the distance between fuzzy singletons (FSNs) is presented. It first fuzzifies a crisp number to a generalized trapezoidal fuzzy number (GTFN) using the Mamdani fuzzification method. It then treats an FSN as an impulse signal and transforms the FSN into a new GTFN by convoluting it with the original GTFN. In so doing, an existing distance measure for GTFNs can be used to measure distance between FSNs. It is shown that the new measure offers a desirable behavior over the Euclidean and weighted distance measures in the following sense: Under the new measure, the distance between two FSNs is larger when they are in different GTFNs, and smaller when they are in the same GTFN. The advantage of the new measure is demonstrated on a fuzzy forecasting trading system over two different real stock markets, which provides better predictions with larger profits than those obtained using the Euclidean distance measure for the same system.
Keywords
Introduction
Distance between (fuzzy) numbers is an interesting concept with many possible applications. It is a numerical measurement of how far objects or points are. Similarity and distance measurements are closely related concepts. Even more, similarity measure – how much alike two objects are – can be obtained as a function of the distance and vice versa [1]. But similarity is subjective and highly dependent on specific domains and applications. Therefore there are many different approaches to defining similarities.
Fuzzy number is a useful concept to formulate mathematically-represented linguistic expressions,commonly in the form of triangular or trapezoidal membership functions. Fuzzy numbers can better describe human cognition in interval numbers because in real-world situations, there often exists conditions or states that are difficult to express by crisp values [2].
In the areas of decision making, artificial intelligence and data analysis under fuzzy environment, comparison of fuzzy numbers by measuring similarity (distance) is commonplace. This measure is key to identify patterns in different application fields (risk evaluation, financial markets, medical diagnosis, robotics, fault diagnosis, image processing, etc.) [3, 4, 5, 6, 7, 8, 9]. Due to this practical side, research on similarity and distance computation between fuzzy entities has gained more attention over the last decades and it is still an issue that attracts many researchers.
Different methods have been proposed to measure similarities between fuzz numbers from different perspectives. There are many diverse factors that affect the calculation of the degree of similarity of fuzzy numbers, such as the position, shape, overlapping, perimeter, area, etc., of the fuzzy sets. Some methods that do not reflect the geometric characteristic of fuzzy numbers may produce inconsistent values of similarity [10]. Other methods are not particularly sensitive, or they are only designed for particular fuzzy numbers [11]. Therefore, it seems necessary to further research on this topic and to propose new similarity measurements between fuzzy numbers in order to provide better solutions for real applications and to overcome some of the problems other approaches have.
In this paper a new method to measure the distance between two fuzzy singletons (FSNs) is proposed. These FSNs are obtained as a result of the Mamdani fuzzification of crisp values. They are then transformed into generalized fuzzy numbers (GFN) using the standard convolution operation in signal processing. Next, an existing distance definition for GTFNs is applied to them.
The main contribution of this work is twofold. First, a new method to measure the distance (similarity) between two FSNs is developed and its performance is shown to be as desirable in a theoretical example. On the other hand, this new similarity measure has been used in a real pattern recognition application, a stock market fuzzy forecasting system. It gives more accurate prediction results in comparison with other classical distance measures for the same real scenario.
The interest of this study lies in the fact that, in many real-world pattern recognition applications, fuzzy logic is used to characterize real variables, and different distance measures influence the outcomes.
This work is organized as follows. In the next Section, related works are summarized. In Section 3 the mathematical foundations are described and the problem addressed is explained. The new method proposed to obtain the distance between FSNs is described in Section 4. Section 5 is devoted to comparing this new definition with two classical distance measures in a theoretical example. In Section 6, the new similarity measure is applied to a real patter recognition application, a stock market forecasting fuzzy system, and results are discussed. The conclusions and future works end the paper.
Related works on similarity and distance measure for generalized trapezoidal fuzzy numbers
One of the first attempts to calculate the similarity between fuzzy entities is attributed to Bonissone, who in 1980 applied a quadratic weighted distance in the feature space as a metric to evaluate similarity between two fuzzy sets [12]. Since then, there have been many different proposals. A review of existing similarity measures between fuzzy numbers applied to risk analysis is presented in [13]. In reference [5], a comprehensive overview of distance between two fuzzy sets in image processing is given. A more recent paper summarizes some works about similarity measures between GFNs and present a review of these measures between trapezoidal fuzzy sets [7]. It includes the most common and widely used ones.
The similarity measures between GFNs depend on the features of these GFNs. For example, it can be based on the center of gravity (COG), as in [14]. The measure proposed by Zuo et al. is also based on the COG, and on the perimeter and area of GTFNs [4]. In reference [15] the similarity measure depends on the perimeter and the area of the GFNs. Patra and Mondal propose a similarity measure of GTFNs using area and height of the fuzzy sets [16]. In reference [17], a new similarity measure is proposed. Four features are included in the similarity measure definition, namely the geometric distance, the center of gravity, the Hausdorff distance and Dice similarity coefficient. In the same way, Khorshidi and Nikfalazar present a method to compute the degree of similarity between GTFNs that contains many features, such as geometric distance, center of gravity, area, perimeter, and height [18]. The work developed by Saffie et al. proposes a fuzzy similarity measure for GTFNs based on distance and geometric shape characteristics of the fuzzy sets like height, area, center, and perimeter [10]. Nevertheless, few works have made an attempt to consider the membership degree in the definition of similarity between fuzzy numbers, except reference [19], which was one of the first to include this feature.
These similarity measures based on the COG and/or on other features of the fuzzy sets were initially developed for trapezoidal fuzzy numbers. But according to Chen and Chen, they can be standardized and generalized for any fuzzy numbers [14].
The existing similarity definitions based on features of the fuzzy sets present some limitations, such as that they may fail to determine the degrees of similarity properly in certain selected situations [16, 18, 20, 21].
To overcome some of the problems these feature-based definitions pose, other authors propose similarity measures based on arithmetic operations of the values that define the fuzzy sets. For example, Chen and Chen use the average of the distances between the four values that define a trapezoidal fuzzy set [20]. In reference [22] the arithmetic operations are extended to emphasize certain parts of the fuzzy regions and to try to adjust the result of the measurements. Yong et al. replace the center of gravity by a gravity radius, a mechanical concept, to define the distance between GFNs [23]. Geometric measures with arithmetic ones are used in [21]. Sridevi and Nadarajan propose new approaches for this measure and compare it with others measures for different examples [24]. A new similarity measure between GTFNs is defined by combining the exponential distance with numerical indexes of GTFN with Dempster-Shafer evidence theory [7]. In [25], authors combine spatial and membership information to find the distance between fuzzy or gray-level image data. They define a number of distances between fuzzy sets inserting a proposed point-to-set distance in existing definitions of set-to-set distances. The work by Guha and Chakraborty develops a new similarity measure based on a fuzzy distance measure to obtain the distance between two fuzzy numbers with different confidence level [26]. In reference [27] intuitionistic fuzzy similarity measure for GFNs is presented.
These works differ from the one presented here in that this work deals with fuzzy singletons and therefore, initially, there is not any other information about the fuzzy numbers but the membership degree and the input value. Indeed, one of the issues of some of the distance definitions proposed in the literature is that the shape of the membership function of the fuzzy sets is mostly lost. That is why in this case a mathematical transformation that keeps the shape of the fuzzy sets is applied. So, this proposal is based on the COG but at the same time it applies a mathematical operation to the involved fuzzy sets.
Mathematical foundations and description of the problem
Fuzzy logic is based on approximate reasoning. It works with fuzzy variables that have a membership degree to certain fuzzy sets, that represent characteristics or properties. A fuzzy inference system applies fuzzy if-then rules defined by an expert to input values that, in case of being crisp or analogical signals, have to be first converted to FSNs by a fuzzification method [28, 29].
In this work, the fuzzy singletons have been obtained as the result of the application of the Mamdani fuzzification method. Trapezoidal and triangular fuzzy sets have been used, following the literature on this topic, but other types of fuzzy sets (Gaussian, bell sigmoidal, etc.) could have been used to fuzzify the inputs. The distance between them is obtained by first transforming them into generalized fuzzy numbers. Therefore, the following definitions are necessary to set the context [30].
So, for every element
Note also that
A generalized trapezoidal fuzzy number (GTFN) is a GFN
Figure 1 shows the generalized trapezoidal fuzzy number
Fuzzification of two variables.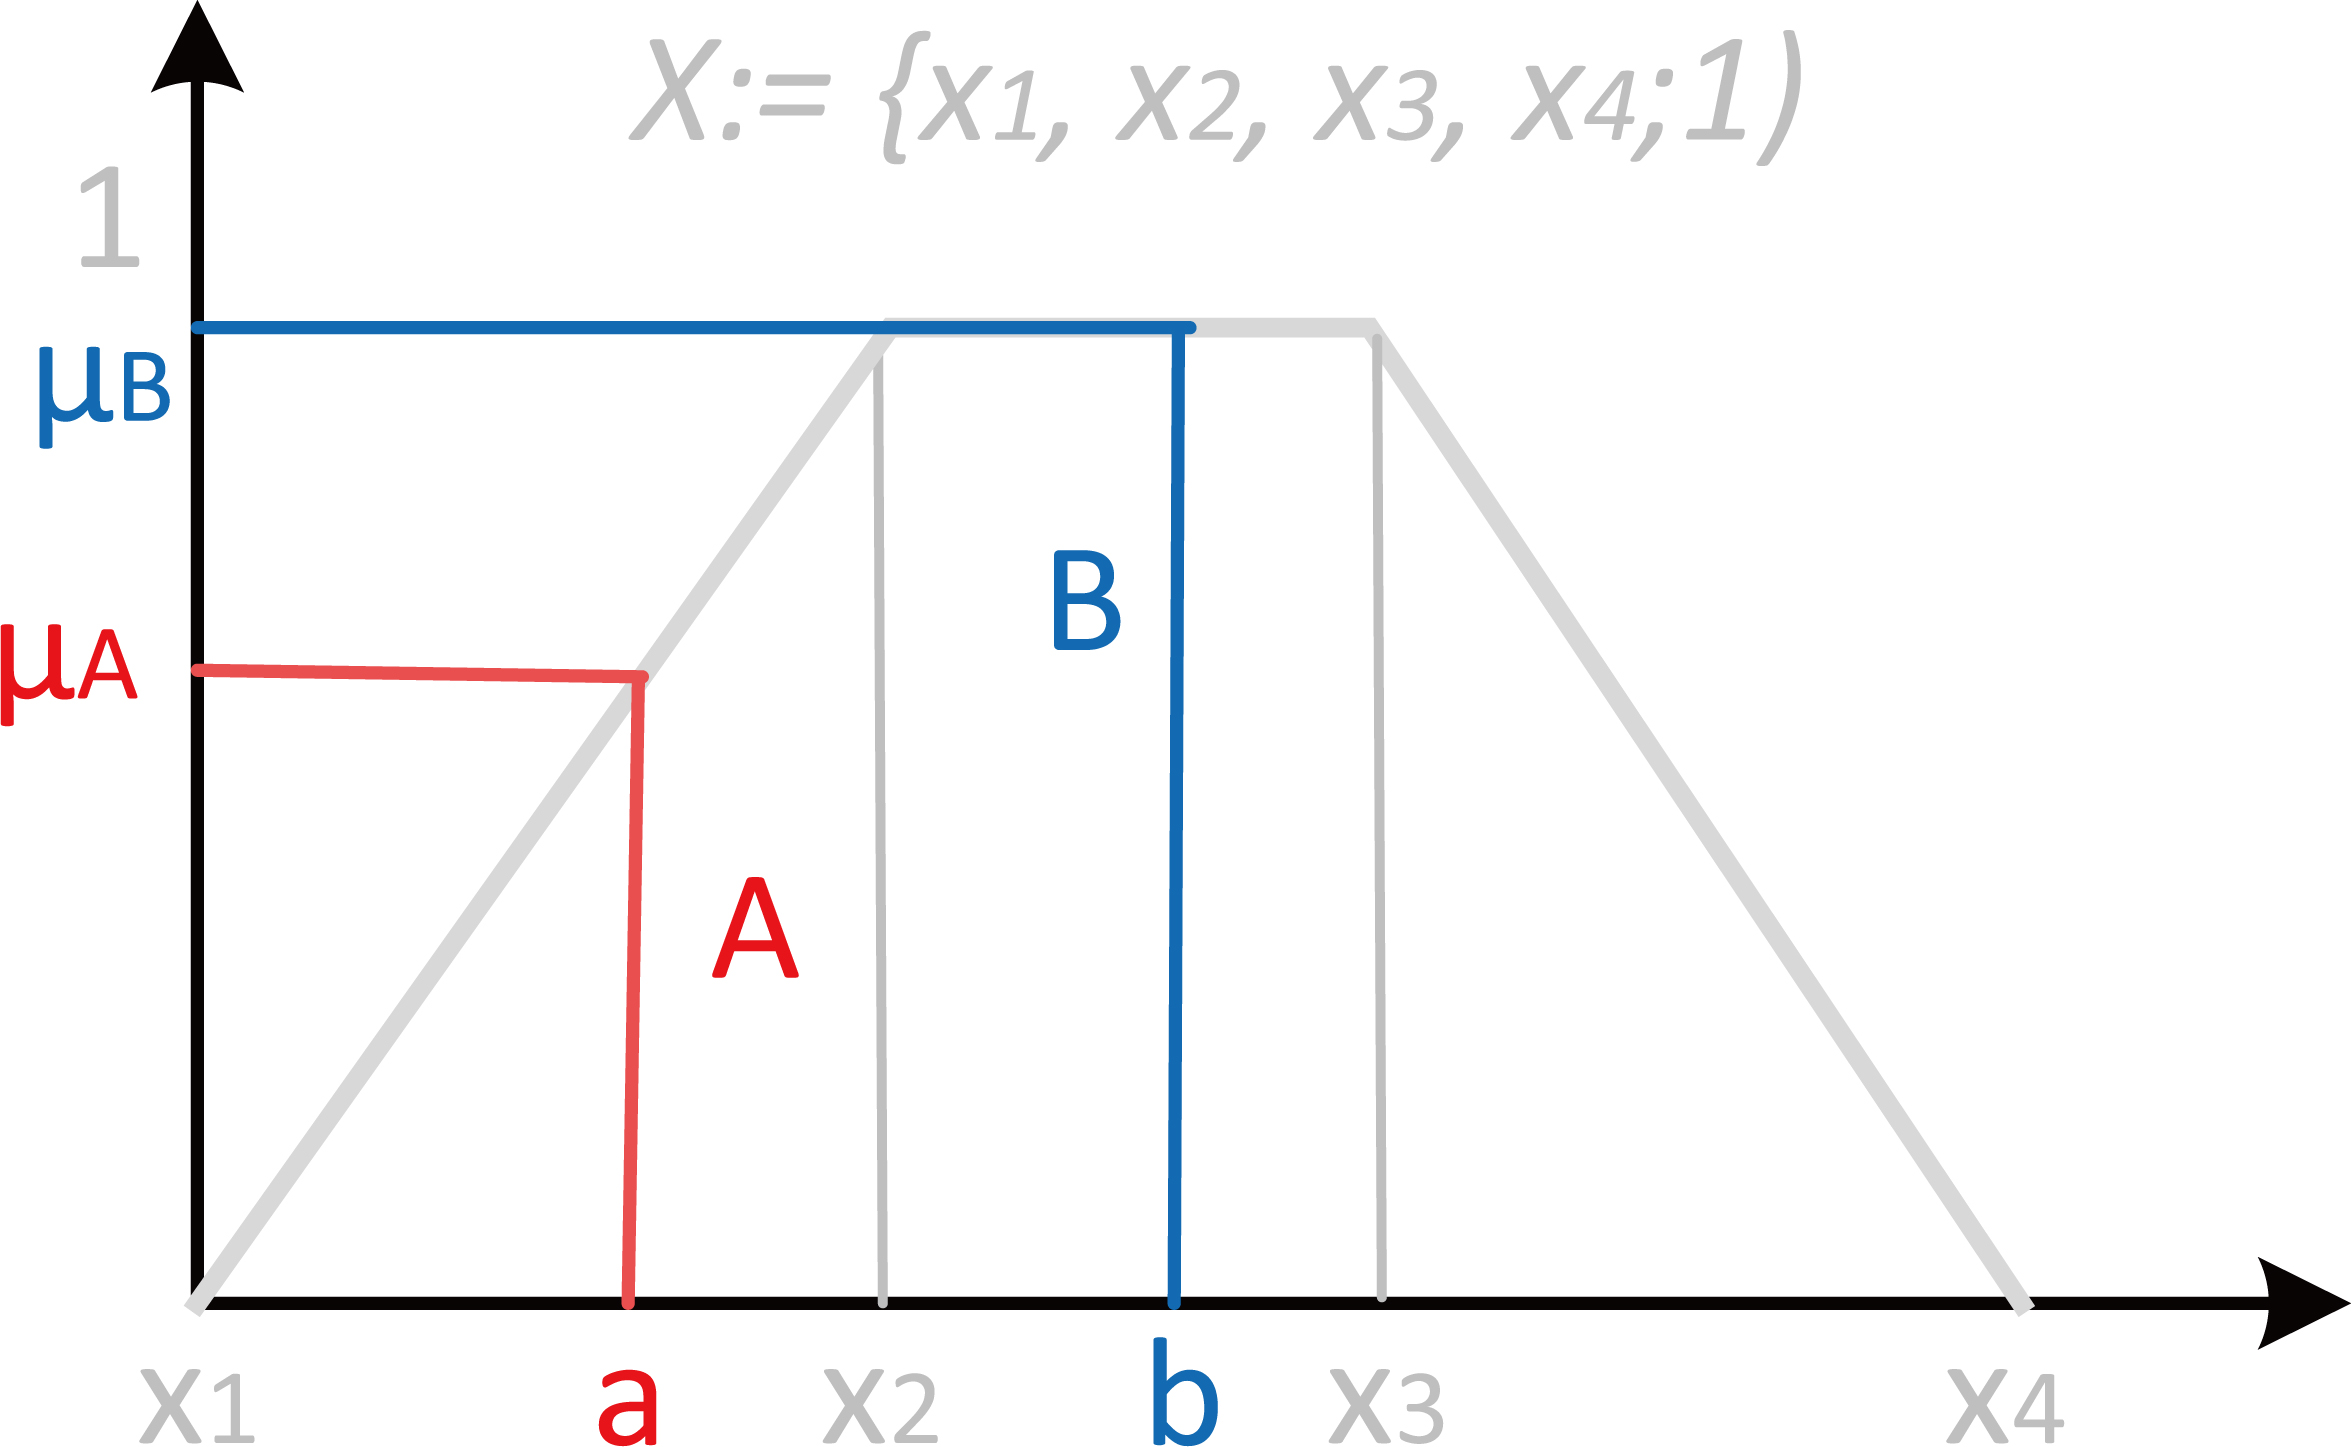
The Mamdani fuzzy inference method consists of a fuzzification process, trigger fuzzy rules of inference and a defuzzification process.
Therefore a fuzzy set can be considered the union of its constituent singletons.
Reflexive: Symmetric: Min-transitive: Min
Similarity and distance can be considered terms inversely related. Indeed, a generalized distance D can be defined as the negation operator of the similarity, such as
There are many definitions of similarity measure for fuzzy sets using different sets of axioms [31]. The definition of fuzzy similarity measure for GFNs given in [26] will be used in this work (Section 4). Other similarity measures between fuzzy numbers can be found in [20, 21, 23]; moreover, other researchers provide formulas specifically for triangular fuzzy numbers and consider only the symmetric and reflexive properties.
There are many different methods to determine the similarity between fuzzy sets, but not all of them can be applied to the particular case of FSNs without obtaining singularities, or false or incongruent values.
In this paper a fuzzy singleton is a fuzzy number obtained as the result of the Mamdani fuzzification process of crisp variables (Fig. 1). In this Fig. 1, a trapezoidal fuzzy set
The
Given two variables, whose crisp real numbers are
The vertical red and blue line of Fig. 1 can be considered the FSNs,
Singleton distance
Some pattern recognition applications, as the one proposed in this paper, use distances between FSNs. Note that a singleton
The Euclidean distance is widely used in different applications. When applied to singletons, it only takes into account the separation of the singletons.
When this distance definition is applied to the two FSNs of Fig. 1, the distant is
A priori, this distance measurement should provide good results because it takes into account the two key factors of the FSN: it considers the distance that separates both values in the universe of discourse, and it also includes their membership degree.
The geometrical distance between two singletons could also be applied considering the FSNs as points in the space.
This distance also takes into account both the separation of the FSNs and their membership degree. However, these three distance measures all fail to consider whether the membership degrees of the singletons belong to the same fuzzy trapezoidal set or not.
This is the reason that a new method is needed to measure the distance between FSNs. To do so, it suffices to convert FSNs into a certain type of GFNs so that existing distance measures can be used.
The method proposed here to measure the distance between FSNs is based on the GFN similarity calculation reported by [24]. It provides sufficient sensitivity and coherence for the measurements.
The definition of the distance has been taken from [21]. These authors apply the simple center of gravity method (SCGM) to calculate the center-of-gravity points of trapezoidal or triangular GFNs. Then, they use the SCGM to propose a new method to measure the degree of similarity between GFNs.
Specifically, the similarity measure
where
with 0
Given two similarity measures,
Finally, the values
The following two properties can make the distance computation easier (the proofs are straightforward [20]):
Reflexivity: Two GFNs Symmetry: For any GFNs
In addition, other properties can considerably reduce the computation time [20].
Finally, the measure of the distance between GFNs is defined as a function of the similarity as follows,
However, this distance measure only applies to two GFNs, and not to FSNs (Fig. 1). In order to use Eq. (9) to calculate the distance between FSNs an intermediate step is necessary, that converts the problem of measuring two FSNs distance into measuring the distance between two equivalent GFNs.
In the literature there are several proposals to calculate the distance measure between fuzzy numbers, that are usually based on some features of the fuzzy sets [30, 31]. In the case of FSNs, the only available information is the input value and the membership degree. So in order to apply the distance definition given by Eq. (9) to the FSNs, they have to be transformed into GFNs in order to reconstruct the trapezoidal fuzzy sets and to work with them.
To do so signal processing theory is applied. The fuzzy set
The unit impulse function,
The convolution of two functions,
The convolution of the impulse function with any other signal scales (T) and delays (
Time signals that represent the fuzzification.
Then, the convolution of the fuzzy set
because
Convolution of 
In Fig. 3 (right),
As a result, a twofold effect is obtained. First, the amplitude of the new trapezoidal fuzzy number is scaled to the membership value of the FSN. Second, the fuzzy set is delayed, that is, it is shifted to the right the value of the input that is fuzzified. So, all the available information of a FSN is used to generate the corresponding new trapezoidal fuzzy number.
If this convolution process is applied to the FSNs
Result of applying the convolution to the fuzzy singletons of Fig. 1.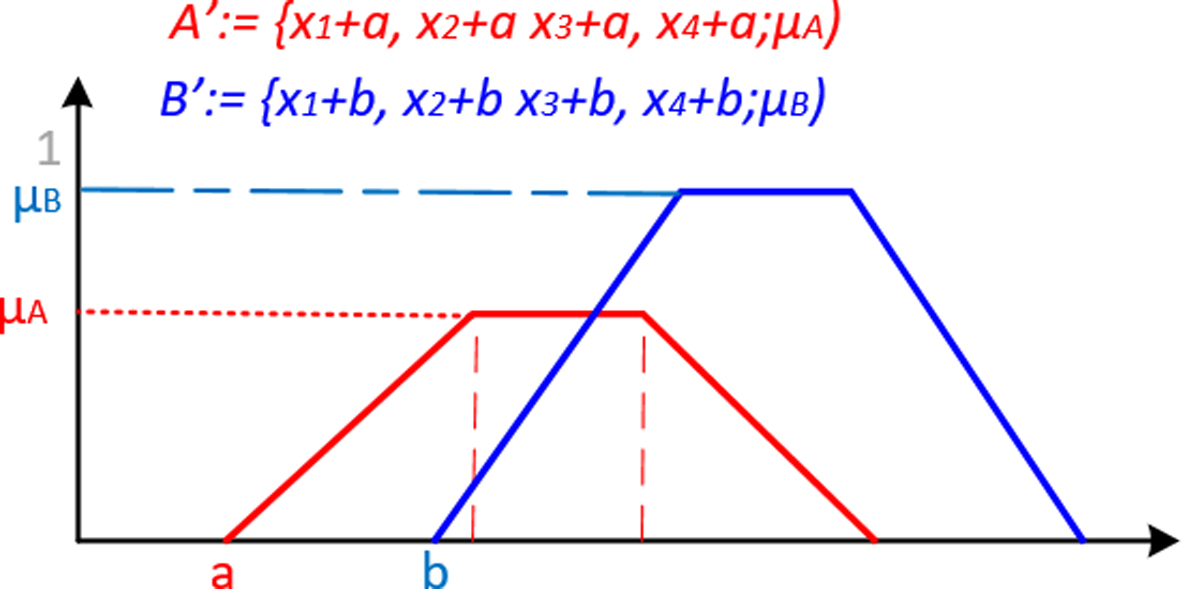
Displacement of the two fuzzy singletons.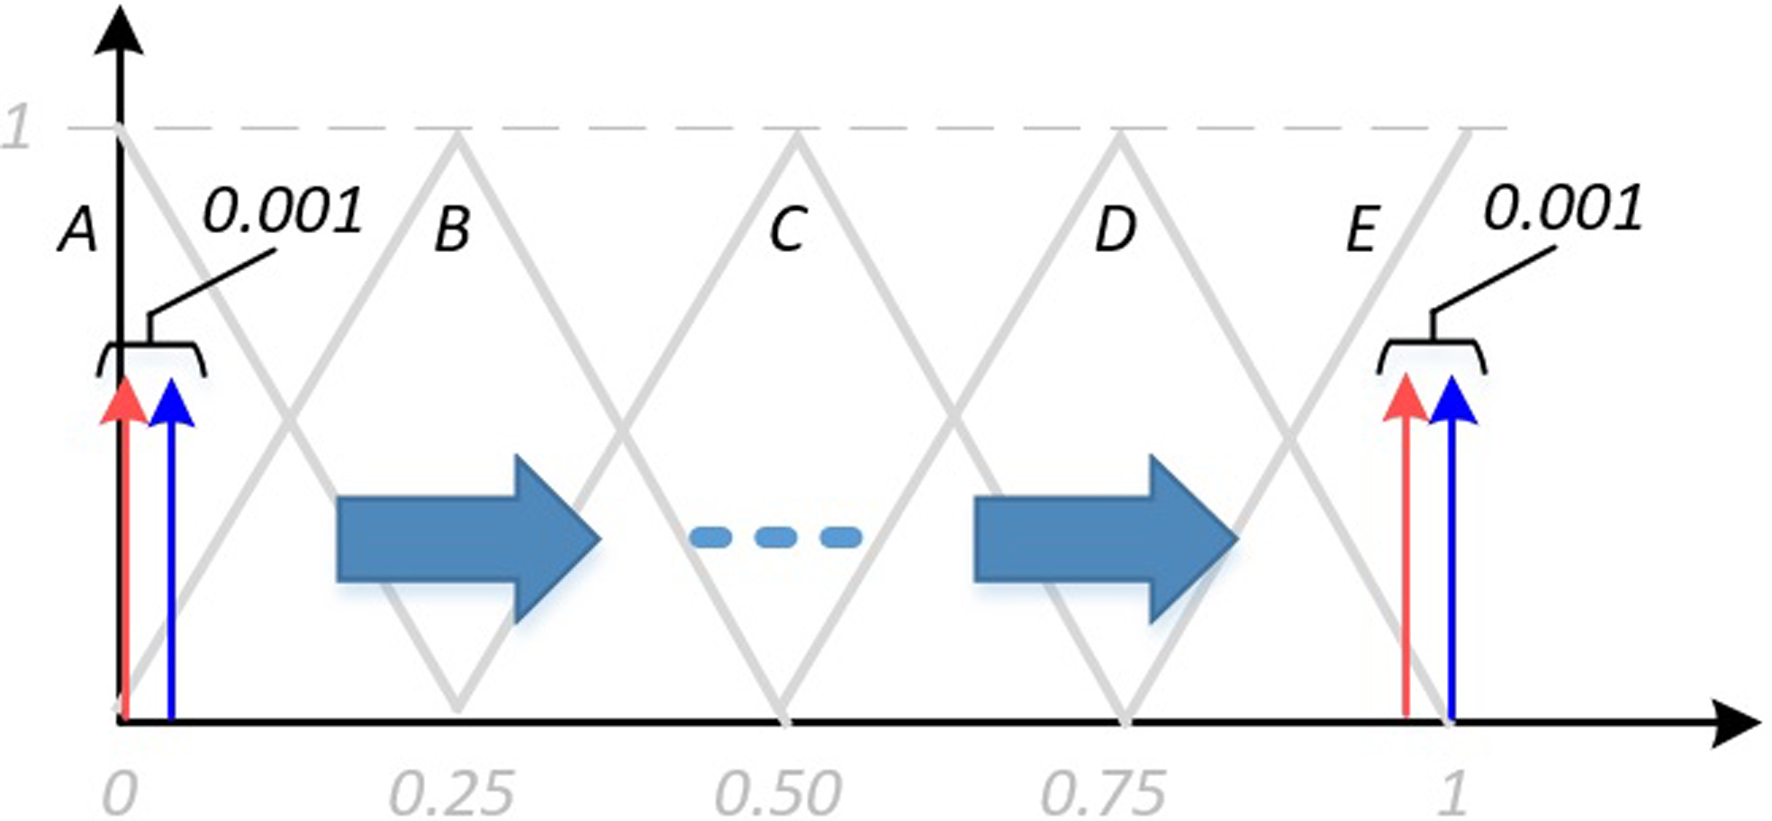
The distance definition given by Eq. (9) can now be applied on these new GTFNs,
The new distance measure between FSNs proposed here is compared with two classical distance measurements, the Euclidean distance Eq. (1) and a modified version of this one, the weighted distance Eq. (2). This will highlight that not any distance or similarity measure between FSNs suits any application. A conceptual example (Section 5) and a real pattern recognition application (Section 6) will show this.
Comparative of the three distances applied to two fuzzy singletons.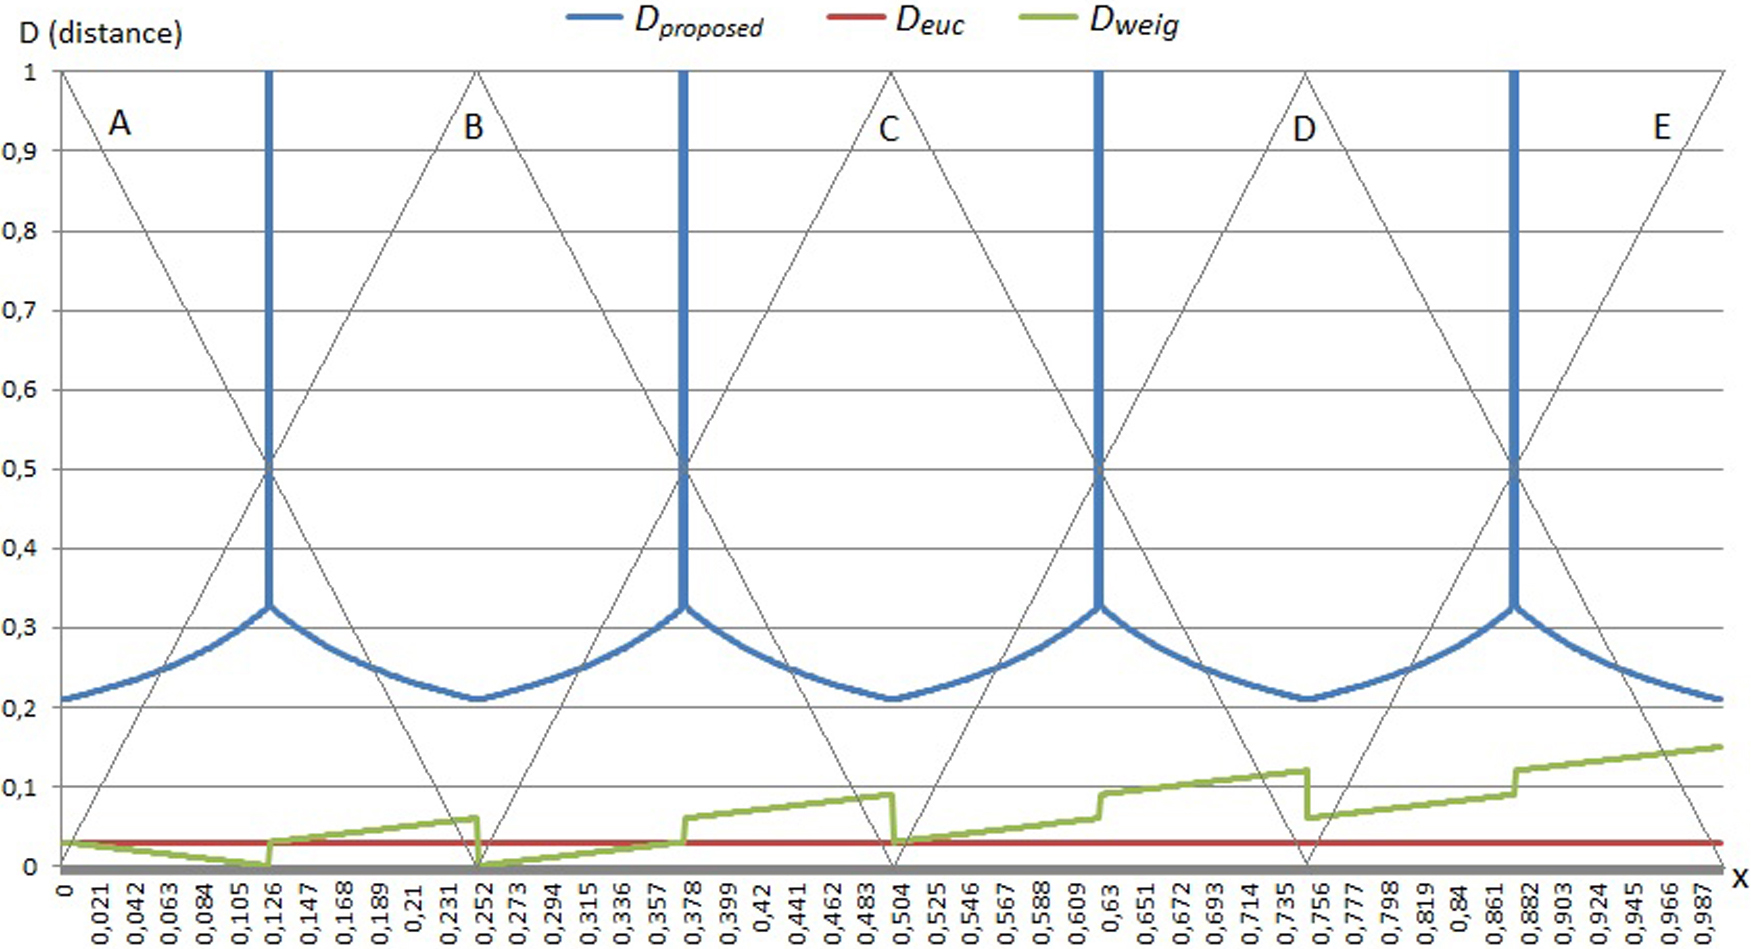
The theoretical scenario is as follows. Let
Now, two very close crisp inputs in that domain, say
These FSNs are shifted to the right along the domain interval. The initial and final positions of the two FSNs are shown in Fig. 5. The distance between those FSNs is calculated at every point of the interval by applying Eqs (1), (2) and (9), the three distance measures that are going to be compared, namely Euclidean, Weighted and Proposed one. In the last case, before using Eq. (9) to calculate the distance, the two FSNs have been transformed to GTFNs.
Note that the distance is a measure of the similarity. Thus, intuitively, the distance between two FSNs should be larger when they are in different fuzzy sets, and smaller when they are in the same fuzzy set. So, if the FSNs belong to different fuzzy sets, that should be somehow shown in the value of the distance between them. This would mean that they may not be so similar, even if they are “physically” very close in the input universe of discourse (
Following with the example, to say that different FSNs belong to the same fuzzy set means that the two FSNs (blue and red arrows in Fig. 5) have their maximum membership degree in the same fuzzy set (though the membership degree could be different). For example, if they were located at 0.2500
The three distance measures have been applied to those two FSNs along the interval. Figure 6 shows how each fuzzy distance calculation method performs. Given the small values obtained by the classical distances and the very large values the proposed fuzzy distance gives at the transitions points of the fuzzy sets, in order to visually compare them on the same figure, the three of them have been scaled (multiplied by 30) and then normalized to better discriminate the values.
The Euclidean distance (red line) gives always, as expected, the same distance value of
The weighted distance (green line) does not have the desired performance either. In this case, small jumps are obtained at the intersections of the fuzzy sets but the distance should be much greater when a FSN belongs to one fuzzy set and the other one to the adjacent fuzzy set. Besides, there are some peaks in these fuzzy regions that should be minimums. Finally, there is an upward trend due to the fact that, as the membership function is multiplied by the value of the
On the contrary, the proposed method (blue line) has a consistent behavior throughout the input domain, obtaining the maximum distance at the intersections of the fuzzy sets and presenting a perfectly periodic behavior. The spikes at the transitions of the fuzzy sets mean that each FSN belongs to a different fuzzy set.
Therefore, classical distance measures give small distance values between FSNs that belong to different fuzzy sets when, intuitively, it should be the opposite. If they belong to different fuzzy sets the similarity should be smaller than if they belong to the same one. Belonging to a fuzzy set means sharing that characteristic with certain degree. On the contrary, our proposal takes that into account and performs as should be expected.
This different performance of the distance definitions can be used for different purposes. For example, in reference [5] several fuzzy distances are classified with respect to the requirements needed for different applications in image processing under imprecision. In the next section the proposed distance definition will be proved more suitable for a real forecasting fuzzy system in terms of accuracy.
Most of real applications deal with crisp values (analogical signals) and so they have to be fuzzified in order to apply any fuzzy inference system. A crisp input that is fuzzified with the Mamdani fuzzification method (most common) results in a particular type of fuzzy set, a fuzzy singleton.
In fuzzy pattern recognition applications, the way the similarity is measured between the fuzzy patterns can influence the final results [34, 35].
In this section a real fuzzy forecasting system is presented where two distance measures between FSNs are used and compared. The pattern recognition systems predicts the next session of a stock market [36].
The results of applying the new distance measure are going to be compared to the results obtained with the Euclidean distance for the very same scenarios, the American Nasdaq100 market and the Spanish Ibex35 [37]. The traditional Buy and Hold investment strategy is also used as a benchmark.
The fuzzy investment recommendation system uses fuzzy Japanese candlesticks to represent the stock market sessions. Candlesticks summarize the price evolution of commodities or indexes at each session by 4 parameters: Open (value at the beginning of the trading session), High (maximum value reached), Low (minimum value reached), and Close (value at the end of that session) (Fig. 7).
Japanese candlesticks.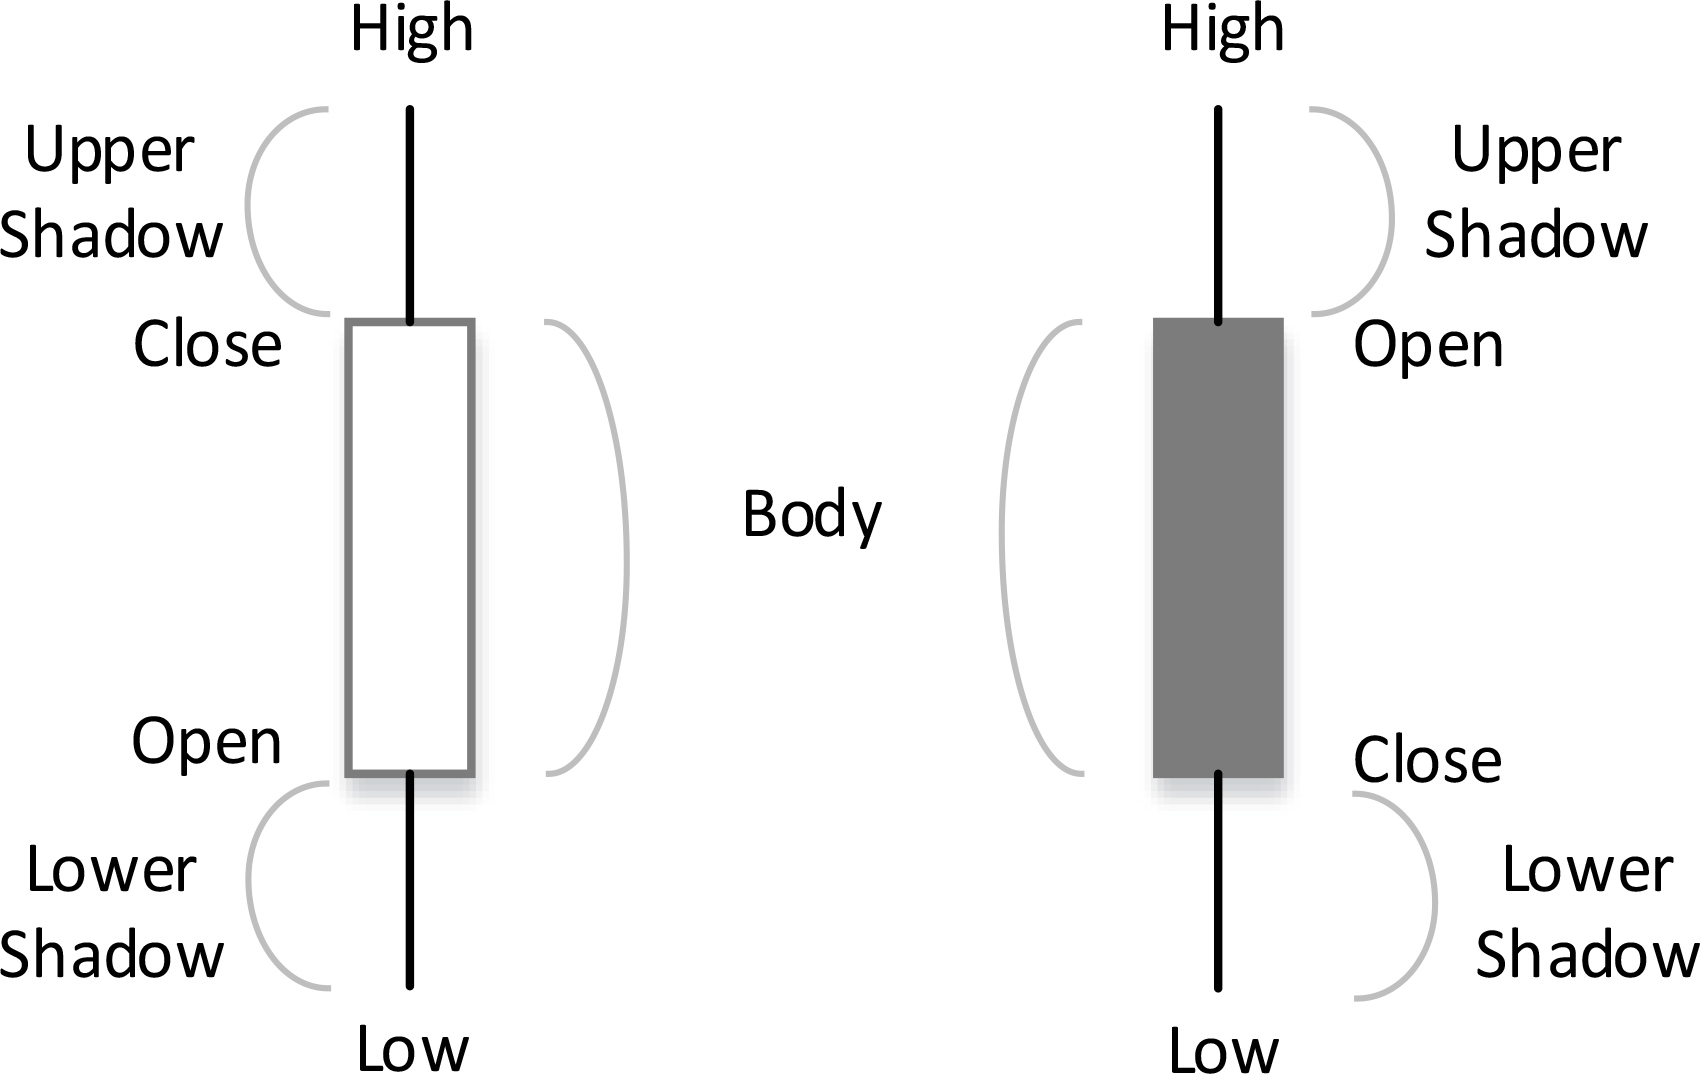
Three parts can be distinguished in a candle (Fig. 7): the body, which represents the variation between the open and the close values; the upper shadow, which is the price difference between the maximum value (high) and the open or close value (depending on whichever is higher); and the lower shadow, which is given by the price variation between the minimum price (low) and the close or open value (depending on whichever is lower).
Evolution of the capital ($) for the validation period with the three strategies (Nasdaq market).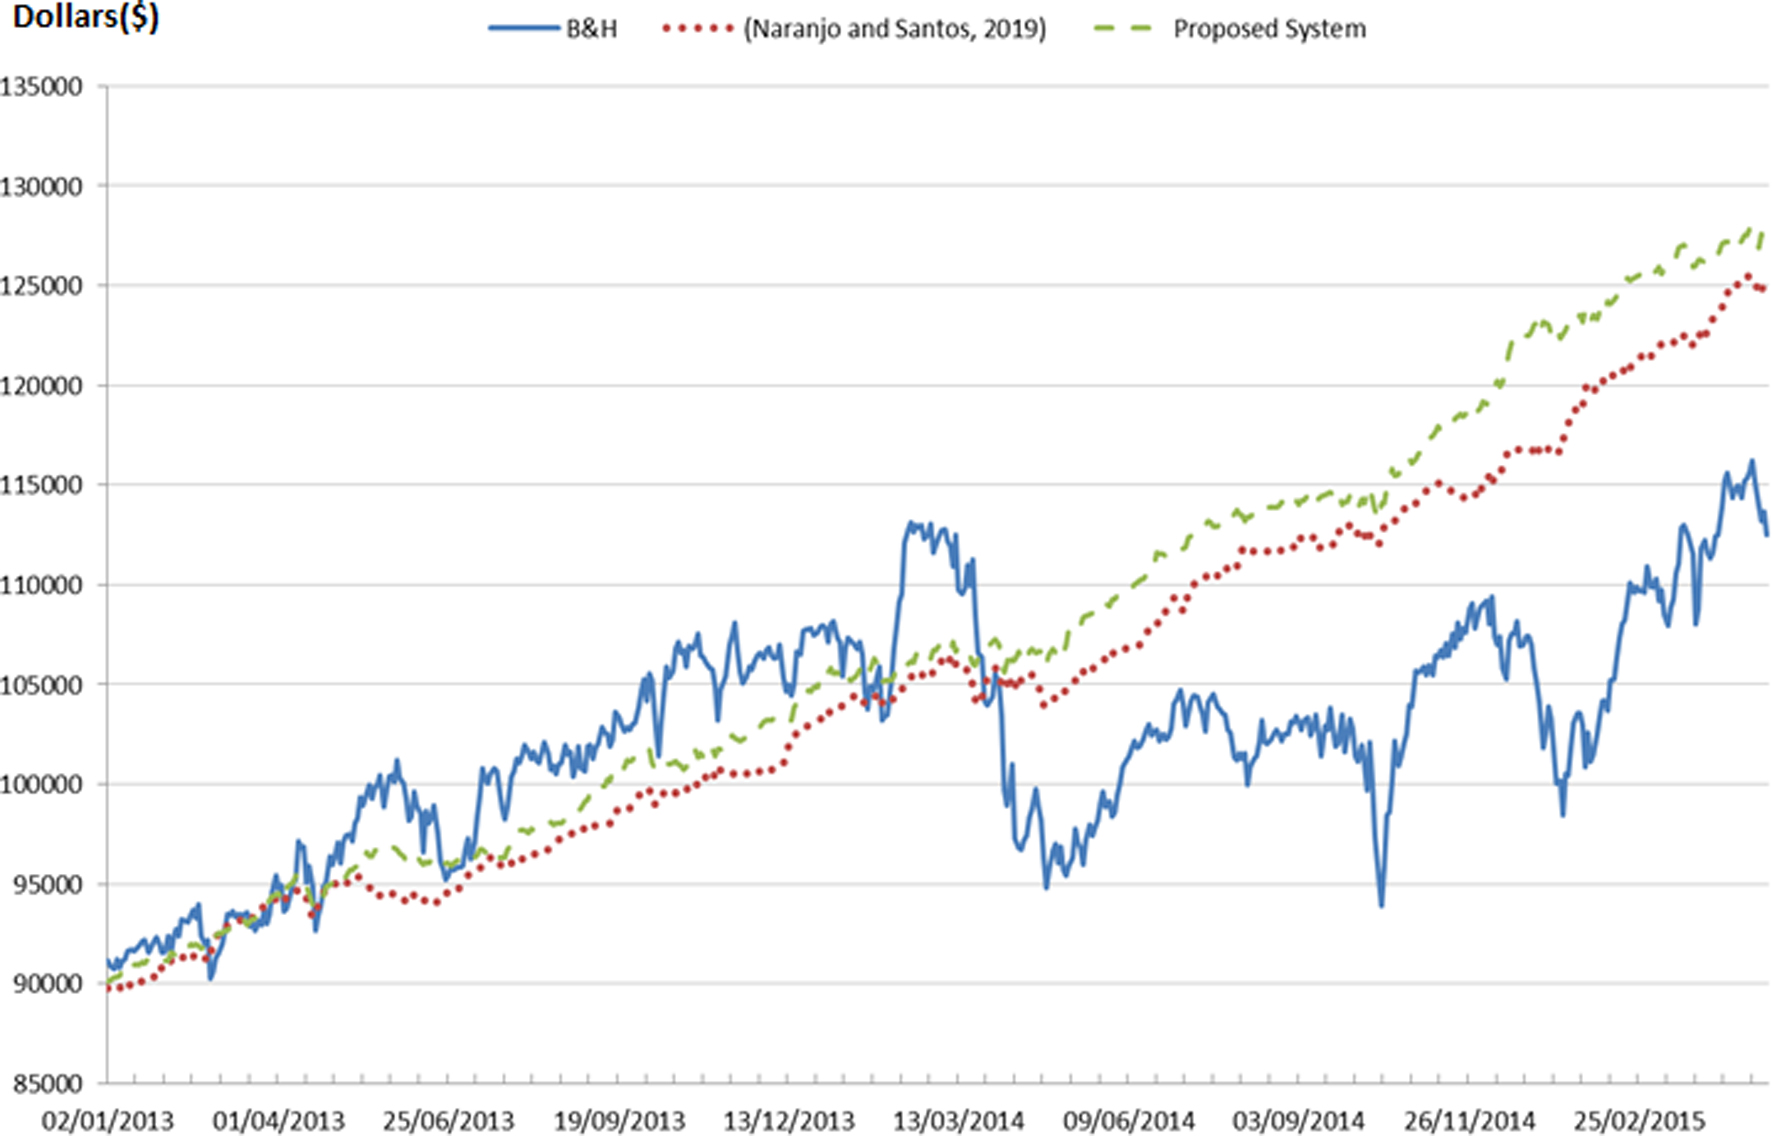
The financial investment fuzzy system has as inputs the upper shadow, the lower shadow and the body size of the candle (percentage), namely
The values of these variables have been fuzzified by the Mamdani method using triangular and trapezoidal fuzzy sets. The 224 resulting rules relate the candle body size to the whole candle itself (
IF
Product operator is used for the implication and the centroid as defuzzification method.
The two output variables (
To determine the similarity between neighbors, the Euclidean distance Eq. (1) and the new proposed similarity measure Eq. (9) are applied.
Before applying Eq. (9), the Rsize and Rpos singletons are transformed to trapezoidal fuzzy numbers using the mathematical convolution, as explained in Section 4.1.
In the next subsections, results of this intelligent investment forecasting system with the new FSN distance measure, called “proposed system”, and with the Euclidean distance as in [37], are presented. Moreover, they have been compared to the Buy and Hold (B&H) investment strategy, commonly used as a benchmark in stock markets. This consists of investing all the capital at the beginning of the trading period (buy) and then selling all the shares at the closing price of the previous session.
They have been applied to two very different scenarios, the American Nasdaq-100 market and the Spanish Ibex 35 market.
Results with the fuzzy investment system and the new distance measure method (Nasdaq market)
To see how the distance measure between FSNs influences the results in the real investment fuzzy system, the Euclidean distance and the proposed here one have been applied to the American Nasdaq-100 stock market over the same training (2011–2012) and validation periods (2013–2015) that were used in [37], in order to compare the results.
Figure 8 shows the evolution of the invested capital (in terms of variations of the share prices over time) over the validation period for the B&H strategy and the fuzzy trading system with the two different distance measures under study. The lines of Fig. 8 represent the closing price of each session for each strategy.
The B&H strategy (blue line) eventually gives the lowest profit (25.04%) even if the first three months is slightly better than the other two fuzzy investment strategies. Regarding the maximum Drawdown index (max DD), often used to determine the risk a financial investment faces, which graphically can be spotted around the 17th October 2014 (a great fall of capital), the value obtained with the B&H technique, 16.97%, would be considered too high for most of the investors, who would have exited the market at that stage to limit the losses with a smaller profit. Note that the maximum drawdown is an indicator of downside risk over a specified time period.
The fuzzy investment systems with different distance definitions behave approximately the same until the first quarter of 2014, being the proposed one (dashed green line) always slightly better than the other. From April 2014 the fuzzy system with the new proposed distance measure method begins to differentiate from the one that uses the Euclidean distance (dotted red line).
This better behavior of the new system remains constant until approximately October 2014, when it begins to outperform the other one clearly. This coincides with a downward trend in the market. Although both fuzzy systems obtain profits, the fuzzy investment system with the new distance definition gives better results when the financial market declines.
The 15 commodities of Nasdaq-100 used to test the investment strategies are listed in Table 1 (first column: Apple, APPL; Adobe, ADBE; Analog Devices, ADI; and so on).
The results of the two fuzzy investment systems, the one with the Euclidean distance [37], and the one with the new method to calculate the distance (Table 1), are presented in terms of some figures that show the profits the investors get during the market trading sessions. These indicators are: Net Profit (first column); the maximum drawdown (Max DD); the number of total, positive (
Results of Table 1 are compared with those in [37] for the same stock market and time period. The new fuzzy investment system achieves slightly greater profits, specifically 41.61% vs 38.53%, i.e., 7.05% more, and besides it requires a smaller number of operations (3.76% less). This is important because the operations have an associate costs, which in this paper has not been taken into account as this cost depends on the broker who operates. Indeed, the percentage of profitable operations (trades
The proposed system obtains a MaxDD similar to the one of [37], although slightly higher; however, these values indicate a risk still acceptable to investors that could be justified by the greater profits with less costs that it gives.
The “Average trade” columns, which indicate the money win or lost per operation, show that there are not big differences between both fuzzy investment systems, which have obtained values above one, proving to be winning systems in the long term.
Evolution of the capital (€) for the validation period with the three strategies (Ibex35 market).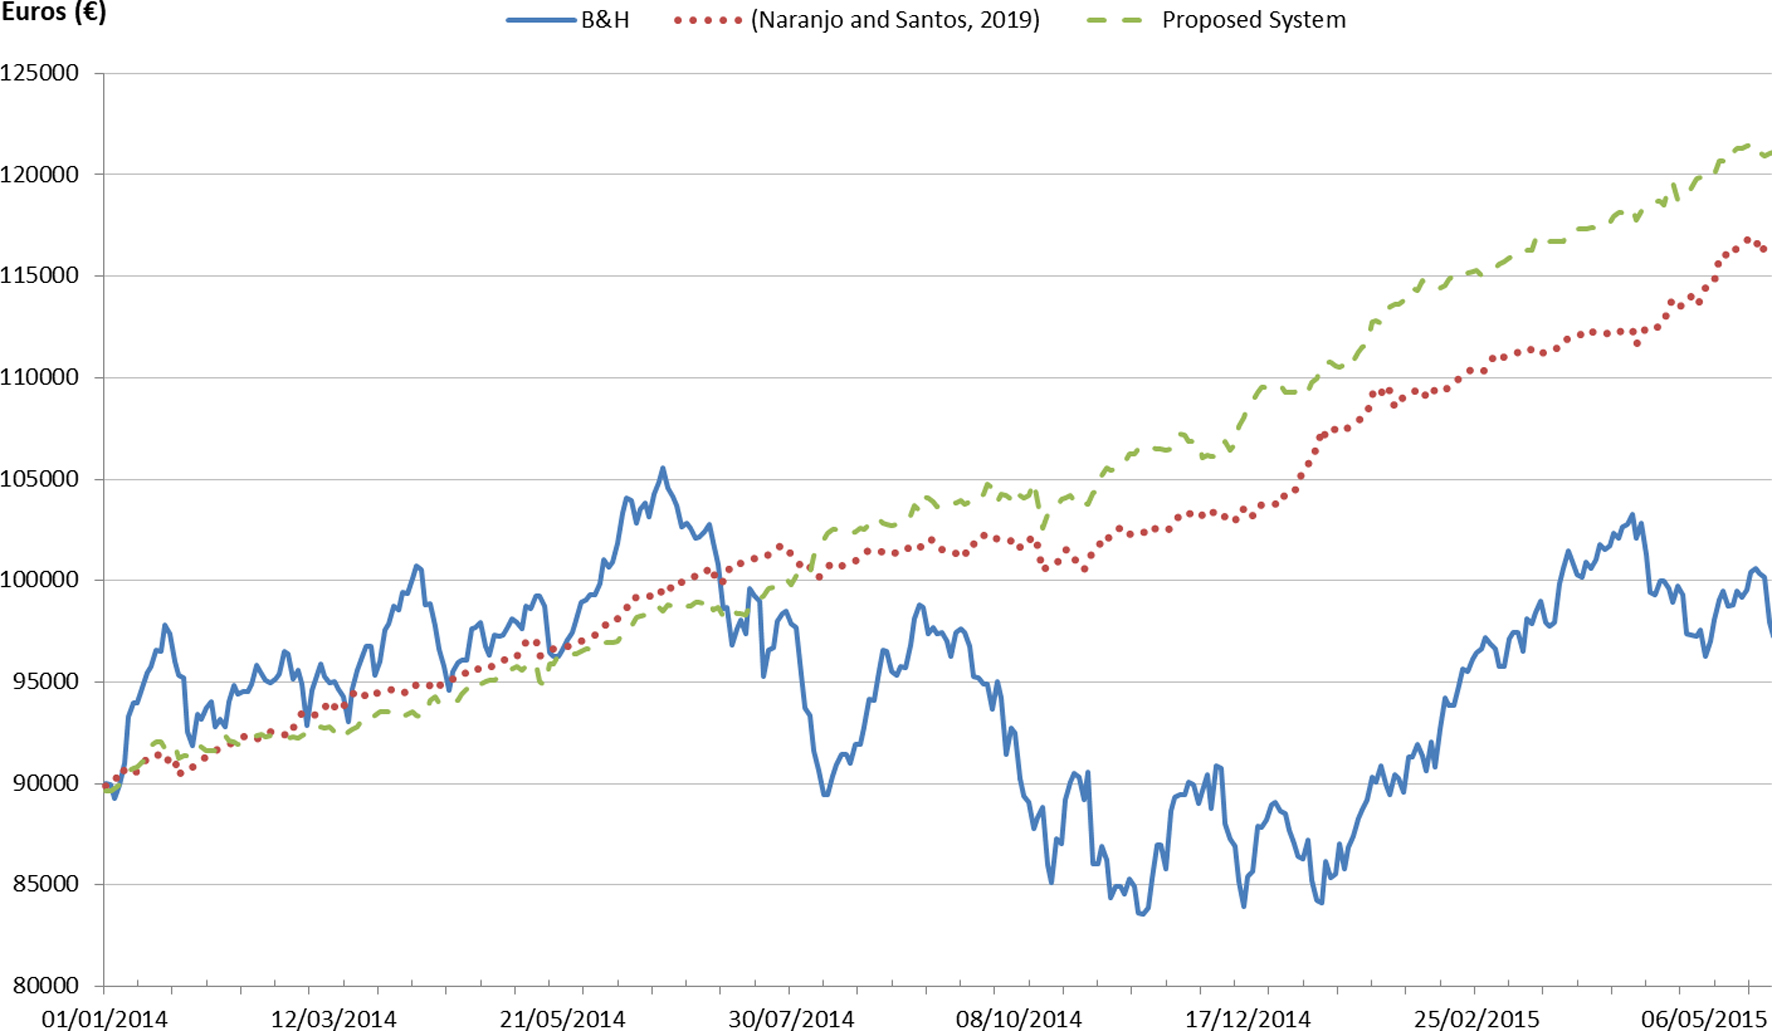
In conclusion, for the American Nasdaq market scenario, using the new definition of distance between FSNs in the fuzzy investment system results in an increase in profits without appreciable differences in the MaxDD risk indicator, a reduction in the number of operations, and an apparent improvement of the market behavior in downtrend.
These better results may be due to the fact that the prediction error is reduced when the new distance calculation method is used.
The same analysis has been carried out for the Spanish Ibex 35 market, in a portfolio of 15 companies from different sectors: banks, technology, construction, real estate, airport, telecommunications, electricity and gas, etc. The training and validation periods are the same as in [37], that is, years 2011–2013 for training and 2014–2015 for validation.
Again, both fuzzy investment systems (with the Euclidean and the new proposed distance measure method) have been compared with the B&H benchmark. The evolution of the three strategies over the validation period for the Ibex35 index is shown in Fig. 9.
Results with the fuzzy investment system and the new distance measure method (Ibex35 market)
Results with the fuzzy investment system and the new distance measure method (Ibex35 market)
As it is possible to see in this Fig. 9, during the market upward trend, that is, from the beginning of 2014 until about July 2014, the here proposed fuzzy system (dashed green line) obtains slightly less profits than the system proposed in [37] (dotted red line). However, when the market trend changes, the new investment fuzzy system begins to increase profits, surpassing the other strategies. This fact confirms the effect also observed in the Nasdaq market, that the system with the new distance definition improves the prediction for markets with downtrend.
The same market performance measures of Table 1 for the fuzzy investment system with the new distance definition have been calculated for this stock market, and have been compared to the fuzzy trading system presented in [37] that uses the Euclidean distance.
In this case the prediction errors during the training period were even smaller than with the Nasdaq market. Despite obtaining losses in 2 of the 15 companies, a considerable improvement in total profits is achieved, even greater than in the Nasdaq market. Specifically, for the Spanish market the new fuzzy system obtains a profit of 37.93% compared to 33.44% obtained in [37], which implies an improvement of 13.44%. In addition, there is a reduction in the number of operations, 8.37% less (larger reduction than in the Nasdaq market).
Although the profitable operation rate in this stock market is slightly lower than in [37], 52.5% vs. 53.2%, the global results of the system with the new fuzzy distance definition are better as it gets greater profits with a lower number of operations. This can be seen in the average profit trade column, where in 10 out of the 15 cases the proposed system obtains higher values. It can also be observed in the average loss trade column, that is better in 9 out of the 15 companies and in the Avg profit/avg loss column, where it improves in 10 cases.
Regarding the risk MaxDD indicator, this fuzzy investment system obtains a maximum drawdown similar to the ones obtained in [37], that is,
These results show the utility of this new approach. Even more, in any fuzzy pattern recognition applications, such as this fuzzy stock market forecasting system that deals with fuzzy Japanese candlesticks, the inputs are usually crisp values that have to be fuzzified in order to apply any fuzzy inference. Once an input is fuzzified using the Mamdani method they are now FSNs. The pattern recognition system requires the application of a distance measure to obtain the similarity between the patterns. In the case of FSNs, the classical Euclidean distance does not take the fuzzy membership into consideration. It inevitably results in a substantial loss of information of the underlying fuzzy number.
That is why the new proposed distance measure method, that takes into account all the information of the fuzzy numbers, gets more accurate results in the prediction of the next stock market session. These better results are shown in terms of smaller prediction errors and greater profits.
Therefore, the new distance measure between FSNs proposed here may be an option to be taken into account in the development of distance-based forecasting fuzzy systems.
This paper presents a new method to measure the distance between two fuzzy singletons. In particular, it first transforms a FSN that results from the fuzzification of a crisp value into a generalized trapezoidal fuzzy number using the mathematical convolution. Then an existing distance for GFNs is used.
Three distance measures, the Euclidean, the weighted distance and the one proposed here, are tested in a theoretical example. The new method to obtain the distance between FSNs gives coherent results regarding what it can be expected in a fuzzy scenario.
This new distance measure between FSNs is applied to a pattern recognition problem of stock market forecasting with real data. The investment fuzzy system that uses this new distance is compared with the same trading fuzzy system with the Euclidean distance on the same markets, the American Nasdaq and the Spanish Ibex35. Results show that the new distance definition provides more accurate results (smaller prediction error percentages) and thus it gives greater profits with the same investment strategy.
As the distance between FSNs is used as a measure of the similarity in many decision-making systems this could be an valuable contribution.
As future work, it may be interesting to try new fuzzy distance definitions, such as the geometrical one, to analyze if its performance does not differ too much from the Euclidean distance, as it can be expected. Other possible future research lines are to use different fuzzy sets, such as Gaussian, sigmoidal, etc., to define the generalized fuzzy numbers, and to apply this approach to other applications of different fields to validate its robustness.