
Abstract
This study establishes the new results for Cluster Width of probability Density functions (CWD). There are the upper and lower bounds of CWD and the relationships of CWD to other measures in statistical discriminant. The CWD for two and more two probability density functions is determined in the different cases. Based on CWD, we propose a measure called similar coefficient to evaluate the quality of the established clusters. Furthermore, CWD is also used as a criterion to build two algorithms: to determine the suitable number of clusters and to analyse the fuzzy clusters. The numerical examples are given to illustrate the proposed algorithms and to prove their advantages over existing methods.
Introduction
Clustering that can partition unknown large data in to groups so that whose elements in each group have the similar properties is a basic method in data mining and statistics. It is the important first step to understand some basic information from data before implementing some more depth analysis. In global trend, storing, extracting and analyzing data play an important role and have a great influence on the development of the different science subjects. For this reason, cluster analysis has been of interest to many statisticians so far [1, 8]. It is possible to build clusters for discrete elements (CDE) [2, 4] and clusters for probability density functions (CPD) [21]. The CPD, which is useful for mining the data with high volumes and uncertain sources, has attracted the considerable interest of many researchers. It also provies more advantages than CDE in many applications [1, 21]. In both cases, the most important problem is to find a suitable criterion for building clusters and to evaluate their quality. For CDE, the distance is the main criterion. There are Euclidian distance, Chebyshev distance, city block distance, etc. for two elements and the minimum distance, the maximum distance, the mean distance, etc. for two groups [22]. For two pdfs, some types of distances have been widely used such as the
In fuzzy cluster analysis, one of the most challenging problem is how to determine the suitable number of clusters. In the literature, the number of clusters can be determined by prior knowledge about the data. Vovan and Pham-Gia [21] proposed the algorithm with a bound on CWD to solve this problem. However, the result of this algorithm still depends on the CWD and intercluster distances. For this reason, this algorithm is not suitable for many cases. Chen and Hung [1] and Thao and Vovan [18] also gave a method to automatically determine the number of clusters. Many examples show that this algorithm has more advantages than previous proposed methods. However, it is only suitable in case where the overlapping-degree of the pdfs is not too great. Many applications show that the number of determined clusters by this method is incorrect. Based on CWD, we propose an algorithm to determine the Suitable Number of Clusters (SNC) that is more advantages than existing methods. Another problem is the quality evaluation of established clusters. In our knowledge, there is no interest about this problem so far. We need to construct a criterion to compare similar level of clusters whose number of elements are distinctly different. For this reason, we propose a new measure called Cluster Similar Coefficient (CSC) of pdfs. The advantages of the two proposed algorithms are tested by the numerical examples. All computational problems of the proposed algorithms are performed by the Matlab procedures. They offer effective method for the complicated calculations of the numerical examples.
The remaining part of the paper is arranged as follows. Section 2 presents the definition CWD and related concepts. This section also determines the CWD of two and more than two pdfs. Section 3 gives some results about CWD. Section 4 proposes two new related algorithms for fuzzy clustering of pdfs. Section 5 presents the numerical examples including the synthetic data, benchmark data and real data. The final section is the conclusion of the paper.
Width cluster of probability density functions
Some definitions
Let
.
CWD of
If
.
Let
From Eqs (1) and (2), we have the following results:
The relations concerning to the CWD of two consecutive clusters that differ by only one element and those of two clusters and their union are obtained as follows:
where
For
.
CSC of
The CSC of a cluster with only one pdf is defined as 1.
We have
Because
From the above results, we obtain
The equality on the right of Eq. (5) occurs when all
From Eq. (4), we see that CSC determines the overlapping level of pdfs, and it has been standardized on [0,1]. We may consider that the CSC is the mean of overlapping coefficients of pdfs. The larger the CSC is, the higher the similarity degree of the pdfs is.
(i) For two pdfs
Let
From the above result, we can establish the specific expressions for CWD where
(ii) For more than two pdfs
.
Let
The width cluster of
Proof..
To obtain Eq. (7), we need to prove the following two results:
And
Let
From Eq. (7), we obtain
Therefore,
On the other, from antithesis style of DMorgan, we have
Similarly,
So
In addition, from Eq. (6) we can directly find out
∎
(iii) In real application, for one-dimension, we have built an algorithm to find the specific expression for
The graph of seven one-dimension pdfs and their 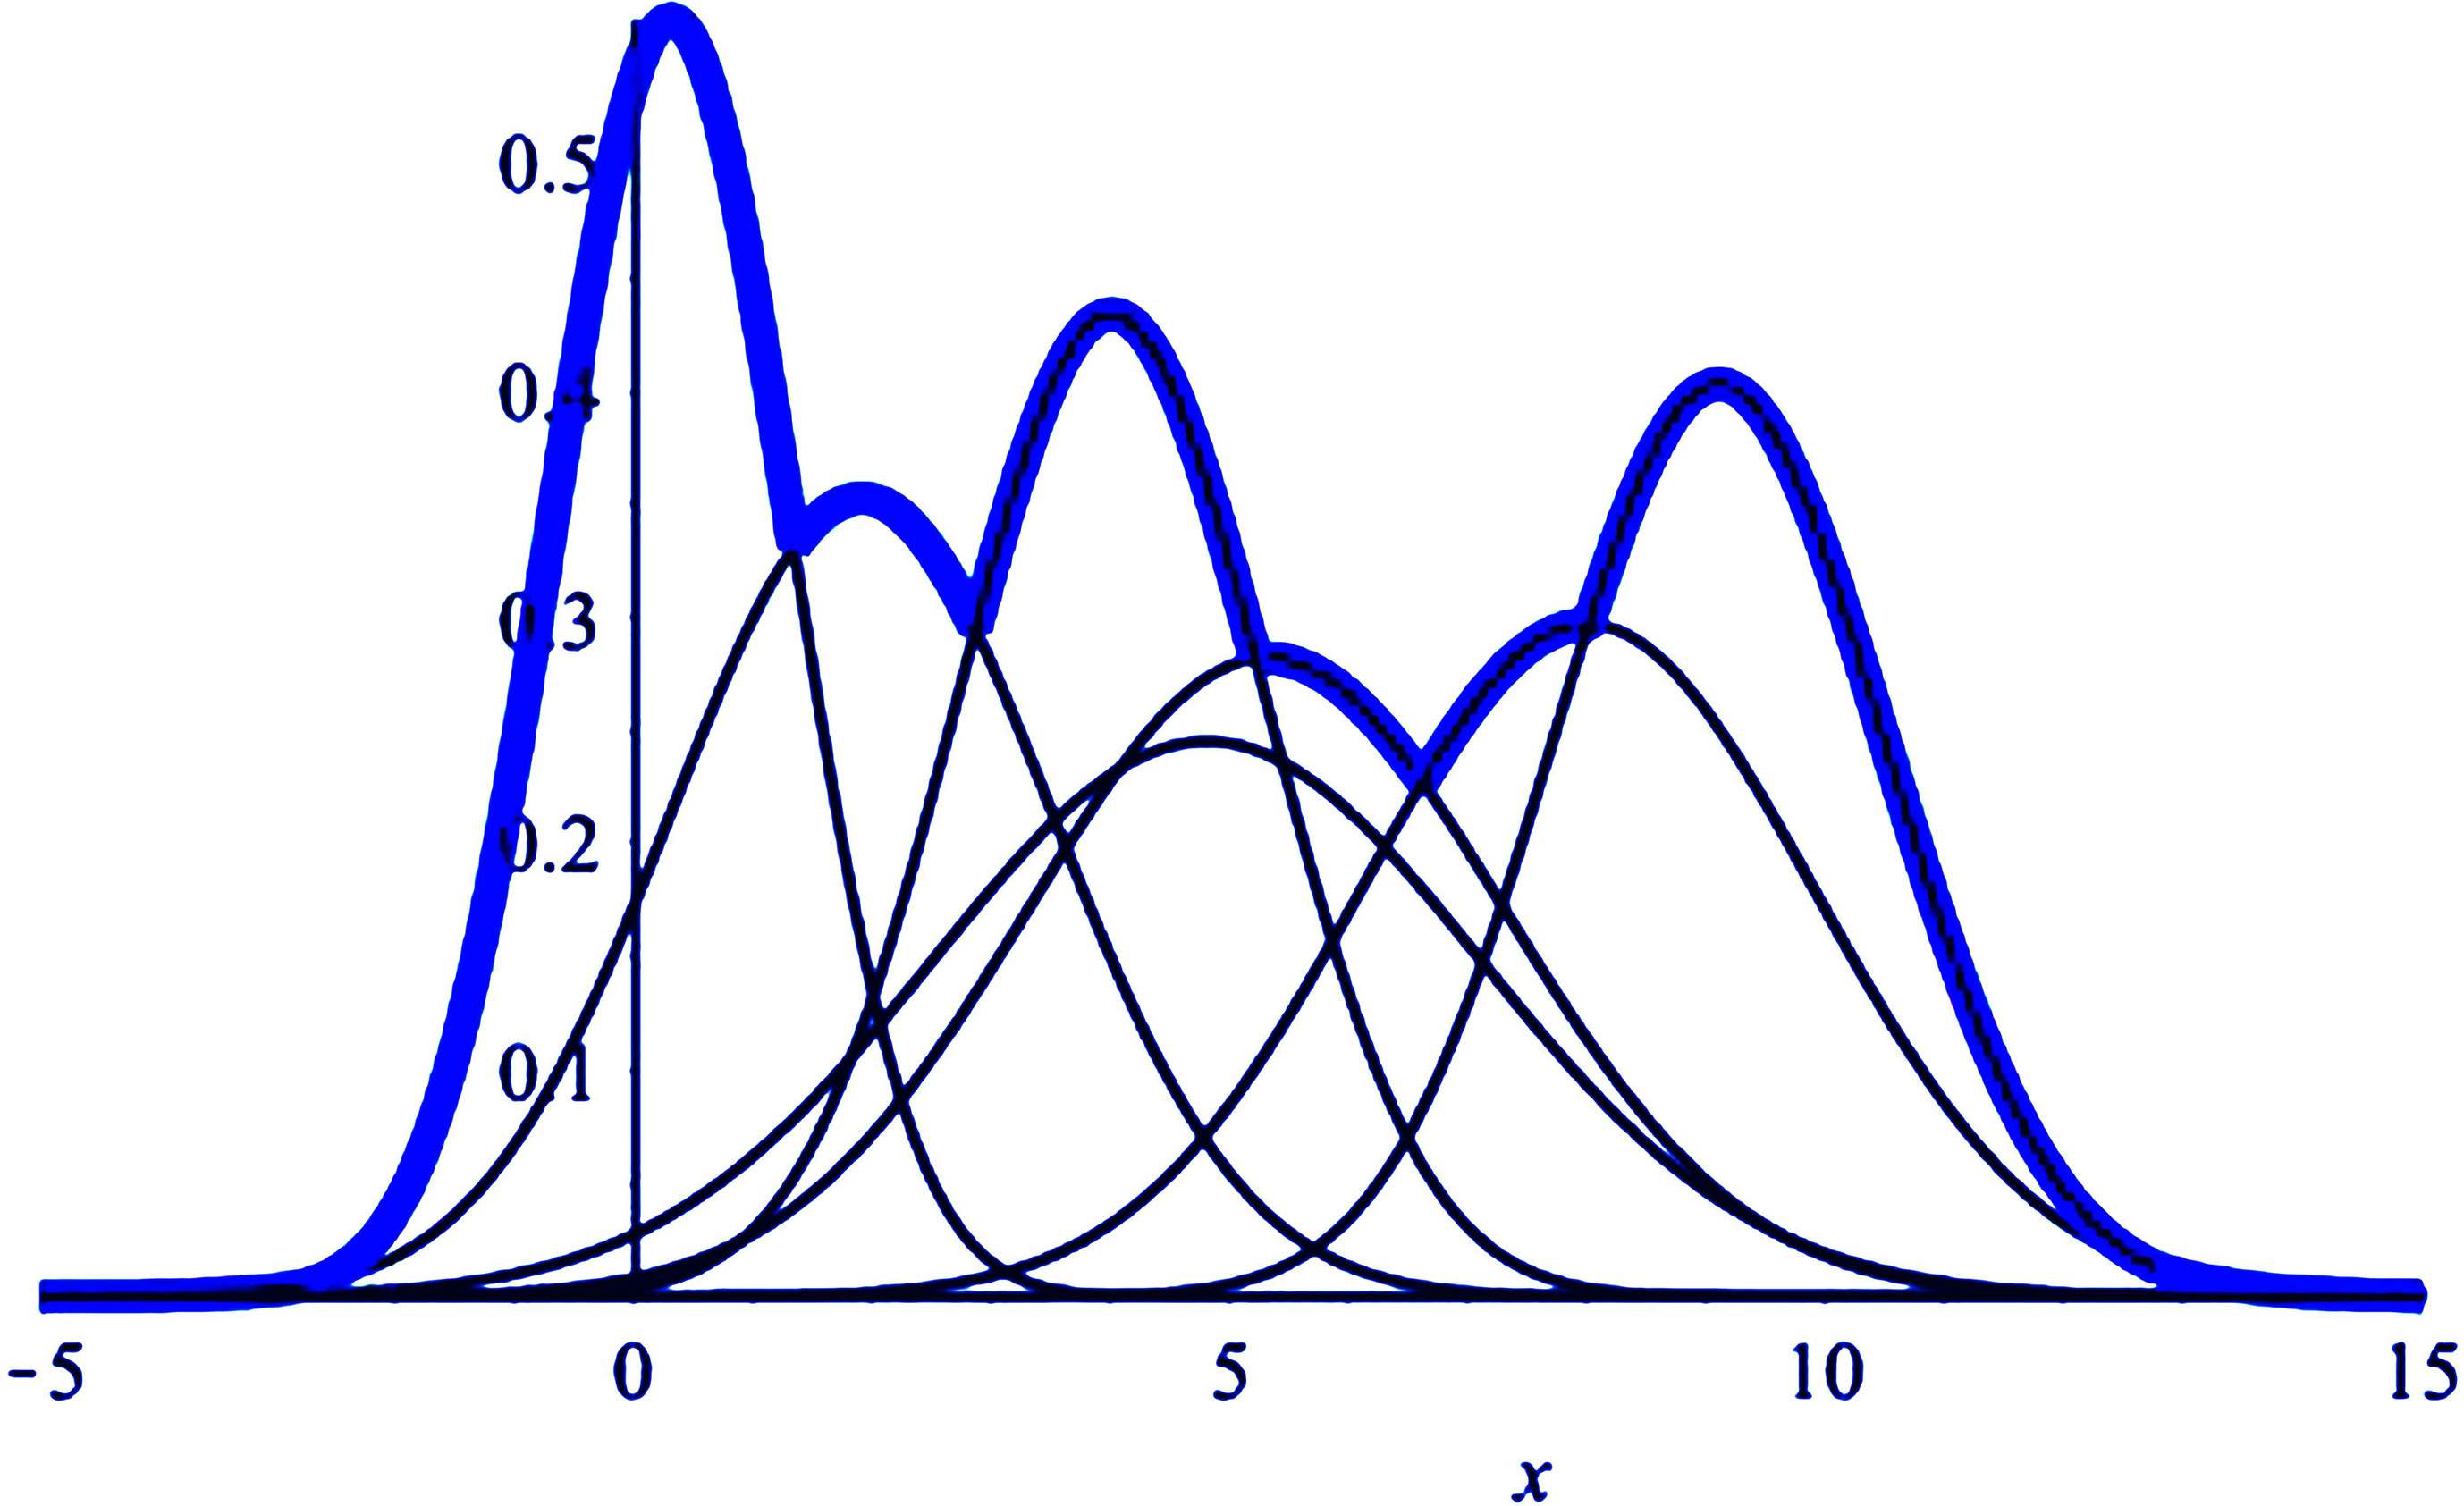
The graph of three bivariate normal pdfs and their intersections.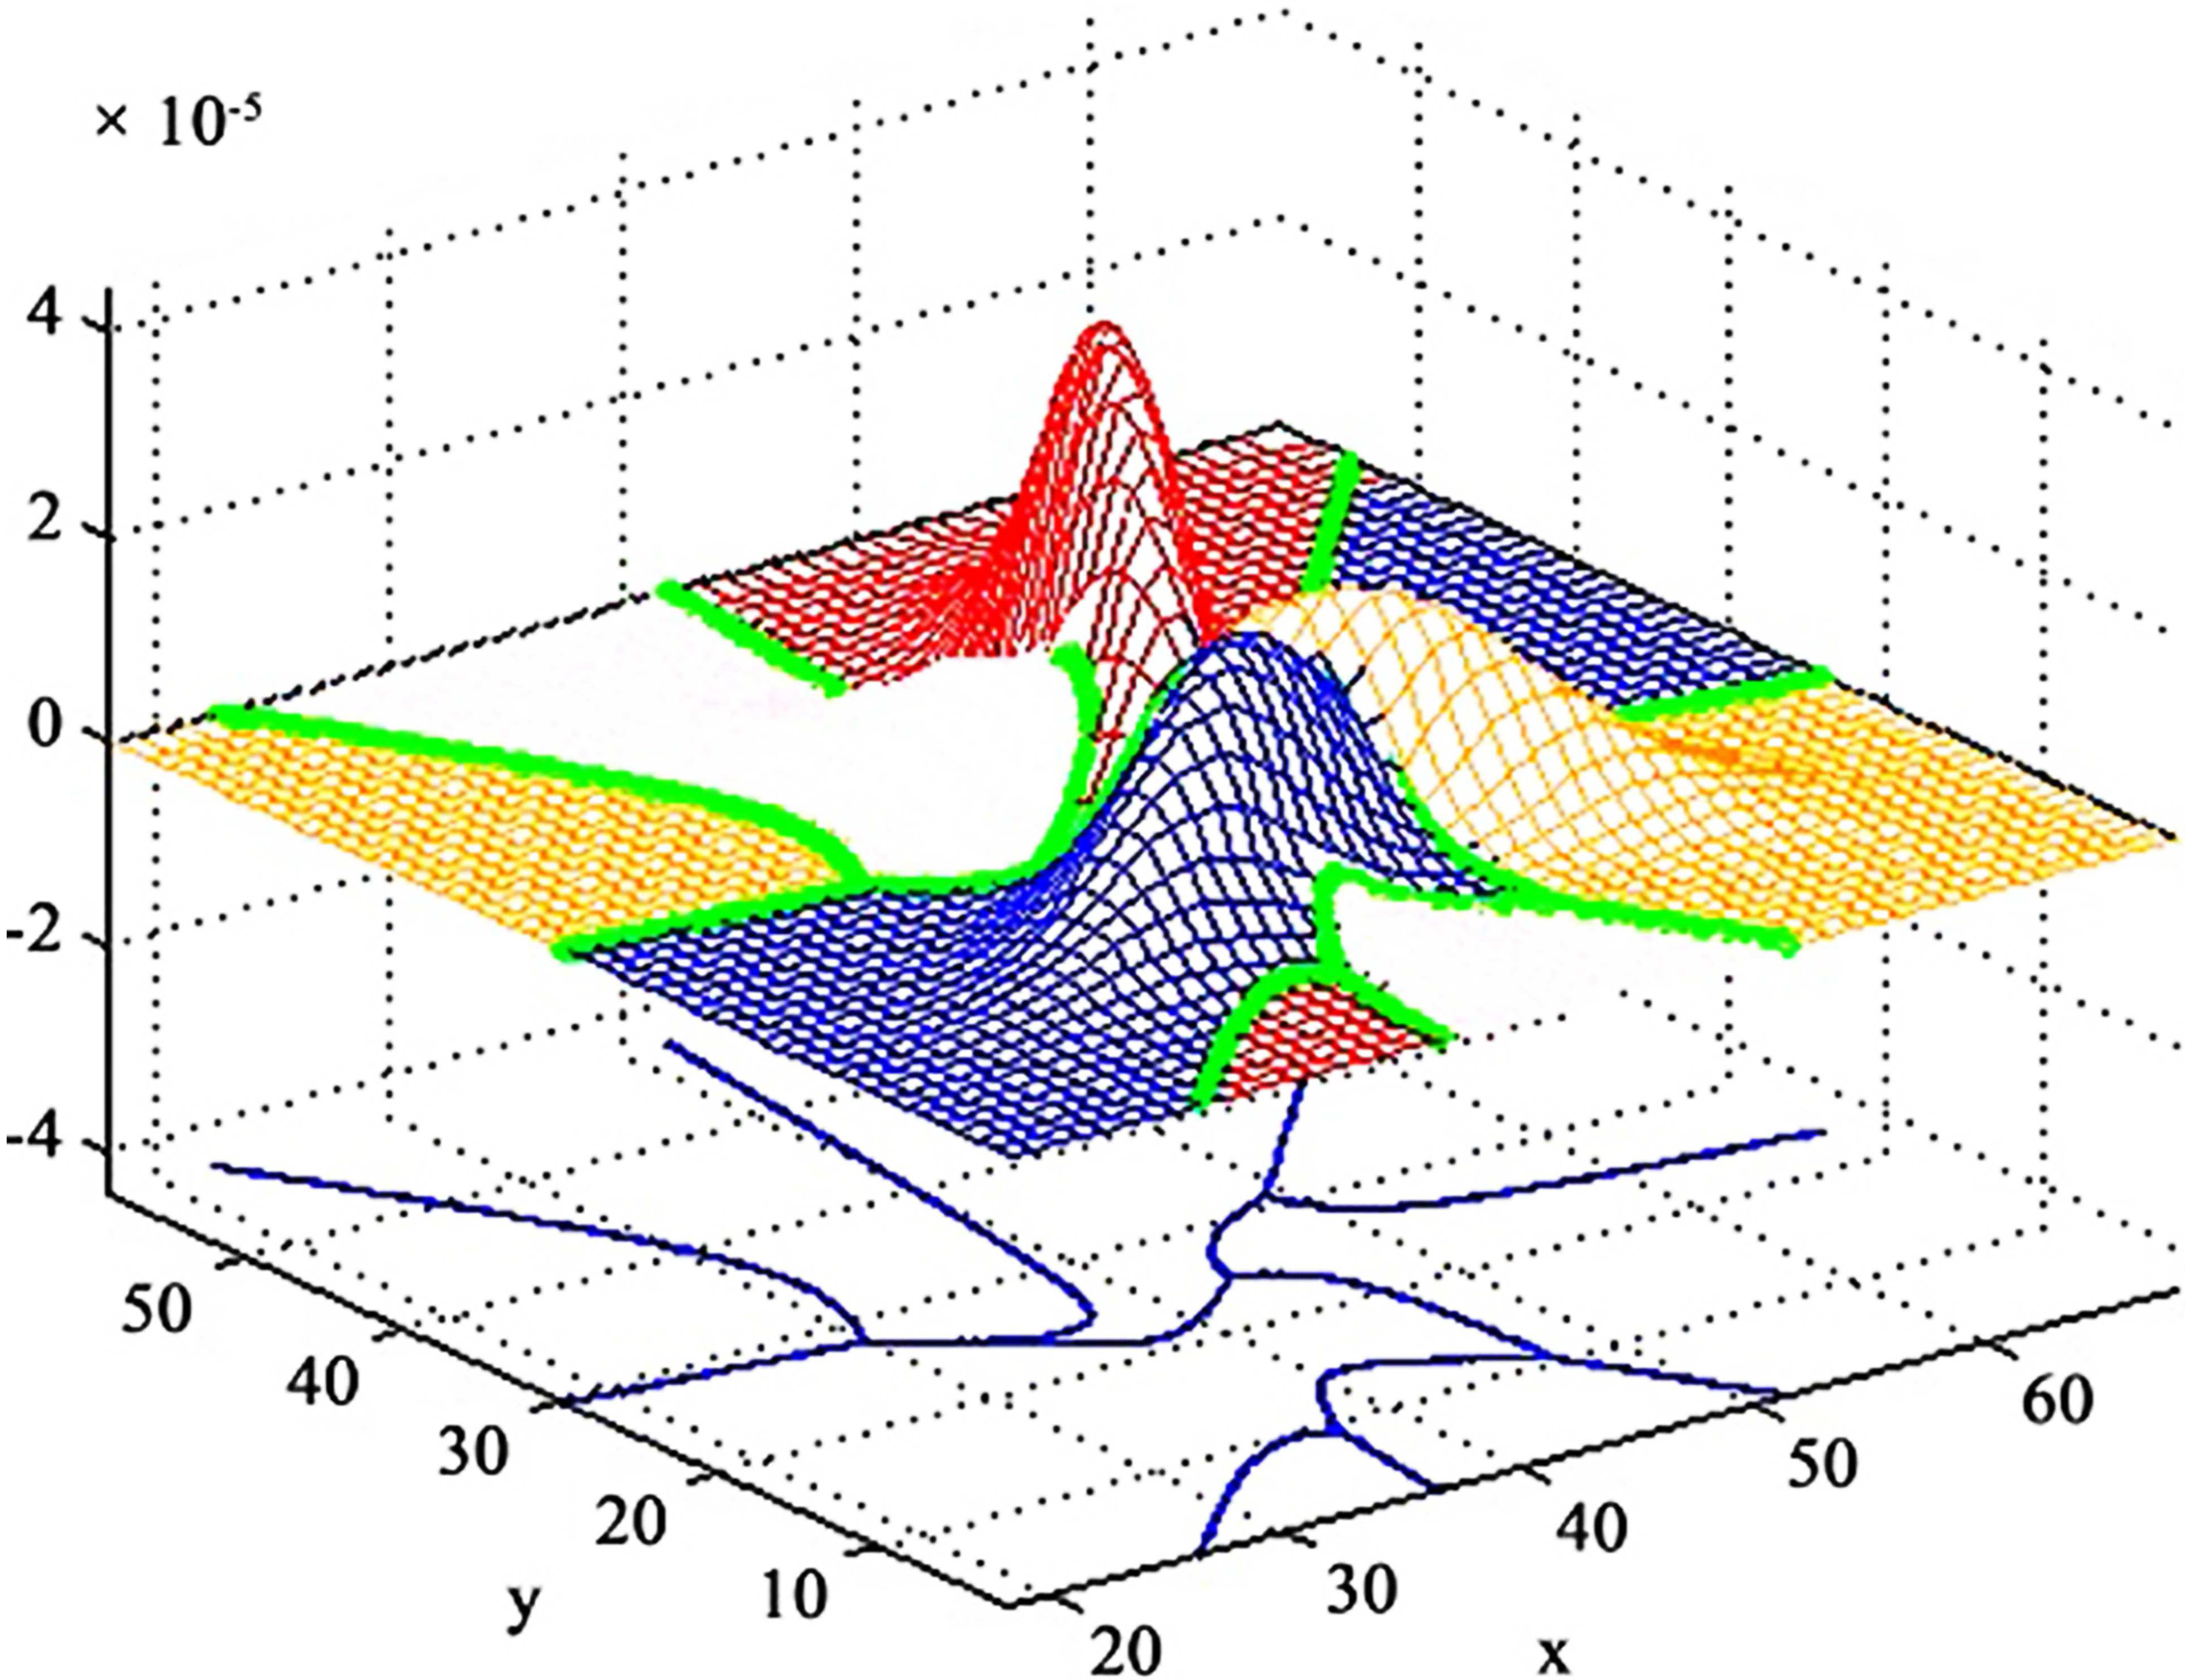
From this algorithm, we have written a Matlab procedure to find the
Upper and lower bounds
.
Given the set of pdfs:
where
Proof..
∎
One the other hand, we have
From the above result, the two inequality Eqs (8) and (9) respectively become:
These two results show that
.
The relations of CWD of
where
Proof..
For each
Therefore,
In addition, due to
We have
Or
Combining Eqs (15) and (16), we obtain
Because
Thus,
Integrating on
Because
We have
Integrating the above inequality, we obtain:
Moreover, due to
We get
From this inequality, we derive Eq. (13). According to Kraft [7], we have
Matusita [10] has also been proved:
Combining Eqs (18) and (19), we obtain
Or
On the other hand, from geometrical mean inequality of
Or
Moreover,
From Eqs (21) and (22), we obtain:
∎
From the result of Eqs (12) and (13) with
The representative probability density function
.
Let
where
It is also shown that
In the above algorithm,
In this algorithm, after an iteration, we have the specific probability for merging the
Determining the suitable number of clusters
Let
In this algorithm, the window size
At the end of the algorithm computation, the pdfs belong to the same cluster will converge on their representative pdf. The number of representative pdfs is the suitable number of clusters. As a result, we can determine the number of clusters and the initial clusters in the first iteration of FCA algorithm.
We have also written the Matlab procedures to perform the FCA and SNC algorithms. These programs have applied effectively for numerical examples in Section 5. However, data usually contains discrete elements in practice, so we have to estimate the pdfs before clustering. There are many methods to solve this problem in which the kernel function method is the most popular one. In this method, the choice of smoothing parameter and the type of kernel function has effects on the result. Although some authors had many discussions about this problem, the optimal choice still has not been found yet [3, 12, 16, 17]. In the numerical examples, the smoothing parameter is chosen by Scott [16] and the kernel function is the Gaussian one.
The graph of the two classes 
In this section, the article presents four numerical examples to show the proposed algorithms and to compare them with existing algorithms in [1, 6, 9, 11, 21]. The first example considers 100 uniform pdfs separated off in two groups with 50 pdfs in each. Example 2 consists of three Student bivariate class pdfs with of size 3 in each. We consider the above examples to illustrate and test the established procedures and algorithms. Examples 3 and 4 apply to images recognition, a problem can interest in many researches in data mining. The results reveal that the proposed algorithms are better than considered existing methods.
.
This example reviews the synthetic data studied in [1, 6, 11]. The data include two classes
where
The SNC algorithm gives the two representative pdfs as the Fig. 3b. Running the FCA algorithm, we have the matrix partition
From the above matrix, we have two clusters
We continue to cluster for two classes pdfs
(a) The graph of two classes 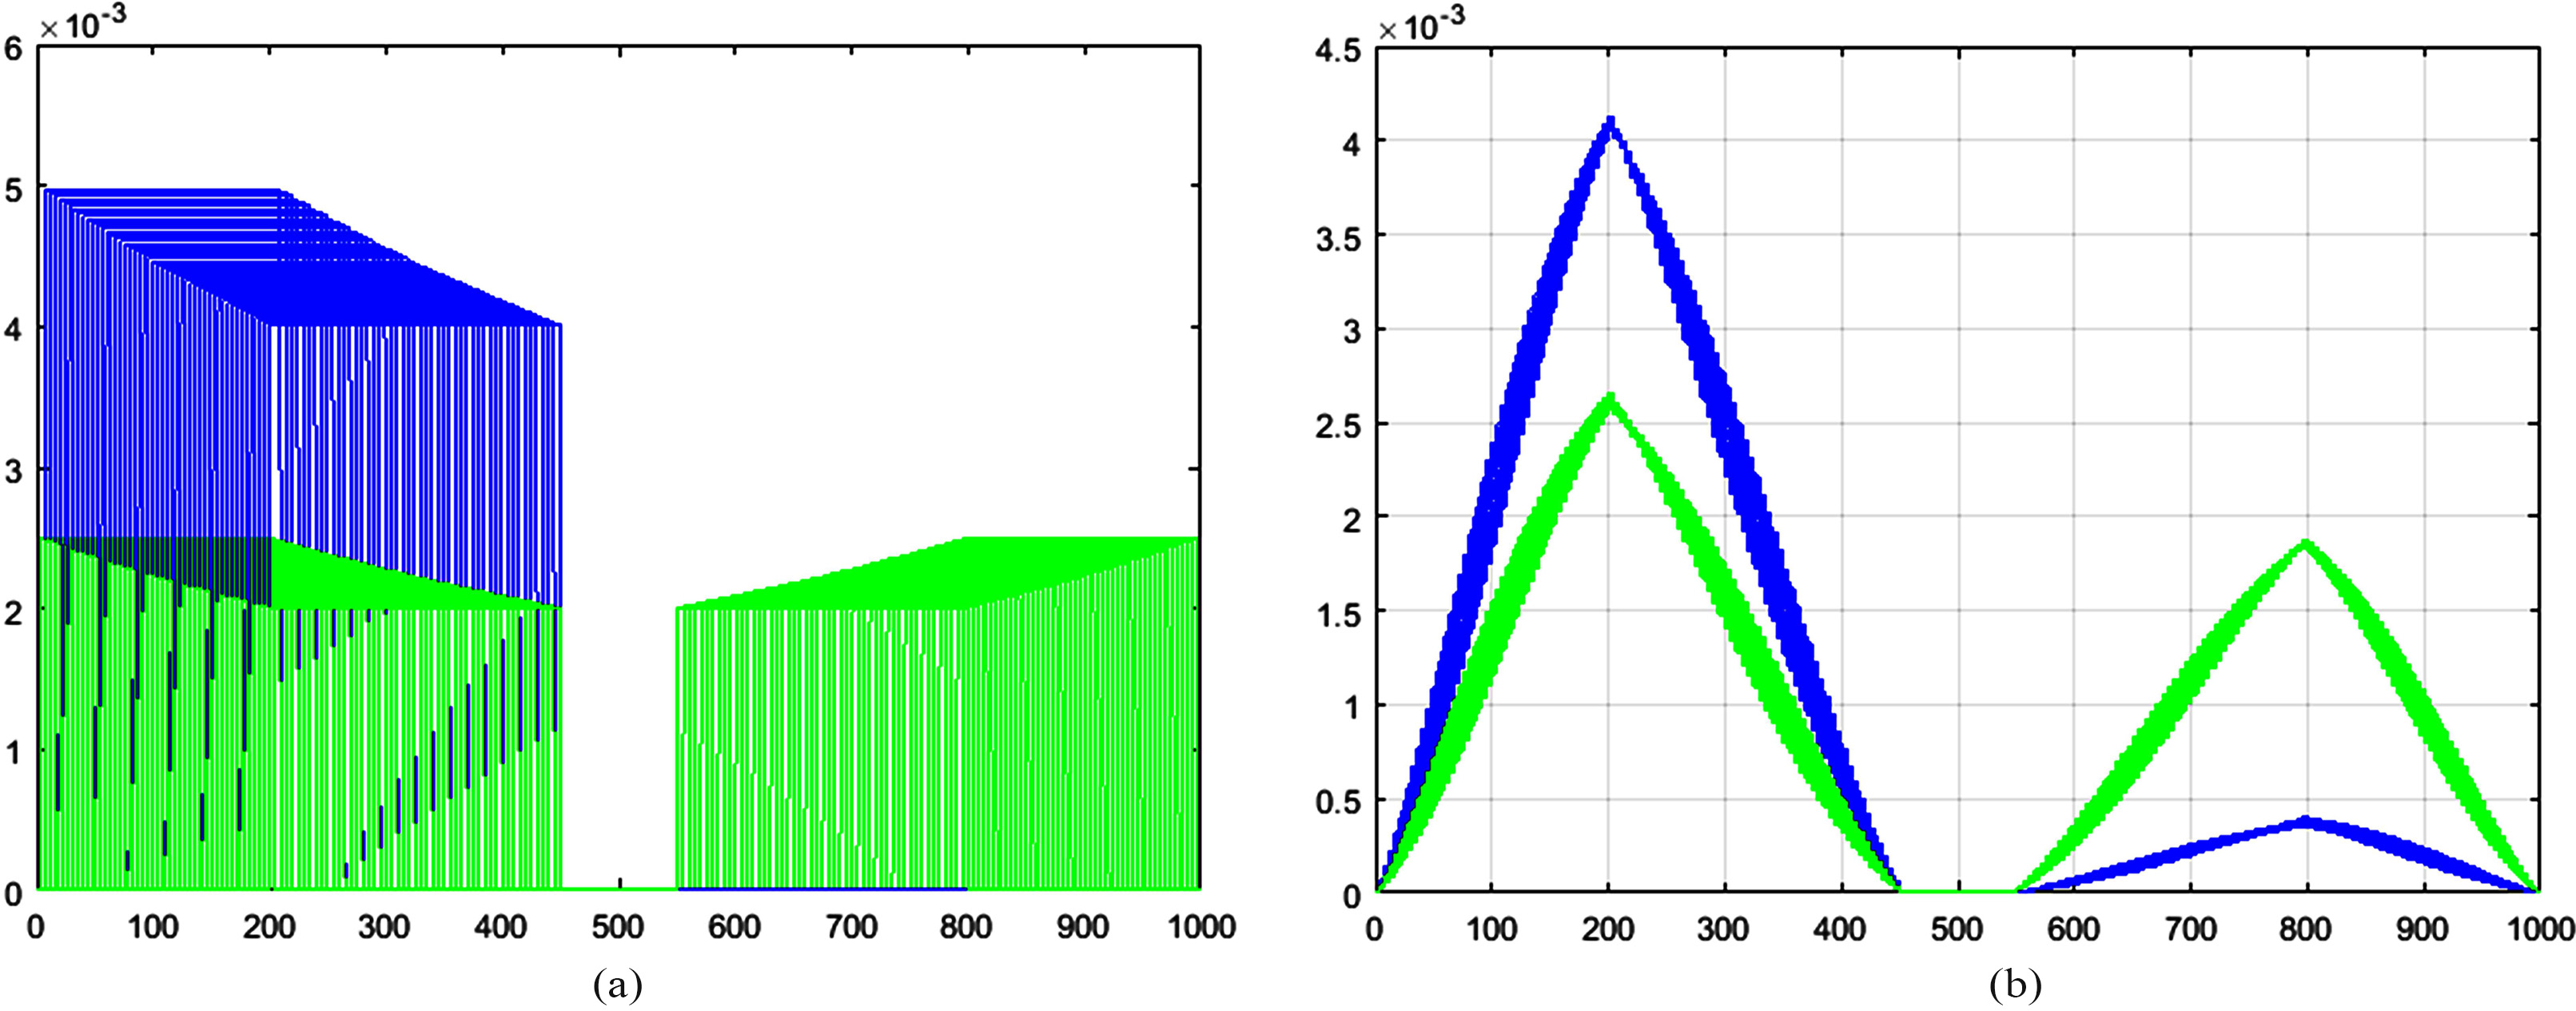
The graph shows the probabilities of pdfs belong to cluster 1 (lef) and cluster 2 (right).
Using the SNC algorithm, the pdfs converge to two representative pdfs (see Fig. 4b). The FCA algorithm gives us the partition matrix
From the partition matrix, we also have two clusters:
The error (%) of algorithms for
Table 1 gives the best result with the Chen and Hung [1] and the proposed algorithms for all cases of
.
Given 9 pdfs of bivariate Student distribution with 3 degrees of freedom as follows:
where
The graph of the nine bivariate Student pdfs (a) and their contour (b).
When the SNC algorithm stops, we have three representative pdfs shown in Fig. 7a and their corresponding contours are presented in Fig. 7b.
The representative pdfs of 3 clusters (a) and their contours (b).
The FCA algorithm gives the partition matrix as follows:
This matrix gives us three 3 cluster
In data processing, images are specially considered by their visibility and application for many fields such as agriculture, medicine, environment, etc. Therefore, the remaining two examples will cluster for images. Regularly, one image is characterized by three main features: color, texture and shape. Among them, the color is widely used for image segmentation or image classification problems. An image is structured from the matrix of image points with each image point contains color information. The G space is built based on Gray color. The RGB space is established based on three primary colors: Red, Green and Blue. These color space can be seen as one of the most recognition color spaces because almost visible colors could be generated by linear combinations of the above colors. In real life, the RGB is widely used to establish colors in electronic devices as computer, television, scanner, etc. In this article, different color features extracted from the images are represented by pdfs in single or multi-dimensional spaces by the Matlab procedure. Then, these pdfs become the input for the clustering algorithms.
.
This example considers 27 images of 2 categories with 13 images for lotus and 14 images for sunflower. The images are given by Fig. 8. Using the G scale, the estimated pdfs are given by Fig. 9. In this figure, the
The images of lotus and sunflower.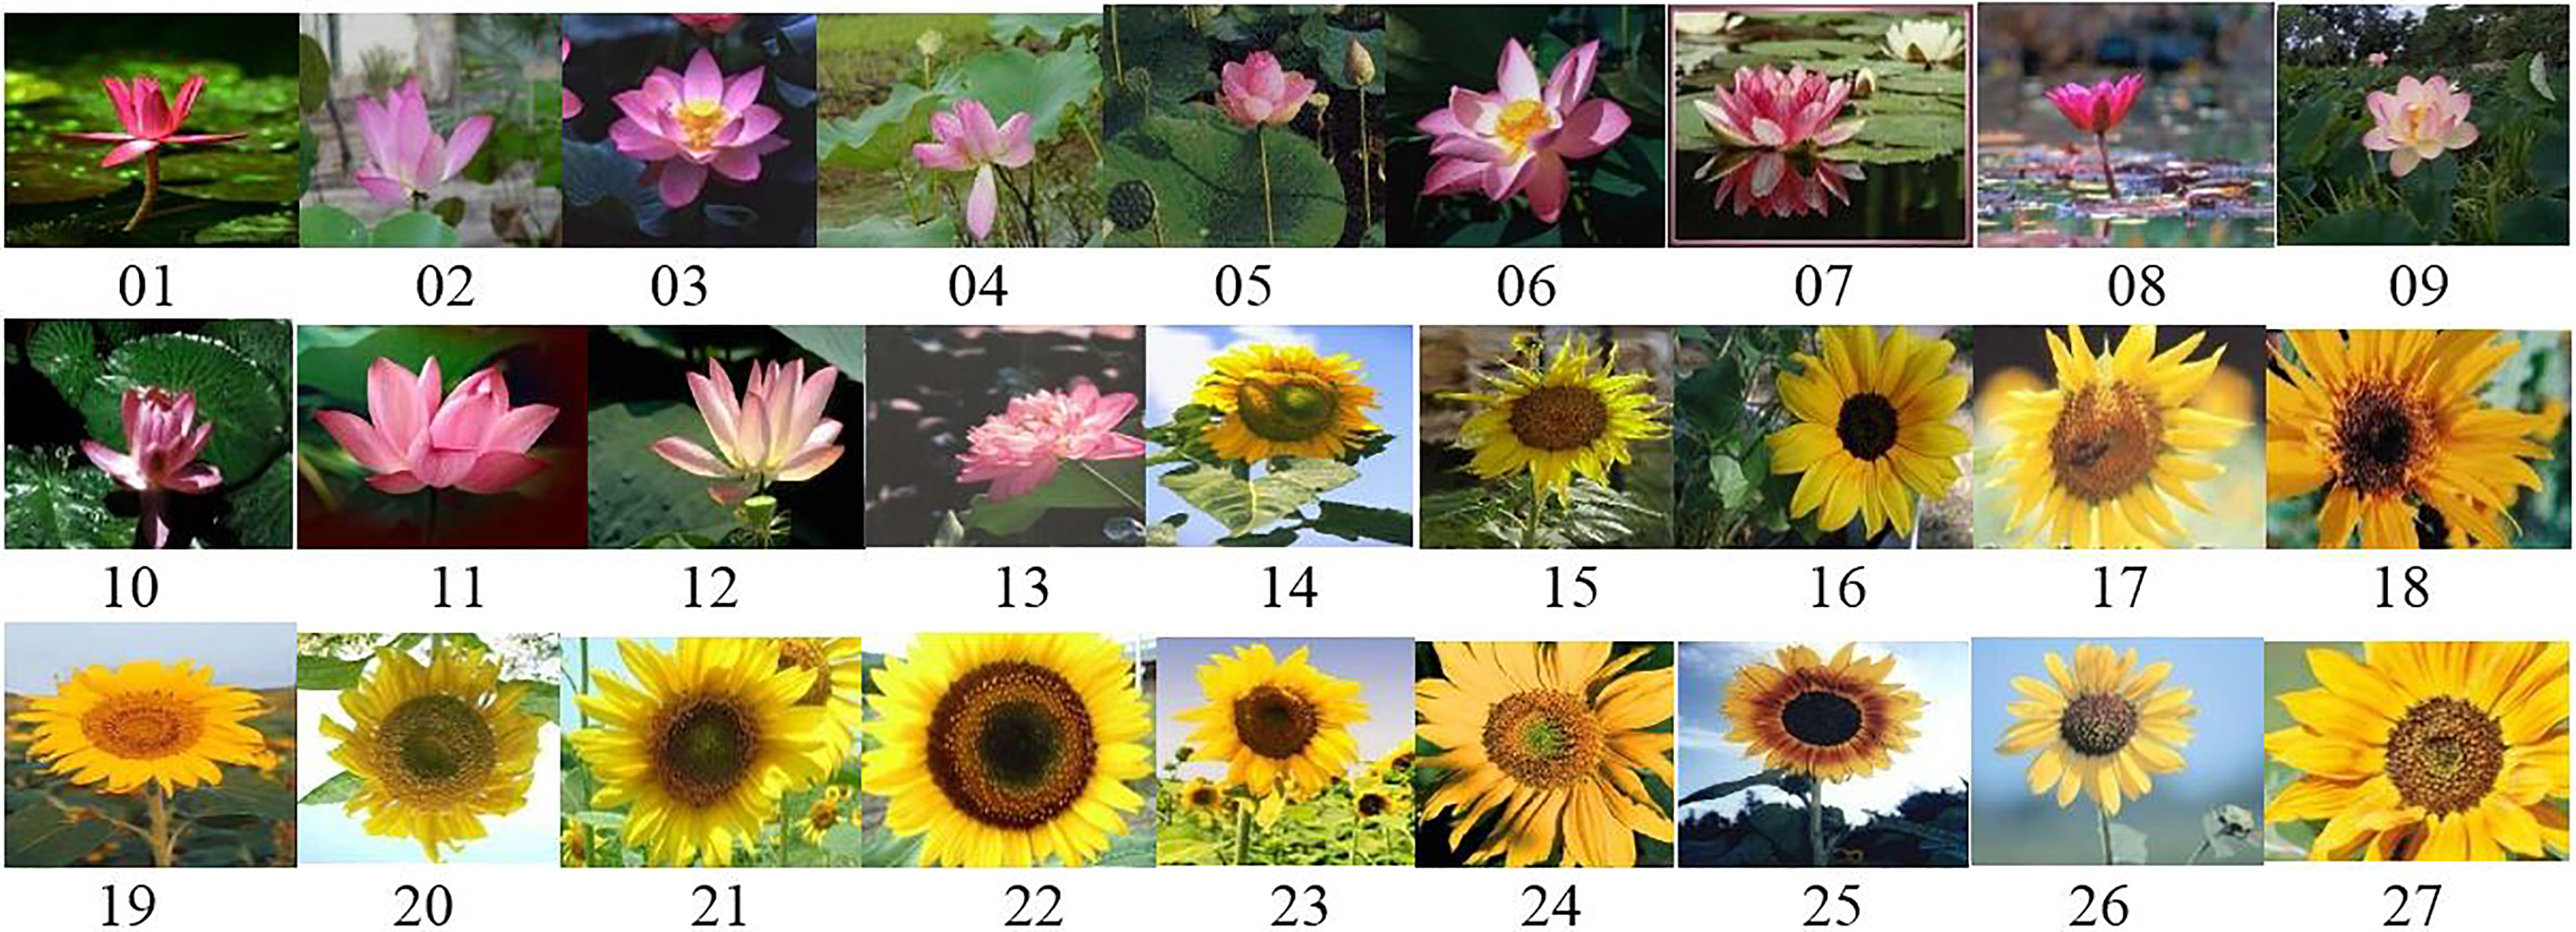
The estimated pdfs form images of lotuses and sunflowers.
The SNC algorithm gives 2 clusters and we obtain the partition matrix from the FCA algorithm that the probabilities for assigning to each cluster are showed by Fig. 10:
The graph shows the probabilities of pdfs belonging to cluster lotuses (a) and cluster sunflowers (b).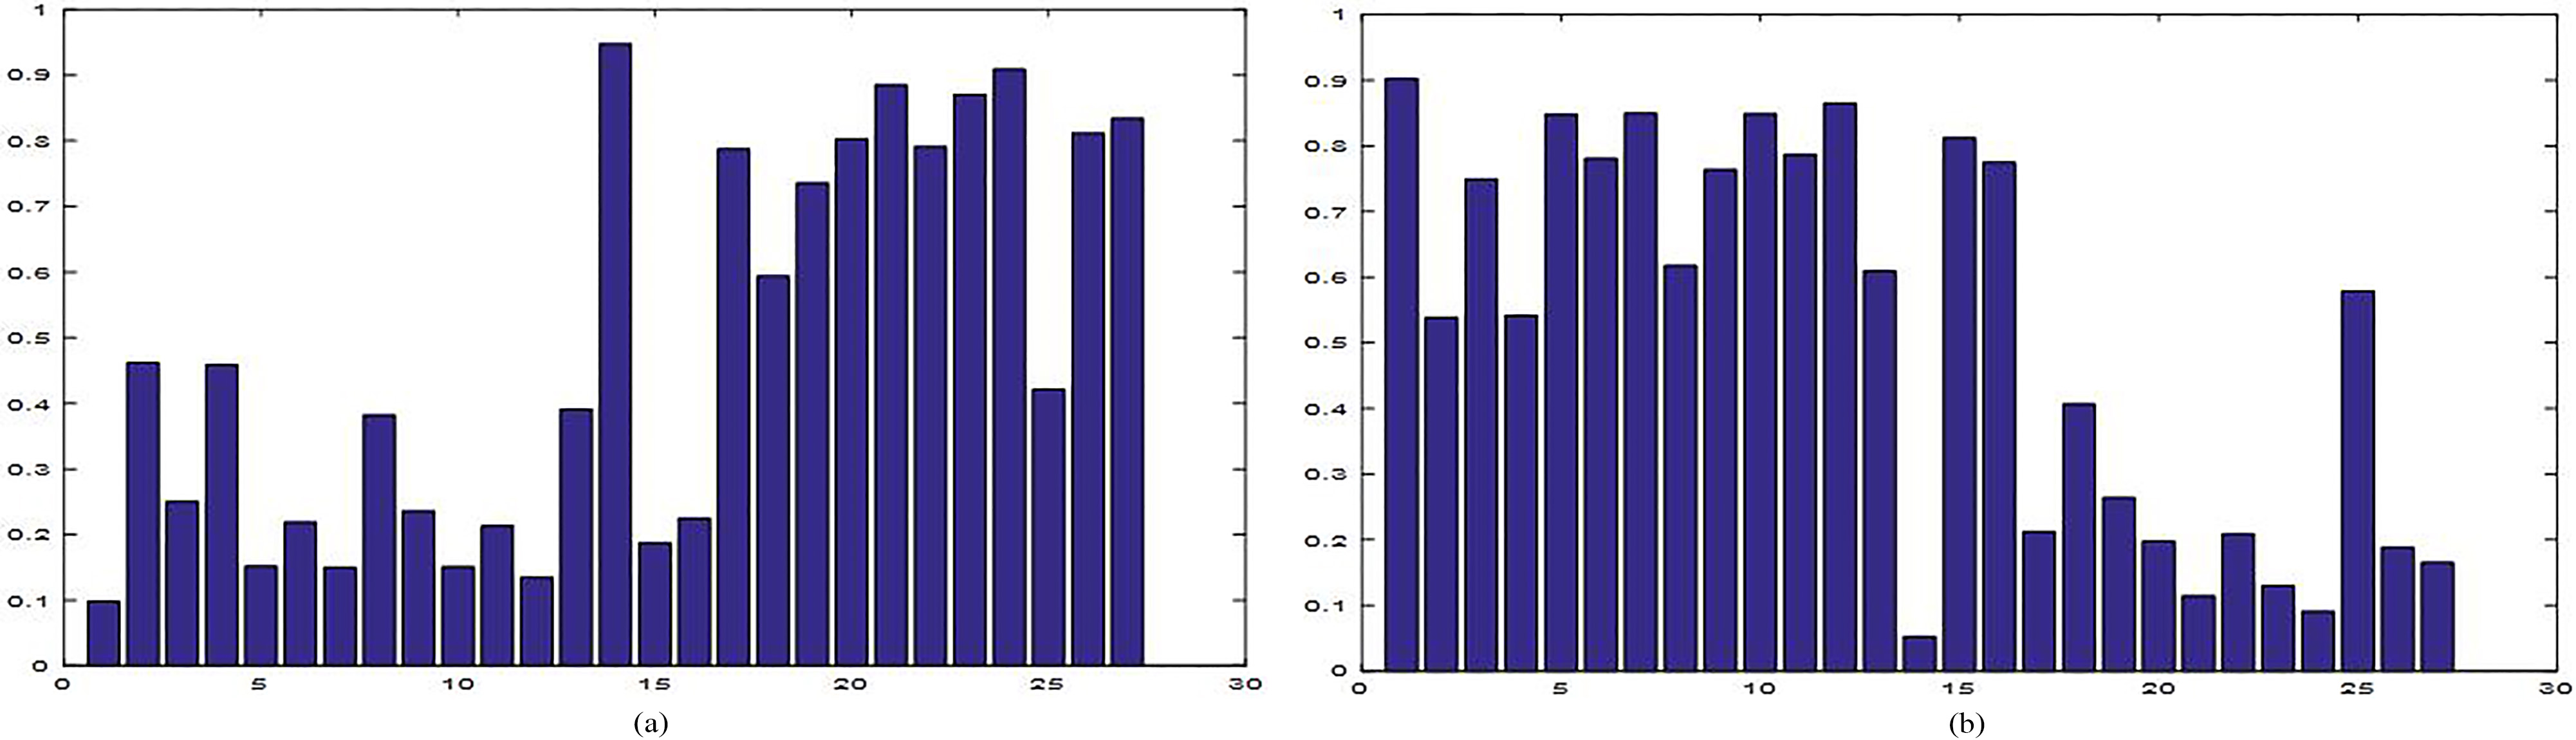
The CSC of the established two clusters are 0.861 and 0.878, respectively. The algorithm of Chen and Hung [1] only gives a single cluster with all pdfs. The emprical error of the proposed algorithm and the algorithms of [9, 21, 6, 11, 1] are 11%, 45%, 37%, 27% and 47%, respectively.
Using three variables (RGB), making the similar as using G, the SNC algorithm also gives two clusters. Their CSC are 0.831 and 0.863, respectively. We obtain the following partition matrix from the proposed algorithm:
In this case, the errors of the proposed algorithm and the algorithms of [9, 21, 6, 11, 1] are 18.5%, 65%, 47%, 38% and 47%, respectively.
.
This example continunes to cluster for images. This database were researched by Chen and Hung [1] and Goh and Vidal [6] and can be downloaded from
Three original textute samples in Benchmark database: Human skin (a), Ribbed paper (b) and Insulation (c).
The pdfs of 218 material images.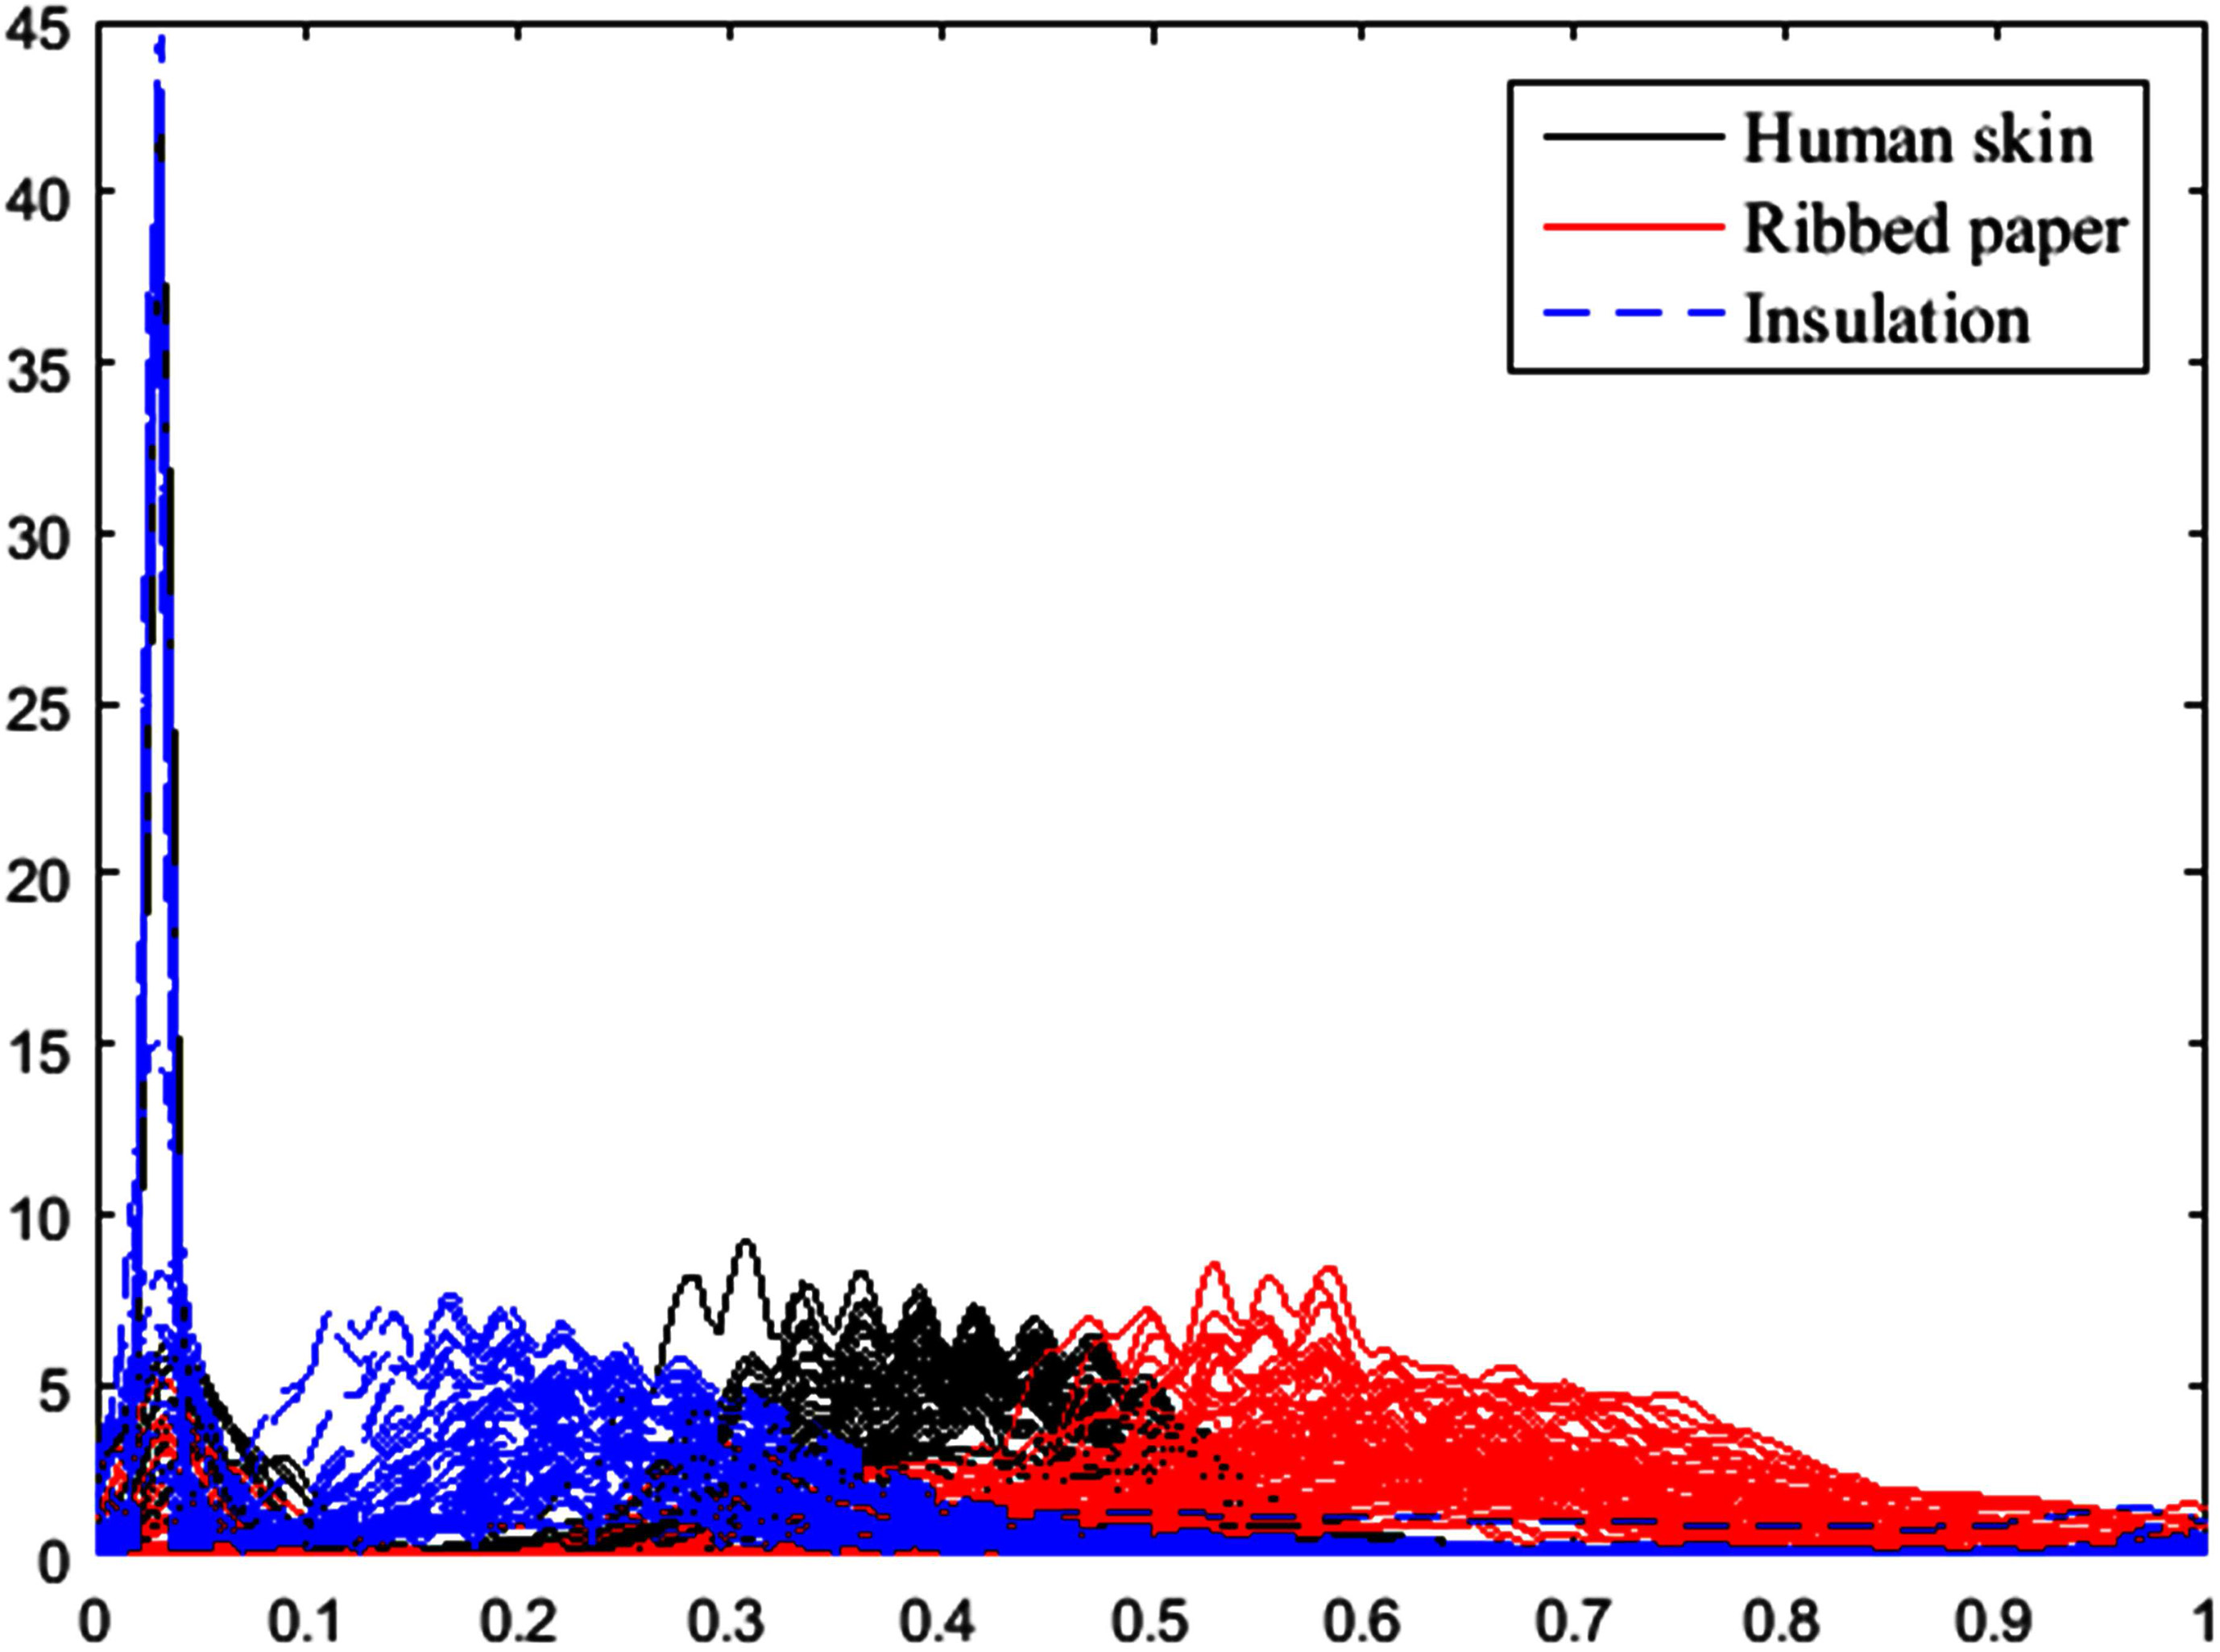
The pdfs are also estimated based on the G and RGB scale of image pixels. In case of G scale, the pdfs are shown in Fig. 12.
For G, the SNC algorithm gives three cluster (see Fig. 13) with CSC are 0.625, 0.713 and 0,625, whereas the algorithm of Chen and Hung [1] is only one cluster (see Fig. 14). Running the FCA algorithm for one dimension and three dimensions, we have the partition matrix that the probabilities of images belonging to three clusters are given by Figs 15 and 16, respectively.
The error (%) of the algorithms for material images
The three representative pdfs in the final step of the proposed algorithm.
The three representative pdfs in the final step of the algorithm of Chen and Hung.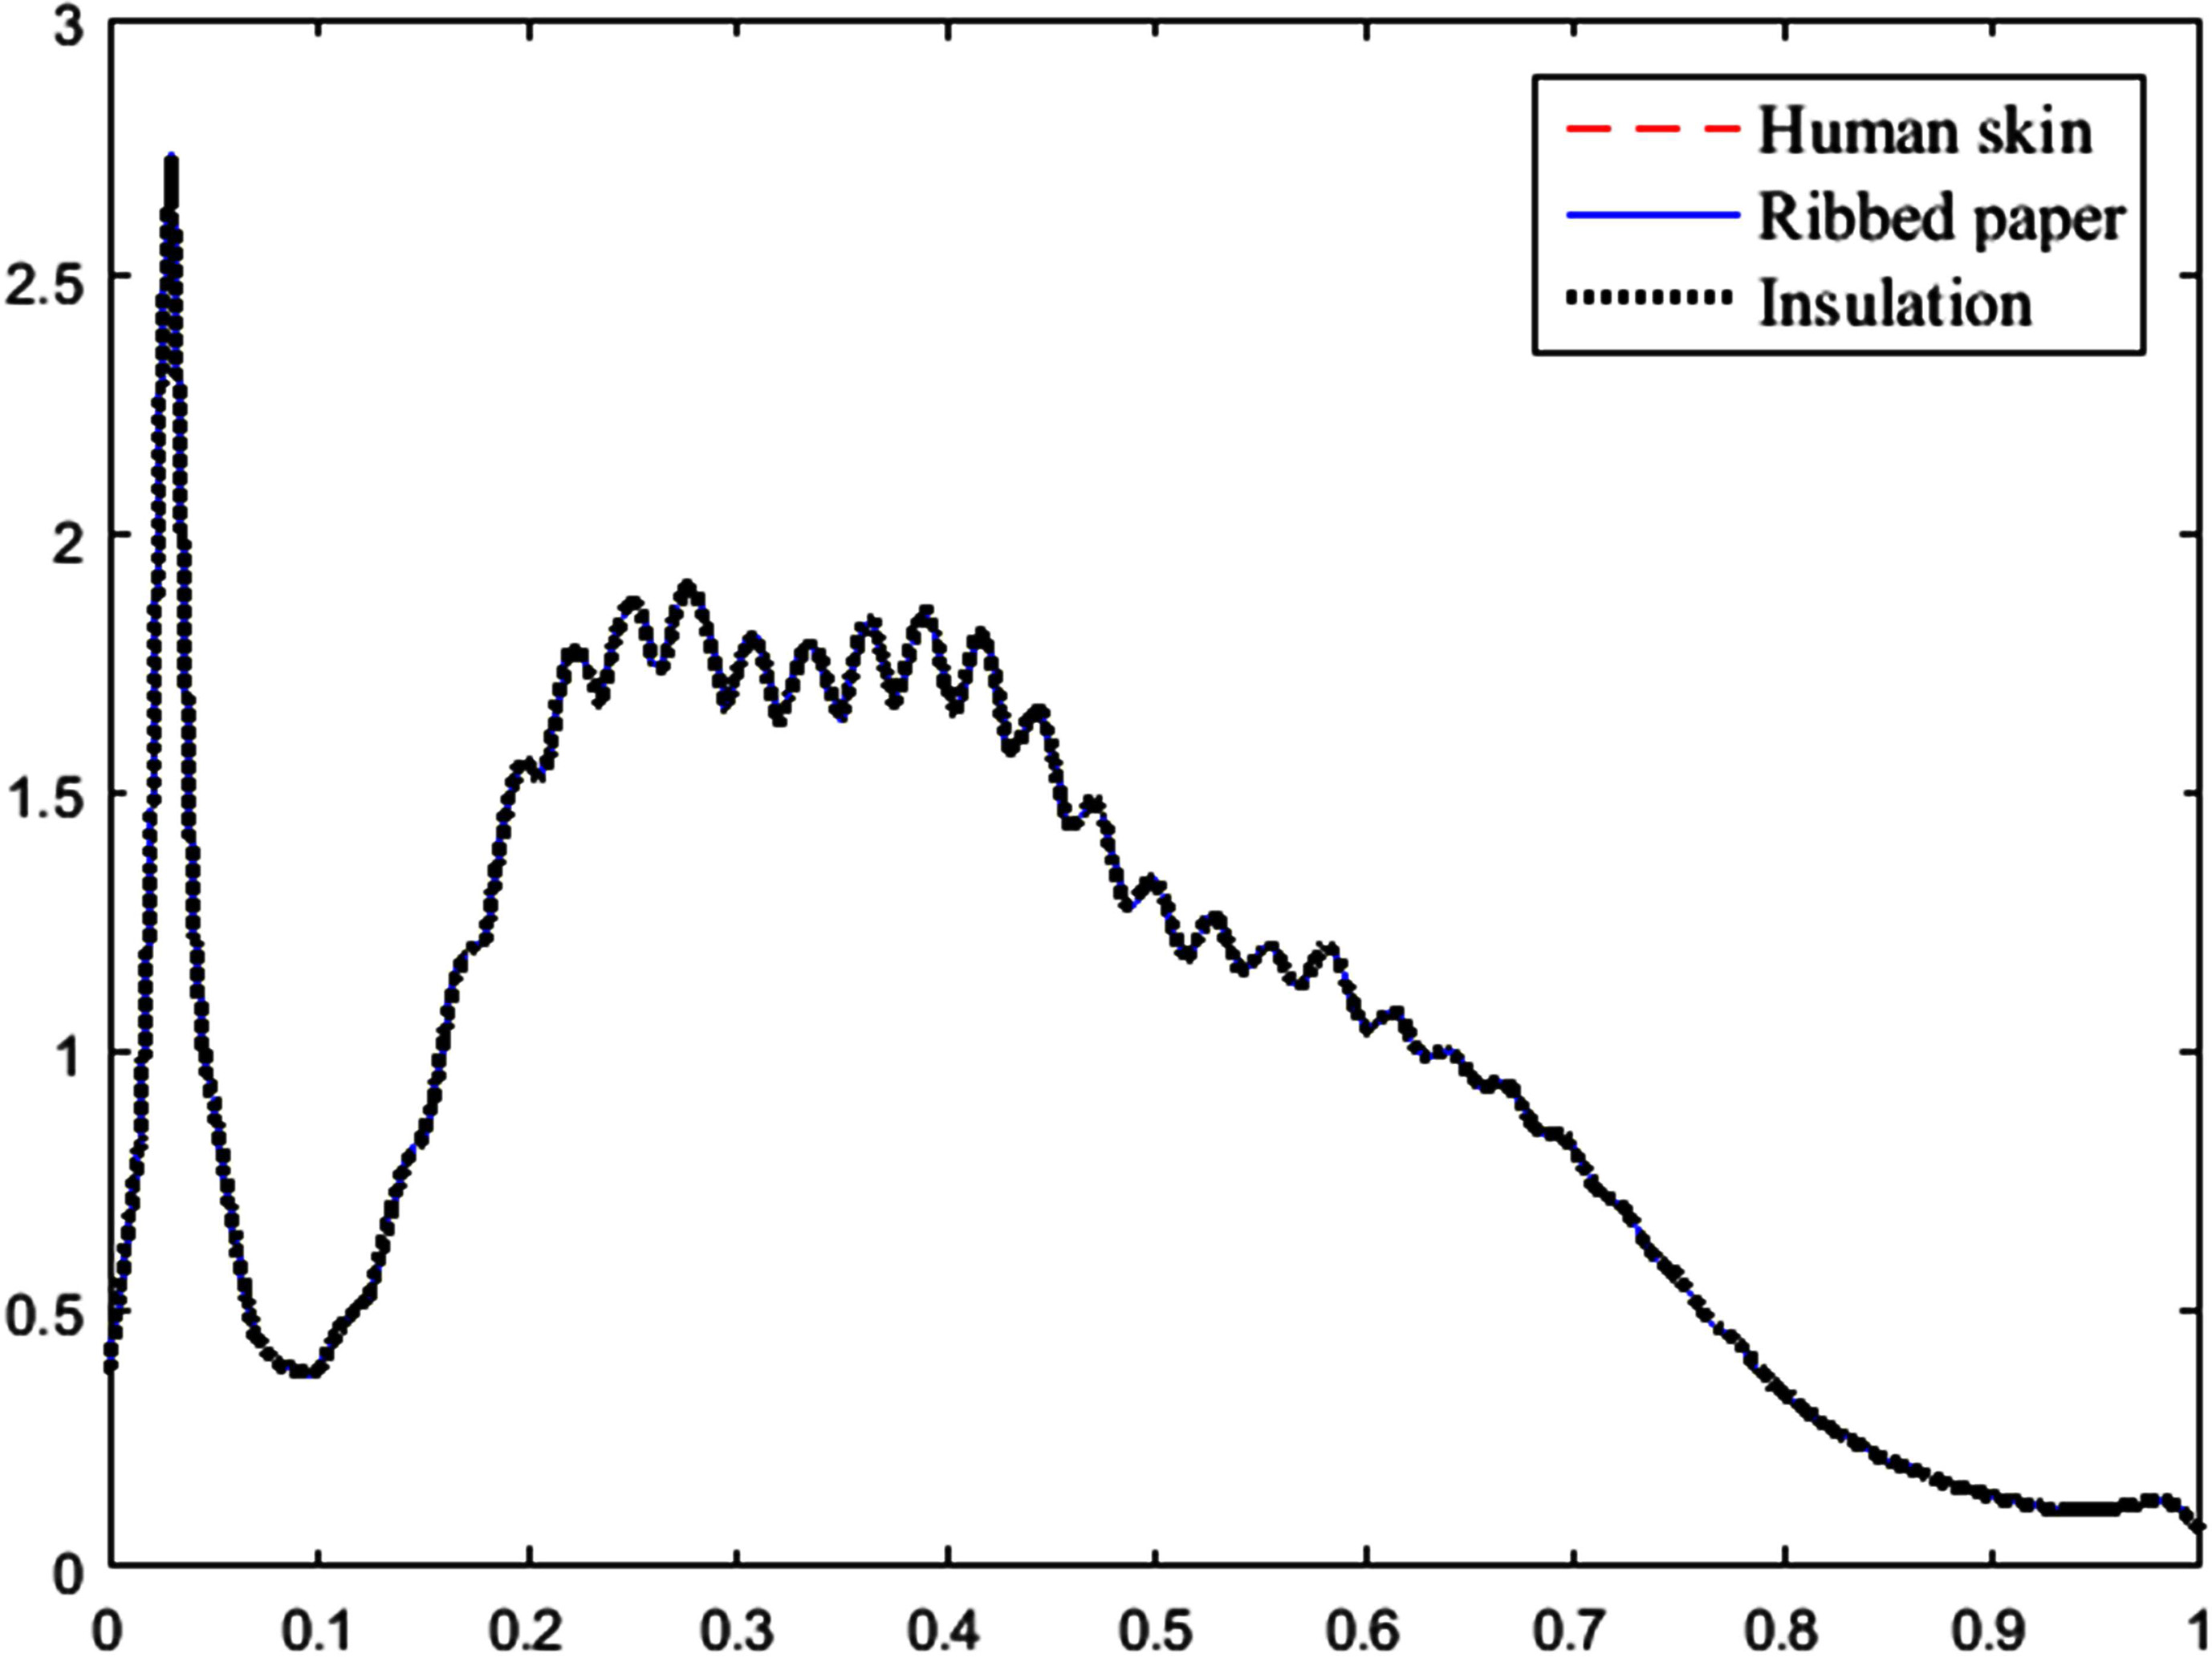
The graph of probabilities for partition matrix using G.
The graph of probabilities for partition matrix using RGB.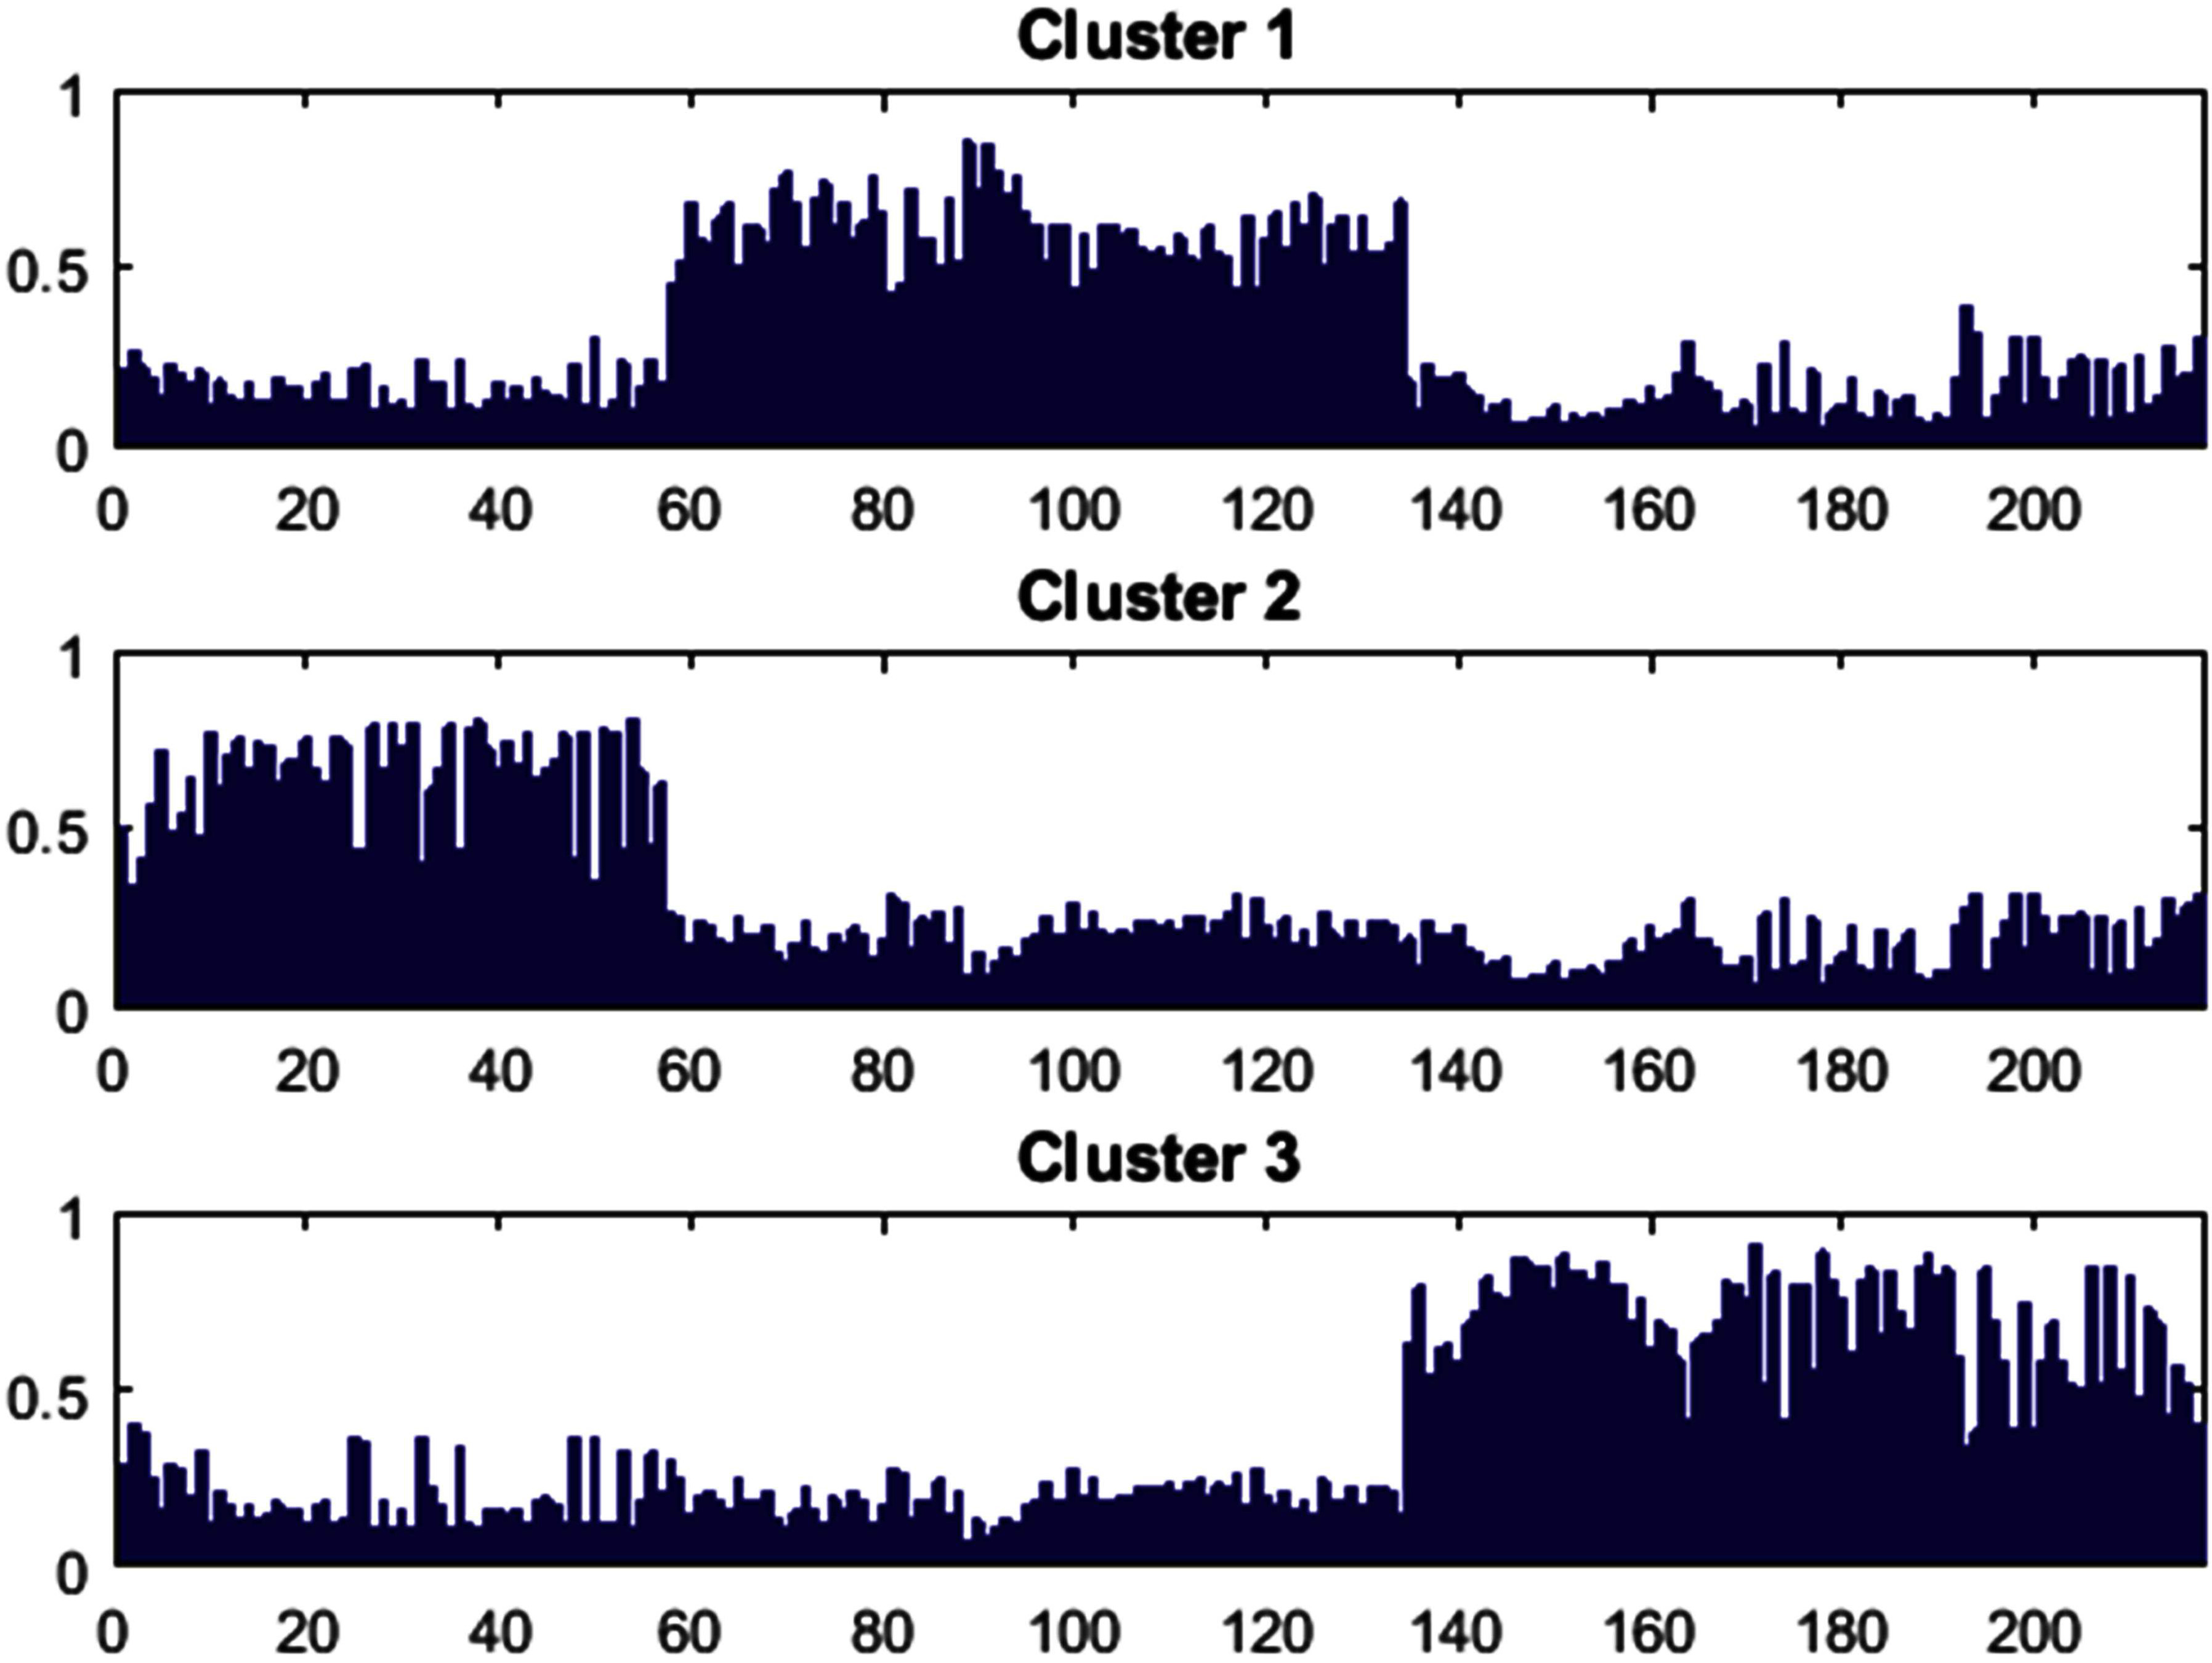
The errors of the proposed algorithm and considered algorithms are given by Table 2. From Table 2, we see that the proposed method obtains the good result both in one-dimension and three-dimensions cases. In addition, in both two cases, the results of the proposed method are unaltered, while those of compared methods fluctuate significantly. Thus, it can be noticed that the proposed method also works well with the pdfs having much overlap area.
From the considered examples, we see that the results of Chen and Hung [1] and the proposed algorithm are the best. However, at the end step, the proposed algorithm gives extra detail on the probability which belongs to each cluster of elements from the established partition matrix. Moreover, we can know the quality of the established clusters by the CSC parameter. We also see that when the pdfs of groups are well separated (Examples 1 and 2), the results of Chen and Hung [1] are appreciable. However, in case of overlap regions of groups are large, this algorithm is disadvantages. Examples 3 and 4 show this problem. These examples also show an outstanding performance of the proposed algorithms in comparison with that of existing algorithm.
This studying has surveyed the CWD by establishing upper and lower bounds and by building its relations with other measures. From CWD, a new concept to evaluate the quality of the established clusters is proposed. Determining the CWD is also considered in both theoretical and real application. Based on the CWD, the article has proposed two algorithms: fuzzy cluster analysis for pdfs and determination of the suitable number of clusters. These algorithms are applied to several synthetic, benchmark and real data and performed by the Matlab procedures. The numerical examples show the suitability and the applicability of studied problem. They also show that the proposed algorithms are more efficient than existing ones. In the near future, we will apply these theories to other practical issues such as image processing and sound recognition. The convergence property of the proposed algorithms however is not studied in this article. It will be part of my further studies.