
Abstract
Outlier detection is an important task in data mining. In this paper, a novel outlier detection algorithm is proposed, which integrates the local density with the global distance seamlessly. In the proposed method, an integrated outlier factor is used to measure the detecting accuracy. A comprehensive experimental study on both synthetic and real-life datasets shows that the proposed method is more effective than some typical outlier detection methods, including Relative Density-based Outlier Score (RDOS), INFLuenced Outlierness (INFLO), Local Outlier Factor (LOF) and Local Distance-based Outlier detection Factor (LDOF).
Introduction
Outlier detection has become an important research in data mining, and it has attracted attention of more and more experts. Many related research findings have been applied to such fields as Internet Intrusion, Financial Fraud Transaction, Bank Non-performing Loan Records and Potential Terrorist Activity [1]. Outliers are data objects which deviate so greatly from other ones as to arouse suspicion that they may have been generated by a different mechanism. Outliers can cause significant losses to users. For example, policy makers could make bad decisions in business analysis. So their corresponding processing is more valuable than conventional ones in some specific areas [2].
In recent decades, many outlier detection methods have been proposed. And they can be divided into four categories which are statistical learning-based, clustering-based, density-based and distance-based ones. In statistical learning-based methods, they are capable for different data distributions, parameters, thresholds and models. In general, outliers can be regarded as the by-products of clustering. The statistical learning-based and clustering-based ones are seldom used. For the statistical learning-based method, it is difficult to build the model. And for the clustering-based method, it is inefficient on large dataset. In contrast, the density-based and distance-based methods have become mainstream ones for a long time. Such density-based algorithms as Local Outlier Factor (LOF) [3], INFLuenced Outlierness (INFLO) [4], Relative Density-based Outlier Score (RDOS) [5] and Connectivity -based Outlier Factor (COF) [6] are all popular. Besides these, a data point is considered an outlier when its local density is different from that of the neighborhood. LOF is the first method to propose the relative outlier factor, which is based on the KNN method. Similar to KNN, LOF can get the reachable densities of the outliers [3]. INFLO is an improved method based on LOF, which considers both neighbors and reverse neighbors of an object when estimating its relative density distributions [4]. RDOS is similar to INFLO, but the former adds share neighbors [5]. COF is a local density-based approach when data specifies such patterns as lines and spheres [6]. The advantage of such kind of method is that all of outliers can be detected, including global outliers and local outliers. However, several parameters are demanded to be determined in advance. In the distance-based methods, the outliers are detected by computing distances among all objects. Among them, the popular commonly methods are Distance Based detect Outlier (DB-Outlier) [7], Nested-Loop (NL) [8] and Local Distance-based Outlier detection Factor (LDOF) [9]. DB-Outlier is the earliest distance-based outlier detection algorithm, which calculates the distance between each pair of objects and compares it with the threshold value to determine whether it is an outlier. The mesh model is added in NL, and then the distance between the current object and other objects are calculated in each mesh. If the distance is less than the specified threshold, the object number is incremented by one [8]. If the number exceeds the given threshold, the object is not an outlier. LDOF uses the relative distance from an object to its neighbors, which is usually used for outlier detection in scattered datasets [9]. The distance-based methods are widely used for their validity and portability. But the distance-based method does not take into account the variations of local outliers. So the distance-based methods can only detect the global outliers. This is to say, they are incapable of detecting the local outliers.
In this paper, we propose a robust Outlier Detection Algorithm based on Density and Distance double Parameters Outlier factor Scores (ODA-DDPOS). The method is accomplished by three steps. 1) The local density of an object is assessed by its neighborhoods, and the global distance is obtained by the known density set. 2) An integrated outlier evaluation factor is determined by results of step 1). 3) The top-n outliers are determined by the evaluation factor. The higher the value of DDPOS is, more likely it is to be an outlier. Experimental results on both synthetic and real-life data sets verify the superior performance of our proposed ODA-DDPOS method. In summary, our contributions in this paper have the following two ones.
A new method of outlier detection is presented, which illustrates the theoretical analysis of the outlier detection method and whether it is provided with parameters in practical applications. A new outlier fraction factor is proposed, which is based on two parameters of density and distance.
The paper is organized as follows. In Section 2, we introduce a brief overview of the related work. In Section 3, we present the detailed description of ODA-DDPOS. In Section 4, we give the evaluation criteria, experimental results and analysis. Finally, conclusions are given in Section 5.
The essence of outlier detection is to separate a core of regular observations from a large collection of data. Outlier detection methods can be divided into four types, which are statistical learning-based, clustering-based, density-based and distance-based ones [1, 10]. The statistical learning-based method finds outliers by building statistical learning model. However, its disadvantage is that the determination of the learning model cannot be applied to unknown datasets [11, 12]. Moreover, inconsistency usually exists between data distributions in the model and that in real applications [6, 13]. For the clustering-based method, it detects outliers in the process of finding clusters, and the data point which does not belong to any cluster is considered as an outlier. However, its computational cost is too high to be applicable in large datasets [6, 7, 14]. Besides, it cannot make further optimization because its main goal is to cluster. In this case, the density-based and the distance-based approaches are combined in the proposed methods because they are simpler and more commonly used. The algorithms of LOF, INFLO and RDOS are all density-based ones. The density-based method investigates the density of an object and that of its neighbors. Here, an object is identified as an outlier if its density is lower than that of its neighbors. Given a dataset
Note that
The basic calculation models mentioned above are based on density and distance. Both of LOF [3] and LDOF [9] use KNN to calculate their characteristic subspaces [15, 16], and they are too dependent on the kernel density [7]. INFLO puts forward the Influence Space (IS) [4], and RDOS puts forward the relative density-based outlier factor [5]. Concepts of INFLO and RDOS are very similar, but RDOS joins the shared neighbor into IS to become the new nearest neighbor. The disadvantage of INFLO and RDOS is that the density score boundary between the point and the two clusters becomes blurred. In this case, INFLO and RDOS make it difficult to determine which cluster the instance belongs to [17]. Other disadvantages of RDOS are that there are manually operated parameters and the algorithm is too subjective [18].
Therefore, we propose an integrated outlier detection algorithm based on density and distance after comprehensive analysis.
Local density and global distance
Outliers have the following characteristics in the real spatial datasets.
The mechanism of the outlier is different from that of the normal objects. It is usually distributed separately or very sparely. And accordingly, most of them have very low densities. The distances between the outlier and other normal point clusters are relatively distant, which makes the outliers become independent.
Gaussian Kernel Density Estimation (GKDE) can be used to get the object local density. Given a dataset of objects
where
where
To estimate the density of an object
where
It should be noted that
where
The kernel density score can be used as a separate evaluation factor of outliers in some density-based methods. However, the global distance is also considered in order to improve the detection accuracy. According to the definition of the outlier, the global distance is also called as the average farthest distance between the object
where
The global distance can eliminate the interference of the boundary objects and avoid false discrete points. For example, the density of boundary point is lower and the distance between the boundary point and the other side at the edge of the normal cluster is larger. But the boundary point is not always the outlier. The distances between one point and the
where
The global distance of each object
Based on the local density and the global distance sets, the outlier factor score can be defined. DDPOS is a relatively comprehensive average factor and it has strong correction function, which is defined as follows.
DDPOS is the ratio of the global distance to the local density of our interested object
Our algorithm is given in Algorithm 1, which takes the KNN graph as input. The KNN graph is a directed graph in which the object corresponds to the vertex and it is connected to its
Experimental results and analysis
Evaluation criteria
Although there are many evaluation metrics, such as precision, Adjusted Index and Adjusted AP [21, 22], the most effective and popular one is the well-known F1 evaluation criterion. F1 is widely used in unsupervised outlier detection algorithms. In this paper, we chose F1 curve to evaluate the experimental results.
Here,
Confusion matrix
TP is the number of outliers belonging to both True condition and Predicted condition. FN is the number of outliers belonging to the True condition and not belonging to the Predicted condition. FP is the number of outliers not belonging to the True condition and belonging to the Predicted condition. TN is the number of outliers not belonging to the True condition and not belonging to the Predicted condition.
Firstly, we test ODA-DDPOS in a synthetic dataset. This dataset includes two Gaussian clusters centered at (0.5, 0.6) and (3.0, 3.5) respectively [23]. One hundred samples including 4 outliers are extracted from it. In consideration of the computational expenses and the detecting accuracy,
Outlier distribution.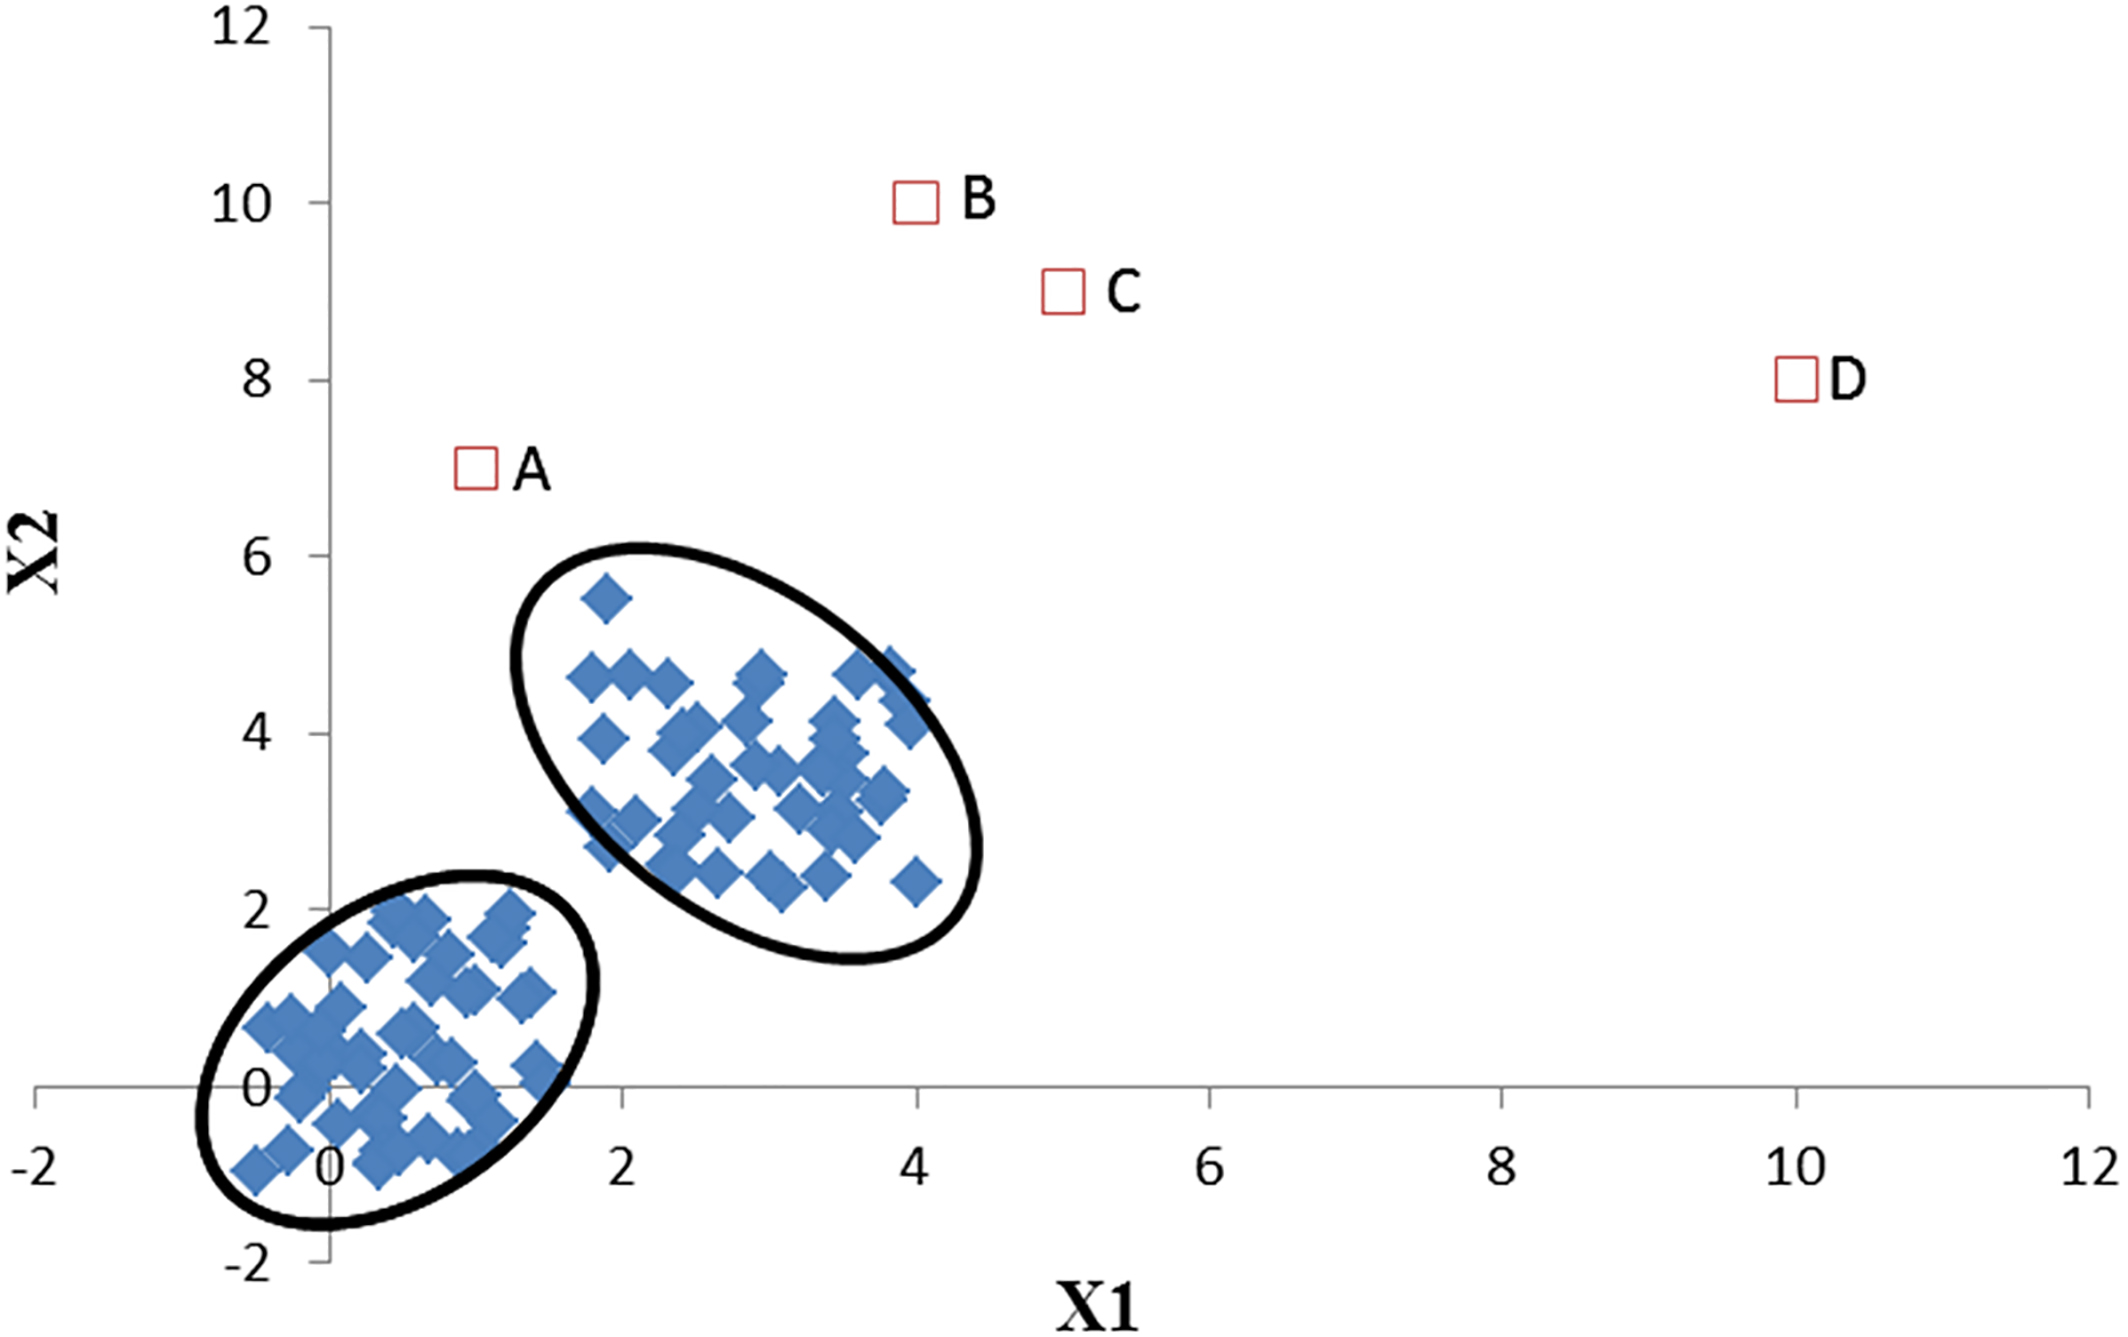
As is shown in Fig. 1, the data points corresponding to A, B, C and D are outliers. Meanwhile, the top 5 data samples with the largest DDPOS are given in Table 2.
Top 5 data samples with the largest DDPOS
According to Eq. (9), DDPOS values are calculated and shown in Table 2. Let’s take an example to explain. The DDPOS value of an object
The DDPOS value of object
The DDPOS values of remaining
Obviously, the outlier distributions are variable. The DDPOS values of the first four outliers are very large. The fifth data point is the boundary point, and its corresponding value is not as large as the first four ones.
We also conduct experiments on real-life datasets to evaluate the performance of the algorithms. All datasets are from the UCI repository [24]. In experiments, we preprocessed the datasets for performance evaluation in the beginning. And concretely, two steps were taken.
(1) Normalization
It is used to standardize each attribute to the range from 0 to 1.
(2) Transformation
It is used to convert all of the classification attributes to numerical ones [21].
As shown in Table 3, 13 datasets are usually used to evaluate the classification methods. For the purpose of detecting outlier data, one or more classes are considered as outliers in this datasets. We do this on the basis of the characteristics of the outliers which are proposed in Section 3.1. And the specific knowledge background of these datasets can be referred in the literature [21].
Characteristics of 13 data sets
Characteristics of 13 data sets
As can be seen from Table 3, the dimensionality and the outlier number of these datasets are variable. The # of features is the attribute number of each object in a dataset and it represents the dimension of the each dataset. And the # of data is the number of samples in a dataset.
To illustrate the distributions, as shown in Fig. 2, we also give the first two principle components of four selected datasets. Here, the normal data is denoted by blue solid diamond and outliers are denoted by red hollow rectangles. In this way, it can be seen that outliers are mostly different from the normal data.
Data distribution.
We have analyzed the knowledge background of each dataset to show the distributions of normal and outlier data. Our evaluation uses 13 datasets which contain 166
Heatmap of dataset.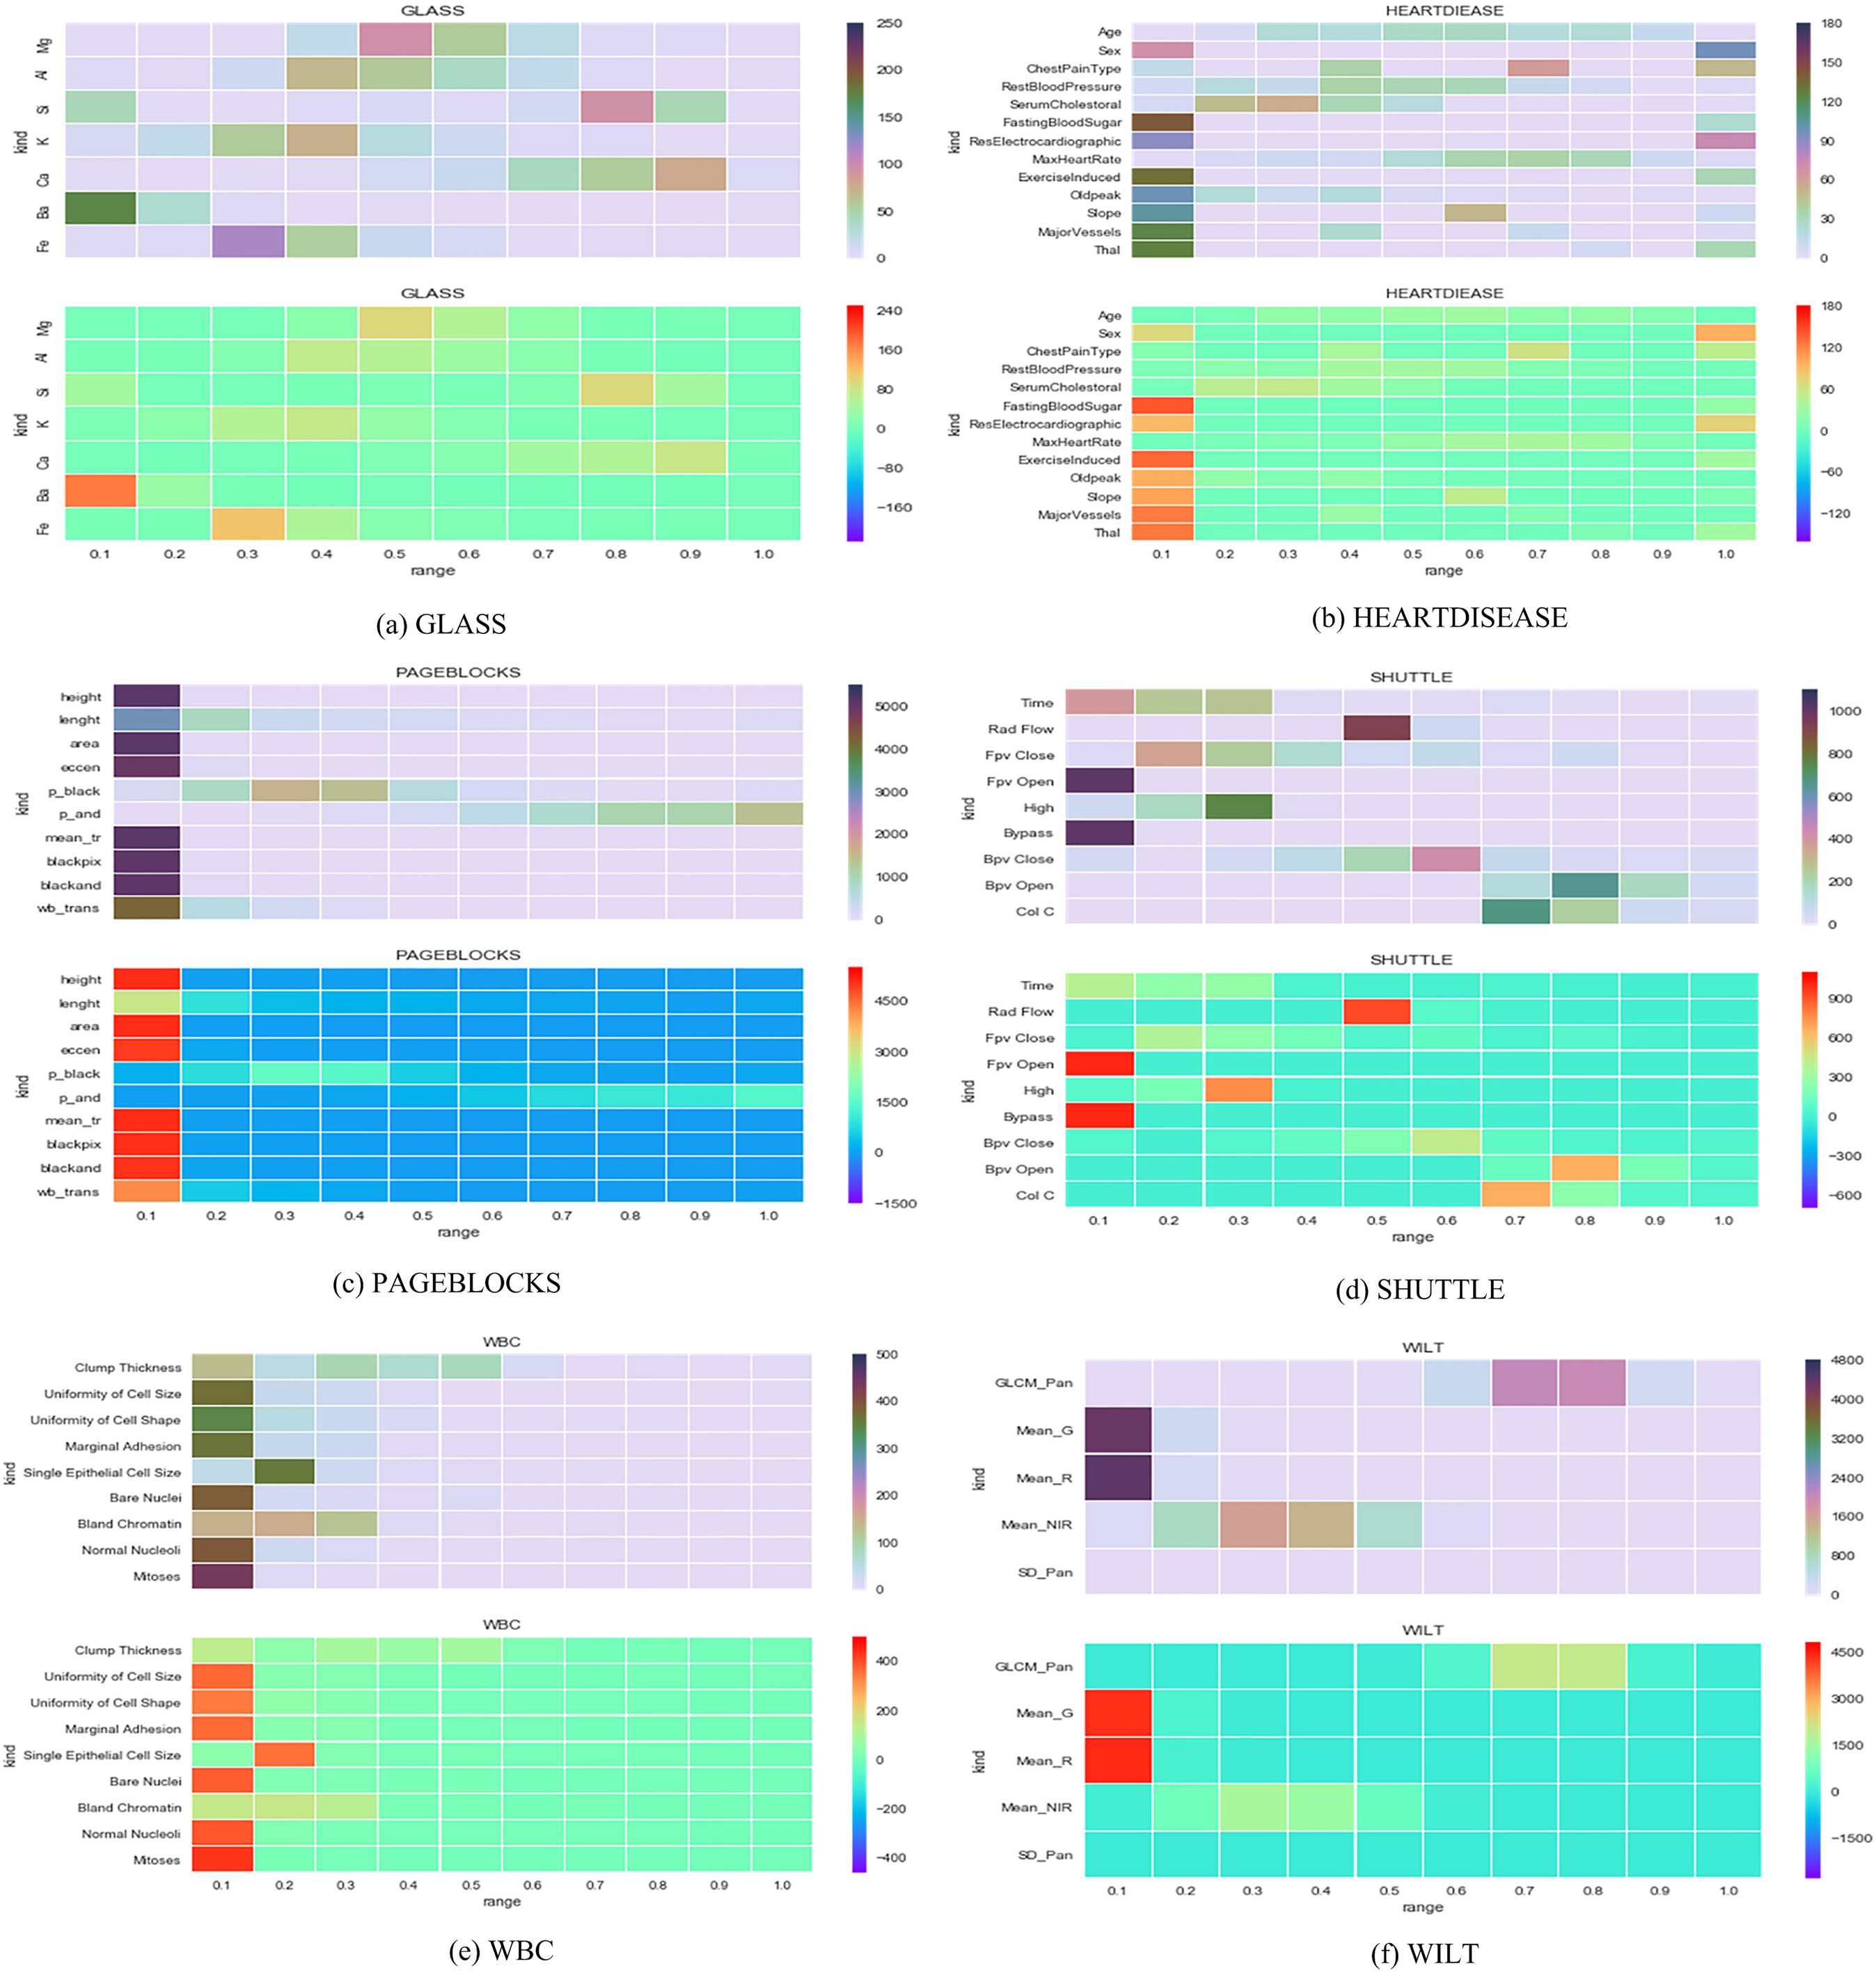
We compare our approach with four widely used outlier detection approaches, which are LOF [3], INFLO [4], RDOS [5] and LDOF [9]. All these methods mentioned above are based on the nearest neighbor method, so the threshold of the parameter
F1 comparison.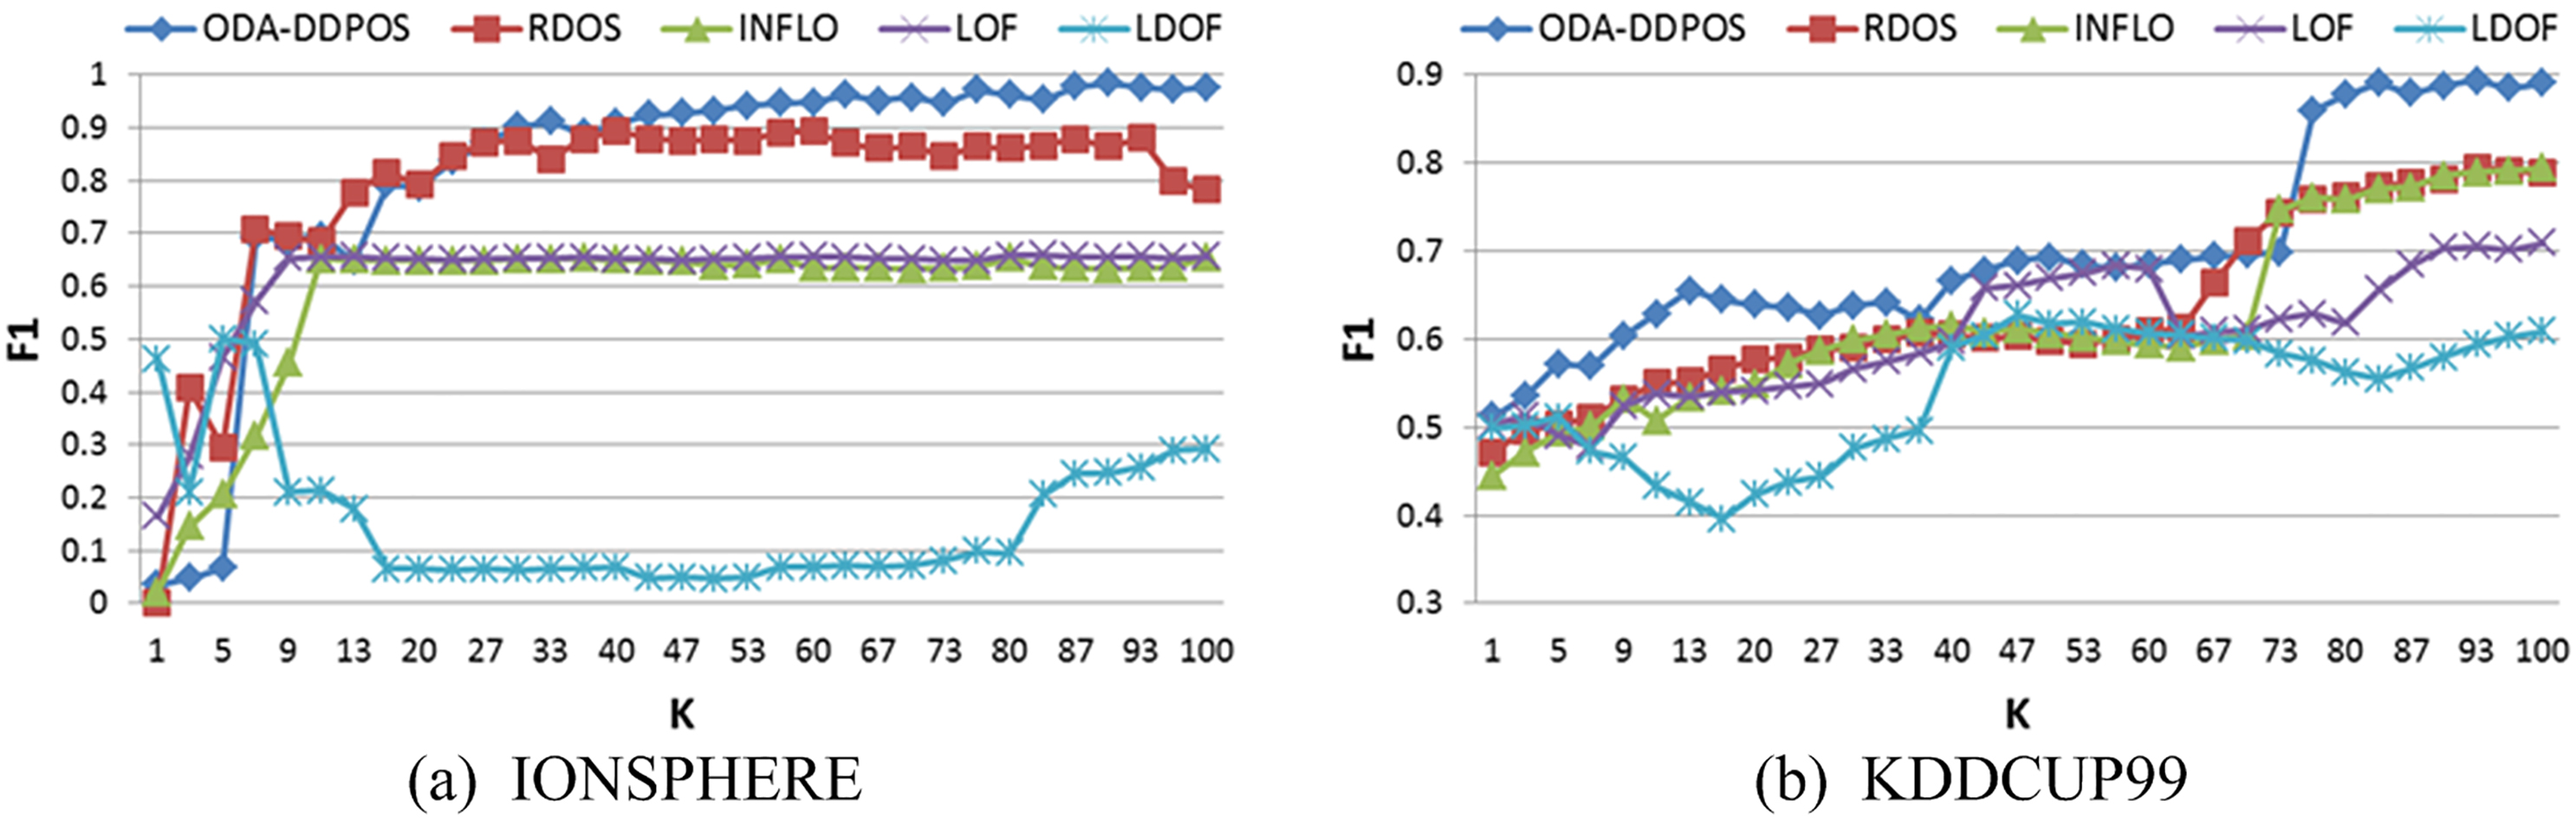
F1 comparison.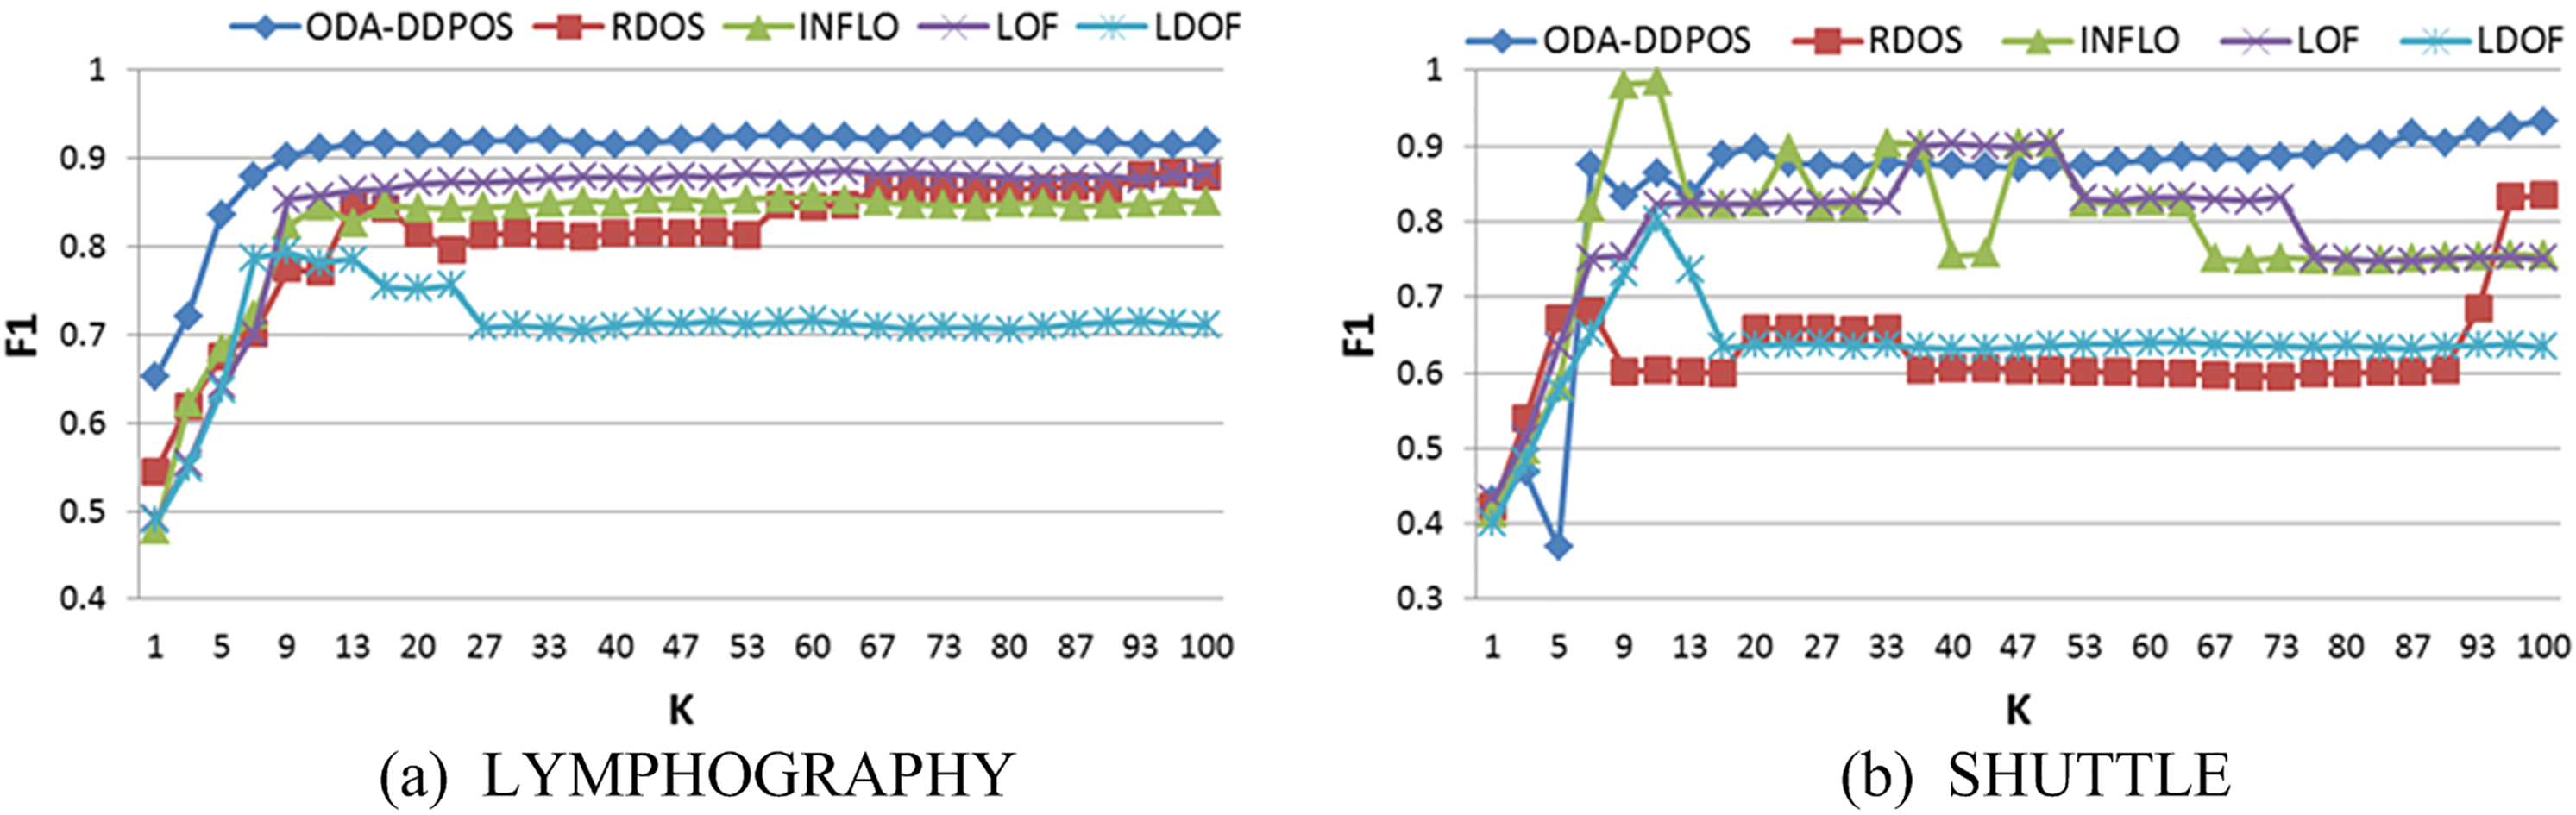
F1 comparison.
F1 comparison.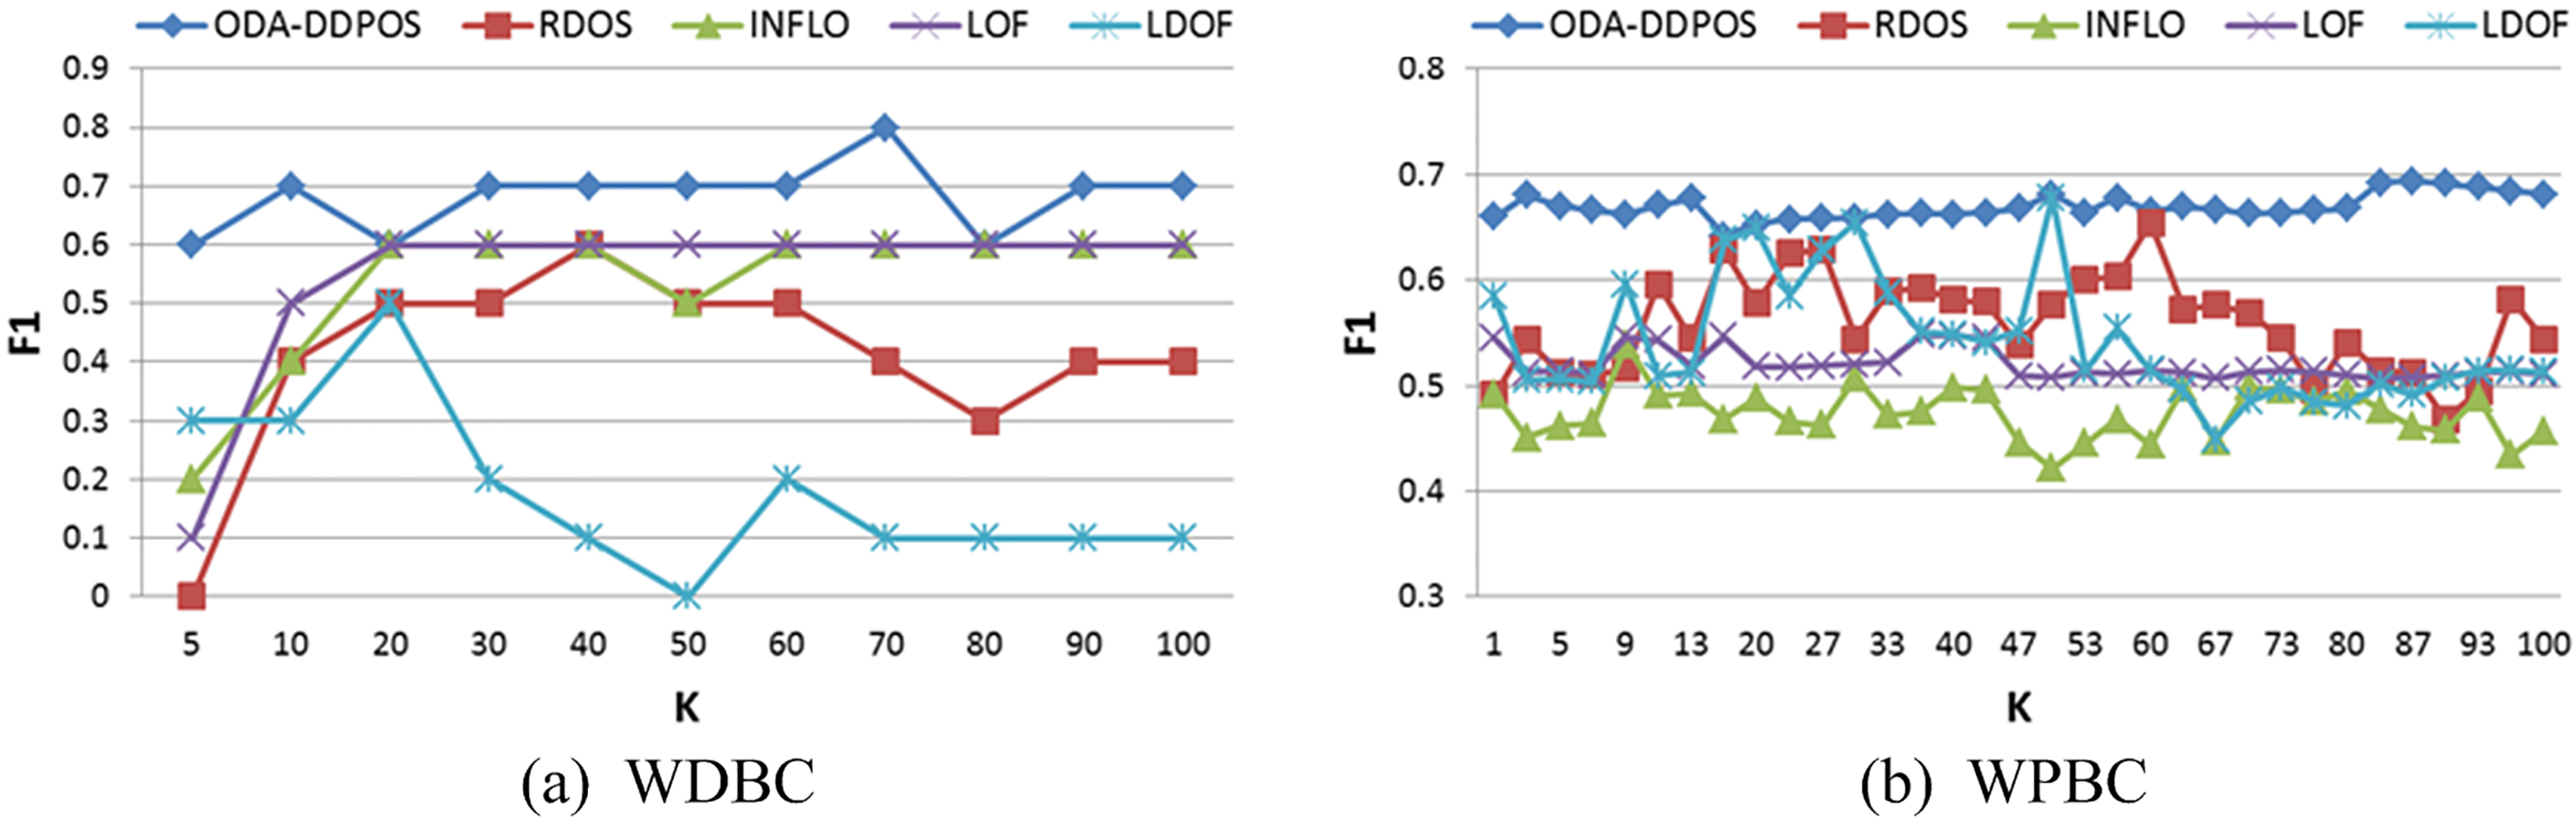
F1 comparison.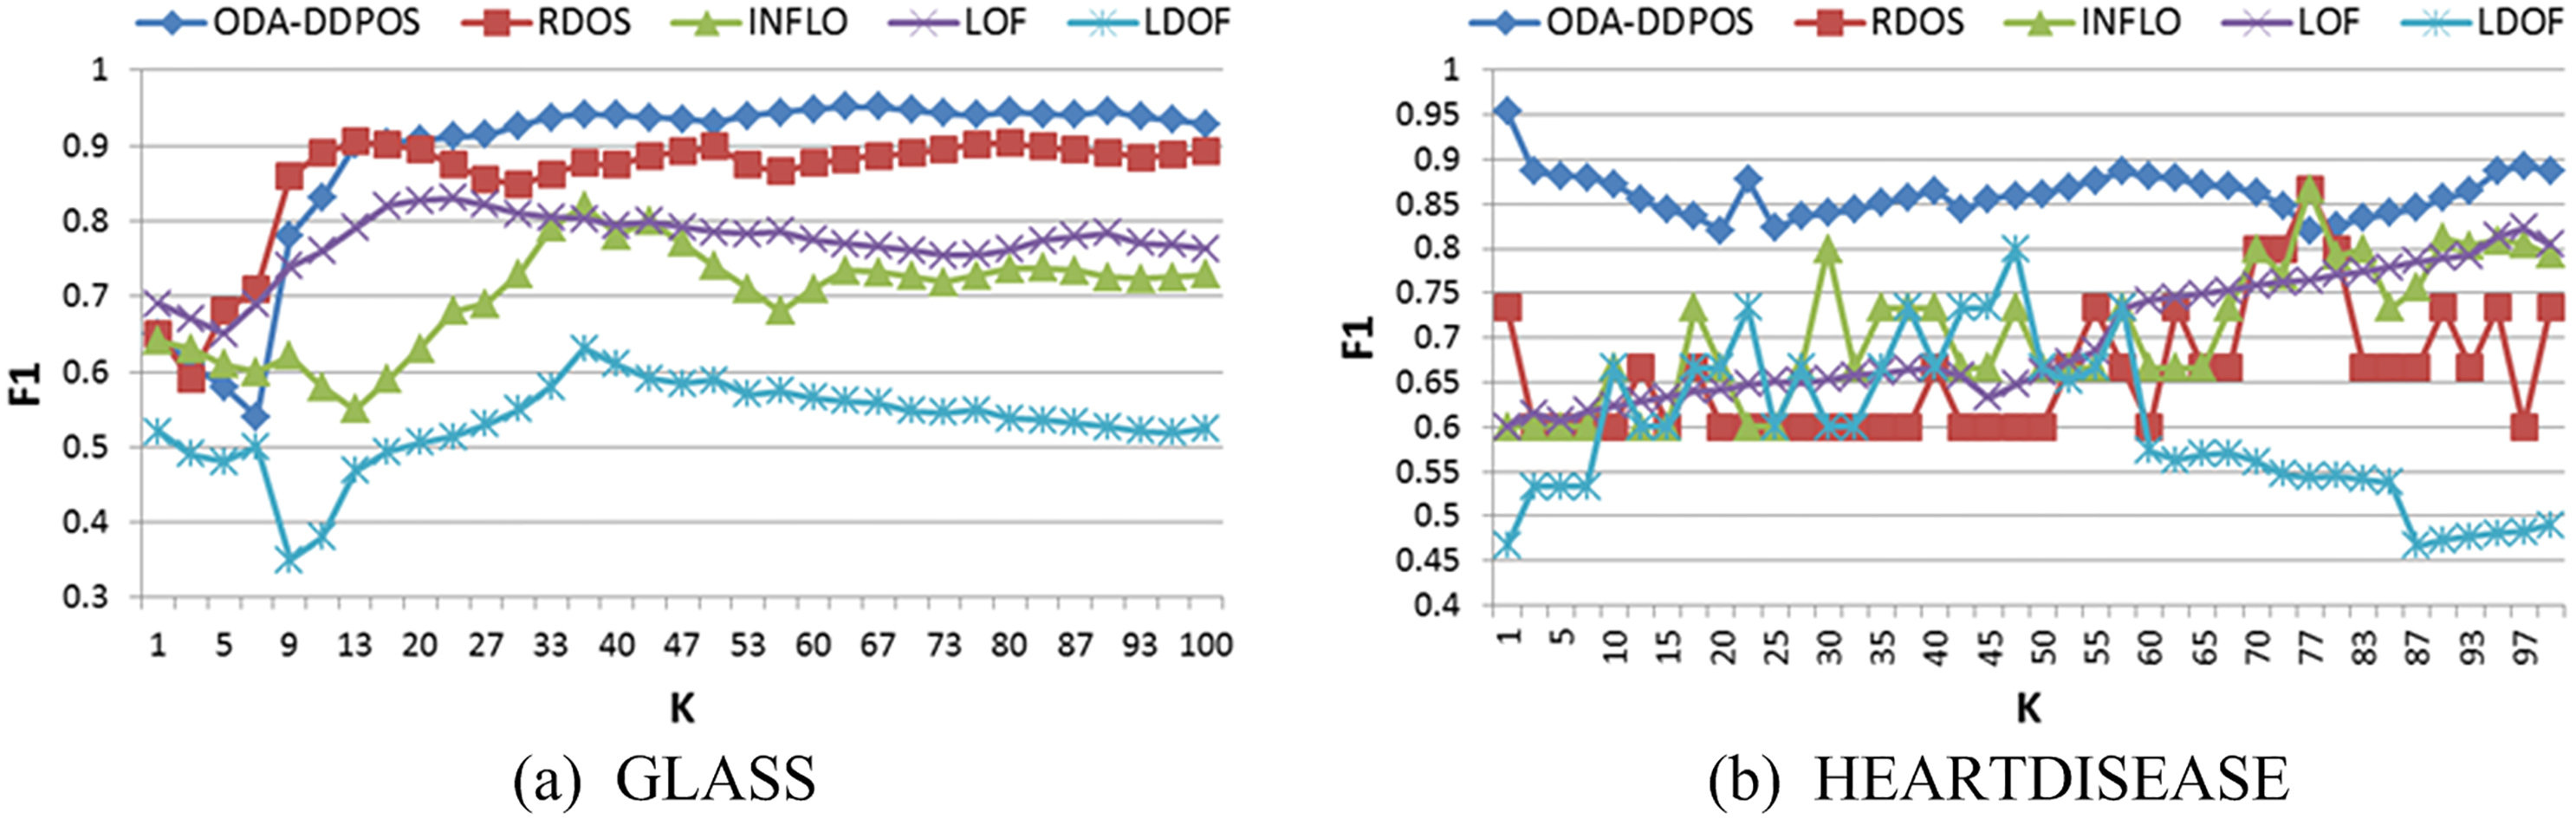
F1 comparison.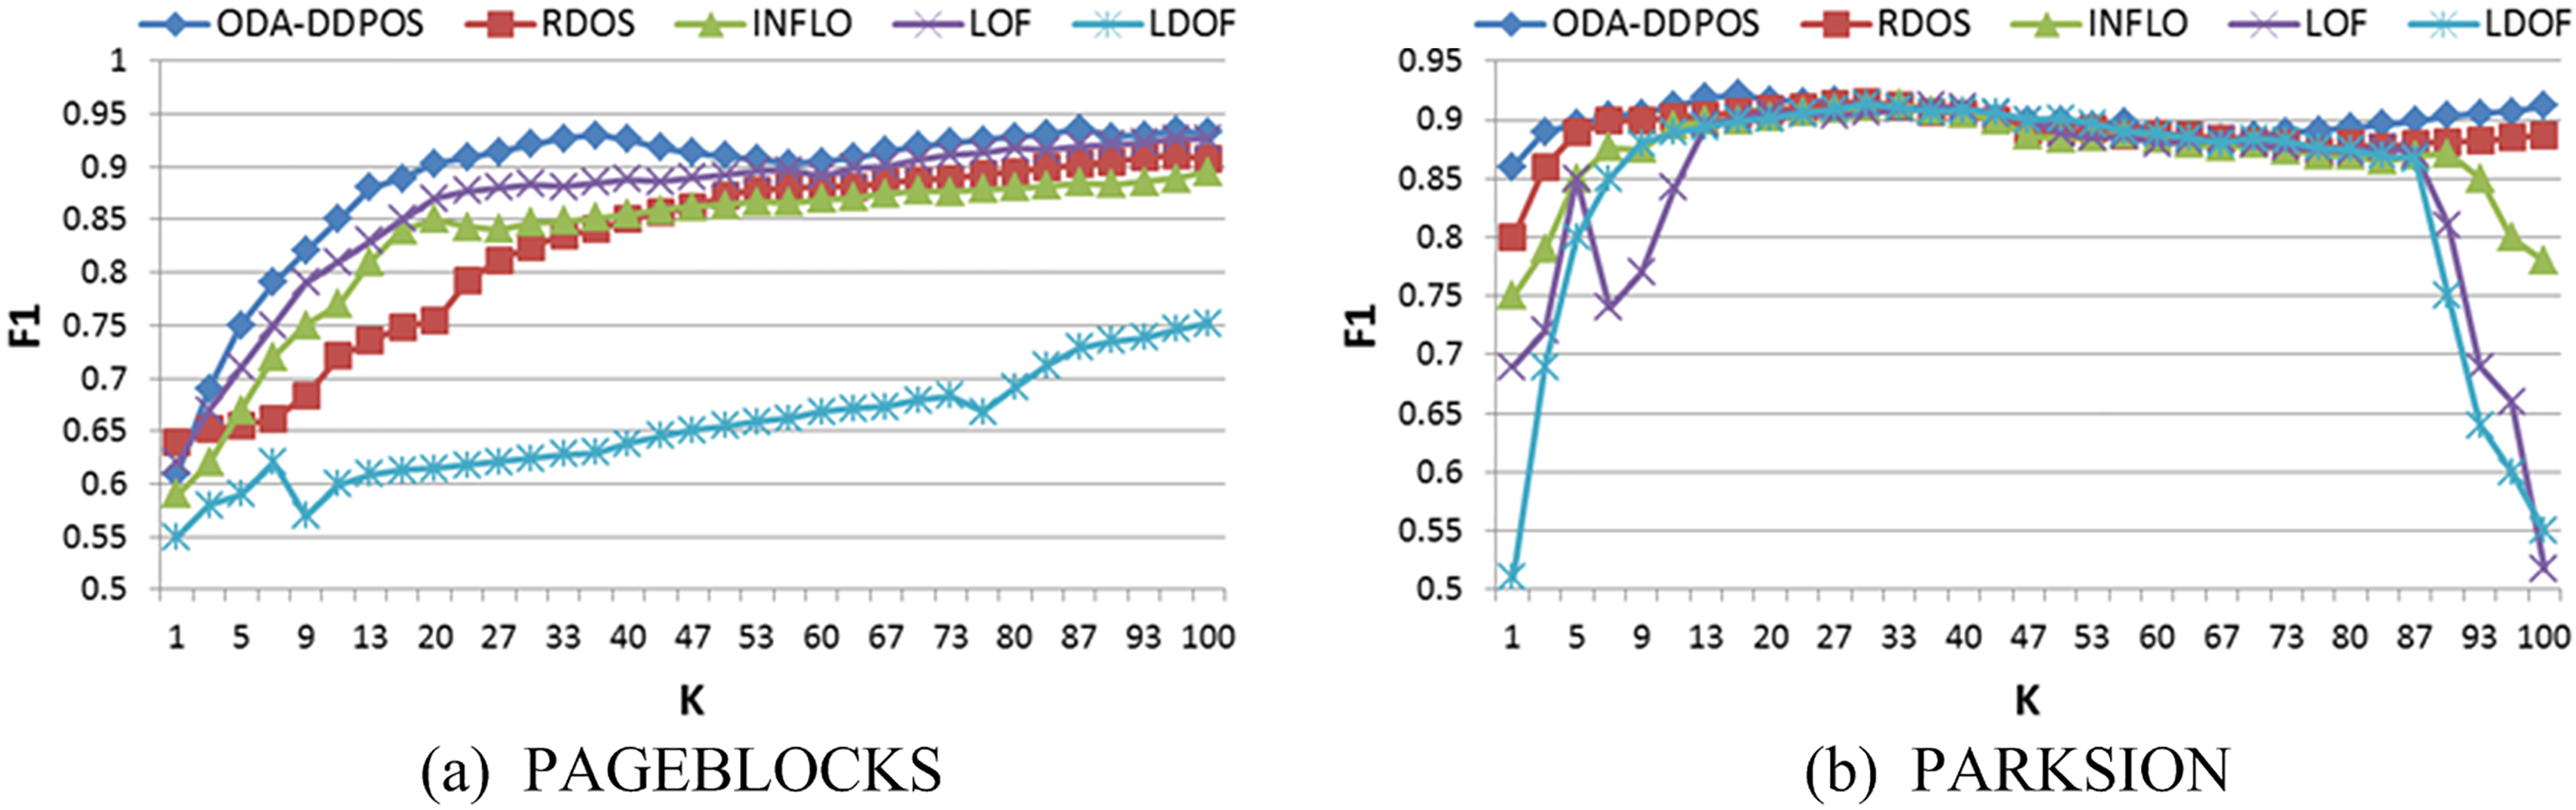
F1 comparison.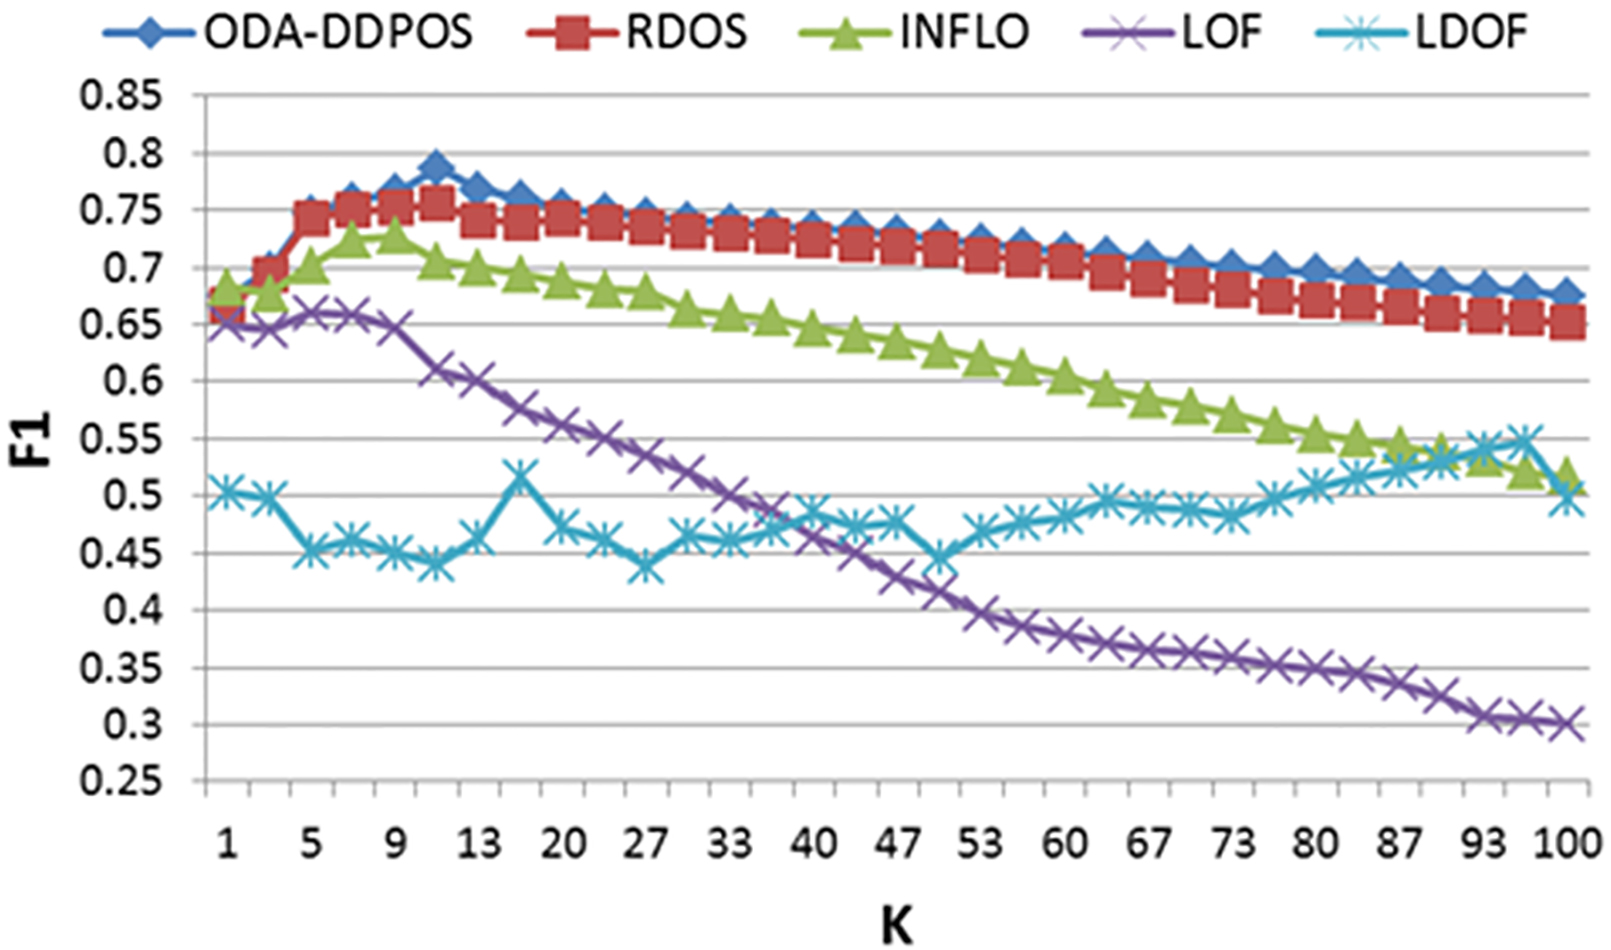
Average TPR preference.
We give F1 curves on the IONSPHERE and KDDCUP99 in Fig. 4. As shown in Fig. 4a, it is not a big difference and the positive rate is slightly lower when
Figure 5 is F1 curves on the LYMPHOGRAPHY and SHUTTLE. As is shown in Fig. 5a, the performance of ODA-DDPOS is better than that of the other algorithms. And as is shown in Fig. 5b, the INFLO behaves better than ODA-DDPOS when
Figure 6 is F1 curves on the WAVEFORM and WBC. As is shown in Fig. 6a, the trend of ODA-DDPOS is almost similar to that of LOF algorithm. But the positive rate of ODA-DDPOS is exceeded that of LOF algorithm. It can be seen from Fig. 6b, ODA-DDPOS is displayed an excellent F1 positive rate on the beginning. And it is only a little bit lower when the value of
Figure 7 is F1 curves on the WDBC and WPBC. In Fig. 7a, the positive rate of ODA-DDPOS is excellent and the trend is going pretty smoothly than all other algorithms. It also has the highest average positive rate because WDBC and WPBC are the deformable datasets of WBC, its performance behaves almost stable as a whole. The trend of ODA-DDPOS in Fig. 7b is basically same as that of WDBC. The trend of ODA-DDPOS is more stable compared with other algorithms. And it does not produce very drastic changes affecting the stability of the whole algorithm.
Figure 8 is F1 curves on the GLASS and HEARTDISEASE. In Fig. 8a, the positive rate of ODA-DDPOS is the best when the value of
Figure 9 is F1 curves on the PAGEBLOCKS and PARKSION. In Fig. 9a, the positive rate of ODA-DDPOS rises gradually with increasing
Figure 10 is F1 curve on the WILT. In Fig. 10a, the positive rates of ODA-DDPOS and RDOS are very similar. ODA-DDPOS maintains a narrow lead in the whole process. It is worth noting that it has obvious advantages when the value of
As is shown in Fig. 11, ODA-DDPOS is always superior. In particular, it is revealed that ODA-DDPOS has ideal effectiveness in nine datasets, including IONSPHERE, KDDCUP99, LYMPHOGRAPHY, WBC, WDBC, WPBC, GLASS, HEARTDISEASE and PAGEBLOCKS. As for SHUTTLE, WAVEFORM, PARKSION and WILT, ODA-DDPOS algorithm shows the same performance. The average effects of all experiments can be expressed as follows: ODA-DDPOS
How to identify the outliers is an essential task in data mining. In this paper, a new outlier detection method based on local density-global distance estimation is proposed. In ODA-DDPOS, we take two parameters as the conditions for determining outlier factor. The results on both synthetic and real-life datasets verify that the proposed ODA-DDPOS method is an efficient outlier detection algorithm.
In ODA-DDPOS, determining of the parameter
Footnotes
Acknowledgments
The corresponding author would like to thank the support from the National Natural Science Foundation of China under the Grant of 61402363, the Education Department of Shaanxi Province Key Laboratory Project under the Grant of 15JS079, Xi’an Science Program Project under the Grant of 2017080CG/RC043 (XALG017), the Ministry of Education of Shaanxi Province Research Project under the Grant of 17JK0534, and Beilin district of Xi’an Science and Technology Project under the Grant of GX1625.