
Abstract
With the rapid development of China’s insurance industry, insurance fraud incidents are also increasing, especially in the field of auto insurance. Therefore, the vehicle insurance fraud identification model based on extreme learning machine is studied. Because the initial connection weight and hidden layer neuron threshold of the ELM are generated randomly, the recognition results are unstable and the accuracy is affected. Therefore, artificial fish swarm algorithm is used to optimize the model parameters. This paper adaptively improves the step size, visual field and crowding degree of artificial fish swarm. First of all, the principal component analysis method is used to generate the input vector of the ELM model for vehicle insurance fraud. Then the weights and thresholds of the ELM model are optimized by improved artificial fish swarm algorithm. Finally, the model is applied to vehicle insurance fraud identification. The empirical analysis shows that the optimized model has less recognition error and higher recognition stability compared with the traditional ELM classification model.
Introduction
In recent years, with the continuous improvement of the quality and efficiency of China’s economic development, the insurance industry of China has also shown a rapid growth trend [1]. The insurance premium of automobile insurance, as the largest type of property insurance in China, is also increasing year by year. According to the report on insurance statistics issued by the China Insurance Regulatory Commission for 2018, between January and April, the original insurance premium income of property insurance companies increased by 16.13% over the same period last year, an increase of 4.26 percentage points from the same period last year. Of this total, auto insurance business amounted to 255.702 billion RMB, an increase of 6.59% over the same period last year, accounting for 63.16% of the total business of property insurance companies. With the increasing of the amount of auto insurance, the amount of auto insurance claims is also increasing, and the number of auto insurance fraud cases is also increasing. Insurance fraud not only disturbs the normal order of the insurance industry, but also infringes on the interests of insurance institutions, thus affecting the pricing strategy of insurance companies and destroying the order of the market [2]. Therefore, it is very important to establish a scientific anti-insurance fraud identification system.
The research of anti-insurance fraud identification is of great significance to the development of society. Traditionally, insurance fraud detection depends on audit and expert identification to a great extent. However, manual detection of fraud cases is of high cost and low efficiency. In order to better identify fraud information, many insurance companies use data mining technology to identify fraud information, predict fraud information and mine fraud rules. Data Mining Technology is increasingly regarded as the key means of Fraud Detection [3, 4, 5]. In recent years, numerous scholars have devoted themselves to research of data mining in insurance fraud identification [6]. Verma et al. proposed a method to detect abnormal outliers in insurance claims by using data mining technology [7]. Rawte and Anuradha proposed a new hybrid method to detect fraudulent claims for medical insurance through two learning techniques of supervised and unsupervised in hybrid data mining [8]. Yaram et al. proposed a machine learning algorithm for document clustering and fraud detection [9]. Bhowmik et al. adopts the model of Nave Bayesian classification and decision tree algorithm to solve the fraud problem of automobile insurance [10]. Ye taking China’s motor vehicle insurance as an example, proposes using a BP neural network to detect insurance fraud [11]. Li et al. proposed a potential nearest neighbor stochastic forest method based on principal component analysis for the identification of automobile insurance fraud [12]. Tang and Mo using data mining techniques such as support vector machine and Apriori algorithm, a vehicle insurance anti-fraud detection system model is proposed [13]. Yan et al. put forward a vehicle insurance fraud identification model based on ant colony algorithm to optimize random forest. This model can classify and predict the claim data of automobile insurance more effectively and excavate fraud rules. It has better accuracy and robustness [14].
At present, factor analysis, regression analysis logit model and Probit model are used to analyze and identify insurance fraud in the world. The purpose of these analytical methods is to try to identify quantifiable indicators that affect insurance fraud and to test the existing insurance fraud in the insurance market through the established model [15]. The identification of insurance fraud in the initial stage is based on mathematical statistics, the main idea of the algorithm is “model and regression analysis”. Artist Montsrrat Guillen uses the logit method to identify and analyze the data in the case of motor vehicle claim in Spain. Although the method is effective, it can not identify the missing data. In order to solve the problem of missing data better, Caudill used multivariate logit method to study fraud identification. Although this model can be greatly improved compared with the original logit method, it has a high demand for data. This becomes the main shortcoming of the recognition model [16]. In this paper, a fraud model is established by using the neural network-based Extreme Learning Machine (ELM) proposed by Huang. The connection weights of the input layer and the hidden layer and neuron thresholds of the hidden layer are generated randomly by the ELM algorithm, and the unique optimal solution can be obtained by setting the number of neurons in the hidden layer without adjustment during the training process. The ELM is a simple algorithm for the training of single layer feedforward newral networks, whose learning speed can be faster then tradition gradient descent methods such as back-propagation (BP) and better generalization capacity may also be obtained. However, random parameters generated by ELM algorithm will result in poor generalization performance of the network. In order to improve the prediction accuracy, it is often necessary to increase the number of hidden layer nodes, but too many hidden layer nodes will increase the complexity of the network and prone to network overfitting problem [17].
Artificial fish swarm algorithm (AFSA) was first proposed by Dr. Li Xiaolei in 2002. AFSA is kind of swarm intelligence optimization algorithm based on fish swarm behavior. The simulation of fish preying, swarming, Chasing, random behavior in the whole domain to search for optimization. In recent years, many scholars have applied artificial fish to the optimization of ELM. Ge and others used fish swarm algorithm to optimize ELM to establish a prediction model, and then use this model to study the capacitor prediction of power capacitor banks. Finally, the experimental results show that the prediction accuracy of ELM model optimized by fish swarm algorithm is obviously higher than that of PSO-ELM model, GA-ELM model and DE-ELM model [18]. Zhou and others used the improved artificial fish swarm optimization ELM to establish a prediction model, and then applied the model to breast tumor assistant diagnosis. Finally, the experimental results show that the prediction results of the improved artificial fish swarm algorithm to optimize the ELM prediction model are better than the original artificial fish swarm optimization ELM model and ELM model [19]. Lin and others constructed a better classifier by combining ELM classifier with artificial fish swarm optimization algorithm. Finally, the experimental results show that the accuracy and efficiency of this new classifier is much higher than that of the traditional ELM classifier [20]. Aiming at the problem of ELM, this paper combines with the improved artificial fish swarm algorithm to optimize the weight and threshold of ELM, and establishes the IAFSA-ELM model of vehicle insurance fraud identification. Through adaptive improvement of the step size, visual field and crowding degree of artificial fish, artificial fish swarm can find the global optimal solution more quickly and get rid of local extremum.
Artificial fish swarm algorithm
Artificial fish swarm algorithm is mainly used to simulate fish preying, swarming, Chasing, random and other behaviors in the whole domain for optimization. Each behavior is designed to make the fish faster to find the highest concentration of food.
Preying behavior: This is the most basic behavior of fish survival. It is generally believed that fish choose the trend through visual or taste perception of water food concentration. Swarming behavior: Swarming behavior is a kind of survival mode formed during the evolution of fish herd, which can conduct collective preying and avoiding enemies. Chasing behavior: When a fish or several fish finds food, the nearby fish will follow and swim, causing the farther fish to follow. Random behavior: Fish swim randomly in the water, also in search of a wider range of food or companions. These behaviors of artificial fish can be transmuted by their perception of the environment.
Traditional artificial fish swarm algorithm
Fish range of vision: visual. Fish moving step: step. Congestion factor:
Make the current position is
Preying behavior: Let
Where
Flow chart of traditional artificial fish swarm algorithm.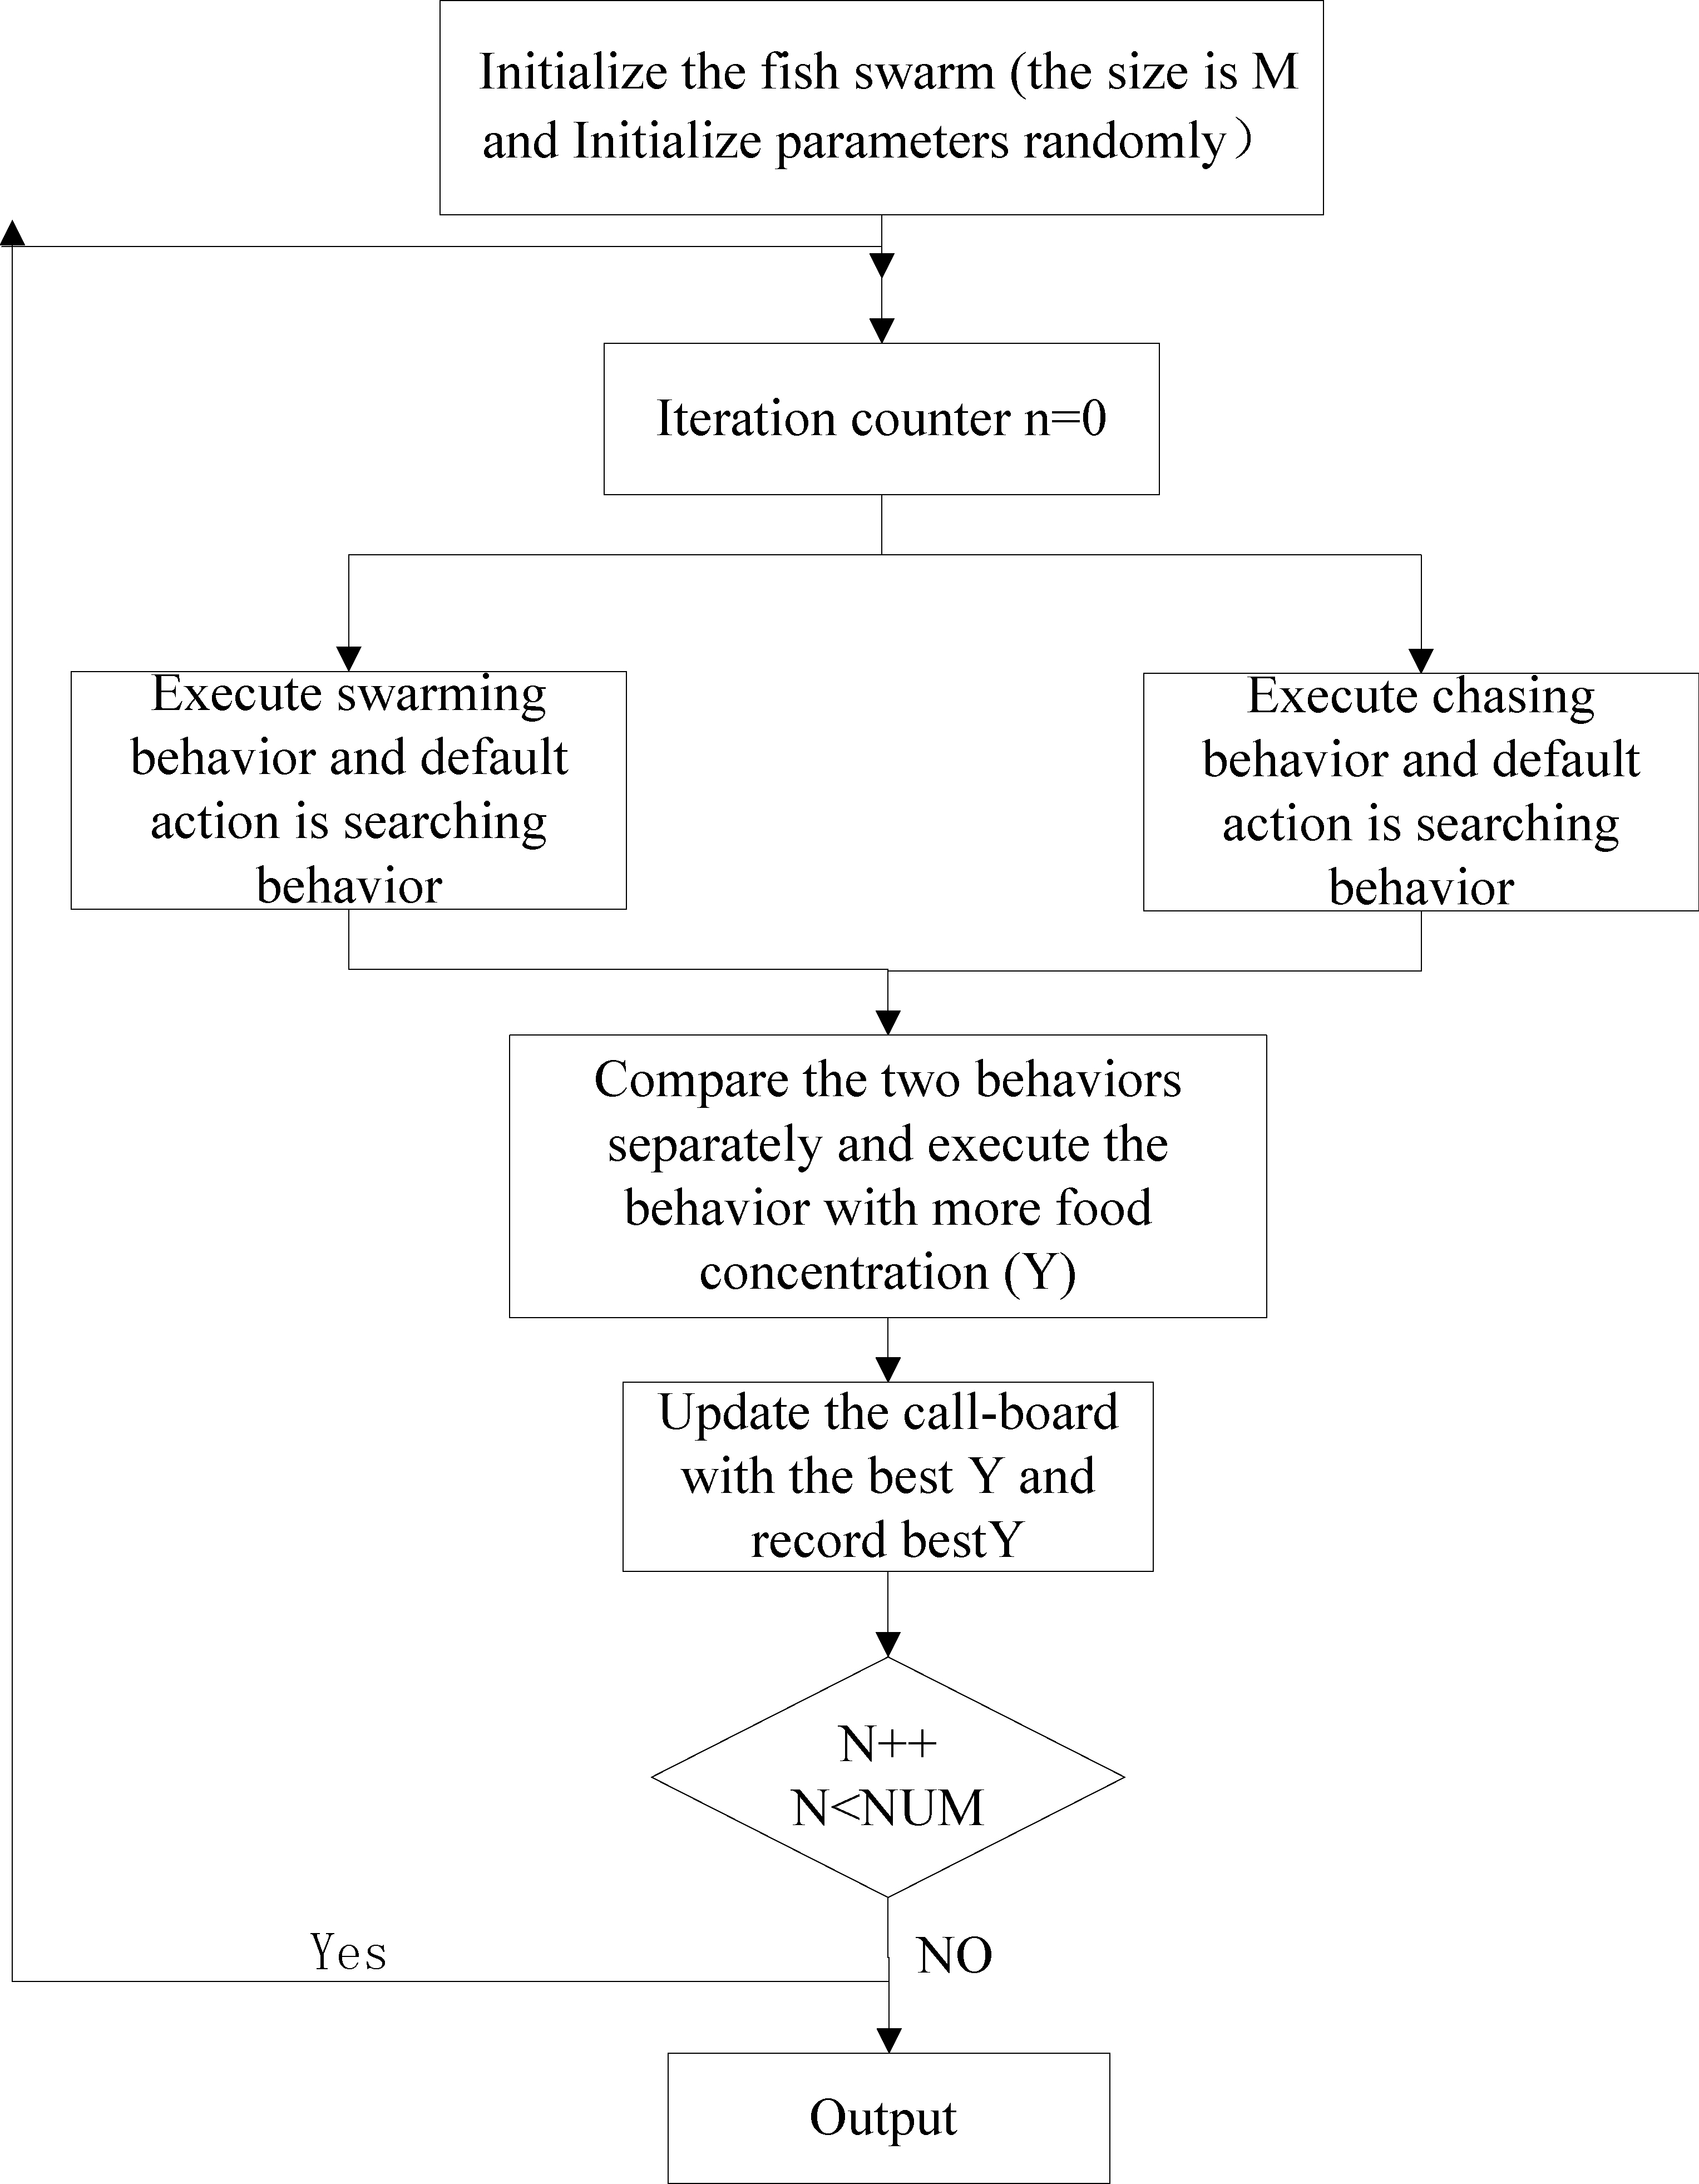
visual and step: The field of vision determines the search range of artificial fish, and the step size determines the convergence speed and accuracy. If the field of vision is large, the global search ability of artificial fish is strong, the artificial fish can jump out of the local extremum, the Chasing behavior and swarming behavior of artificial fish are also prominent. If the field of vision is small, the local search ability of artificial fish is stronger, preying behavior and random behavior are more prominent. In the early stage of iteration, the convergence rate increases gradually with the increase of step size, but in the late stage of convergence, if the step size is large, artificial fish oscillate back and forth near the optimal value, but it is difficult to approach the optimal value accurately [21]. try_number item: The more the number of artificial fish is, the more intelligent the fish is, the faster the convergence rate is, the higher the precision is, and the stronger the ability of jumping out of local extremum is. At the same time, because of the increase of fish population, the computation of algorithm will increase greatly. The more the artificial fish try, the stronger the preying ability of artificial fish is, and the faster the convergence rate is. But when the local extremum is more prominent, it is easy to miss the global extremum and thus miss the global optimization.
Improvement of step size
In the process of predation, traditional artificial fish move at fixed step lengths. If the step size is large, the accuracy of solution is not high. At the late stage of evolution, the fish flock fluctuates around the optimal solution. If the step is small, the solution is accurate but the convergence rate is too slow, and it is easy to fall into the local maximum value. In this paper, the step parameters are adjusted adaptively according to the number of iterations. Given a large step at the beginning of the iteration, the convergence rate can be accelerated, with the increase of the number of iterations, the step parameter decreases gradually [23]. According to the various behaviors of fish, two different step were determined, one step was used for preying behavior and random behavior, one step for swarming behavior and Chasing behavior.
The step of preying behavior and and random behavior are updated as follows:
The location of preying and random behavior is updated as follows:
Adjustment parameters of
The selection of weights
The step of swarming behavior and Chasing behavior are updated as follows:
Adjustment parameters of
According to the analysis of parameters, the larger the field of view is, the stronger the global search is. When the minimum value is obtained, the smaller the crowding degree is, the stronger the global convergence ability is. Therefore, in the early stage of algorithm operation, selecting a larger field of view and a smaller crowding factor can effectively improve the algorithm’s global search ability and convergence speed.
visual can be adjusted according to Eq. (6)
Variation curve of adjusting parameter a.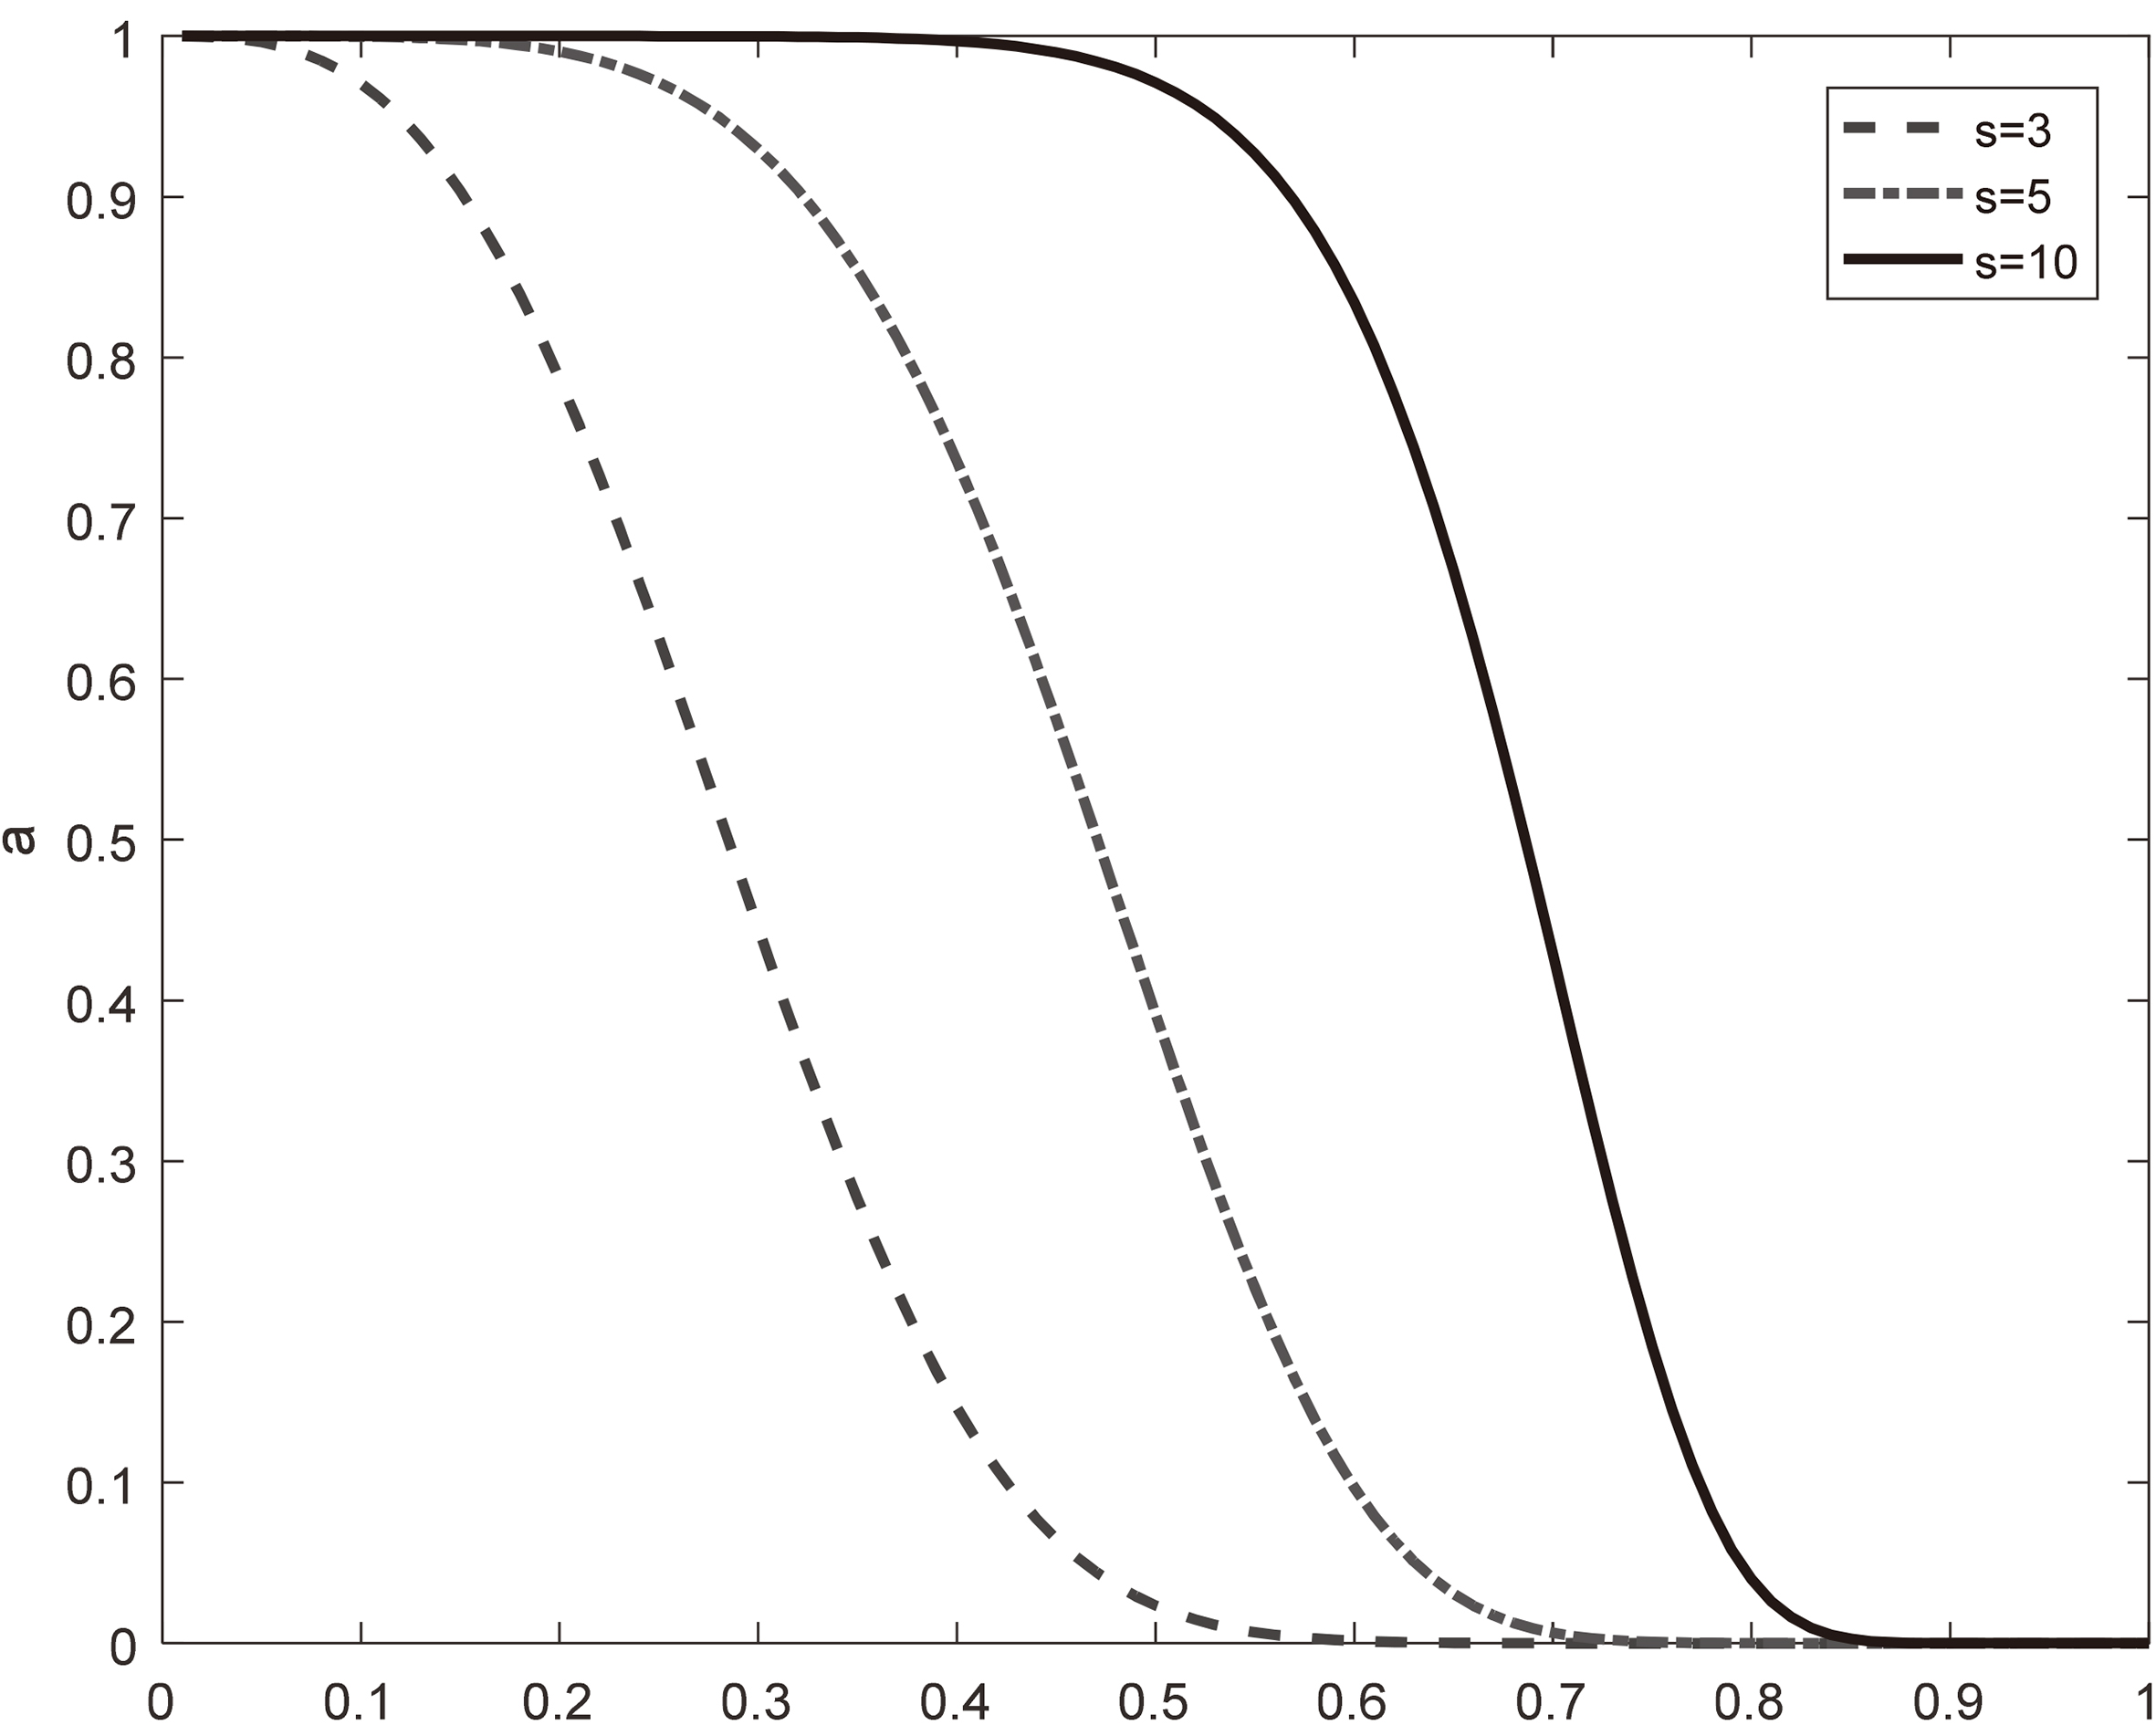
Where
The crowding factor indicates the degree of allowable crowding. When the crowding parameter is between 0 and 1, the greater the crowding degree is, the smaller the degree of allowable crowding is, which is conducive to convergence to the global, but the accuracy is slightly poor; When the parameter of congestion is larger than 1, the smaller the parameter is, the smaller the allowable degree of crowding is, which is favorable to global convergence, but the degree of precision solution also decreases [22].
IAFSA algorithm main program pseudo code is follows.
Pseudocode for preying behavior and random behavior of the IAFSA are as follows.
The pseudocode for swarming behavior of the IAFSA is as follows.
The pseudocode for chasing behavior of the IAFSA is as follows.
Extreme learning machine algorithm
ELM is a feed forward neural network with a single hidden layer, which consists of input layer, hidden layer and output layer, and the neurons between the layers are fully connected. There are
In this paper, an improved artificial fish swarm algorithm (Improvement Artificial Fish Swarm algorithm) is proposed to optimize the fraud recognition model of ELM (IAFSA-ELM). The model overcomes the shortcomings of the ELM model, such as poor network generalization performance and low precision caused by the initial random weights of the ELM model. Considering the strong prediction ability of ELM and the excellent optimization ability of artificial fish swarm algorithm, the improved artificial fish swarm algorithm is combined with ELM algorithm.
IAFSA-ELM algorithm flow:
Data preprocessing of ELM network topology; Setting artificial fish population parameters; Artificial fish begin to optimize ELM; The artificial fish chooses the execution behavior to judge whether the convergence condition is reached or not; The artificial fish herd outputs the optimization result, which is the initial weight of the network, and executes the ELM network loop; Output the final result.
Flow chart of IAFSA-ELM algorithm flow.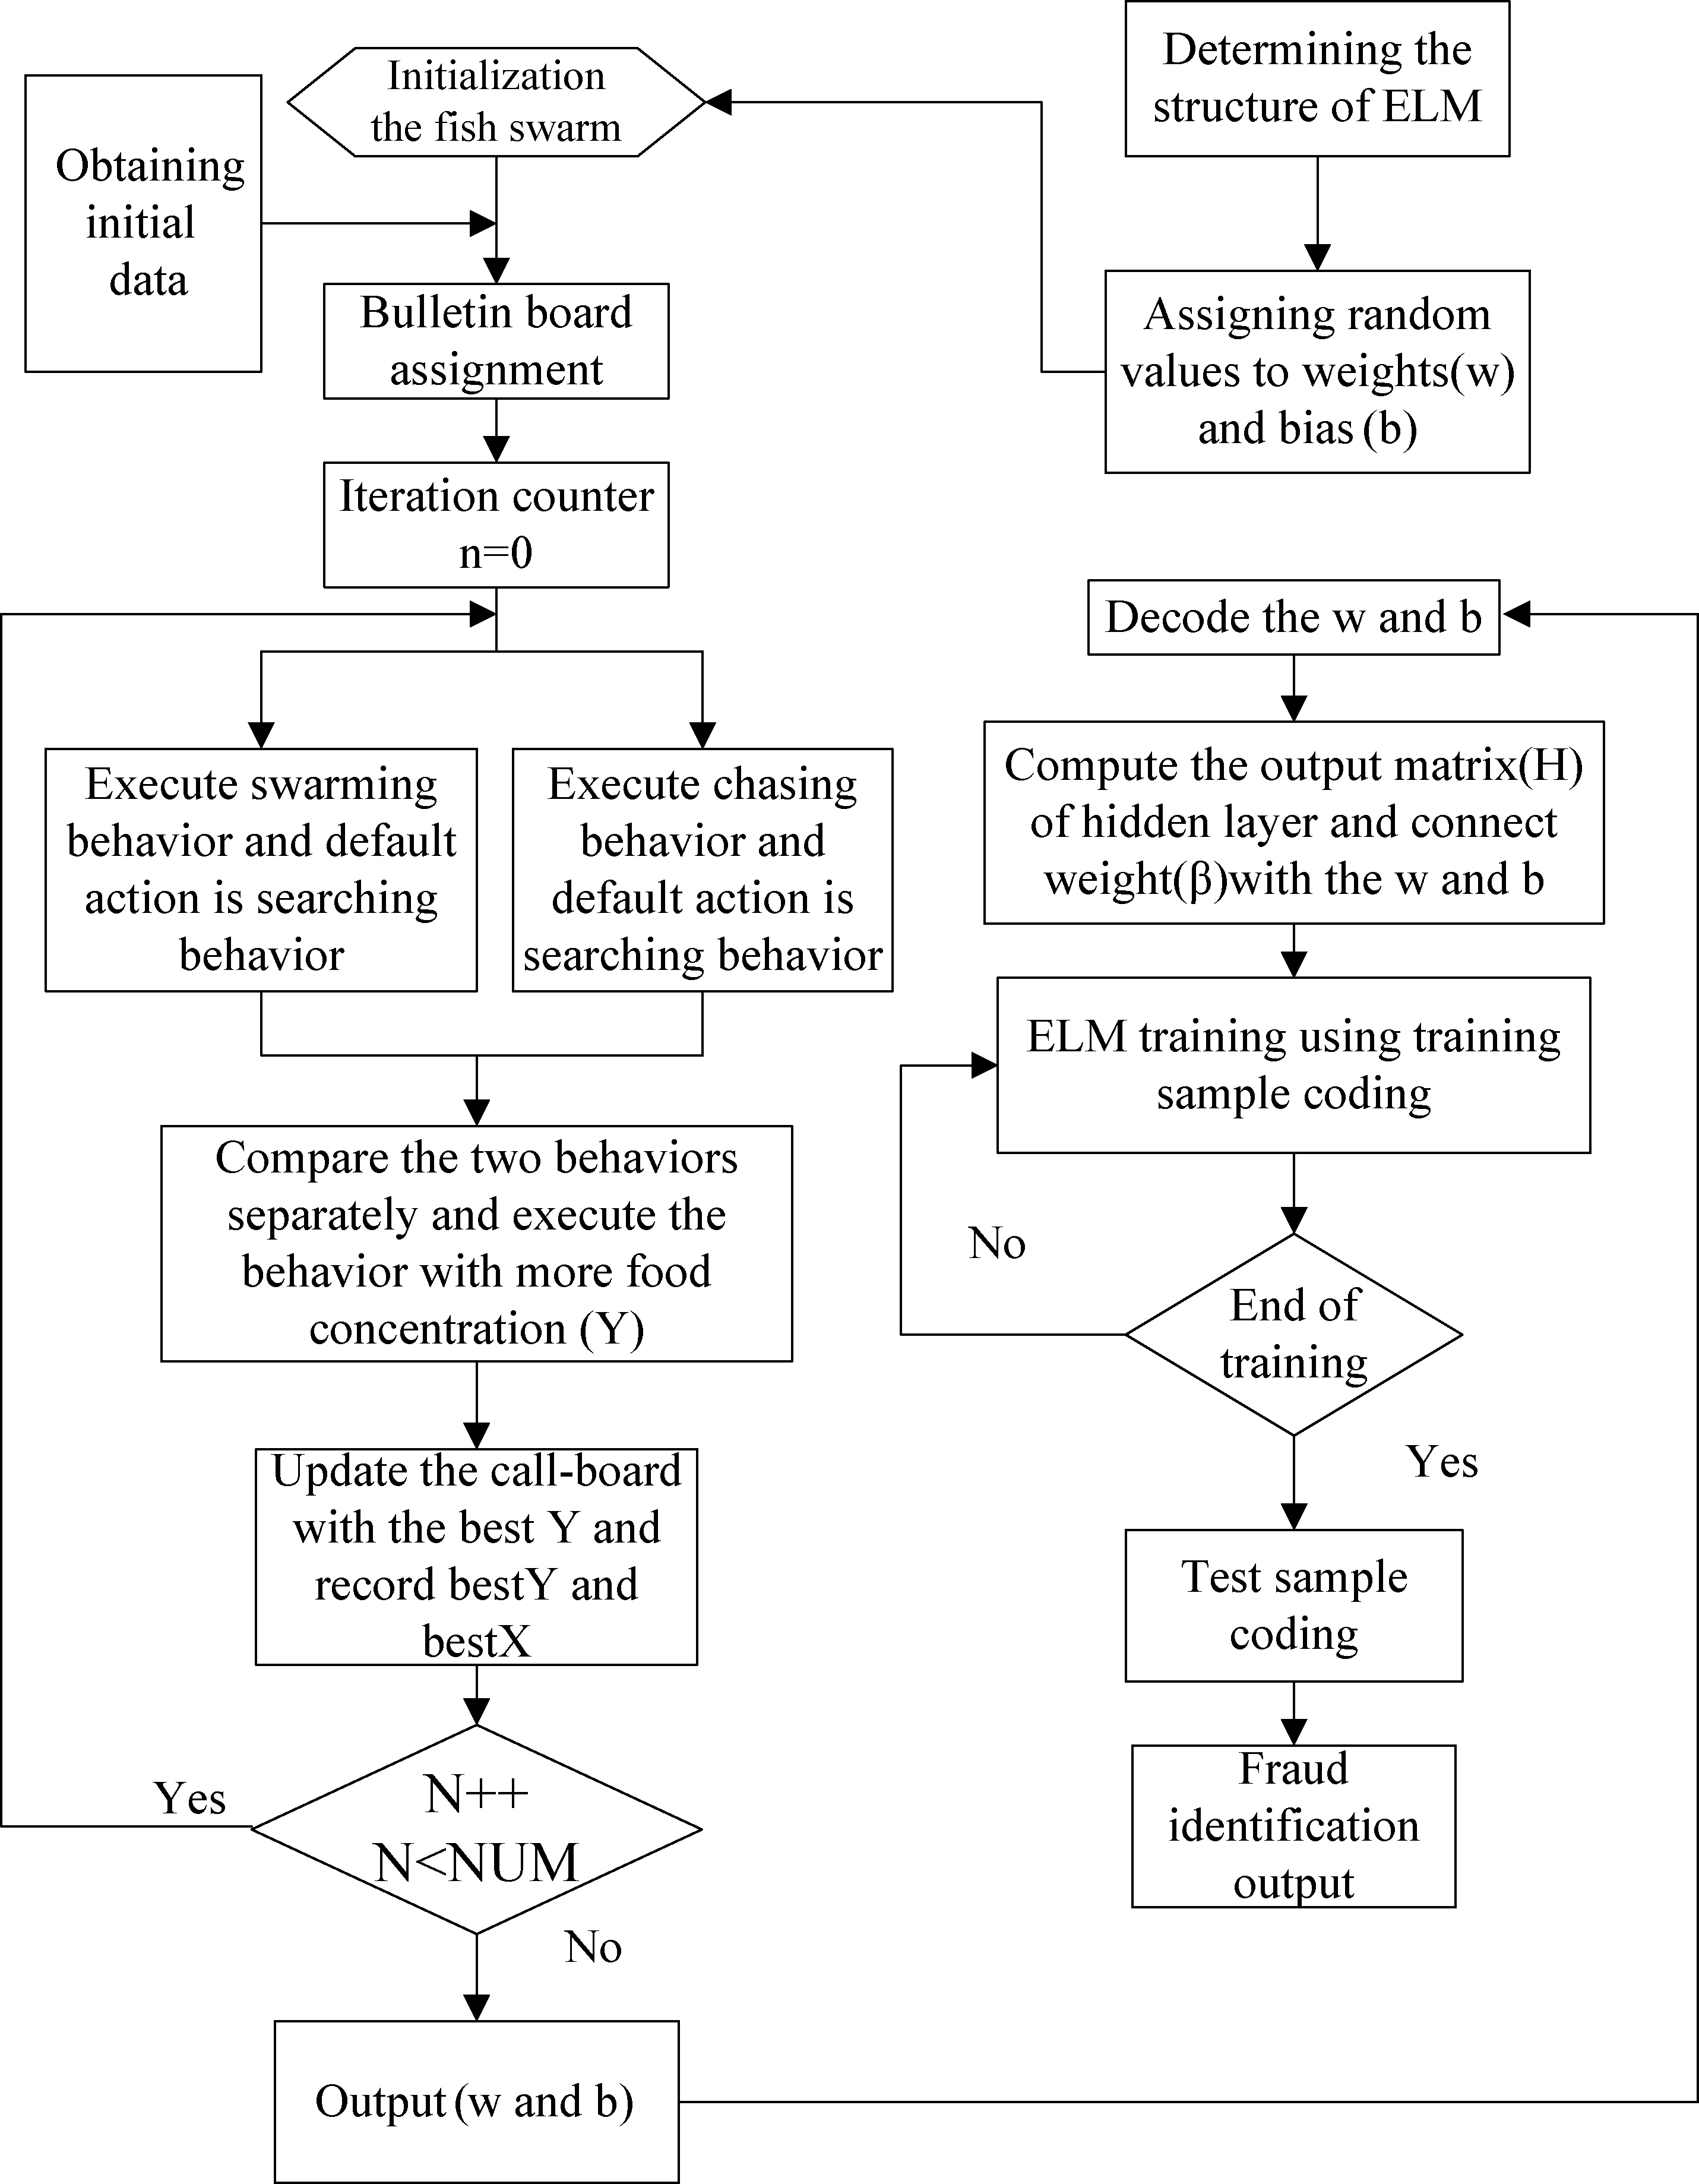
In order to verify the validity of the proposed algorithm in vehicle insurance fraud identification, this paper selects the historical claims of a vehicle insurance company as an example for fraudulent identification analysis [24]. Because the result of a claim is divided into honest claims and fraud claims, it can be seen as two categories of problems. In this paper, 500 auto insurance historical data of a certain insurance company are selected, of which 350 are honest claims and 150 are fraudulent claims.
Selection of vehicle claim index
Before mining the vehicle insurance fraud features, we need to select the appropriate evaluation indicators. According to the information of the insured, we select 15 independent variables as the index system of insurance fraud identification.
In this paper, 15 fraud indicators are divided into three factors: 1) Driver factor: Driving age (years)/Risk driver gender/Historical danger does not include this time. 2) Vehicle factor: Nature of vehicle/vehicle channel source/whether the guarantee is automatic or not/whether to correct the transfer of ownership. 3) Other factors: The interval between the insurance period and the insurance period (months)/car checking/whether to report the case on the spot/Survey type/number of hours reported/target reported man-hour fee/target repair plant type/fixed number of photos. Each variable type is described in Table 1.
Data set index description
Data set index description
Then we analyze the reasons for fraud identification by selecting 15 indexes from different means of vehicle insurance fraud.
Change the driver. The drivers in such cases are mainly drunk drivers, unlicensed drivers and other illegal drivers. After the accident, they find someone to replace them and then claim compensation to the insurance company. Most of the cases occur at night and are located in remote areas. There are very few witnesses or even no witnesses. The amount of loss is higher. Therefore, it is necessary to select the relevant information of the driver and the target claim amount as the fraud identification index. The risk is first and the insurance is later. The risk date of such fraud is very close to the expiration date of the insurance. Its implementation means mainly forges the insurance date and forges the insurance date. Therefore, it is necessary to determine the expiration period of insurance for the vehicle when it is under risk. Provision of false claim materials. For example, forgery, alteration of invoices for vehicle repairs, forgery of public security traffic police departments of traffic accident responsibility identification and so on. Therefore, it is necessary to verify the actual situation of the vehicle (the type of vehicle), the risk record and the certificate of determining whether there is an accident or not. Forgery accident scene. The policyholder usually forges the severity of the accident. For example, undamaged parts of vehicles in danger are replaced with old parts to expand losses for fraud claims. So we need to check whether to report the accident on the spot. Cast above quota protect. The insured amount is higher than the actual value of the vehicle, and when the insurance accident occurs, the insured can obtain the compensation that is higher than the actual value of the vehicle. Therefore, it is necessary to determine the actual amount of insurance coverage for vehicles under risk. One accident, multiple false claims. The policyholder claims multiple claims against one or more insurers for an accident. The policyholder enters into an insurance contract with several insurers and intentionally conceals duplicate insurance coverage. Therefore, it is necessary to approve the number of historical claims of the insured [25].
Stratification of classified variables
From the description of the data variables of auto insurance claims in Table 1, we can see that there are non-numerical classification variables and Boolean variables. Thus, we need to stratify and quantify these data according to the number of each index variable. The hierarchical results are shown in Table 2.
In recent years, the global insurance industry has developed rapidly. Many insurance claims occur every year, so the number of insurance claims data is particularly large. Generally, in different claims, the information of each applicant is not the same. For automobile insurance, automobile type, insurance amount, insurance expiration time, insured information, historical claims and other factors will affect insurance fraud. This is why vehicle insurance claims data have high dimensionality. In addition, there is a certain correlation between the selected indicators (variables). For example, the type of the automobile and the amount of insurance, the insured amount of high-end automobiles is generally higher. In addition, the car repair shop type is different, maintenance costs are also very different. All these factors increase the difficulty of insurance fraud research. Although there are correlations between some indicators, they are extremely important for identifying insurance fraud, and therefore, all indicators should be retained.Principal component analysis (PCA) is a commonly used dimensionality reduction method. Principal Component Analysis (PCA) is a multivariate statistical method, which can reduce the dimensionality of the multi-dimensional feature matrix, thereby reducing the complexity of the data, and the reduced dimension data can retain the main information of the original data [24]. Therefore, this paper uses principal component analysis to reduce the dimension of data, while retaining the important information of the original data, reducing the difficulty of operation.
SPSS software has powerful ability of data processing and statistics mining, and can standardize data, calculate eigenvalues and extract principal components. Therefore, 500 groups of data collected in this paper are normalized and then input into SPSS 22.0 for principal component analysis (PAC). The results of the analysis are shown in Table 3.
Stratification of classified variables
Stratification of classified variables
When the principal components are extracted to the tenth, their cumulative contribution to the information reaches 80 percent, covering more than 80 percent of the original data. So, select the new sample of the first 10 principal components to analyze the influencing factors of automobile insurance fraud identification. The purpose of reducing the dimension of raw data is achieved.
K-fold cross validation is usually used to evaluate the performance of different models. In K-fold cross-validation, the training data are randomly divided into K, where k-1 is used for model training, and the remaining one is used for testing. After repeating the process K times, the K models and their performance evaluation are obtained. This method is less sensitive to data.
In K-fold cross validation, the value of K is generally 10. If the training set is relatively small, the value of K can be increased, so there will be more data for training, and the result of performance evaluation will get smaller deviation. But the increase of K value will result in the extension of the cross-validation algorithm and the similarity of the training block height, which can not play the effect of cross-validation. If the data set is large, you can choose a smaller K value to reduce the cost of repeated calculations in different data blocks, but there is still a lot of training data. In this paper, the training data set is divided into 10 blocks. In 10 iterations, 9 blocks are used for training in each iteration, and the remaining one is used for model evaluation.
In this paper, 500 claim data are used to carry out 10-fold cross experiments. The recognition results were compared with ELM recognition model (ELM), traditional artificial fish swarm optimization ELM recognition model (AFSA-ELM), improved fish swarm algorithm optimization ELM identification model (Ifish-ELM) and genetic algorithm optimized ELM recognition model (GA-ELM).
Artificial fish population parameters: visual field is 0.3, step size is 0.25, crowding degree is 0.618, maximum iteration number is 50 times, the number of fish is 50, the maximum number of attempts is 3; The improved artificial fish population parameter: the initial step is 0, is 0.85 and the genetic algorithm parameters are as follows: maximum iteration number is 100, population number is 40, crossover probability is 0.7, mutation probability is 0.1.
Ten fold crossover experiment of four data models
Ten fold crossover experiment of four data models
The experimental results of four models with 500 data sets are given in Table 3. Comparing the training time of the four models we can see that the ELM model takes the least time. Because the initial weight of the ELM model is random, so the ELM model does not need to calculate the initial weight so the ELM takes the shortest time. Because the initial weight of the ELM model is random, the training time is shortened, but the recognition accuracy is not good. Compared with the traditional artificial fish swarm, the improved artificial fish swarm optimization ELM model has little difference in training speed. However, the improved artificial fish swarm algorithm adaptively adjusts the parameters such as visual field, step size, crowding degree and so on so it has higher accuracy in ELM model optimization classification.
In order to further illustrate the recognition performance of the four models, 250 cases were randomly selected as predictive data and the remaining 250 cases as training data. Of the 250 data tested, 91 were fraud claims and 159 were honest claims.
Results of recognition and classification of four models.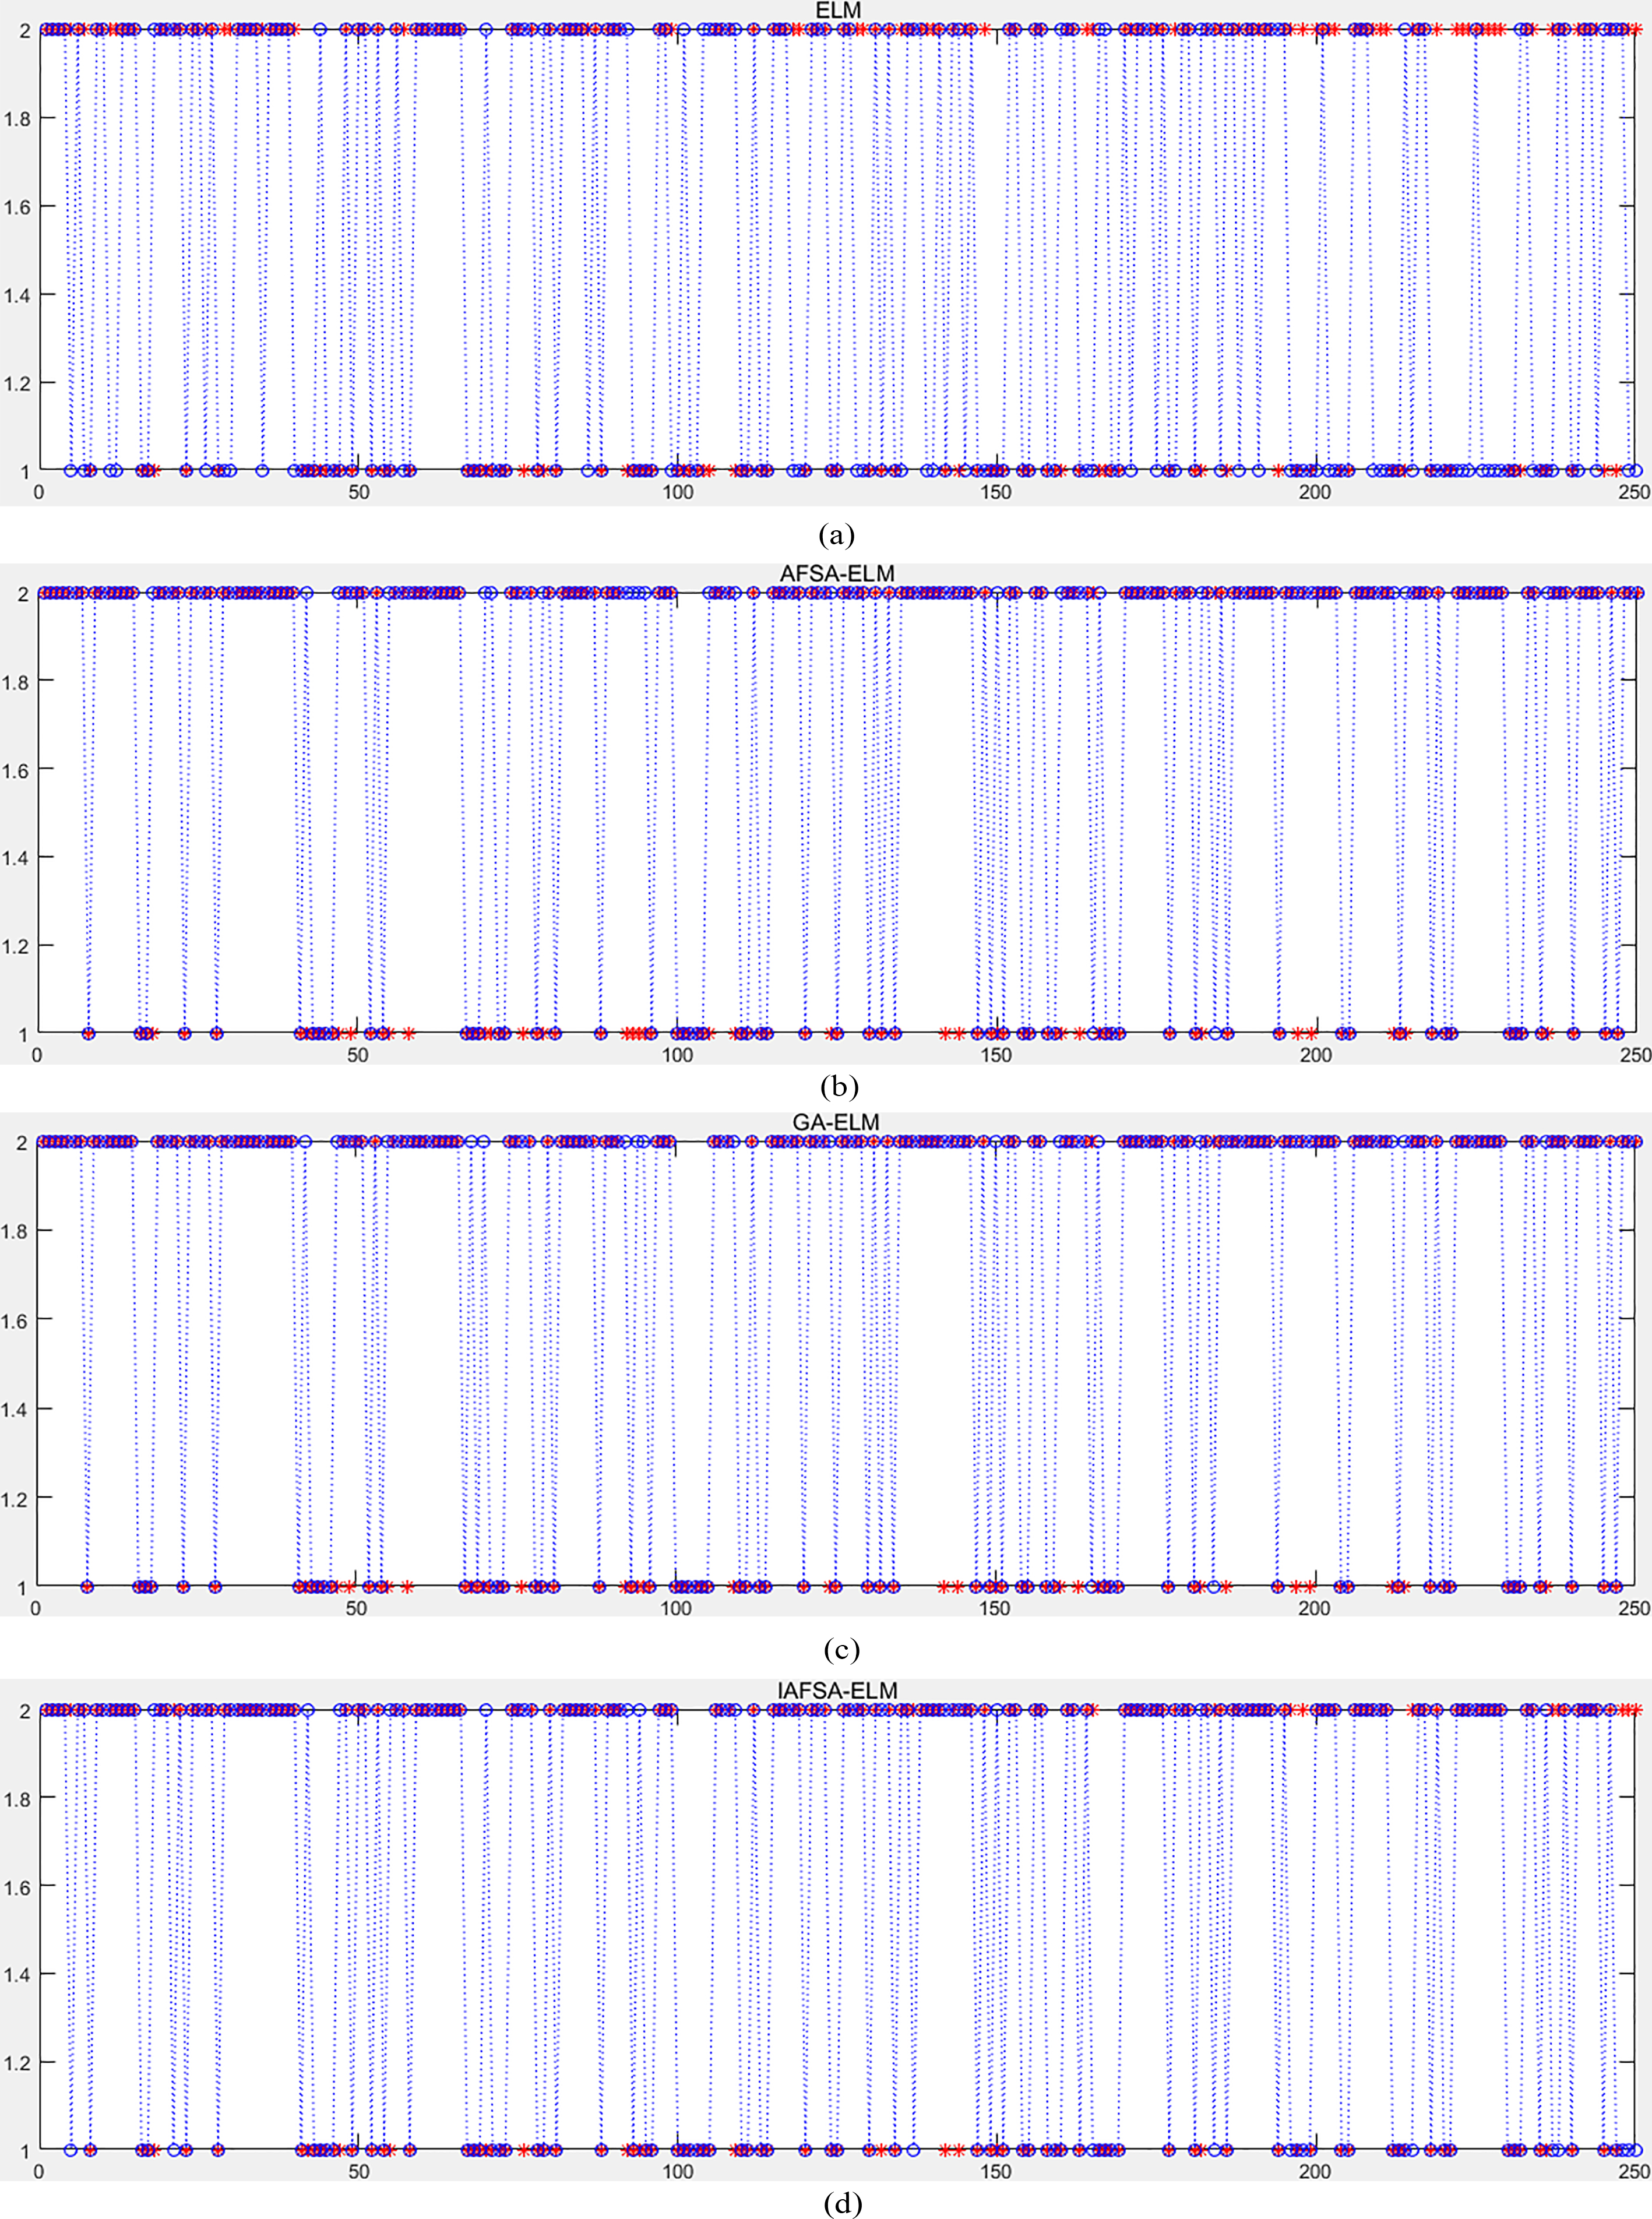
The result of recognition and classification of prediction samples form four recognition models is shown in Fig. 4a–d. Number 2 in Fig. 4 represents fraud claims, and number 1 represents honest claims. The symbol * represents the actual fraud case, the symbol O represents the predicted value given by various models, and when the symbol O equals 1, the representative model predicts that the case is an honest claim. When the symbol O equals 2, the representative model predicts that the case is a fraudulent claim. From the prediction and recognition results, we can see that the improved artificial fish swarm algorithm can be used to optimize the ELM model and the prediction results are closer to the real value. So we can see that the improved artificial fish swarm algorithm has more advantages in fraud identification.
Fraud identification forecast table
Prediction results of four models
According to Table 5, the sensitivity and specificity of the model are defined. The sensitivity of the model is as follows: A/(A
ROC curves of each model.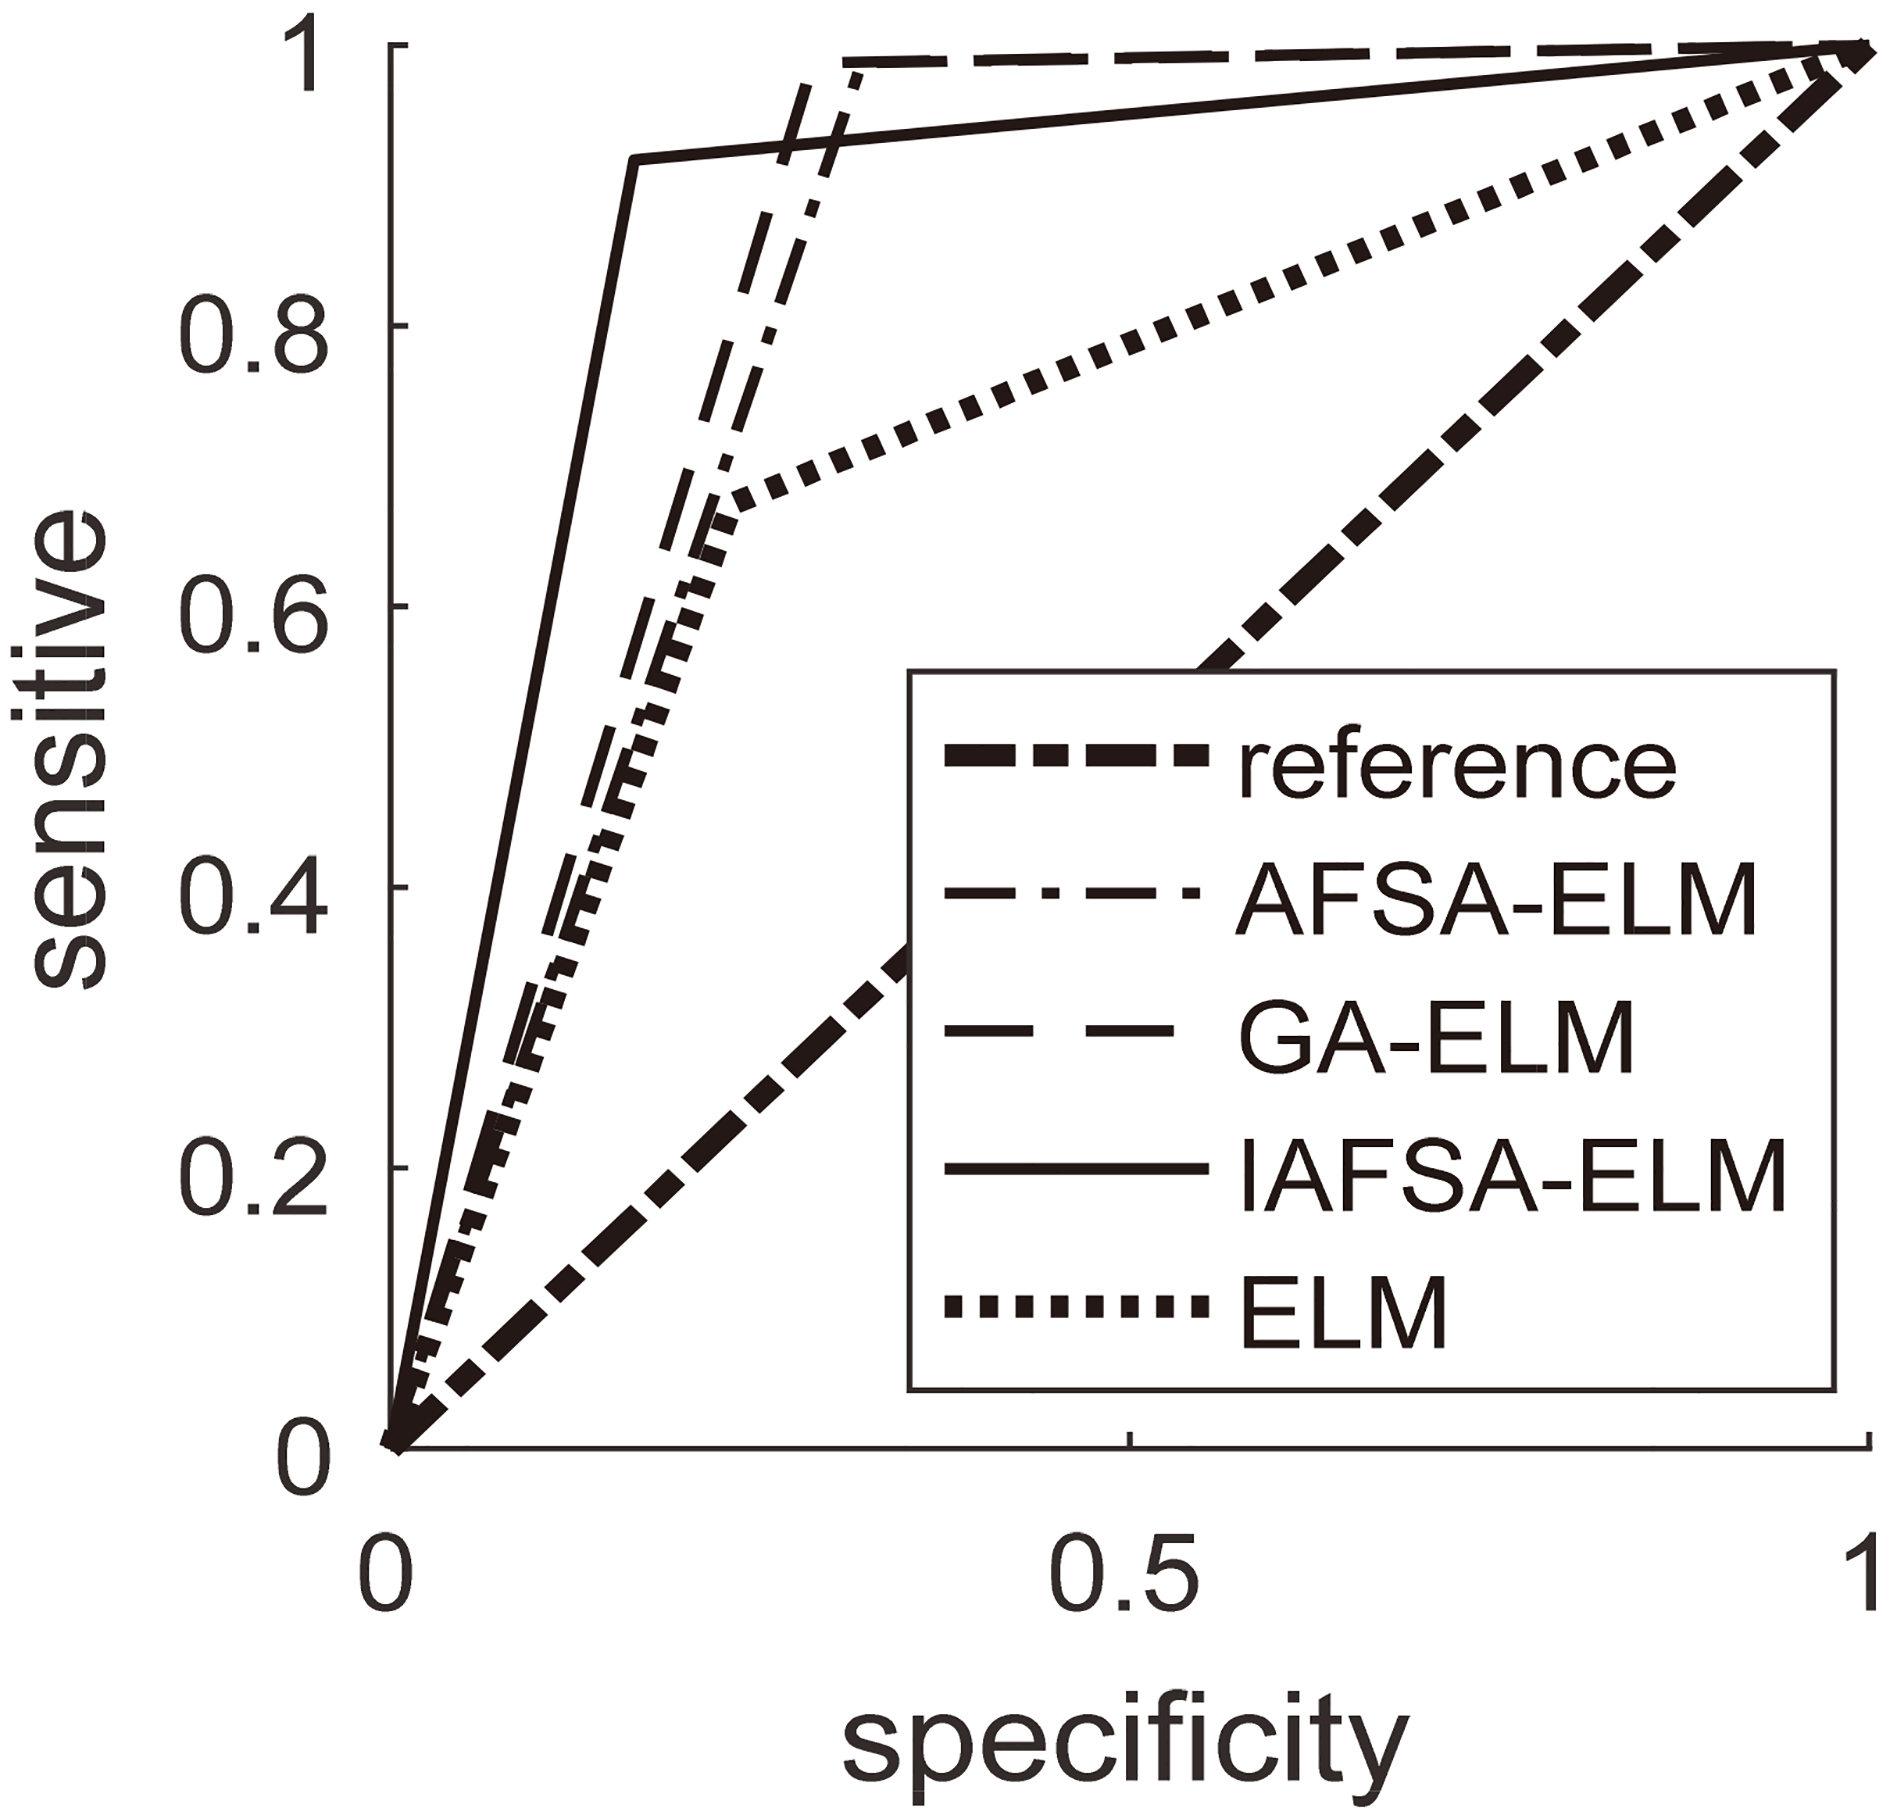
Results of recognition and classification of two models.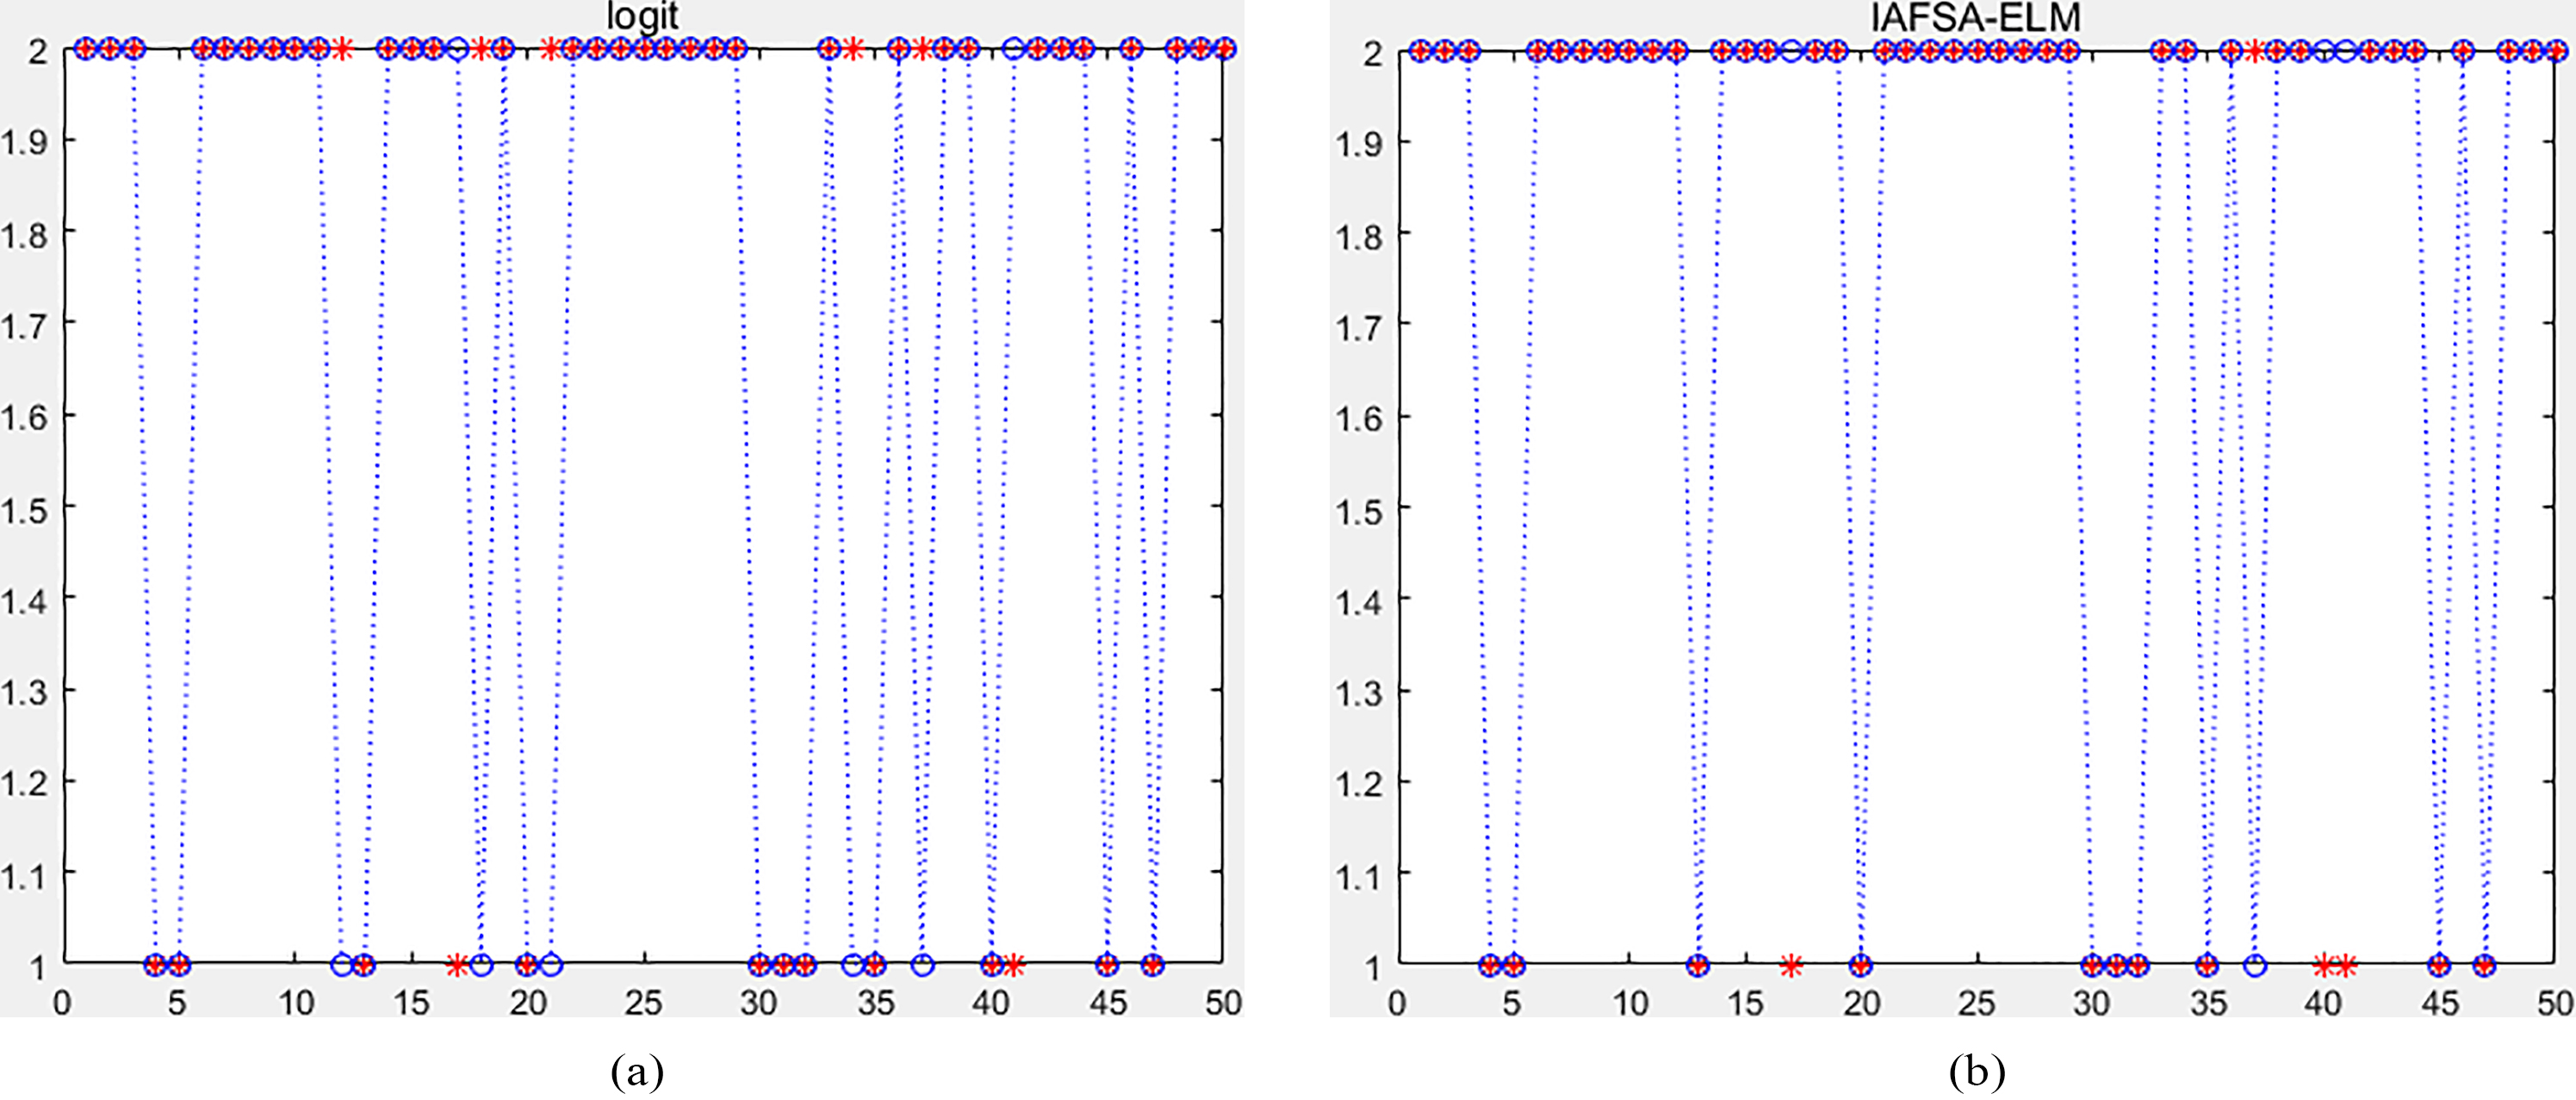
In order to further illustrate the recognition performance of each model, the sensitivity and specificity of each model and the ROC curve of each model recognition result are further considered in this paper. Generally speaking, in fraud detection forecasts, honest transactions account for the majority of customers, while fraudulent transactions account for only a small proportion. This is called data class imbalance. If class imbalance is serious, Then the classifier can not meet the classification requirements because of the imbalance of the data, which leads to the over-fitting of multi-class samples and the under-fitting of a small number of samples. In this paper, the sensitivity and specificity are combined with the graphical method by ROC curve, and then the area (AUC) under the ROC curve of each model is compared. If the area of that model is the largest, the recognition of the model is the best.
The ROC curve depicts the relationship between sensitivity and specificity in diagnosis, and because it can analyze the evaluation system more comprehensively and objectively, it is used in experimental medicine, clinical epidemiology, biostatistics, radiology. Data mining and pattern recognition have been widely studied and applied [26].
ROC curve judgment standard: AUC
In order to further illustrate the effectiveness of the improved model, the prediction results of the improved model are compared with those of the binary logit regression model. In order to better judge the effectiveness of the two models, we examined the latter 50 cases as test data. The results are shown in Fig. 6.
ROC curves of each model.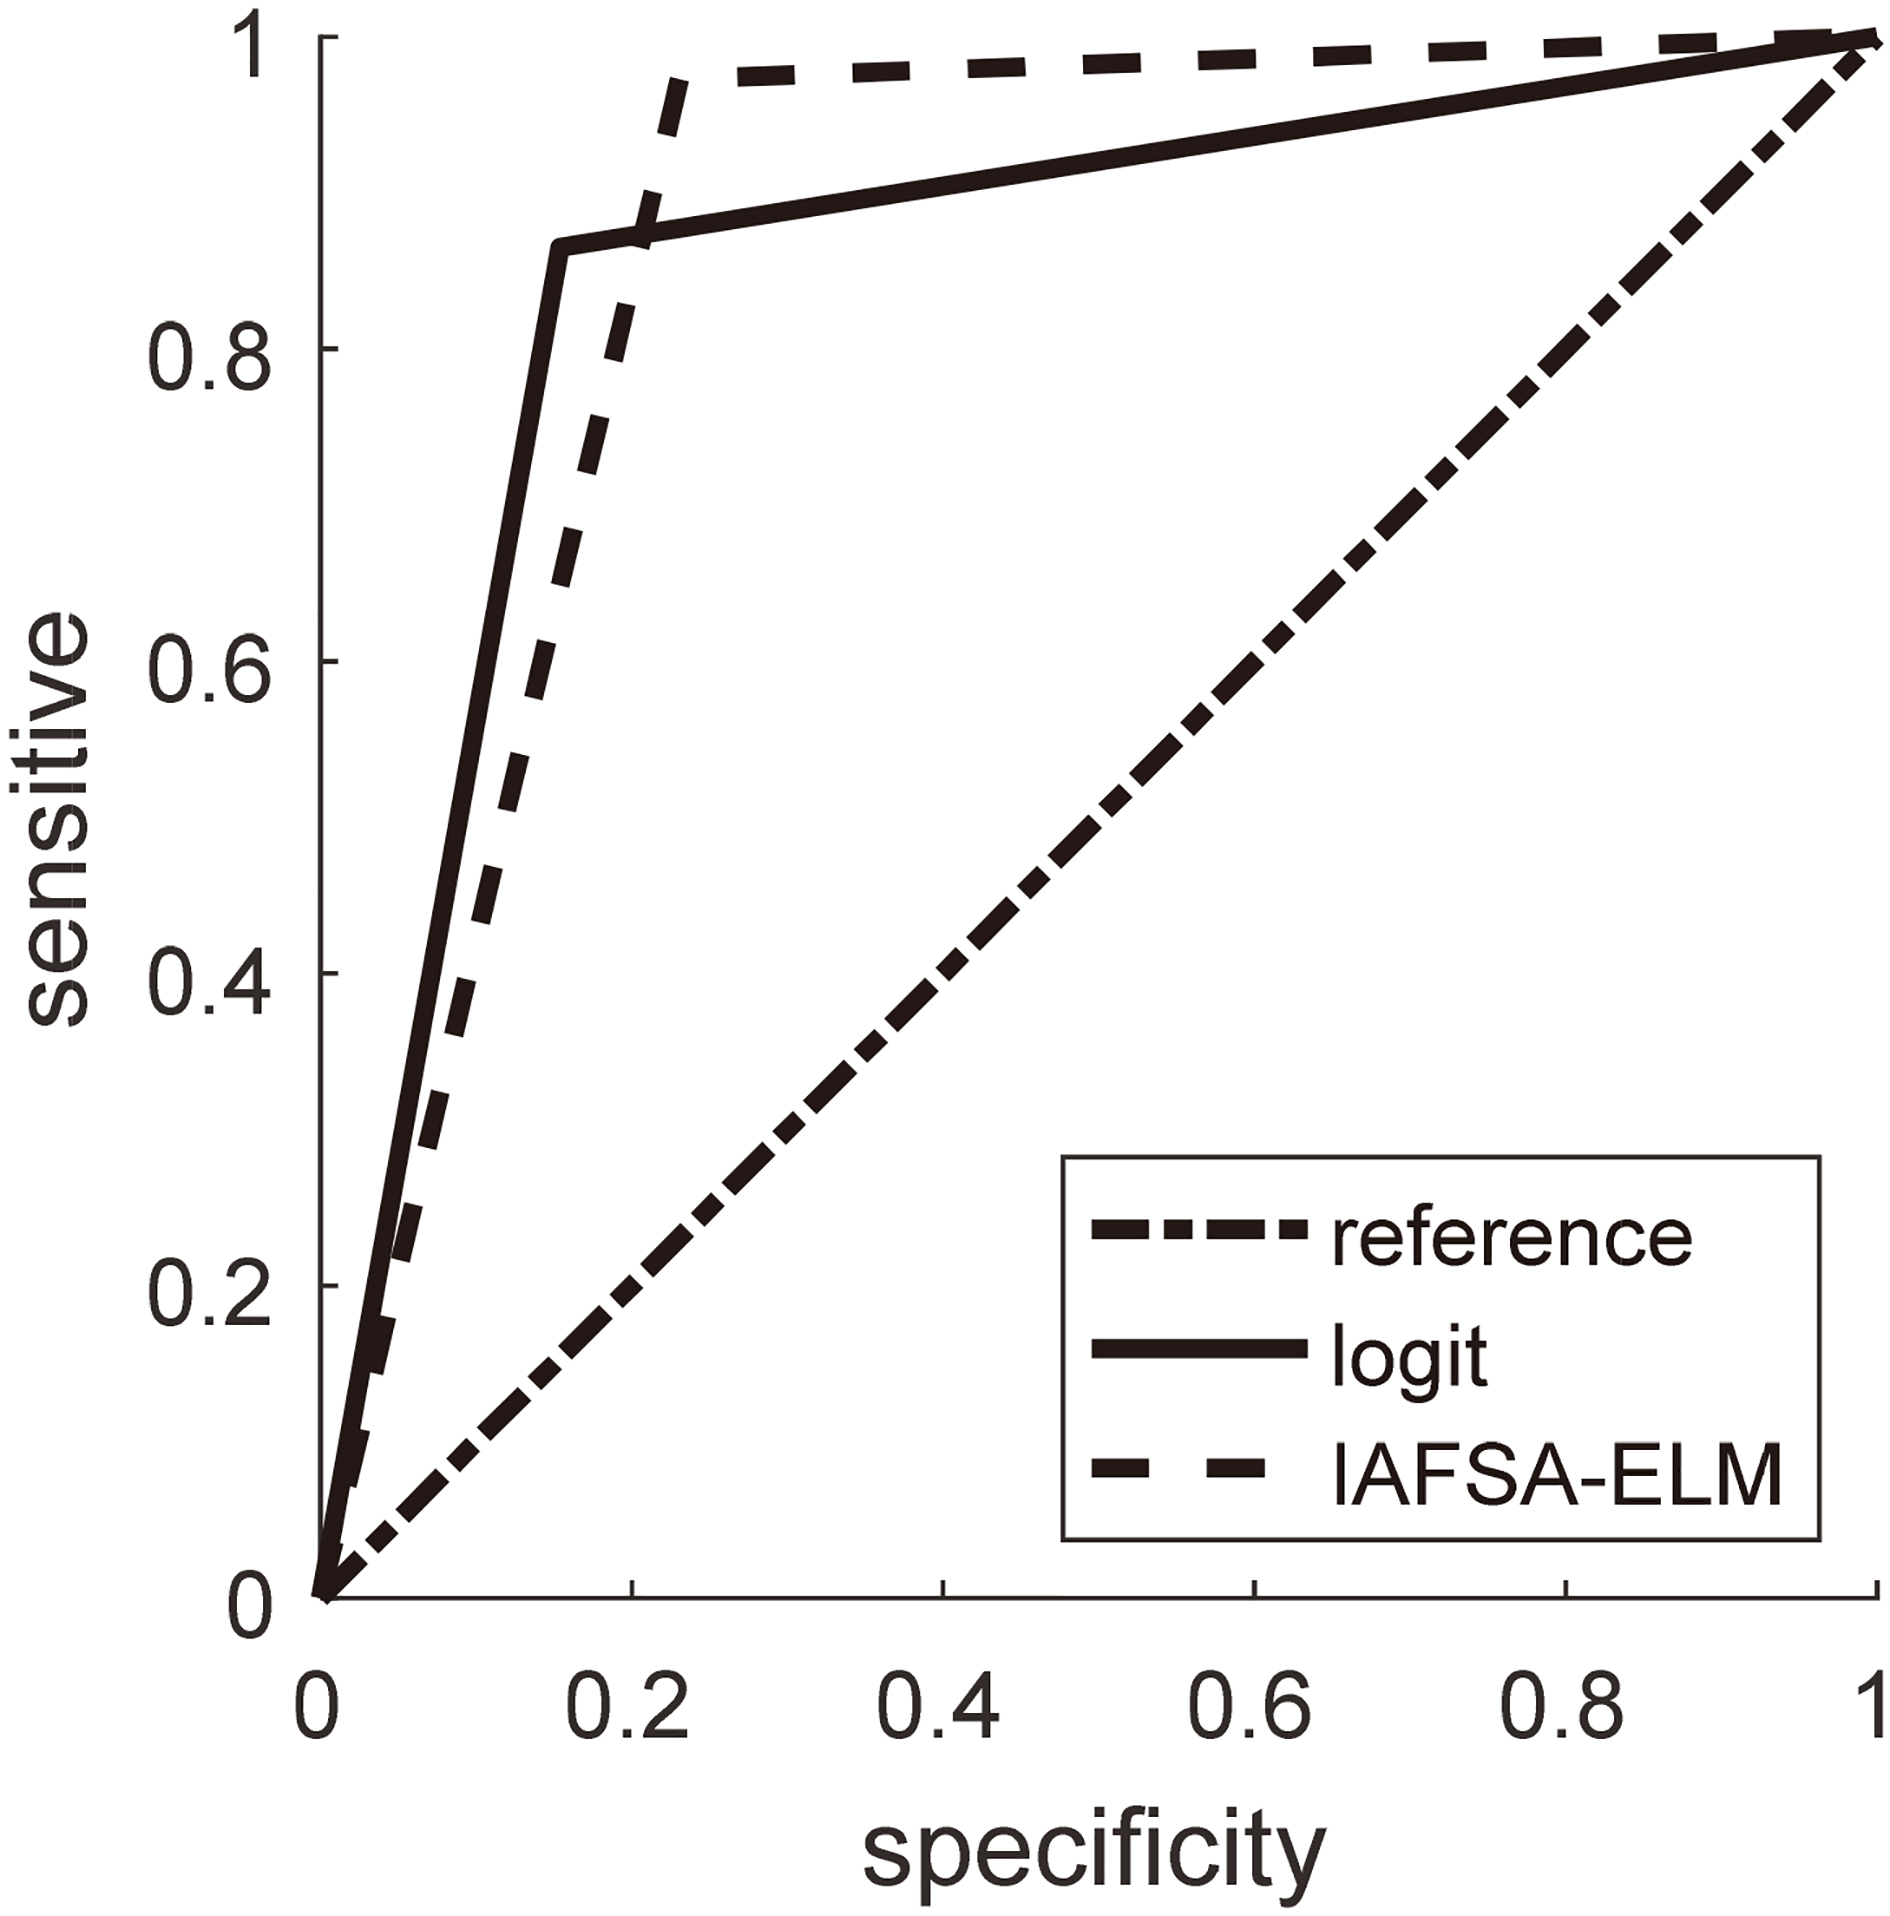
We can calculate that the data accuracy rate of binary logit model is 86% and the improved recognition model is 92% in the Fig. 6. Therefore, we can see that the improved recognition model is better than the binary logit regression model in the overall recognition accuracy. In order to verify the specificity of the two models, the predicted results of the two models were analyzed by ROC curve (Fig. 7). The AUC of the regression model was 0.856 and the AUC of the improved extreme learning machine was 0.871. So the improved algorithm is better than the binary logit regression model in recognition specificity and accuracy.
In China’s insurance market, automobile insurance is the first major insurance in property insurance [28]. With the increasing ownership of cars in the society, the amount of insurance claims for all kinds of vehicle accidents is also increasing, and the cases of insurance fraud claims in the course of vehicle maintenance and insurance settlement are also on the rise And become one of the biggest threats to the current development of the insurance industry. Therefore, we urgently need to propose an effective method to identify vehicle insurance fraud to excavate potential fraudulent customers and judge whether they are fraudulent or not according to the customer’s claim data, so as to take appropriate measures to prevent fraud in advance.
In this paper, the principal component analysis of fraud claim data is carried out, and the extracted indexes are used as input variables of model fraud prediction. Aiming at the deficiency of ELM model in solving the problem of recognition and classification, a recognition model based on improved artificial fish swarm optimization (ELM) is proposed in this paper. Considering the recognition and classification ability of the ELM and the search and optimization characteristics of artificial fish swarm algorithm, the artificial fish swarm algorithm is combined with ELM to optimize the initial weight of ELM with the improved artificial fish swarm algorithm, so as to overcome the disadvantages of slow convergence speed of neural network and easy to fall into local minimum. The improved artificial fish swarm algorithm takes into account that the traditional artificial fish swarm uses a fixed step size. With the increase of iteration time, the fish herd is closer to the global optimal value. If the step size is invariant, the fish herd will be unstable around the optimal value. So this paper proposes a step size that varies with the number of iterations. Due to the different behavior of artificial fish swarm requires different visual field, this paper proposes two parallel visual fields, which overcomes the shortcomings of traditional artificial fish swarm algorithm that the convergence speed is slow and it is not easy to converge to the global optimal solution. In the final empirical analysis, the improved artificial fish swarm algorithm is compared with the traditional artificial fish swarm algorithm and the traditional genetic algorithm in a given data set to verify the superiority and effectiveness of the improved artificial fish swarm optimization ELM model.
Footnotes
Acknowledgments
This work was financially supported by the Project of National Natural Science Foundation of China (No. 61502280, 61472228), the Project of Qingdao Applied Basic Research of Qingdao (special youth project, No. 14-2-4-55-jch).