
Abstract
Social link is an important index to understand master students’ mental health and social ability in educational management. Extracting hidden social strength from students’ rich daily life behaviors has also become an attractive research hotspot. Devices with positioning functions record many students’ spatiotemporal behavior data, which can infer students’ social links. However, under the guidance of school regulations, students’ daily activities have a certain regularity and periodicity. Traditional methods usually compare the co-occurrence frequency of two users to infer social association but do not consider the location-intensive and time-sensitive in campus scenes. Aiming at the campus environment, a Spatiotemporal Entropy-Based Analyzing (S-EBA) model for inferring students’ social strength is proposed. The model is based on students’ multi-source heterogeneous behavioral data to calculate the frequency of co-occurrence under the influence of time intervals. Then, the three features of diversity, spatiotemporal hotspot and behavior similarity are introduced to calculate social strength. Experiments show that our method is superior to the traditional methods under many evaluating criteria. The inferred social strength is used as the weight of the edge to construct a social network further to analyze its important impact on students’ education management.
Introduction
Social link analysis is widely used in resource recommendation, extracurricular activities, education management and other fields. Relevant studies have shown that students’ social behavior is also highly correlated with their mental health [11] and academic performance [5, 19]. For college students, mental disorders caused by the social link are becoming more and more common [21, 20]. School administrators need to judge the mental health and academic performance of college students by inferring their social skills and interpersonal relationships to educate better and manage college students [4, 9]. With the wide use of mobile devices and social application software with positioning functions, users are also more willing to share their daily lives. Fortunately, almost all students are equipped with a student campus card. Students can use this card for payments, access controls for gates, book borrowing via the library, showering, and other activities. Other activity records such as the login gateway and online payments are also recorded in the school’s server logs in addition to the student campus card. These multi-source heterogeneous data contain much spatiotemporal information, which provides data support for inferring students’ social link.
In real life, when two people frequently participate in many activities simultaneously, they are likely to have a close relationship. Sociologists often call this phenomenon homogeneity. Many researchers predict the social link according to this nature [13, 29, 30, 26]. Specifically, when two users appear in the exact location simultaneously, they are considered to co-occur. The higher the frequency of co-occurrence, the greater the social strength of two people [16, 24, 22, 10, 15, 1, 12, 17, 6, 18]. Therefore, some scholars use spatiotemporal data to extract co-occurrence frequency to infer social links. However, this may not be enough to fully solve the problem studied: when calculating the co-occurrence frequency, the random encounter problem caused by different crowding degrees of locations is ignored. For example, the social relationship reflected by two people meeting ten times in a cafeteria and once in a private place cannot be judged only by frequency. Because the cafeteria is more crowded, the random factor of two people meeting is more significant. To address these issues, Pham et al. [18] proposed an entropy-based model (EBM) to effectively solve the impact of location congestion and richness on co-occurrence frequency. EBM uses Renyi entropy to measure the diversity of co-occurrence locations and fully considers the impact of encounter frequency of different locations on diversity. Meanwhile, the popularity of each location is measured by location entropy, and different weights are assigned to the co-occurrence frequency of different locations.
EBM model provides a good solution for inferring social association from spatiotemporal data. However, EBM is designed and modeled for people’s activities in social scenes and can not be well applied to campus scenes. Due to the particularity of the campus scene, some crucial changes and effects different from the social scene must be considered. Firstly, the student activity sites are mainly distributed in each school building, which is relatively fixed and single. For example, a teaching building can usually accommodate many students, which dramatically increases the chance of student co-occurrence. Therefore, overreliance on location information with high crowding will significantly interfere with the inference of social strength. Secondly, students need to arrange classes according to the school calendar. For schools, students’ overall class time is regular. Still, for students, their activity time is not limited to class, but also rich after-class activities, such as eating in the canteen, reading in the library and exercising in the gym. The time of these activities can be arranged according to the students themselves. Therefore, the social link between students will be more sensitive to the time of these activities. For example, two students who appear in the canteen at 12 p.m and 3 p.m. have different social strengths. Because most students have lunch at noon, but few students go to the canteen at 3 p.m.
Further, analyzing the characteristics of the time dimension in campus scene, in previous studies, some scholars inferred social relations from refining the impact of time weight. Liu et al. [14] used a time slicing method to divide the card swiping data of college students into different time intervals. If students appear in the same location during a certain period of time within the division, they are considered to be co-occurring in time and space. However, this time slicing method may cut two adjacent co-occurrences into different time intervals, resulting in spatiotemporal co-occurrence cutting. Therefore, researchers [27, 31] proposed a more flexible sliding time window to measure the time when two students appear at the same time. Record the check-in time of two students, if the check-in time gap of two students is less than a certain value, it is considered that the two students are co-occurring. However, the methods above still did not consider the possibility of coincidence caused by the peak time. For example, the canteen at noon and the study room in the evening are the peak time for student activities. There will be a greater possibility for coincidence to happen in co-occurrence during this period.
Thus, for the special campus environment, a Spatiotemporal Entropy-Based Analyzing (S-EBA) model for campus behavior data to infer students’ social strength is proposed. Diversity, weights of frequencies, and behavioral similarity are introduced to measure social links. The main contributions of this paper are as follows:
A refined model, S-EBA, for inferring social links in campus scenes is proposed. The model uses students’ multi-source heterogeneous behavior data for modeling and calculates students’ social strength; Aiming at the location-density and time-sensitivity of campus, location-time entropy is introduced to measure social link, and the influence of contingency and congestion is captured by multiple feature weights; Real student activity data are collected to verify the performance of the model from several indexes. The inferred social strength is the weights of edges to construct social networks, and actual cases verify the inferred student social intercourse for teaching management evaluation.
The structure of this article is as follows: Section 2 reviews the related work of inferring social networks based on spatiotemporal data. Section 3 gives an overview of the model. Section 4 introduces the data processing and analysis. Section 5 puts forward an expression method of spatiotemporal co-occurrence. Section 6 introduces a calculation algorithm of the social strength. Section 7 performs experimental verification and analysis. Section 8 summarizes and suggests future work.
This section will introduce the related work of analyzing social link using spatiotemporal data and inferring students’ social interaction for campus scenes.
Analyzing social link
In the past, the method of inferring the social relationship between two users was mainly based on historical location information. That is, if the historical activity trajectories of two users are similar, it is considered that the two users are more likely to know each other [13, 29, 30, 26]. Li et al. [13] established the users’ visit sequence and determined the user similarity by comparing the sequence similarity. Based on the spatiotemporal data that recorded location information, Yang et al. [29] proposed the LP-Mine form to formally describe individuals’ general lifestyle and laws that can be found from the location history. Zhang et al. [30] measured the similarity between users based on their location history, and recommended a set of potential friends in the GIS community to each user. Furthermore, Xiao et al. [26] used the MTM algorithm to estimate the potential similarity between different users based on the users’ physical location history. This method contains semantic information that carries the users’ interest.
According to the “imilarity breeds connection” principle, if two users are friends, they usually appear in the same location. Therefore, inferring social strength around users’ spatiotemporal co-occurrence data has received more and more attention [16, 24, 22, 10, 15, 1, 12]. Pham et al. [16] used a quad-tree data structure to describe the spatiotemporal co-occurrence by establishing the users’ visit vector and co-occurrence vector. Sun et al. [22] inferred the semantics of social relationships using digital social footprints in binary perspective on social ties. Jung et al. [10] proposed a model to infer social connections of smart objects and predict the connection strength using the co-usage data of the objects. Some scholars have identified data that they believe can infer social relations. Njoo et al. [15] extracted four key features by analyzing the spatial-temporal behavior data of users, namely diversity, universality, persistence and stability, and then extracted a social relevance reasoning framework based on these four features to distinguish real friends from familiar strangers. Li et al. [12] inferred social relationships from individual vehicle mobility data, but this is still a subject of inferring social networks based on spatiotemporal data. In inferring social relationships, Pham et al. [17] is interested in inferring social connections by analyzing users’ location information; this is useful in a variety of application domains, from sales and marketing to intelligence analysis. In particular, he proposed an entropy-based model (EBM) that infers social connections and estimates the strength of social connections by analyzing users’ co-occurrences in space and time. We know that user activities can be expressed in two dimensions: time and space. Pham et al. described spatiotemporal co-occurrence through a quad-tree structure. The space is divided into cells in the quadrants, and the cells in each quadrant are divided until all the space are divided. Each cell represents a location, and larger cells indicate that the location is very active. Each location includes different users co-occurring at different times.
In previous studies, indicators such as activity trajectory, co-occurrence frequency, and behavioral similarity have all been used to measure the social relationship between two people, providing a good research foundation for our work. However, these methods do not consider the particular factors of the campus scene and are not suitable for inferring students’ social strength.
Inferring student social strength
Obviously, this method of inferring social connections can be applied in education. Many scholars use various data generated by student activities to recommend social connections between students. Yao et al. [28] used each student’s consecutive check-in records to infer the student’s social network. On this basis, new methods of inferring social connections are constantly being proposed. Liu et al. [14] obtained the social association among students by analyzing the data stream of 17,795 students’ card consumption, and summarized the characteristics of students’ social interaction based on the social association, such as the phenomenon of small world, in which lower grade students tend to form large communities, while higher grade students tend to build small communities. Xu et al. [27] proposed a hierarchical encounter model based on association rules in order to solve the errors caused by the homogeneity of students’ behaviors in majors and grades in social association analysis, which has a good effect. However, these methods do not fully consider the trajectory of students’ activities. Ebadi et al. [7] proposed an activity-mobility trajectory construction algorithm based on the prior knowledge of student behavior patterns and student campus card consumption data, which can effectively predict the movement trajectory of students’ activities, provides a basis for comparing the similarity of students’ movement trajectory.
Using a time slice is a very reliable method to infer students’ social strength. However, these methods have some limitations because only through time slices to measure students’ co-occurrence in the time dimension, which will lead to inaccurate results. The time interval between two students will affect the ability of co-occurrence to measure social interaction. The above method does not take these into account.
Method overview
Given the special location-density and time-sensitivity of campus, S-EBA is proposed to infer students’ social links. The method framework is shown in Fig. 1. Extract and analyze the spatiotemporal information in students’ multi-source heterogeneous behavior data, and get the student activity sequence. The visit matrix is constructed according to the two dimensions of time and space, and the co-occurrence matrix is weighted considering the impact of the time interval. Based on the co-occurrence matrix, three features are introduced to measure social intercourse to fully consider diversity, spatiotemporal hotspots, and behavioral similarity. Finally, the social situation of student groups and individuals is analyzed through social networks. Therefore, the whole method consists of four parts.
The S-EBA model framework.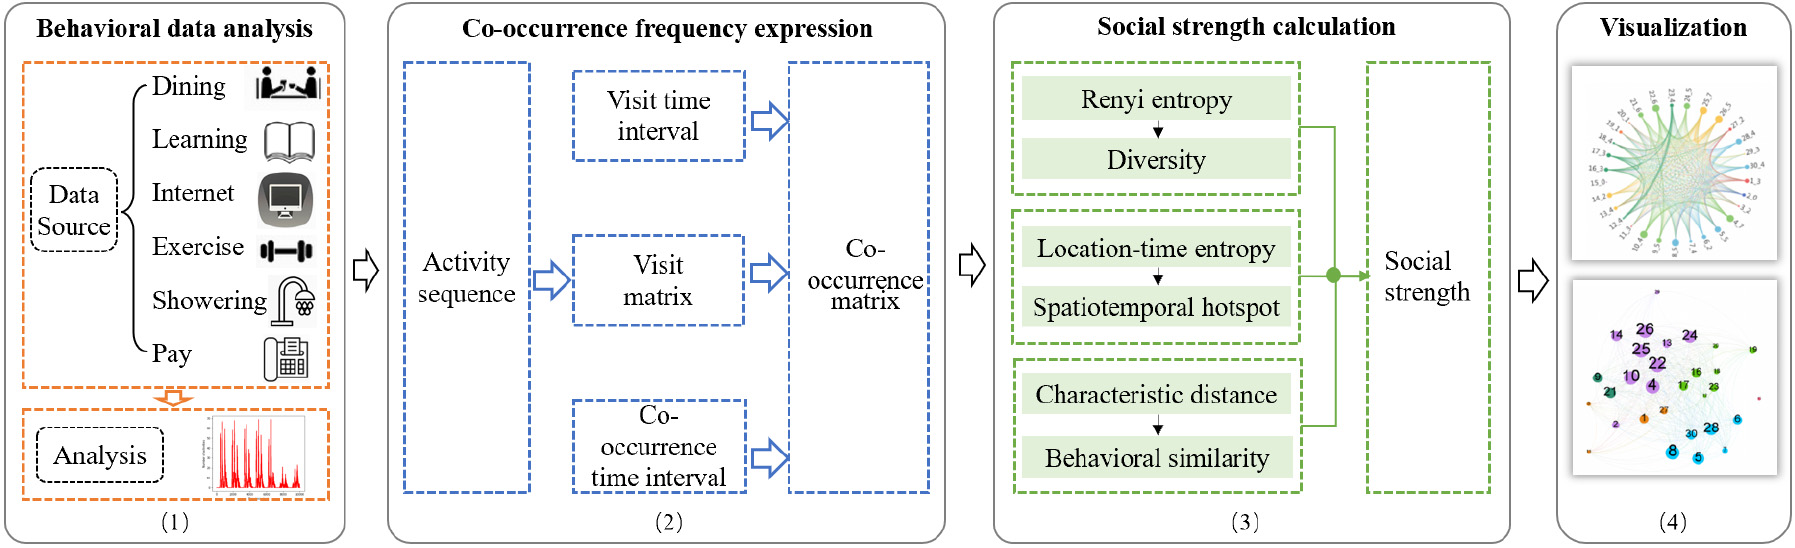
This section details the collection and analysis of student behavior data. In many universities, each student has a student campus card with a unique number. The card is the primary medium for students to eat, shop, shower, etc. The system will record the historical use information of the campus card. In addition to the campus card, the gateway also records students’ online browsing information, and the library reservation system records students’ information to the library. Based on this, student behavior can be divided into many types, including consumer behavior, online behavior, learning behavior, etc. Sort out and clean the multi-source heterogeneous data of students to obtain the space-time information of each data, as shown in Table 1.
Sign-in data sample
Sign-in data sample
In order to obtain the activity sequence, we clean up the data and extract the features of the log recording students’ behavior. Each record includes time, location, frequency, activity type and consumption amount.
1) Consumption
The student campus card is the primary payment medium for campus dining, shopping and other consumer behaviors. When students use the card for consumption, the system will record the time, location and amount of consumption. Referring to the work and rest time of the school and the functional division of each location, Consumer behavior can be divided into many types, including breakfast behavior, lunch behavior, dinner behavior, shopping behavior and shower behavior.
2) Entering the library
The library is the central place for students to study and read. When students enter the library, they usually need to carry out identity authentication through face recognition or student campus card and record the entry time and library name. At the same time, the information of students’ reservation of seats and borrowing and returning books in the library will also be recorded.
3) Gateway login
At present, most colleges and universities have set up their own campus LAN. When students access the Internet through the campus network, they must log in to the gateway system. The system is deployed between the Internet and campus LAN, which is responsible for the protocol conversion between the two sides, realizes network interconnection, and records the students’ login time, login IP, access time and network traffic; every time a student logs in the gateway, a record will be generated. Through these records, students’ online time, web browser type and other information can be obtained.
Privacy protection
When collecting data, it should be noted that students’ privacy must be protected. Therefore, based on obtaining the consent of students, personal information must be encrypted in the process of data collection and processing. Specifically, essential information masking and one-hot coding are used to replace all students’ personal information.
We encode basic information such as student ID. A mapping table between real student ID and student ID code is created. Each real identity is encoded into a unique, anonymous alphanumeric identifier. The corresponding coded ID replaces the actual student ID in each data source to ensure the anonymity of the whole experiment. In order to simplify the experimental process, a mapping table is created between the active location and the code, and the corresponding code is assigned to the location. The activity time is expressed in the format of “year month day, hour: minute: second”. For ease of calculation, we convert it to “DD: mm” format, where DD represents the day of the semester and mm represents the first few minutes of the day. The mapping method is shown in Fig. 2.
Time mapping table. The figure shows a way to map time to numbers. 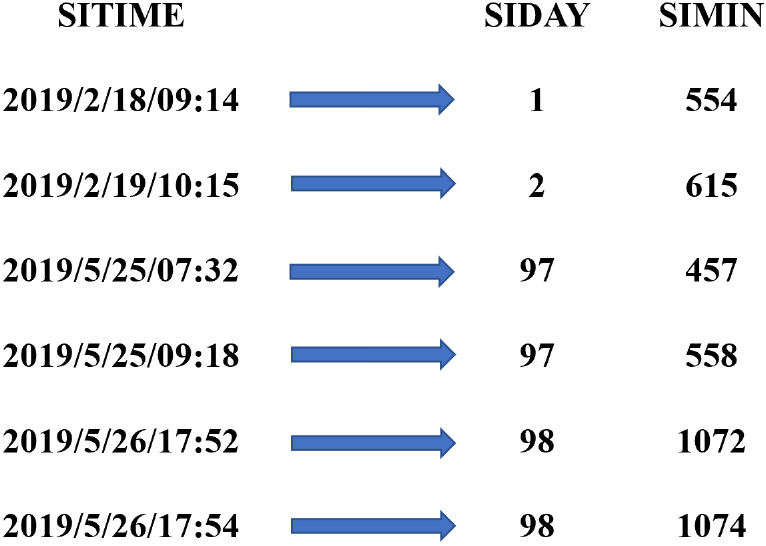
From the overall detailed analysis of the space-time information in students’ activities, this paper intuitively reveals the patterns of campus activities. Figure 3 is a calendar heat map, which counts the activity value of students every day in a semester. Figure 4 further refines four graphs to show the frequency of students’ activities in weeks and days. Analysis of a semester, students’ activities have a cycle T of 7 days. In the first five days of each cycle, the frequency of activities is more significant than that in the next two days. The reason is that the activity frequency of students on working days is higher than that on rest days (see Fig. 4a and b). On one day, the peak of students’ daily activities is concentrated in the dining periods of the morning, afternoon and evening (see Fig. 4c and d), indicating that students are more active in these three periods. This section intuitively proves that student activities have the characteristics of space-time hot spots.
Calendar chart of student activity frequency. The figure records the frequency of student activities in the 21 weeks of the semester in order. It can be seen that students have a higher activity frequency in the first five days of a week than in the latter two days, and the activity frequency in one semester conforms to the cycle T 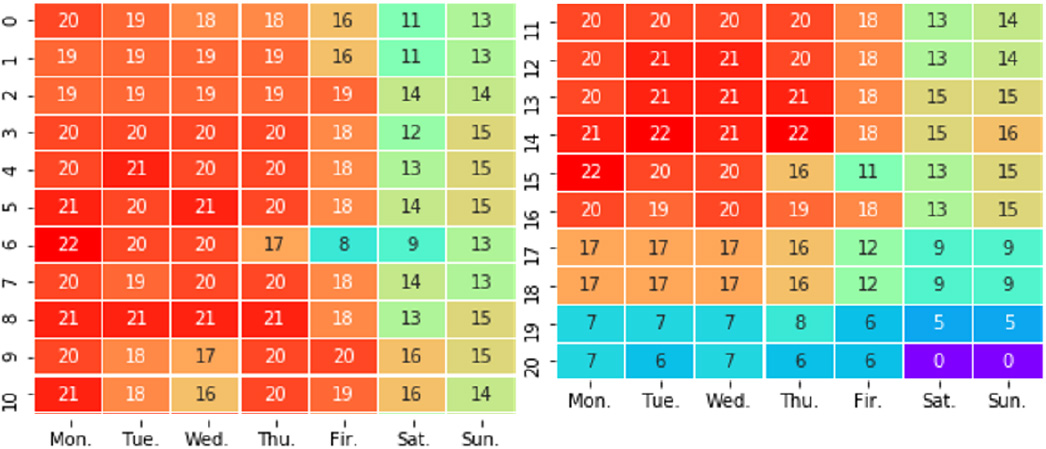
Student activity frequency. (a) and (b) show that the activity frequency of the first 5 days of the week is significantly higher than the last 2 days. The reason is that the last 2 days are weekends, and most students go home or leave school; (c) and (d) shows the distribution of activities on the first day and the second day. It can be seen that the peak period of activities is mainly distributed during the dining period.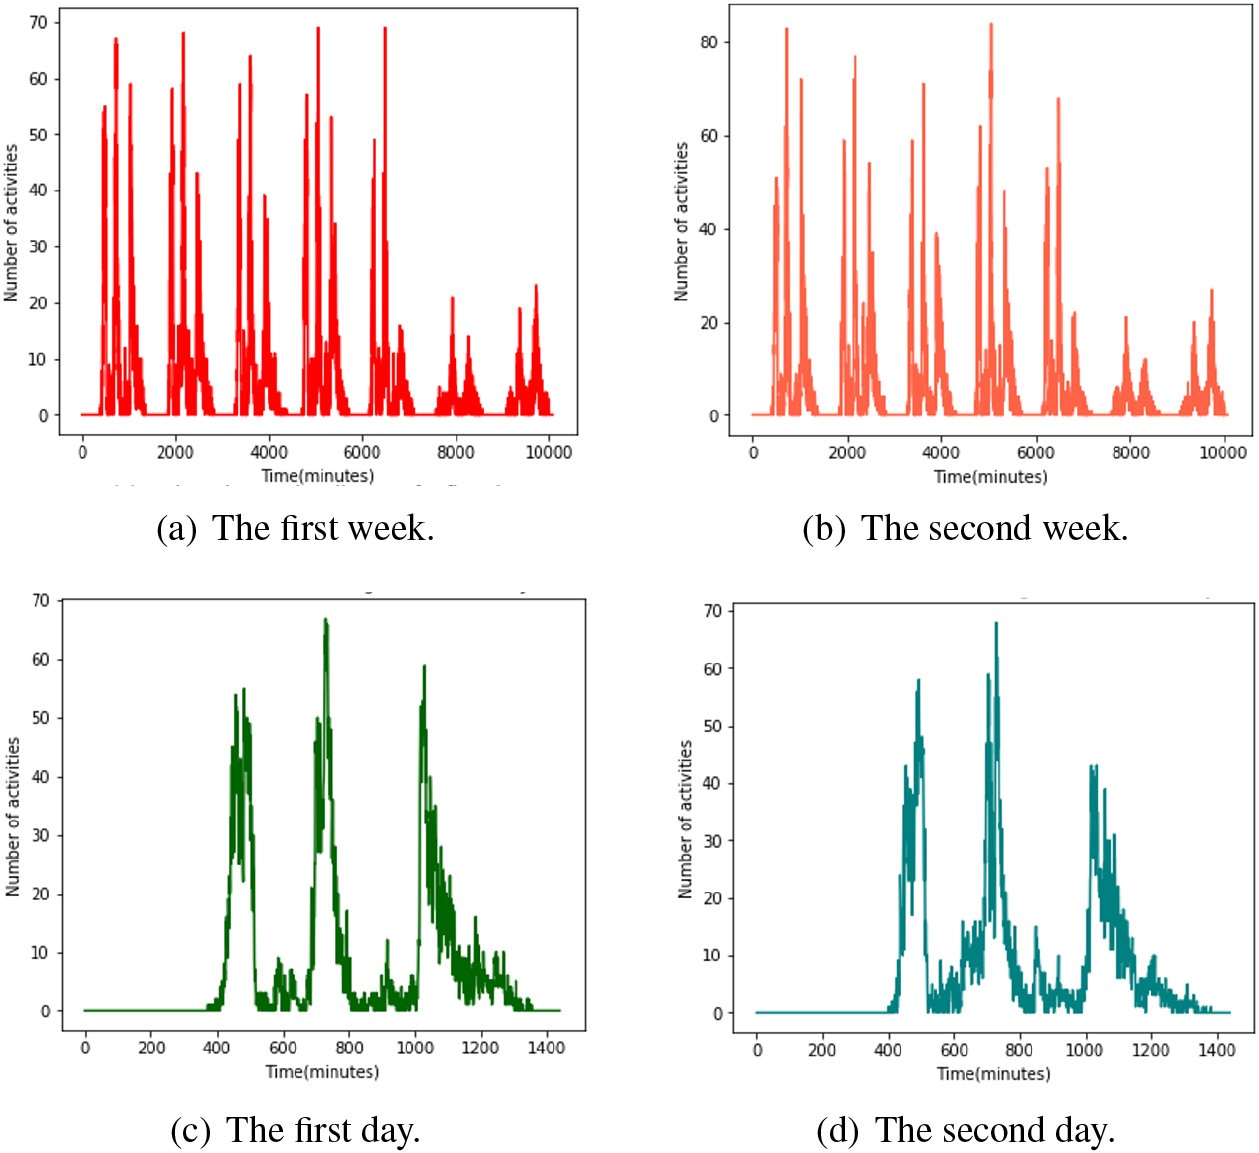
Model details of co-occurrence frequency and social strength.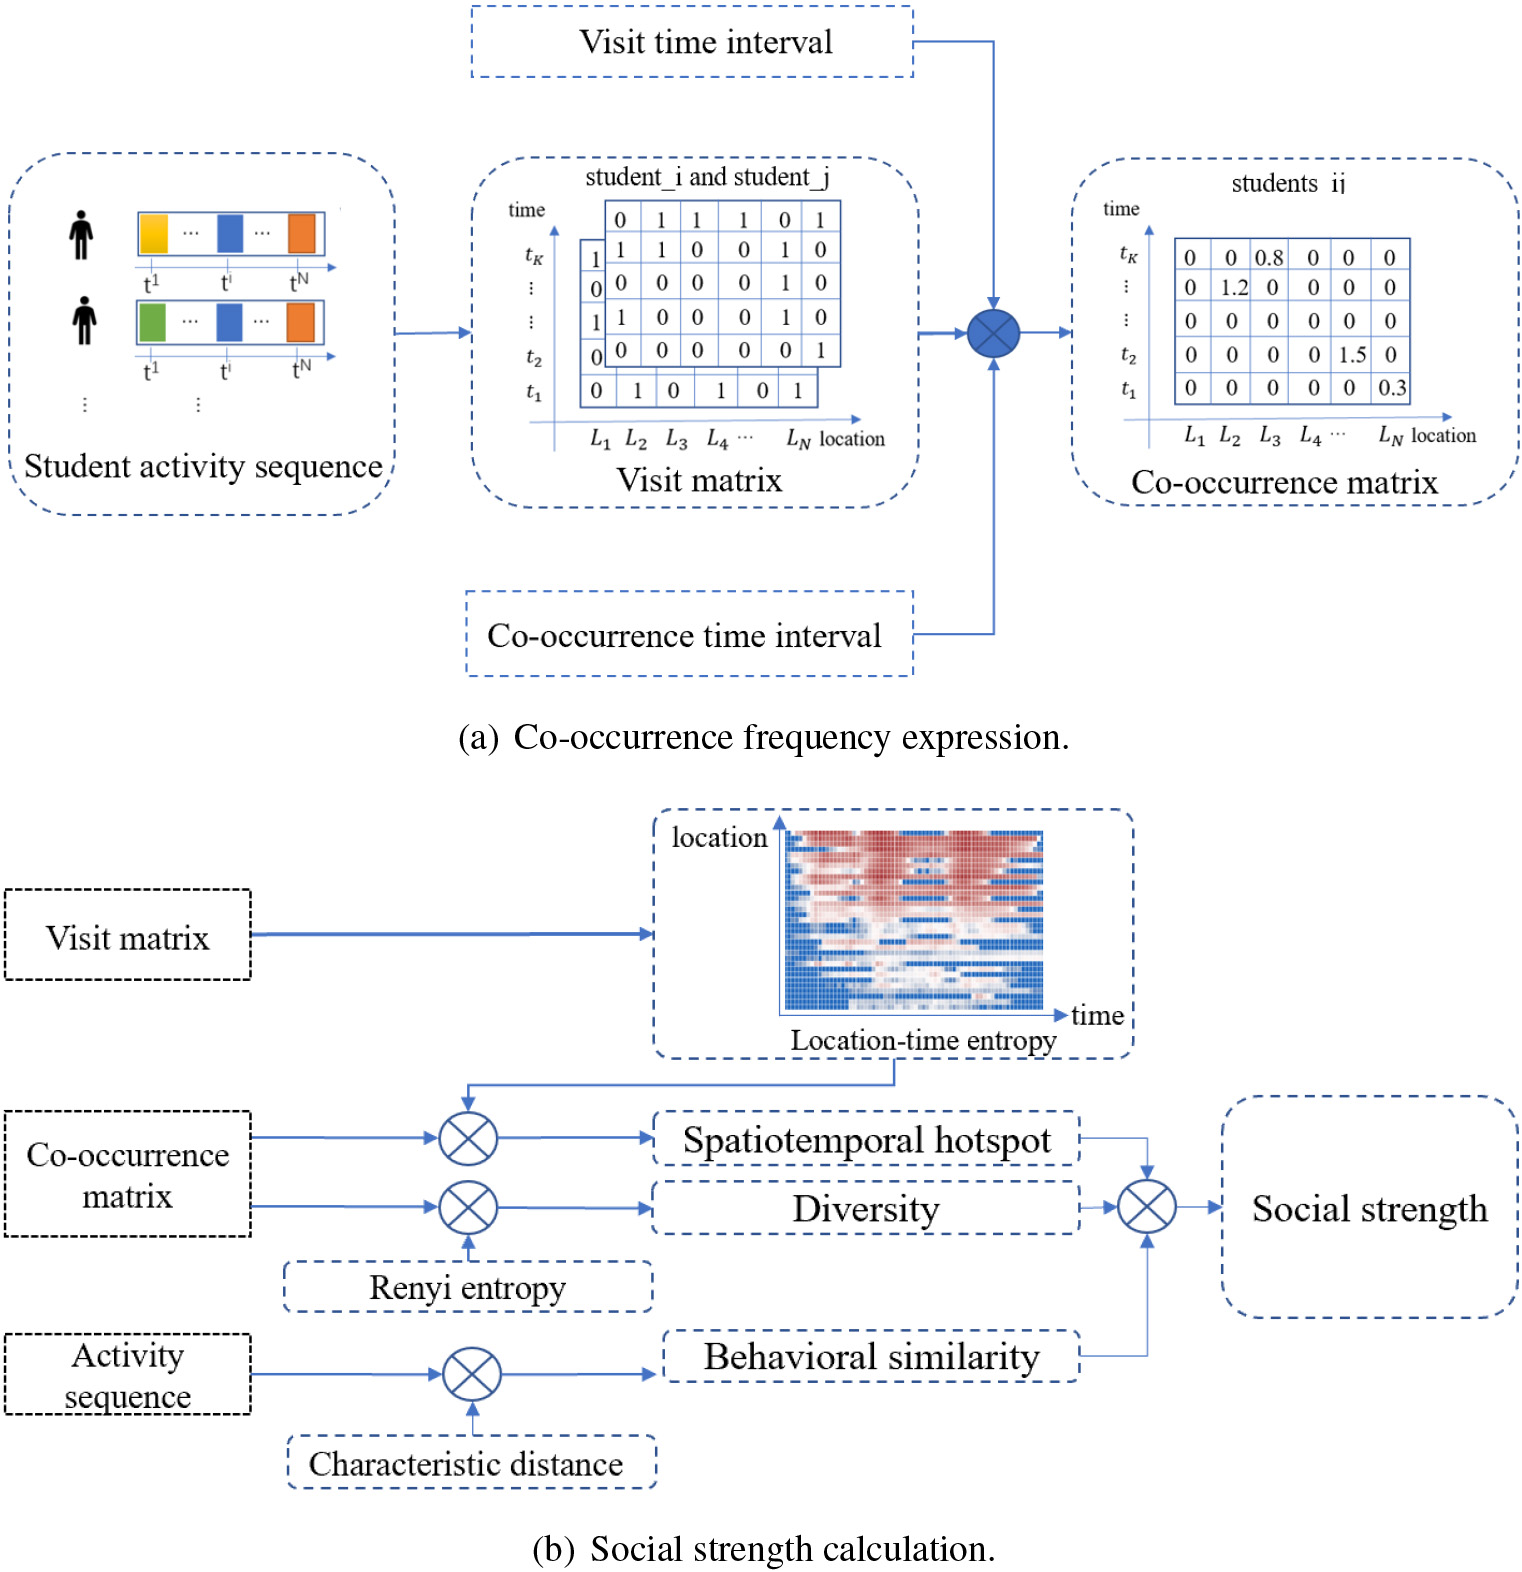
This section introduces how to complete the co-occurrence frequency of two students. Particularly, we considered the influence of the visit time interval (VTI) and the co-occurrence time interval (CTI) on the co-occurrence frequency. The details of the model process are shown in Fig. 5a.
Visit frequency
The student set is represented by
The visit vector of student
The visit matrix
If the interval between the visit time of student
The spatiotemporal co-occurrence matrix can be constructed based on the visit matrix of student
where we divide the day into
Introduce a sliding time window with the range of
The influence of visit time interval can be expressed as:
where
The check-in time of student
Students co-occurrence. The check-in time of student 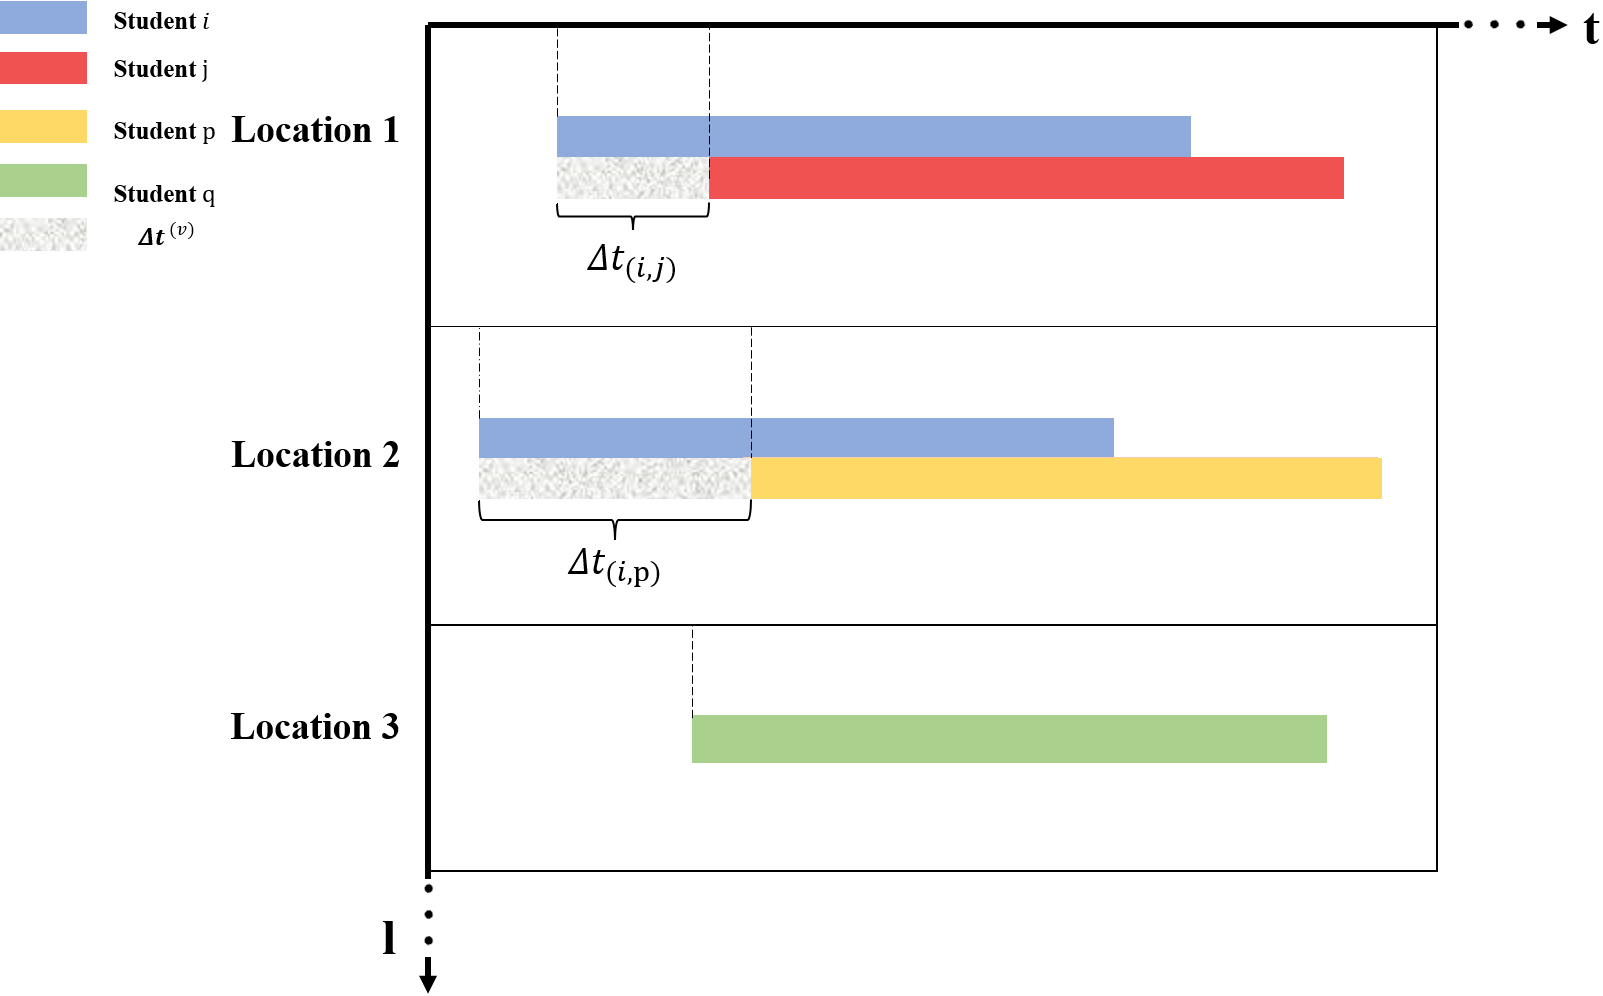
When the VTI is large,
where
Effect of co-occurrence interval. The figure shows the visit time series of 4 students 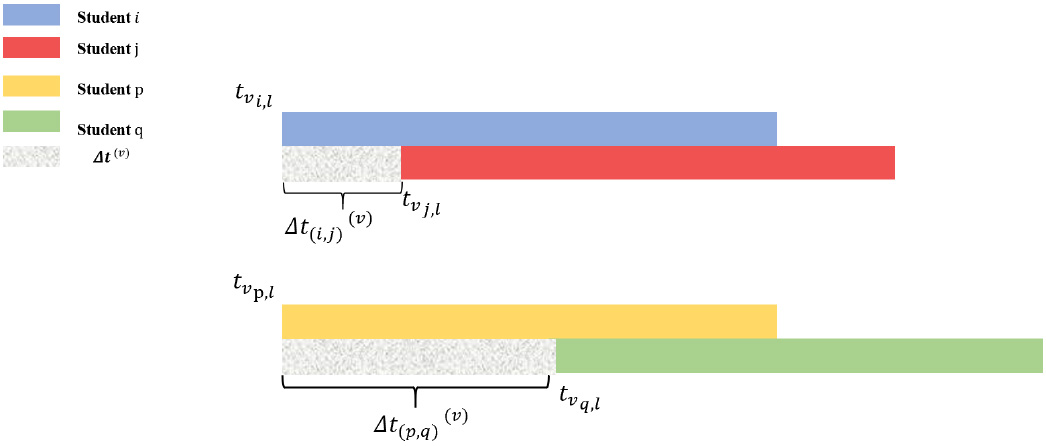
Influence of the interval between two co-occurrences. The figure shows the time series of co-occurrence of students 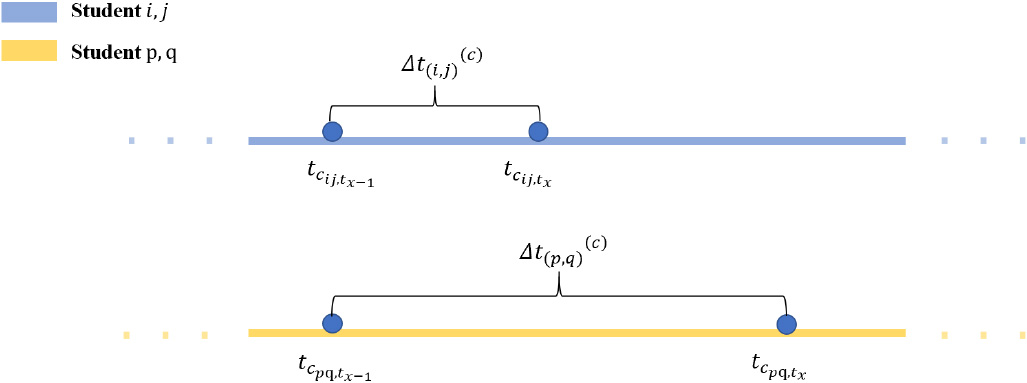
Meanwhile, we consider the influence of time on co-occurrence, given
where
Then the influence of co-occurrence time interval can be expressed as:
where
The co-occurrence frequency under the influence of time weight can be obtained by Eqs (9) and (12):
Acquiring spatiotemporal co-occurrence matrix with the influence of time weight is summarized as Algorithm 5.4.
[h] Acquiring spatiotemporal co-occurrence matrix with the influence of time weightactivity sequence
Create a zero matrix
After obtaining the co-occurrence frequency under the influence of weight, we consider the factors that affect students’ social link and select three features: diversity, spatiotemporal hotspot, and behavior similarity. The details of the model process are shown in Fig. 5b.
Diversity
Students with better relationships often move around at different times and locations, and their co-occurrence times and locations will be more diverse. As shown in Fig. 9a, 10 pairs of students are arranged according to the co-occurrence frequency score. It can be seen that the co-occurrence frequency and diversity are roughly linearly distributed. But there are exceptions, The diversity of student pair D and student pair I did not increase with the co-occurrence frequency. In order to analyze this phenomenon, we select two pairs of students, G and I. As shown in Fig. 9b, there are 6 different locations where the student pair G co-occurs, and the student pair I is 2. This leads to differences in the location diversity of the two groups of students (G
Score distribution of co-occurrence frequency and diversity in different locations.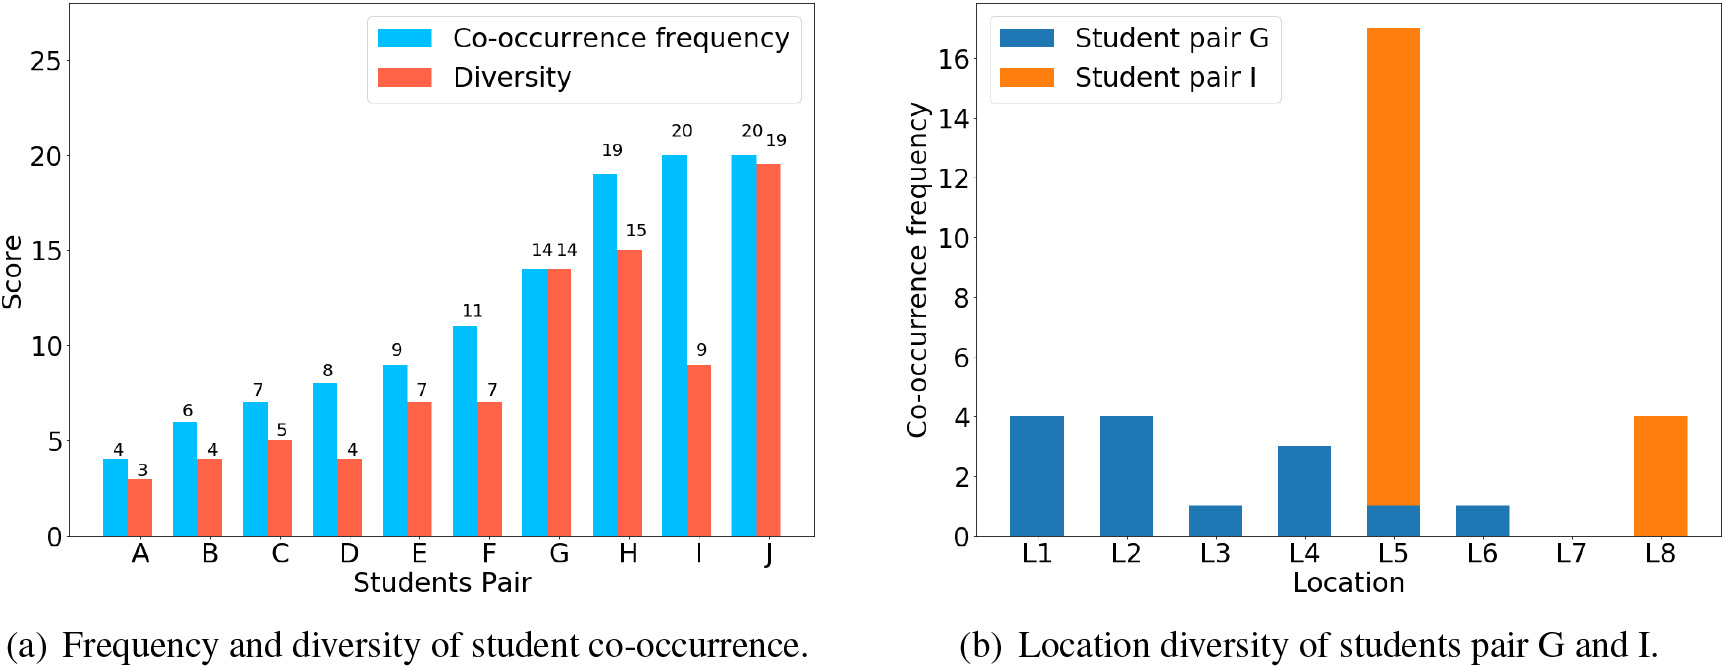
The associated Renyi entropy of student
where
Diversity can be obtained by the exponential change of Renyi entropy. Therefore, we calculate the spatiotemporal co-occurrence diversity of student
The location-time entropy of 49 locations on campus. It can be seen that such as restaurants and supermarkets are significantly higher than stadiums and shower rooms. The entropy of the same location in different time periods is also different. For example, the peak period of the restaurants is three peak dining periods.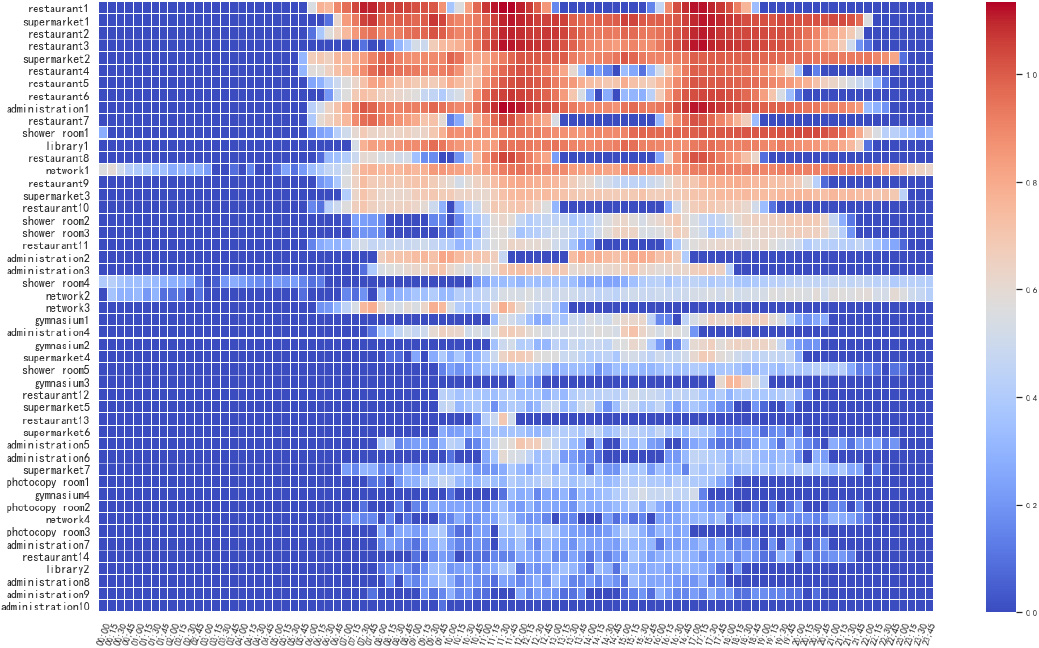
The spatiotemporal co-occurrence of students in different locations at different times has different effects on inferring social strength. For example, student
where
The location-time entropy is as shown in Eq. (17):
[h] Acquiring location-time entropyvisit matrix
calculate
The location-time entropy can be calculated by Algorithm 6.2. Using location-time entropy to weight the co-occurrence frequency, calculate the spatiotemporal hotspot of student
where
Two students with strong social strength have similar behavioral characteristics. In order to express the distribution of the quantitative attribute values in the time series behavior data, the average value, range, and mode are calculated to express the central tendency of the distribution. The minimum, the first quantile, the median, the third quantile and the maximum are used to express the dispersion of the distribution. These statistics are used as behavioral characteristics of students, respectively, using Euclidean distance to calculate the behavior similarity between students
where
Diversity, co-occurrence frequency and behavioral similarity are regarded as the three features for calculating social strength. These three independent features are standardized and summarized to express the social strength of students:
Subsequently, Eq. (21) uses multiple regression methods to determine the parameters of these three independent features. In order to facilitate multiple regressions, we rewrite the equation in explicit form with the best parameters:
which uses linear regression to determine the parameters
[h] Calculating social strengthspatiotemporal co-occurrence matrix
calculate the social strength
The social strength of college students and the patterns of student activities are inferred and analyzed. In addition, the reliability of the model is verified by comparing with other state-of-the-art models such as EBM [17], walk2friends [2], PGT [23]. Finally, in order to enable student workers to understand the structure of social networks effectively, students social networks are examined and then visualized using chord diagrams and force-guided layout algorithms.
Data set
The 9353 student campus card sign-in data logs of three-year students from a university in China are collected. The data log counted students’ behavior data in the spring semester of 2019, including breakfast behavior, lunch behavior, dinner behavior, shopping behavior, entering library behavior, washing behavior, etc. The period of the data log is a teaching semester (145 days), involving 49 locations of different types of activities such as dining, shopping, exercise, learning, surfing the Internet, bathing, recharge, and payment.
For the spatiotemporal activity sequence of student
Prediction performance comparison
From more than 9,000 students, a small number are selected as the verification object because this experiment involves privacy. The reason for this is that the results of the experiment involve student privacy. Therefore, we can only choose the students who agree to know the results and announce that they conduct research to obtain their social relationships. 125 students in 5 classes of different grades in the data set are used as experimental samples. Considering only the relationships within the class; there are 1775 relationships. Classes are numbered to ensure the privacy of students. To determine the social relations of each student in the sample, these students are surveyed through questionnaires and interviews, and the results are converted into labels: mark it as 1 if it is a pair of friends, and mark it as 0 if it is not a pair of friends. In the end, we got 426 positive samples (friends) and 1349 negative samples (not friends) out of 1775 relationships. Table 2 shows the basic information of the survey samples, where Nodes is the number of students in the class, Edges is the number of students pair and Percentage indicates the proportion of students in this class across the 5 classes.
The information of the selected students
The information of the selected students
Student visit matrix expression.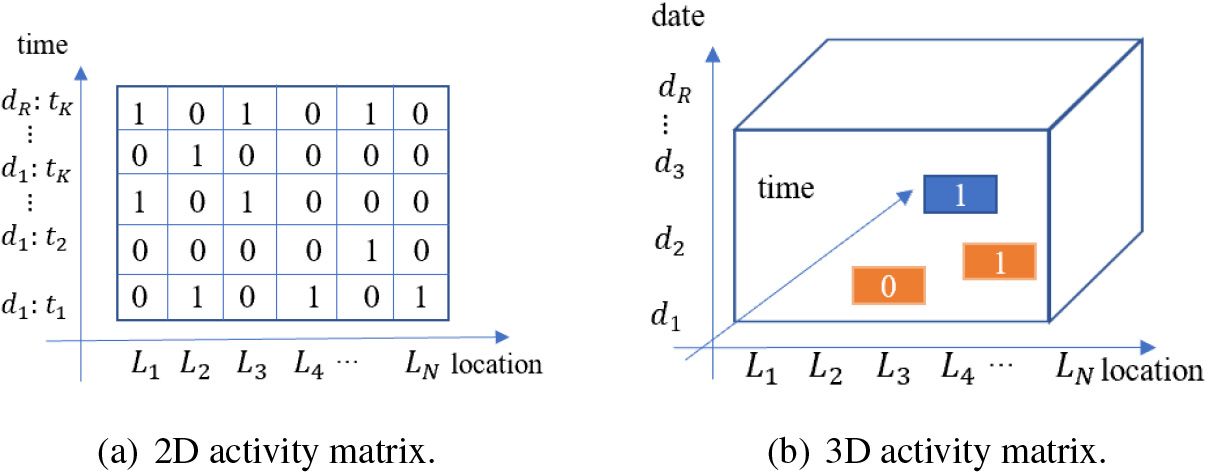
(1) Method comparison
The new method is compared with the EBM to judge the performance improvement. In addition, an advanced method of estimating social relationships based on spatio-temporal data that emerged after EBM is also chosen. It is best to conduct an ablation experiment on the new model, which tests the model under limited variants.
We build a student co-occurrence matrix with time weights according to Algorithm 5.4, calculate the location-time entropy according to Algorithm 6.2, and calculate the strength of students’ social relationships according to Algorithm 6.4. The distribution of student social strength of each method is counted, as shown in Fig. 12. The inflexion point is about 12% of the overall (12.9% after our precise calculation), so we have reason to believe that the top 10% of our predicted social strength is friend relationships. Unfortunately, we could not infer the proportion of non-friends from the Fig. 12, so the last 10%, 20%, 30% and 40% of the student relationship pair are chosen as non-friends for the experiment. The Percentages here represents the proportion of all relationship pairs that are non-friends.
Social strength distribution. We rank the social strength in descending order, where the horizontal axis is the student pair and the vertical axis is the social strength. The red dotted line means friends, and green chooses four proportions that are non-friends.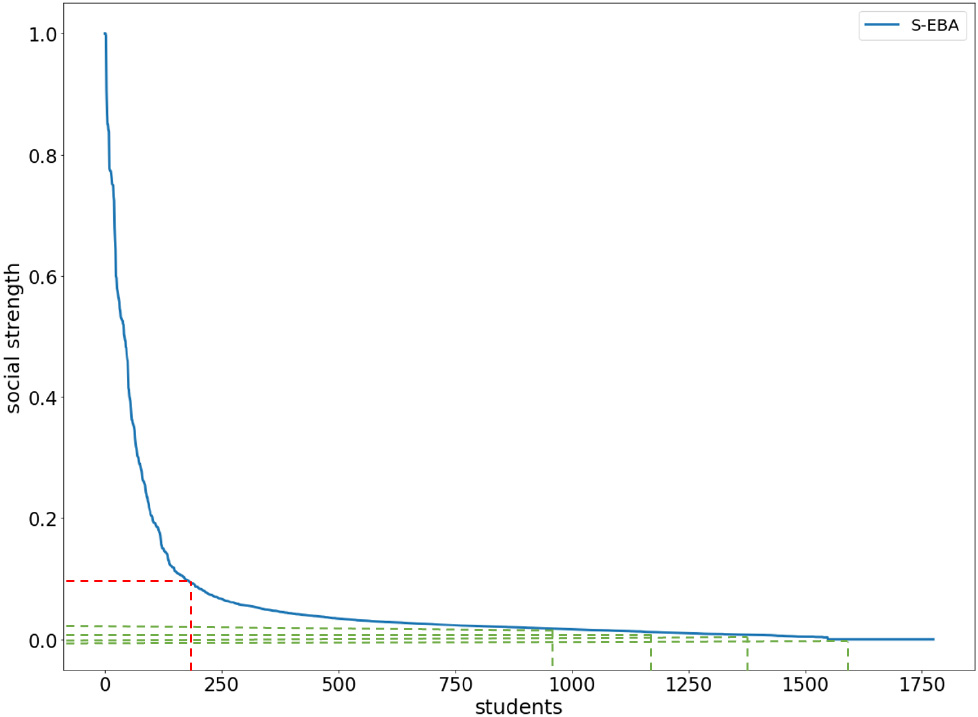
Since the calculated social strength is a set of continuous values, it can be attributed to a regression problem. According to the proportion of non-friends, the data set is divided into 4 groups. The social strength value calculated by the model is used as the predicted value to calculate the three indicators of mean squared error (MSE), mean absolute error (MAE), and
Regression evaluation index comparison. The calculated social strengths are arranged in descending order. The first 10% are regarded as friends, and the last 10%, 20%, 30% and 40% are non-friends, respectively. (Bold font indicates best performance)
The same classifier can have different recall and precision under different thresholds. The thresholds are usually taken in descending order of the actual value or probability of all sample predictions. Therefore, the P-R curve (precision-recall curve) is chosen as our evaluation index. The P-R curve compares all five methods and obtains precision and recall. As shown in Fig. 13, the results obtained by our method are better than EBM. The best area can reach 0.917, which is 18.3% higher than the 0.734 of EBM. Compared with the other two methods walk2friends and PGT and ablation method LTE, the increase was 8.4%, 2.5%, 4.1% respectively.
P-R curve of different proportions of non-friends.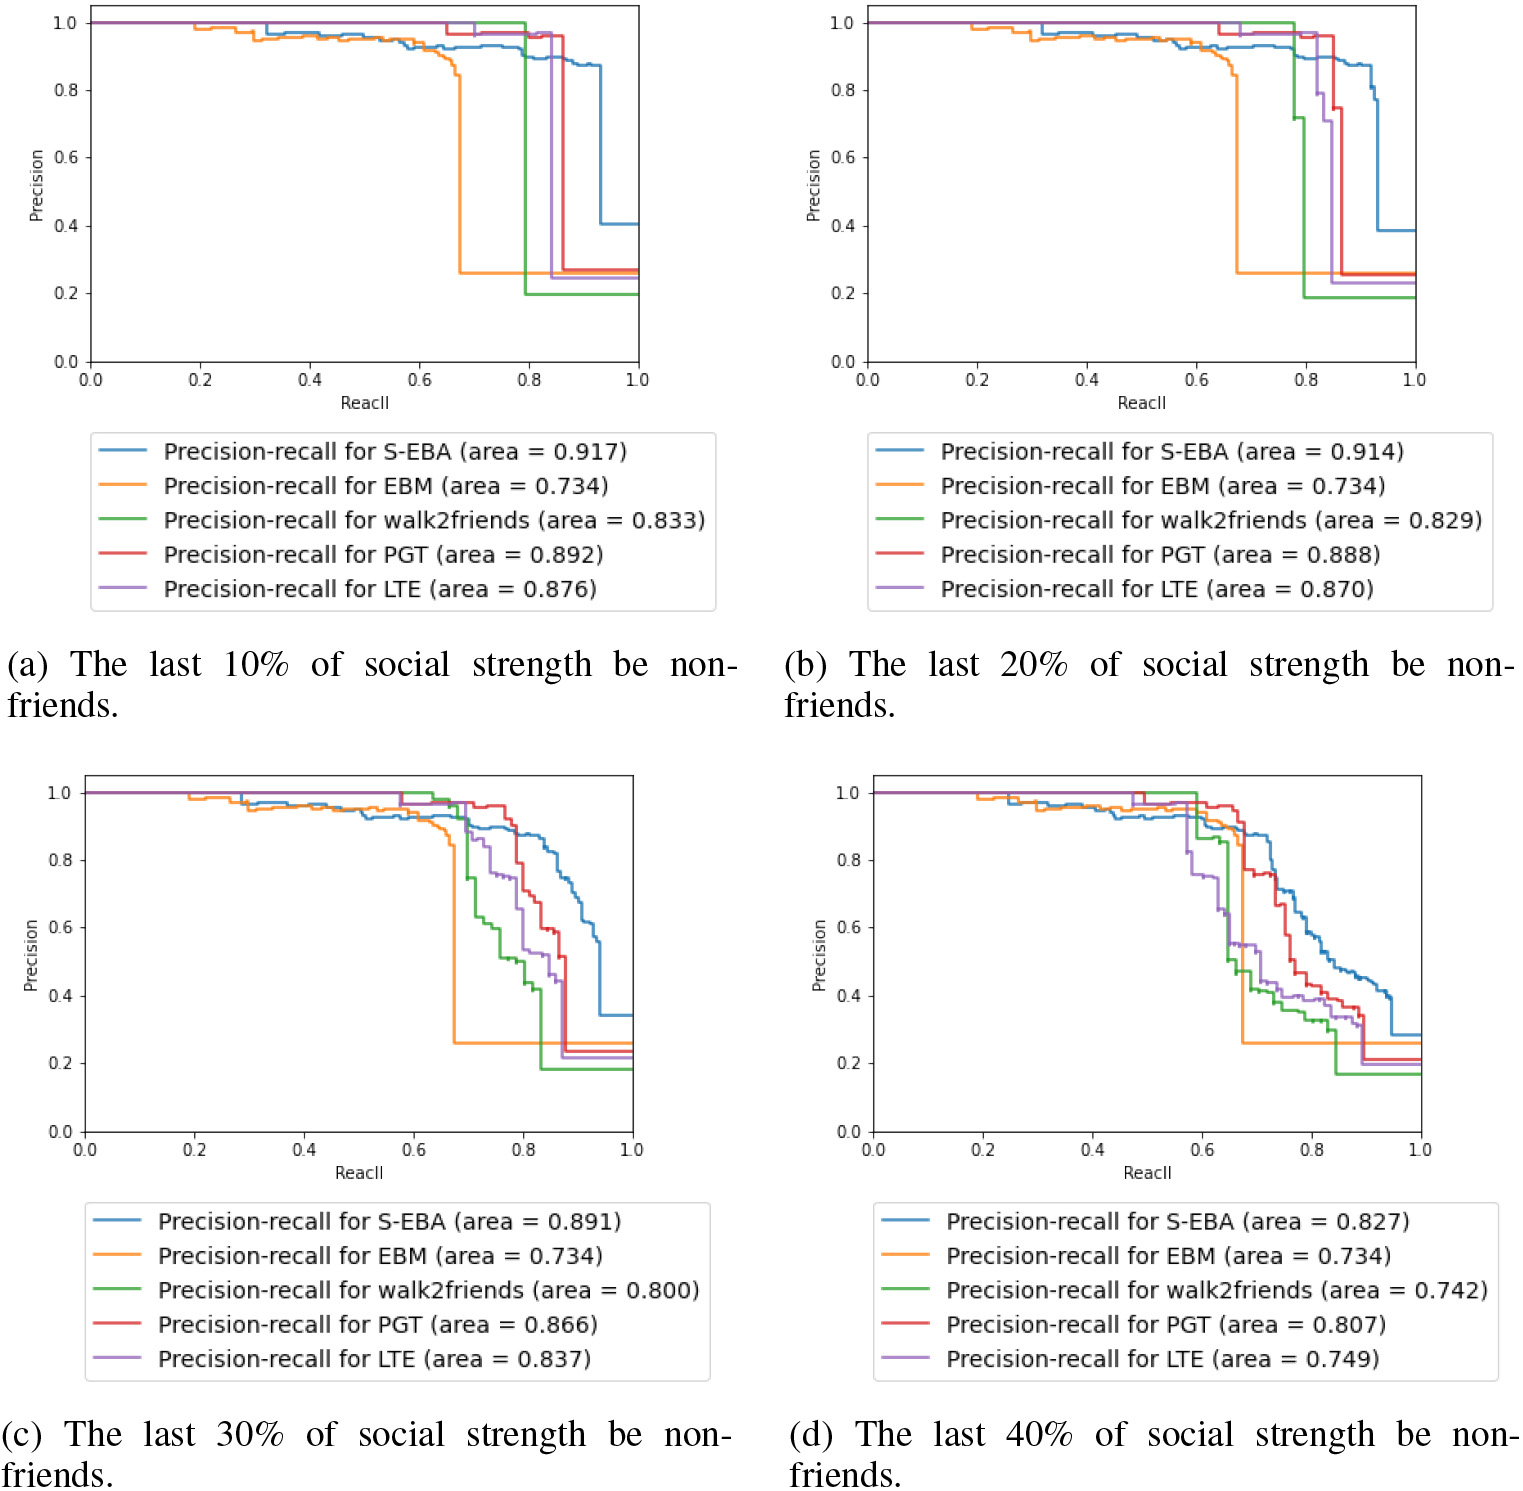
(2) Parameter verification
As mentioned earlier, compared with Shannon entropy, Renyi entropy can determine the contribution of local co-occurrence frequency to entropy by adjusting the value of parameter
Next, we determined the regression parameters
Information of students in class 1102
The precision of the parameters 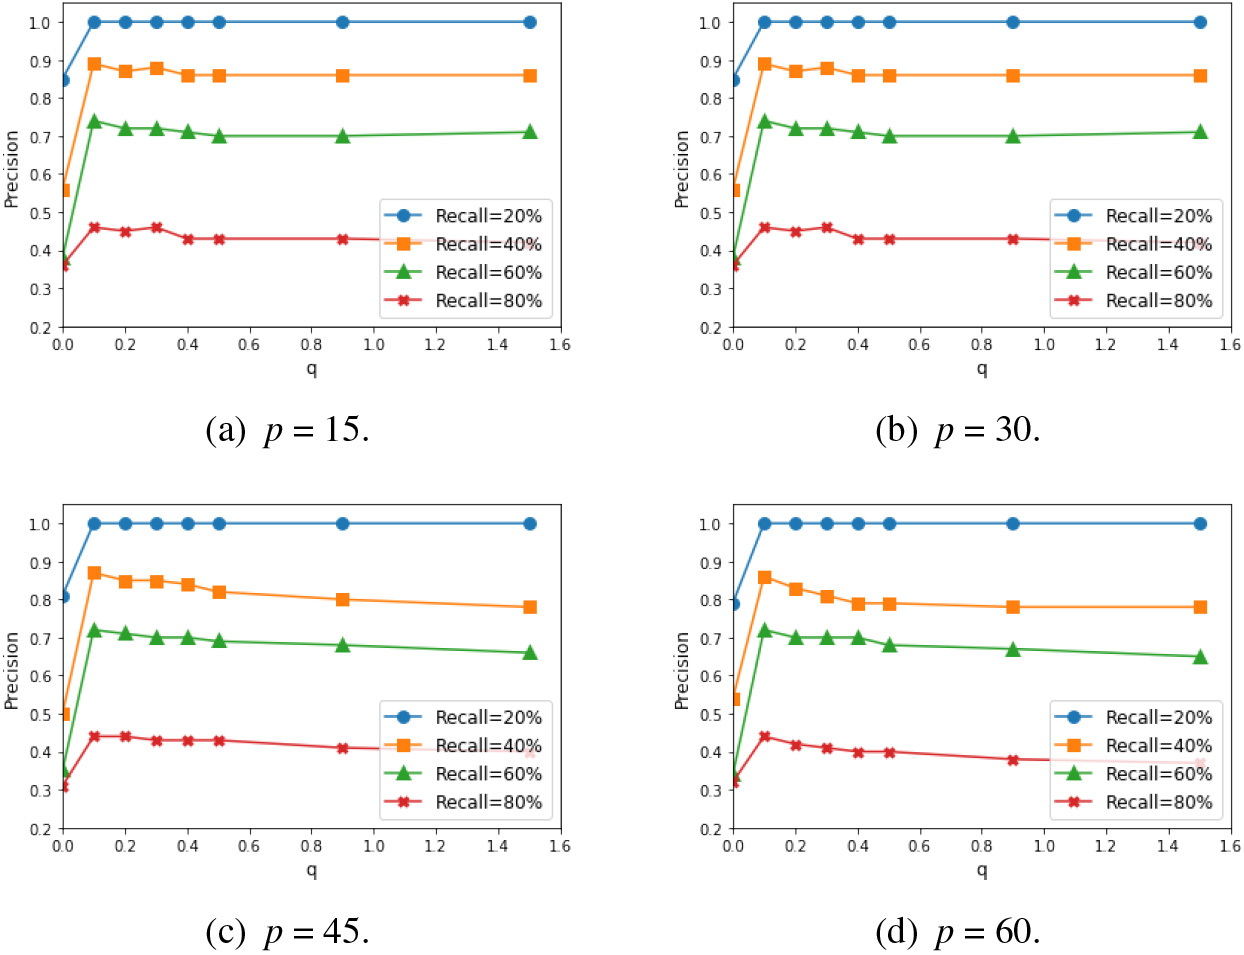
Percentage of real friendships versus the social strength of buckets. We divide 1,775 pairs of relationships into 89 groups in ascending order of social strength, with 20 pairs of students in each group. Then detect the proportion of the number of real friends in each group. The result follows that the lower the social strength, the lower the proportion of real friends.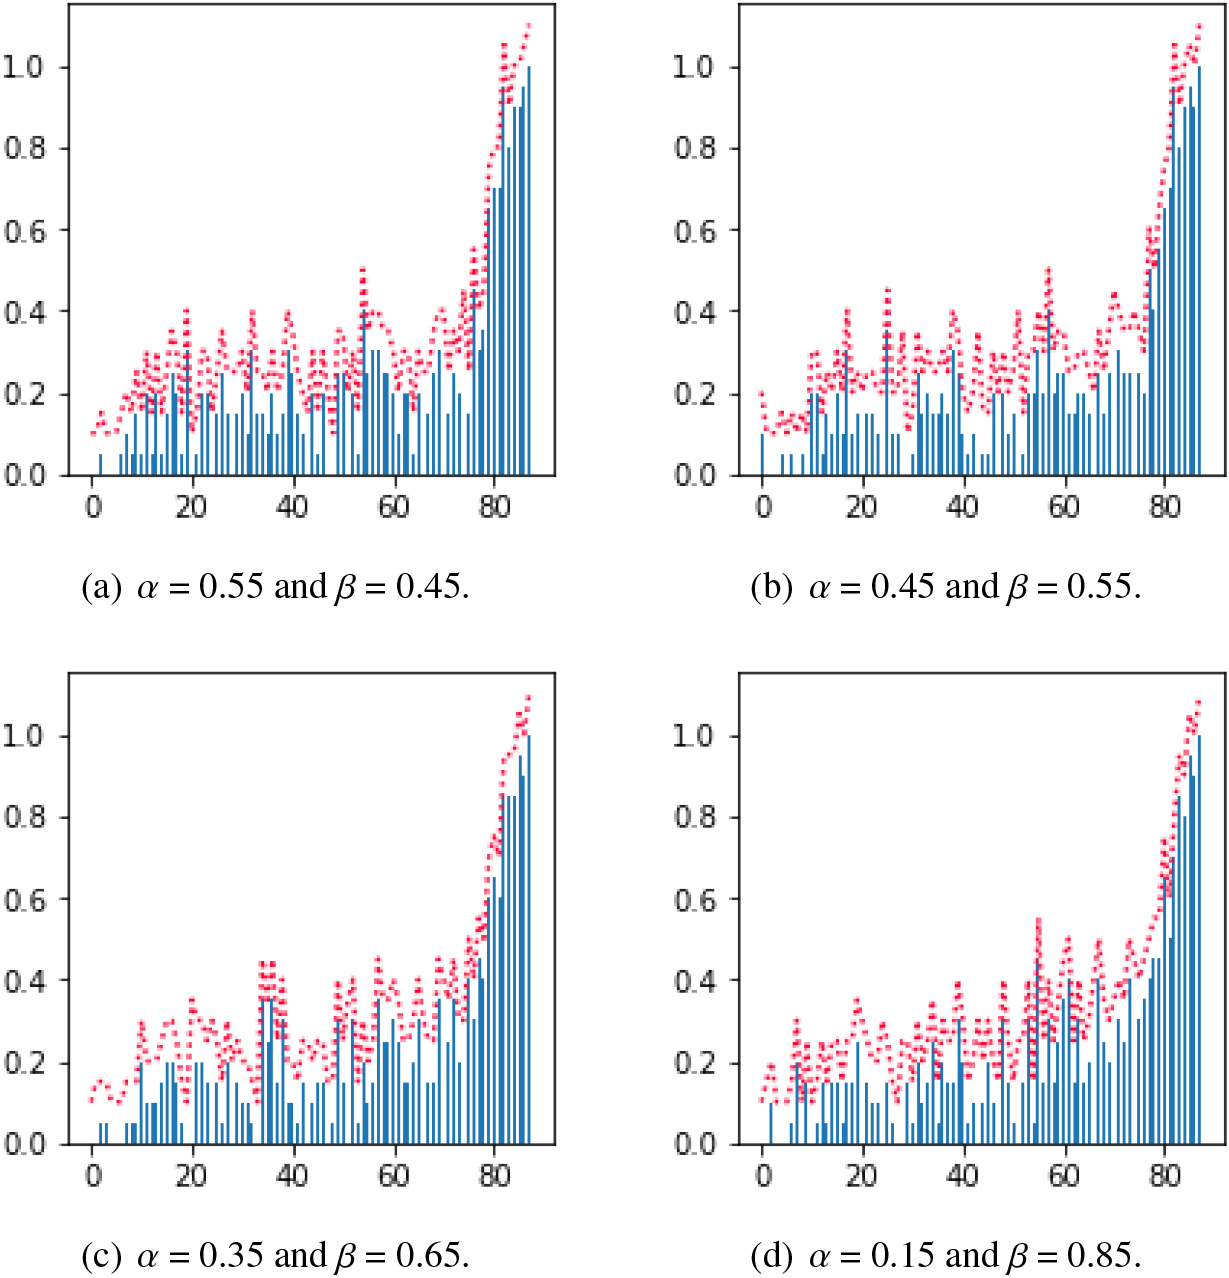
To verify the effectiveness of the inferred social network in analyzing students’ social networking, we use node degree analysis, and Louvain algorithm [3] to analyze students’ weighted social network. We select the social network of class 1102 as the experimental object and analyze the social relationship between students from the perspective of groups and individuals. Table 4 shows the gender, dormitory number, and place of birth of 30 students in the class to explain the results of social relationship analysis.
Using chord diagrams to visualize individual social relationships among students.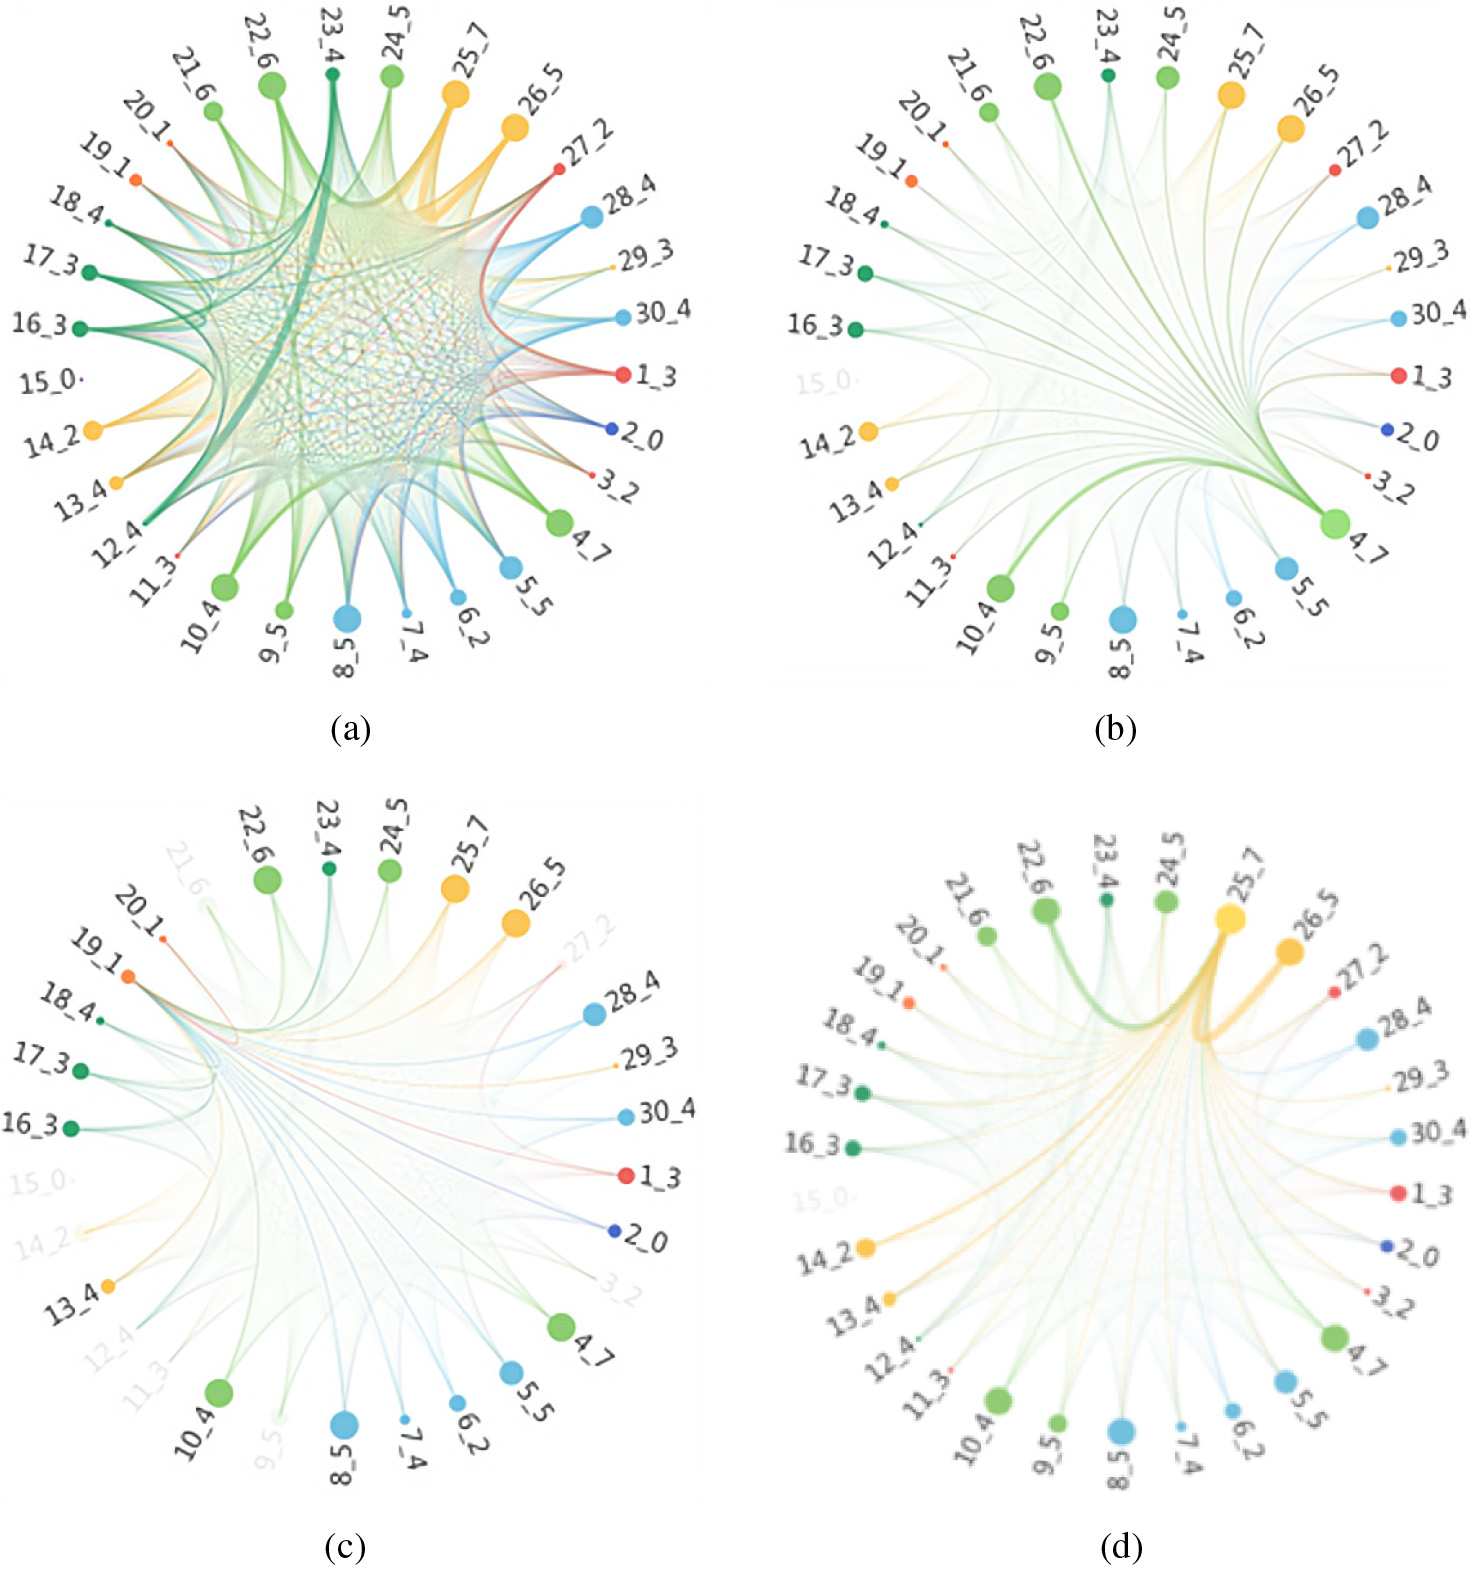
Using Louvain algorithm to divide the student community.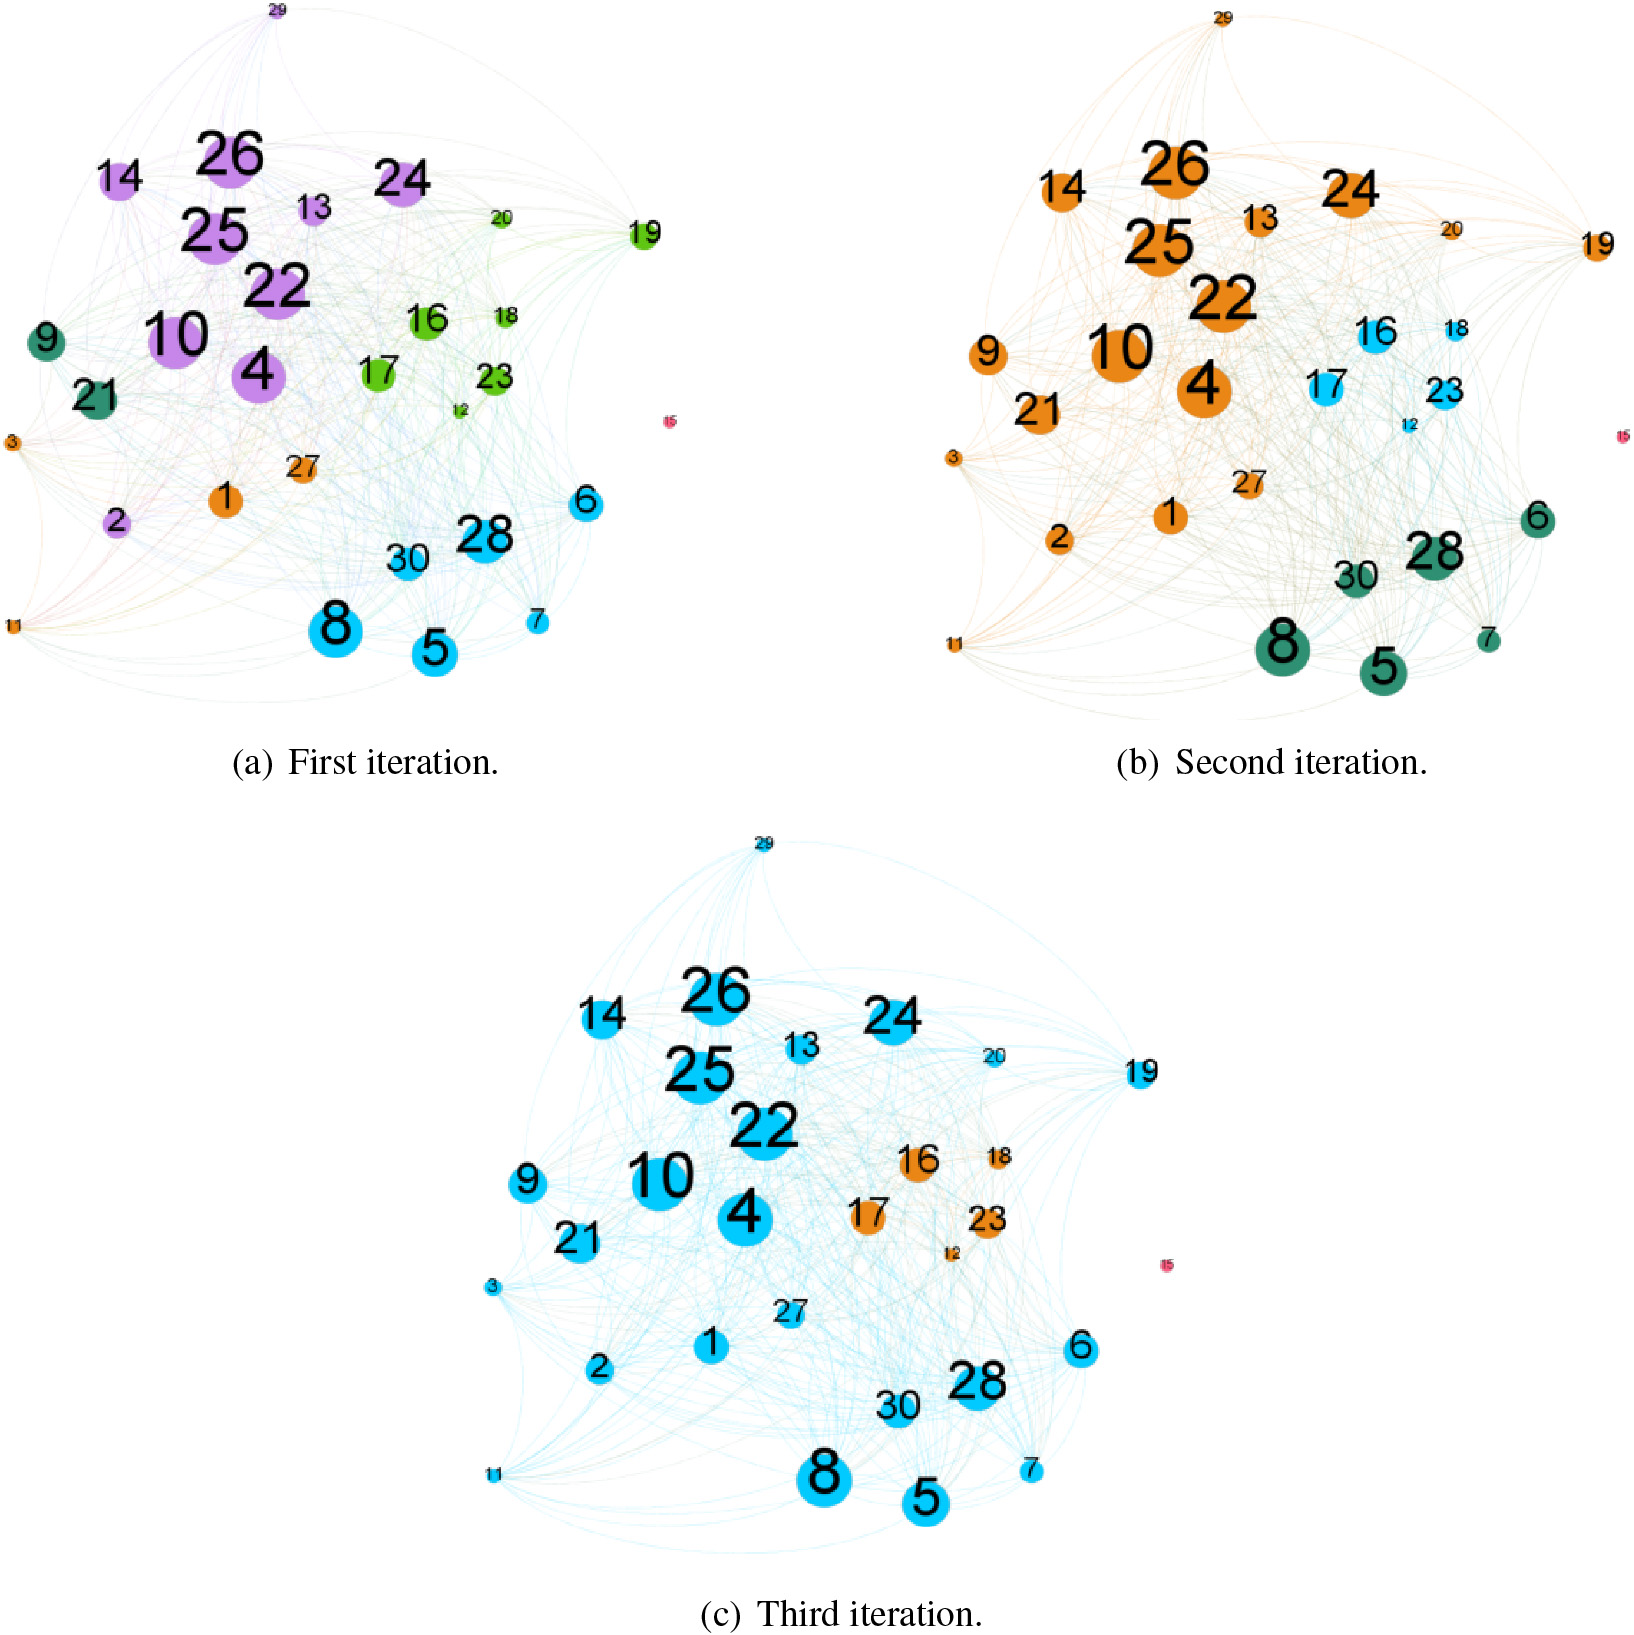
Case 1: Individual Social Link Analysis
This case uses the chord diagram to visually analyse individual students’ social relationships. Generally, the betweenness centrality [25] of the student node in the social network can be used as the size of the nodes in the chord diagram. The node’s color is set according to the dormitory, and the student nodes living in the same dormitory have the same color. The thickness of the arc represents the calculated social intensity value. At the same time, to facilitate understanding, the naming of each node adopts the format of “student number
Case 2: Class Social Relationship Analysis
This case uses Louvain’s algorithm to decompose the social network of class 1102 to understand the characteristics of small communities in the class. This allows us to grasp the reasons for the formation of communities, the associations between communities, and the integration process. After three iterations, the modularity tends to stabilize. To intuitively understand the decomposition results, the iterative results are visualized using force-guided layout [8].
Figure 17a shows the result of the first iteration. The class is divided into six communities: the No. 1 Purple Community, the No. 2 Dark Green Community, the No. 3 Orange Community, the No. 4 Green Community, the No. 5 Blue Community, and the Pink Community on the 6th. Combining student accommodation and gender data can reveal three phenomena. One is that the students in each community are all of the same genders. There is no situation where any community contains male and female students; the second is that the female community members are dormitories. The members are the same. For example, the No. 3 community members and the No. 5 community live in the same dormitory. Among the seven students in the No. 4 community, five live in the same dormitory; that is, the relationship between the students in the dormitory is relatively close, which shows that girls have a strong dormitory concept when socializing; third, boys’ dormitory concept when socializing is weaker than that of female classmates. For example, ten male classmates in Purple Community No. 0, 1, 2 dormitories, their social interaction shows the characteristics of the cross dormitory. Still, the two students in the second community do not belong to the same community as the other four students in the same dormitory. The No. 6 pink community only contains the No. 15 student who was transferred from another major in the spring semester of 2019 and did not live with his classmates. Therefore, the social relationship with the classmates is fragile.
Figure 17b shows the result of the second iteration, which contains four communities, namely, the orange community No. 1, the blue community No. 2, the dark green community No. 3, and the pink community No. 4. The No. 1 orange community merged the first iteration of No. 1 community, No. 2 community, No. 3 community, and No. 19 and No. 20 students of No. 4 community. This community includes all male students and six female students. After investigation, these six female classmates usually interacted more with male classmates. The community contains 18 classmates, accounting for 60% of the total class size, showing the characteristics of cross-dorm and transgender. However, the blue community No. 2 and the dark green community No. 3 still belong to the same dormitory.
Figure 17c shows the result of the third iteration, which contains three communities, namely the blue community No. 1, the orange community No. 2, and the pink community No. 3. Among them, the blue community No. 1 will be the second iteration. The orange community No. 1 and the dark green community No. 3 are merged, and the other two communities kept the results of the second iteration unchanged. This further shows that the social life of the students in the orange community. No. 2 is mainly dormitory students, and the social interaction with other students in the class is limited. However, by observing the performance data of the students, an interesting phenomenon is found. Four out of the five students in the No. 2 community, two students’ scores are excellent, accounting for 66.7% of the students with outstanding grades in the class.
The above analysis shows that the Louvain decomposition of the class social network can clearly understand the distribution and characteristics of the small communities in the class and provide helpful information for the construction of class cohesion.
Aiming at the mining of campus students’ social links, we propose an S-EBA model based on spatiotemporal behavior data to calculate the social strength of students. In order to analyze the special impact of location-intensive and time-sensitive campus scenes, Renyi entropy and location-time entropy are used to effectively suppress errors caused by hotspot space-time and contingency to ensure accuracy. Compared with the traditional methods, our method can calculate the social strength of students more accurately. This paper analyzes two cases of the relationship between individual and group society and obtains the influence of the social association inferred by the model on students’ mental health and performance. Certainly, the method can also be extended to a broader range of other fields, such as the social connection in social networks and passengers鈥?hidden relation proximity for urban public transportation, etc. In future work, we will further analyze other features of the campus background that affect social strength to improve the model’s performance and further enhance the interpretability of teaching management.
Footnotes
Acknowledgments
The research project is partially supported by National Natural Science Foundation of China under Grant No. 62072015, 61906011, U19B2039, U1811463, 61632006, U21B2038, Beijing Municipal Science and Technology Project No. KM202010005014, Special Project of China Higher Education Association “Higher Education Informatization Research No. 2020XXHYB16. Beijing Natural Science Foundation No. 4202004.