
Abstract
Retinopathy of prematurity (ROP), sometimes known as Terry syndrome, is an ophthalmic condition that affects premature babies. It is the main cause of childhood blindness and morbidity of vision throughout life. ROP frequently coexists with a disease stage known as Plus disease, which is marked by severe tortuosity and dilated retinal blood vessels. The goal of this research is to create a diagnostic technique that can discriminate between infants with Plus disease from healthy subjects. Blood vascular tortuosity is used as a prognostic indicator for the diagnosis. We examine the quantification of retinal blood vessel tortuosity and propose a computer-aided diagnosis system that can be used as a tool for ROP identification. Deep neural networks are used in the proposed approach to segment retinal blood vessels, which is followed by the prediction of tortuous vessel pixels in the segmented vessel map. Digital fundus images obtained from Retcam3
Keywords
Introduction
Retinopathy of prematurity (ROP) is a blinding condition that affects vision in preterm babies who are born before 31 weeks of pregnancy and have low birth weight [3]. Neo-vascularization that develops in the inner parts of the eyes as a result of this disease eventually results in retinal detachment and irreversible vision loss. The International Committee for the Classification of ROP [12] established that the initiation of ROP treatment should be commenced depending on the incidence of Plus disease. Figure 1b illustrates the increased tortuosity and dilatation of the retinal blood vessels that characterise this condition. In this study, we quantify the tortuosity that is present in infant retinal images and utilise it to predict Plus disease, a key ROP indicator. High retinal blood vessel tortuosity is a marker of many other diseases, including atherosclerosis, blood pressure, and diabetic retinopathy [15, 30, 25]. Hence, the proposed methodology can also be used to detect these diseases.
Preterm infant retinal fundus images. (a) Healthy and (b) Plus disease samples. Compared to a healthy image, the Plus diseased image shows much more tortuosity (twisting) and dilation in the retinal blood vessels.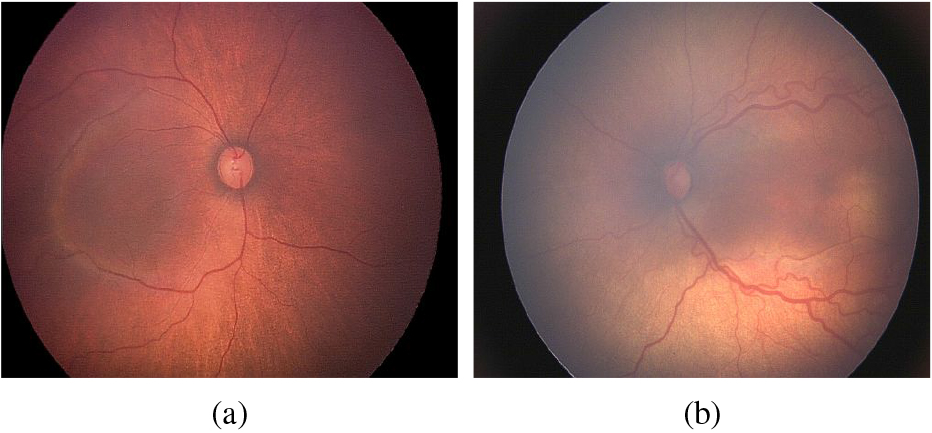
Recent improvements in neonatal care have reduced the number of preterm infant mortality. ROP is frequently an issue in premature infants that are born before the stipulated gestational age and weight less than 1750 grams. Numerous studies have documented the disparity in inter-observer agreement in the predicting ROP in a given image [16, 13, 4]. Consequently, there is a need for an automated diagnostic tool that would assist clinicians in correctly diagnosing ROP. The proposed work in this paper uses deep learning (DL) techniques to evaluate infant retinal images for the existence of Plus disease. On a private data set of 289 newborn retinal images received from Narayana Nethralaya (NN), Bangalore, India, the effectiveness of the proposed approach is evaluated.
The major contributions of this work include:
A novel pipeline for locating tortuous blood vessels in a retinal image of a premature infant. A fully automated diagnostic approach for identifying Plus disease. An easily explainable output that shows tortuous vessel locations in the examined images.
A substantial amount of research is available in the literature for identifying blood vascular tortuosity and then diagnosing ROP [42, 14, 21]. Many studies framed the disease diagnosis as a two-stage problem, with the first stage being the delineation of the vessel map from the images followed by the identification of tortuous areas in the segmented vessel tree [34, 33, 35]. Convolutional neural networks (CNN) are employed in this study to replicate the same procedure, which includes vessel delineation followed by determining tortuous vessel locations. The pipeline uses two deep neural networks, one to create the map of the retinal blood vessel tree and the other to determine whether a pixel in the vessel map is tortuous or not. To the best of our knowledge, this study is the first of its kind to employ CNN for Plus disease diagnosis by predicting abnormal retinal blood vessel pixels in a given fundus image.
The literature on retinal blood vessel delineation and digital diagnostic methods for ROP were surveyed in [8, 2, 11, 5]. In the last ten years, approaches based on CNN have made significant progress in the classification and segmentation problems. These methods have been widely used with medical imaging applications such as detection of lesions, segmentation of different anomalies like a tumour or malignant breast masses, retinal blood vessel delineation, and many more applications. The following section gives a quick overview of existing research on deep neural network-based retinal blood vessel segmentation and ROP diagnosis.
The six-layer CNN architecture described in [45] generates vessel segmented output using classifiers after extracting feature maps from input retinal images. Melinscak et al. [22] 10-layer vessel segmentation framework consists of two fully connected layers in the output side after a series of convolutional and max-pooling layers. Similar to [22], Fu et al. [10] proposed a four-stage deep learning architecture that includes several convolutional and ReLU activation layers in each level. Using a completely CNN architecture, this technique learns the precise properties that produce vessel probability maps. Liskowski and Krawiec [20] employed small sized patches obtained from pre-processed fundus images for training the network. Two CNN architectures were proposed, one having convolutional, max-pooling, and fully connected layers, and the other with the same structure but without max-pooling layers. The cross-modality data transformation concept introduced in [19] directly predicts the labels of each vessel pixel in a given image using deep networks.
Many U-Net [29] variants with excellent performance in blood vessel segmentation have been proposed in the literature. In [48], spatial context information gained by adding an additional dense block and multi-scale input layers is used to enrich the traditional U-Net framework. The enhanced characteristics enable the capability to recognize low contrast thin blood vessels, which contributes to the increase in performance metrics. A unique U-Net version with two encoders – one to maintain spatial information and the other to capture additional semantic information was introduced in [43]. For extracting vessels from retinal images, the R2-UNet patch-based vessel segmentation model, which was introduced in [1], combines recurrent-CNN residual blocks with U-Net architecture. Fan et al. [7] proposed octave transposed convolution in the decoder blocks for retrieving spatial information and added octave convolution to the U-Net encoder blocks for feature extraction.
Literature also provide a few deep learning techniques for diagnosis of ROP in premature infants. These techniques use a large number of images for experiments and have no explanation for the outcomes obtained. The output is dependent solely on the amount of images used for training. Worrall et al. [47] introduced a DL-ROP detection system built on GoogLeNet framework along-with fully connected layers. Wang et al. [44] proposed an automated CNN-based system for ROP detection and severity grading utilising Inception-v3 network. In another study [41] Inception-v3 is used to categorise infant retinal images as either healthy or unhealthy. In a research published in[49], the performance of three widely used CNN frameworks, namely VGG-16 net, AlexNet, and GoogLeNet were compared with that of an ROP expert. Using Inception modules with skip connections, Wang et al. [46] proposed a DL-based ROP detection technique. ROP categorization in [26] is carried out using a pre-trained ResNet18 network that was trained using a large number of image samples. An object detection framework is used to diagnose Plus disease in a recent study that proposed in [27]. In this study, we generate a vascular map in the infant retinal images obtained from a private data set using an existing U-net architecture. Further, to predict Plus disease a custom CNN framework is used to analyse the vessel map.
Schematic of the proposed framework employing dual CNNs. The extraction of vessel maps from the input images is followed by the identification of vessel pixels as tortuous or normal. For the two output classes, colour coding is used, allowing for understandable result visualisation.
The proposed technique makes use of two CNNs to achieve the intended goal, the U-Net framework for vessel segmentation and a simple custom made network for identifying tortuous vessels presented in the segmented output. In the following, we discuss the various steps involved in implementing the block schematic shown in Fig. 2.
Image pre-processing
Medical images essentially need pre-processing as they lack contrast and are contaminated by various noise artefacts. To get over the inherent issues, images are pre-processed before being deployed as input into a developed system. In this work, the green channel of the infant retinal RGB image, which has the highest contrast between vessels and the background [23] is extracted and used for further processing and analysis.
The data utilised for network training and subsequent evaluation methods has a significant impact on how well DL-based algorithms perform. The scale and distribution of the provided data, which is taken from a particular domain, are often likely to differ significantly for each variable. These scale discrepancies could make it challenging to model a specific problem. Data normalisation approaches, which rescale all the input variables to lie between 0 and 1, can serve to rectify these inherent problems. Thus, each pixel present in an image is rescaled as:
where
The U-Net structure [29] has been widely employed in the segmentation of blood vessels from retinal images. This symmetrical architecture is used in our work to delineate vessels in the preterm retinal images. The encoding path, the bottleneck, and the decoding path are the three main sections of the U-Net design. The encoding path creates feature maps that collect contextual information in an image while the decoding path make precise localisation and integrate it with the extracted contextual data from the encoding section. Bottlenecks force the model to learn a compression of the input data, which contain only the useful information required to reconstruct the segmentation map. We use the same implementation presented in [29] and readers can refer to it for more details. The network architecture is shown in Fig. 3.
The CNN architecture, UNet [29], employed for the delineation of blood vessels from the infant retinal images. The architecture consists of an encoding path, the bottleneck, and the decoding path which helps to extract useful information that is required to reconstruct the vessel segmentation map.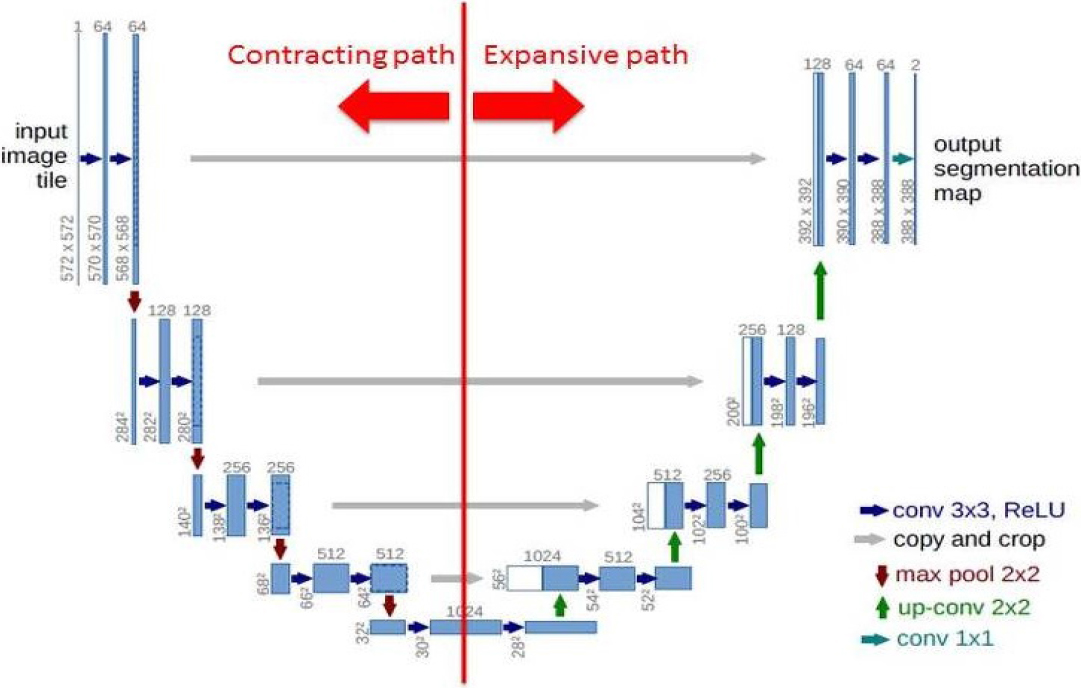
The patch-based approach permits to use a large number of extracted image patches from the input images when there is a very minimal amount of data available for network training. We use this technique to predict the presence of tortuous pixels in a given retinal image. The task of locating tortuous vessel pixels in the fundus image is thus posed as a patch classification problem. The proposed network predicts the likelihood of the centre pixel, which determines whether the pixel belongs to the class of normal or tortuous vessels.
The GUI created for generating vessel patches. Manual visual inspection is used to identify tortuous vessel patches. The GUI allows for the generation of vessel patches in any dimension, with or without overlapping.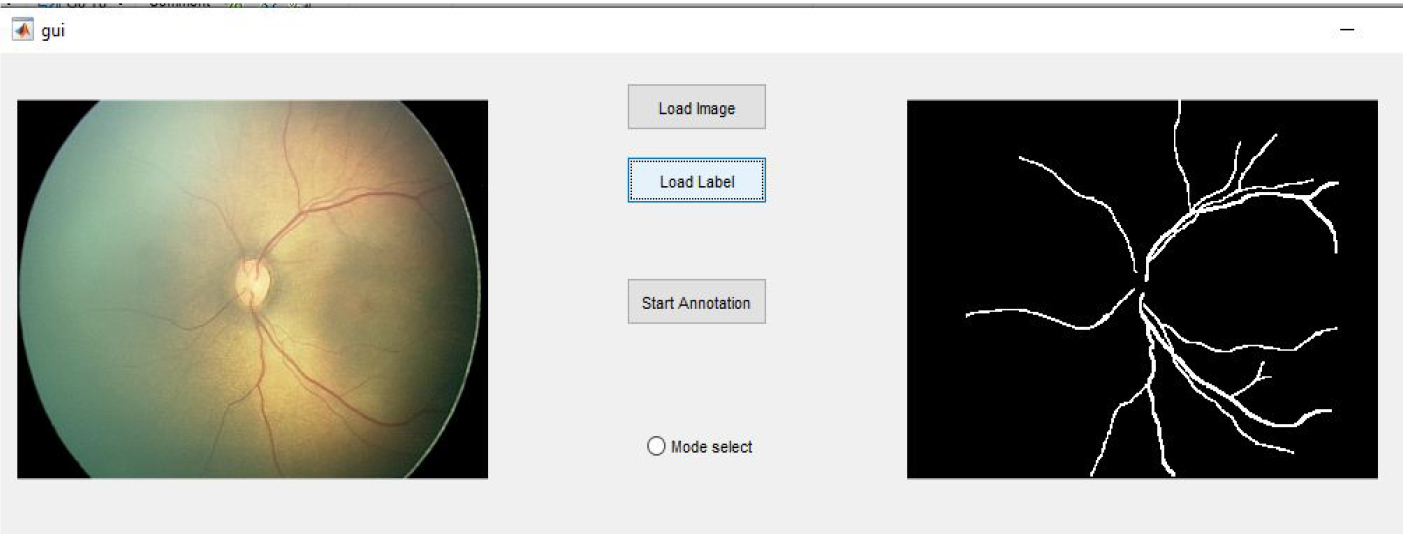
We use the segmented map acquired from the U-Net framework to sample patches from an image. For patch extraction, a graphical user interface (GUI), as shown in Fig. 4, is developed. The GUI has two modes of operation: automated and manual. There is no human intervention in automatic mode, and vessel patches are obtained based on the presence of a centre pixel in a patch under evaluation. Furthermore, the GUI allows the user to obtain overlapping patches at any resolution based on their needs. In both modes of operation, a user-specified window of a certain size traverses the segmented image to extract vessel patches. Vessel patches are extracted automatically, and then manually classified as tortuous or non-tortuous. The classified vessel patches are then used to train the network.
As per the literature [31], to provide more coherence between the network and the data, square patches are taken into consideration while creating vessel patches. During the testing phase, centred around each pixel a patch should be considered in the test image for assessing tortuosity in the examined pixel. When compared to complete image-based classification techniques, the patch-based methodology saves computing cost. The example vessel patches extracted using the designed GUI are shown in Fig. 5.
Examples of normal and tortuous vessel patches generated from the GUI depicted in Fig. 4. The first four rows of images represent non-tortuous vessel patches, whereas the subsequent rows represent tortuous vessel patches.
In order to predict whether a centre pixel is tortuous or not, the proposed patch classification methodology employs a CNN to train vessel patches that were taken from preterm infant retinal images. Using network layers made up of alternate convolution and subsampling blocks, classification is carried out using a traditional CNN framework. The architecture used in this study consists of two convolution layers, two max-pooling layers, and two fully connected layers, as illustrated in Fig. 6. The extracted vessel patches of size 55
The proposed CNN for pixel classification used in our study. Convolutional and max-pooling layers alternate in the network, which is then followed by fully connected layers.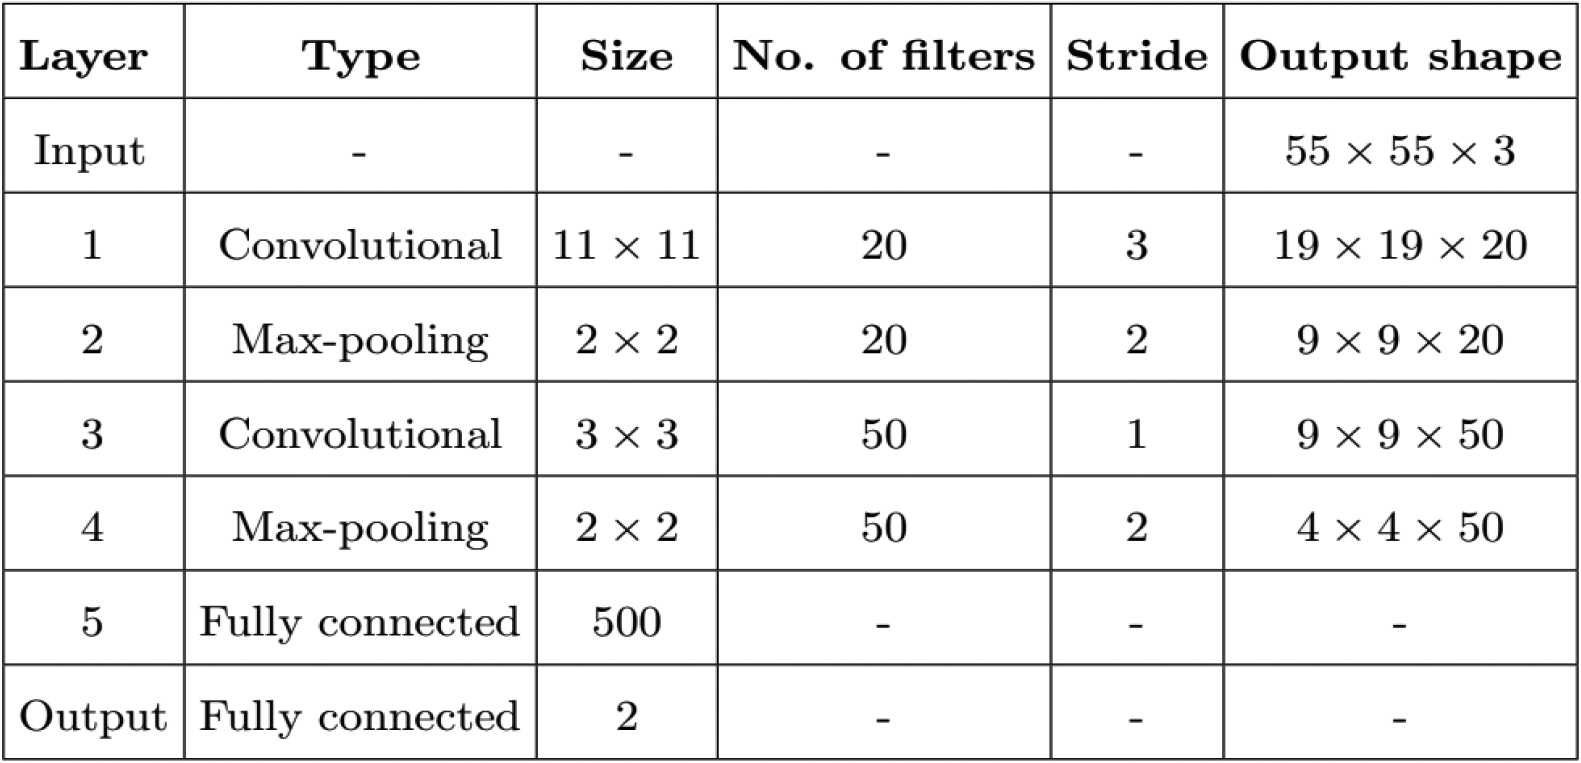
High tortuosity in any two retinal quadrants is considered to be a sign of Plus disease in the literature [2]. Furthermore, it has been demonstrated in a recent study that when screening for ROP, eye-based tortuosity evaluation offers a more accurate diagnosis than traditional quadrant-based techniques [18]. Based on this fact, we measure the tortuosity by counting the number of tortuous vessel pixels present in each image under evaluation.
Experiments
In this section, we discuss the resources used for the proposed study along with data augmentation and training procedure performed for obtaining the final output. A note on the evaluation metrics employed for verifying the performance of the experiments done on the proposed system are narrated towards the end.
Data set
In this study, a proprietary data set of 289 infant retinal images (200 healthy images and 89 images with Plus disease) from Narayana Nethralaya (NN), Bangalore, India, was employed. The retinal images were taken during the usual ROP screening procedures at NN and belong to preterm infants with an average birth weight of 2000 grams and/or gestational age less than 34 weeks. RetCam3
Data augmentation
Due to the lack of sufficient number of images for network training, data augmentation forms an essential process in many medical research problems. In this study, patch classification and segmentation tasks both involve data augmentation. From the NN data set, we randomly picked 28 images (14 healthy and 14 diseased), which were then manually segmented. The raw images and their ground truth labels are combined to create augmented samples.
An illustration of augmented images produced using the Keras deep learning library. To demonstrate the process, transformed versions of six different images are shown in the figure. Each image consists of the transformed version of the original image and its corresponding segmentation map. 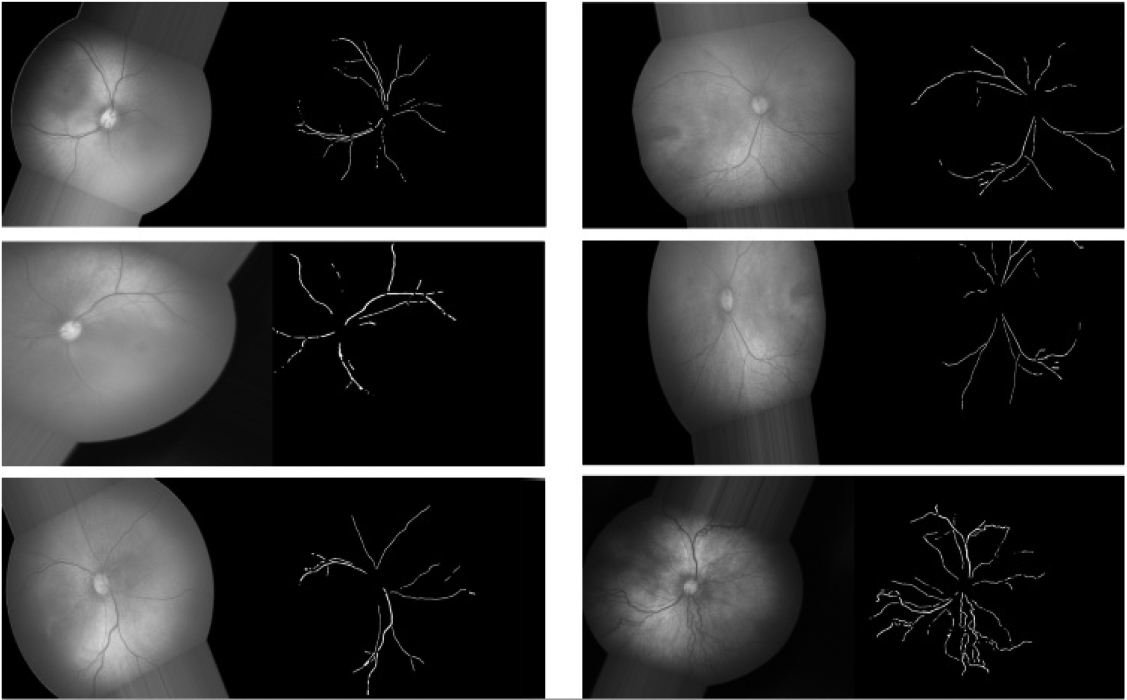
We utilise the ImageDataGenerator class from the Keras deep learning package [6], which generates batches of transformed images in real-time, for augmentation. The ImageDataGenerator class comes with a number of image transformation tools, including zoom, horizontal and vertical flipping, brightness adjustment, shear transformation, width and height shifting, rotation at random angles, and more. This class allows the network to view each batch of augmented data at the beginning of each epoch while training, as compared to generating all augmented data at once. This real-time creation reduces the need for extensive enhanced data storage in the computer system memory. In 20 epochs, we generated a total of 40000 images during the network training phase. Six representative images from the augmented image pool are provided as examples in Fig. 7.
The augmentation procedure is also applied to the image patches that were extracted using the patch-extraction GUI. Since tortuosity in a vessel network only occurs in specific areas of the vessel map, it makes sense that more non-tortuous patches are extracted during the patch extraction process than tortuous patches. The count of tortuous vessel patches is augmented to roughly match that of the non-tortuous patches in order to address the data disparity between the two classes.
In this study, two networks are trained, one for vascular segmentation and the other for patch classification. The U-Net is trained for vessel segmentation task using the raw and augmented images. The network is trained using the loss function based on the Dice coefficient along with the ADAM optimizer [40], which deals with the optimization of stochastic objective functions. The choice to use Dice loss is based on its ability to handle the segmentation of unbalanced classes. It has been demonstrated that only 20% of the total pixels in a retinal image relate to vessels, with the remaining pixels being to the background [17]. As a result, there is a possibility that the learning process might get trapped in local minima of the loss function during network training, which could result in predictions that are heavily skewed in favour of background pixels.
A total of 56000 vessel patches, each sized 55
Evaluation
We compute the Sensitivity (Se), specificity (Sp), precision (Pr), and F-measure (F) values to assess the performance of the proposed system. Additionally, the Cohen’s kappa coefficient (
where
where
Results
The proposed methodology uses a pixel-by-pixel classification technique, in which a CNN is trained with vessel patches of fixed dimensions, yielding an output that shows the likelihood that the centre pixel belongs to one of the two classes, namely tortuous or non-tortuous. As a measure of vessel tortuosity, the total number of tortuous vessel pixels found in each image is determined. Two deep learning CNNs make up the whole framework; one is used to segment vessels, and the other to classify the pixels that make up the vessel map. We created a GUI to extract patches from the images that maintains the centre pixel requirement while doing a systematic sampling inside the field of view with a 40% overlap between each extracted sample patch.
An overview of the results for the proposed method obtained using Narayana Nethralaya data set. The vessel map produced by the segmentation network, namely U-net, is used to determine the results
An overview of the results for the proposed method obtained using Narayana Nethralaya data set. The vessel map produced by the segmentation network, namely U-net, is used to determine the results
We compute the Sp, Se, and F-measure for the test images in the data set in order to evaluate the effectiveness of the proposed approach. For values of the total number of tortuous vessel pixels present in each image, we compute these three metrics. For the maximum F-measure of 0.83, the sensitivity and specificity are reported as 0.90 and 0.84, respectively. The kappa values and MCC are 0.76 and 0.77, respectively. In Table 1, the result obtained for the different performance metrics are recorded. In Fig. 8, we provide the results from three typical images from the NN data set: N40 (healthy), N135 (healthy), and N70 (with Plus disease).
The output results obtained for three sample images from the Narayana Netralaya data set [Top row: N40 (healthy), Middle row: N135 (healthy), and Bottom row: N70 (with Plus disease)]. Normal pixels are shown in green, while diseased (tortuous) vessel pixels are shown in red.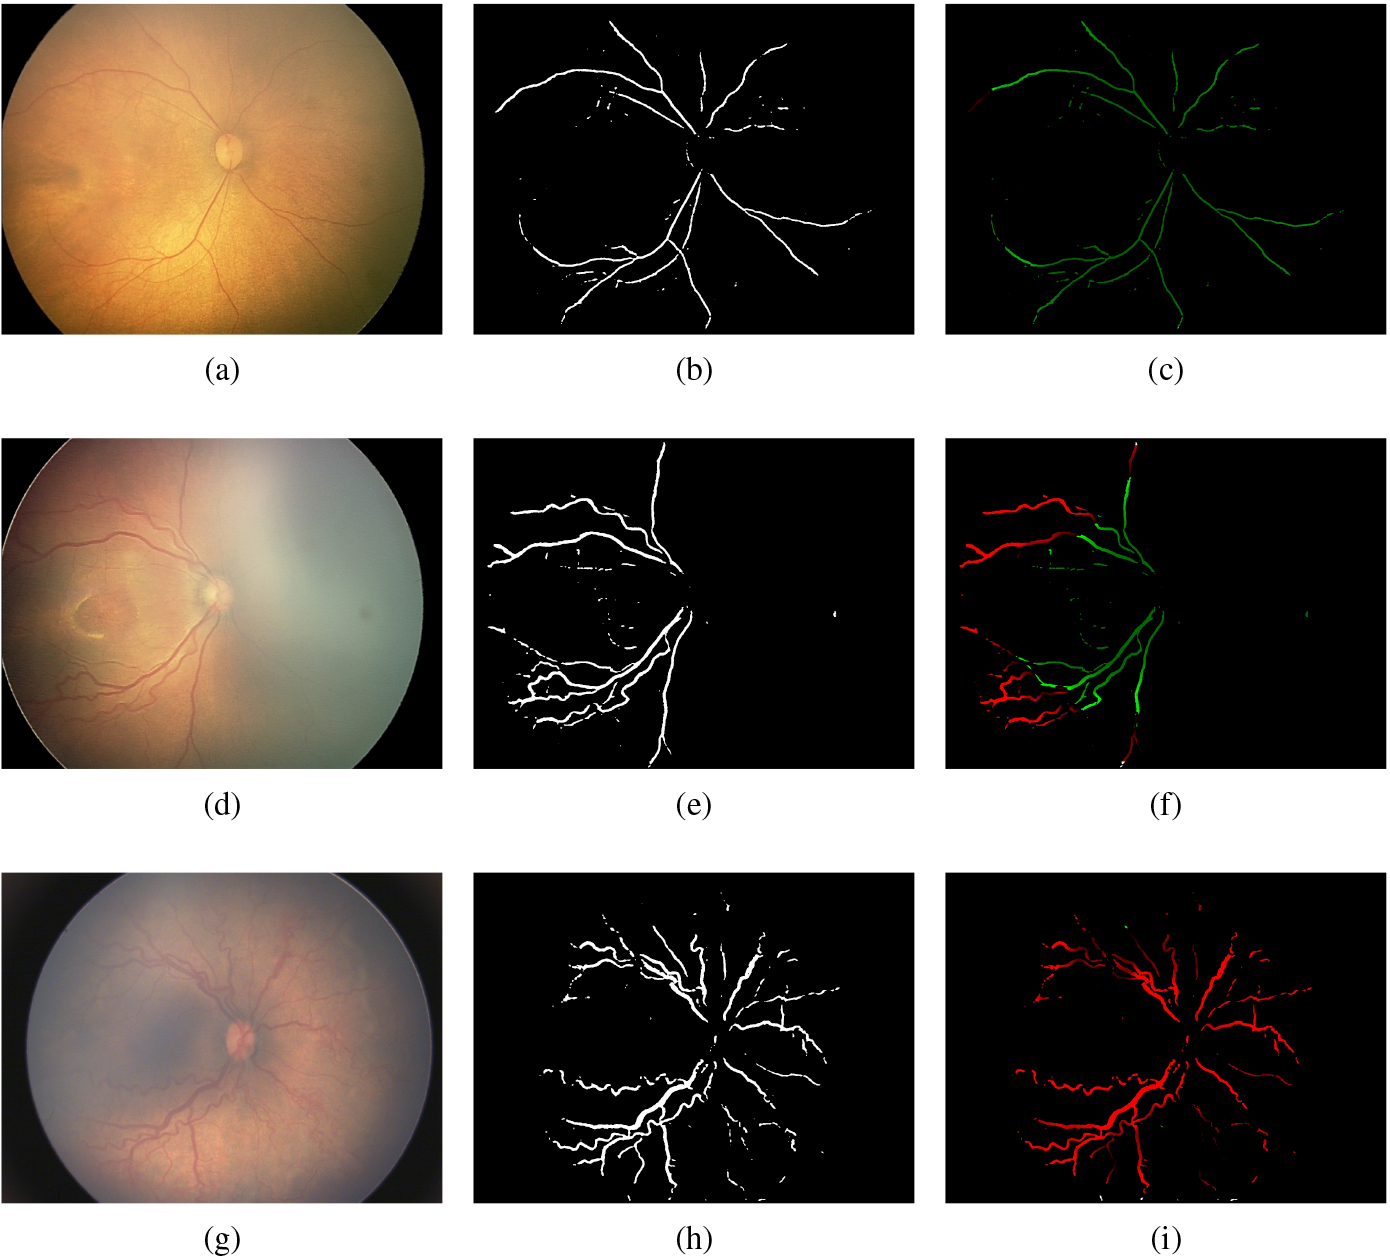
In order to check the overall efficacy of the proposed system we construct the ROC curve. Figure 9 depicts the ROC curve and we achieved an
The performance of the proposed methodology is evaluated using the area under the curve (AUC). The study makes use of 289 infant retinal images from Narayana Netralaya, Bangalore, India.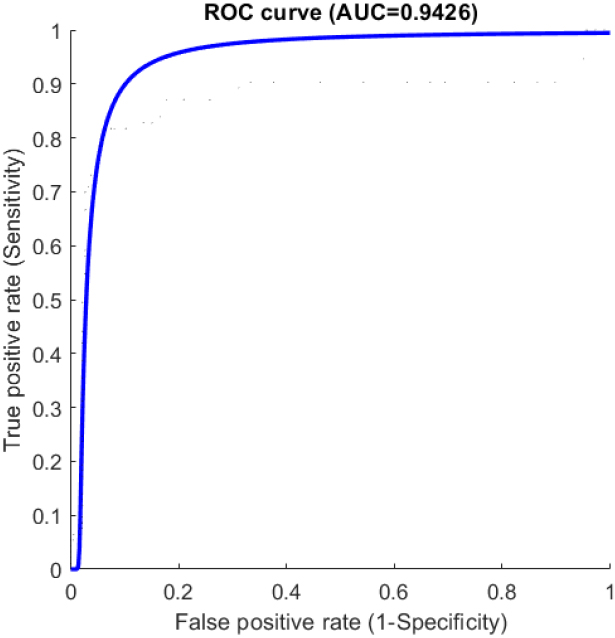
Despite major advances in the automated screening and treatment of ROP disease, the non-availability of standard data sets for testing and validation of developing algorithms is still an unsolved problem in its research field. Most of the works in this area of research use private image data sets for their study. For the validation, we used a proprietary data set obtained from NN Bangalore, India.
For checking the efficacy, we compared the results obtained using the proposed system with similar state-of-art techniques. The comparison is made on research works employing image processing techniques whose output is similar to the proposed technique. The deep learning systems present in the literature for detecting ROP relies on the huge amount of training data and use that knowledge for predicting the disease in a given image. There is no explainability of the predicted output. Our proposed framework mimics a conventional image processing system and the results obtained are explainable as it displays tortuous and non tortuous vessel pixels in a given image. Hence, the comparison is restricted to those techniques, which has a similar output as obtained by the proposed system.
The research works presented in [36] and [39], utilized RISA, a software package for checking tortuosity in Plus diseased images. In both works, tortuosity of retinal arteries and venules are computed separately for diagnosis using RISA, which calculate tortuosity using length to chord (LTC) and sum of angle (SOA) based approaches. The sensitivity and specificity published in [38] is obtained using ROPTool, which is a software package based on LTC measures. The diagnostic approach proposed in [37] is based on tortuosity and average thickness of retinal arteries and veins present in an image. The magnitude and angle responses of Gabor filters are utilized in [24] for disease prediction. Literature contains substantial amount of image processing-based research works for tortuosity analysis in retinal images. In Table 2, we present only those works which express results quantitatively.
Qualitative comparison of the Narayana Nethralaya data set results with similar image processing methods. The data set used in each study is different
Qualitative comparison of the Narayana Nethralaya data set results with similar image processing methods. The data set used in each study is different
In the proposed framework, we tried to implement a clinical procedure that mimicked the conventional image processing-based diagnostic technique. The output obtained shows that the performance of the proposed system is not outstanding, even though we used deep neural networks for implementation. Hence, the proposed technique may be treated as a preliminary research work that can be greatly improved, as discussed in the remaining part of this section.
The observations yield important insights that may be utilised to significantly improve performance while implementing the proposed pipeline. We experimented with vessel patches of dimension 55
The use of structured prediction, as described in [20], is another approach that may be used to enhance the outcome. An increase in prediction accuracy may be expected if the algorithm considers the impact of all the pixels in a tiny square window with certain dimensions centered around the center pixel of the considered vessel patch as opposed to just the center pixel. This is due to the high degree of correlation between nearby pixels in medical images. Thus, the characteristics that reflect the morphology of certain structures are influenced by the spatial relationships between these pixels. Therefore, identifying a group of nearby pixels in addition to the central pixel might be seen as a logical alternative to exploiting more features.
For the purpose of predicting tortuous vessel pixels in the current model, we adopted a very basic architecture. Deep feature extraction and further class prediction of vessel pixels may be done using an improved network architecture for enhancing the output predictions. The explainability of the obtained output results is a key feature of our design when compared to similar state-of-the-art techniques. To the best of our knowledge, no deep learning approach has predicted output with tortuous vessels depicted on the vessel maps in an understandable manner. The techniques published so far predict whether a given image is diseased or not. In our approach, the tortuous vessel pixels in each image are marked, and the knowledge of their count is used for disease prediction.
The main drawback of our approach is the low specificity obtained during prediction. The result of the analysis infers that the number of false positive pixels is the reason for performance degradation. It is understood that fine-tuning the patch size and employing better classification networks will undoubtedly improve the results.
The technique proposed in this research paper is intended for the automated detection of Plus disease, which is significant in ROP diagnosis from a prognosis standpoint. The differing opinions among retinal specialists present a significant difficulty in the diagnosis and subsequent management of this condition that threatens vision. Regarding segmentation accuracy and pixel classification, the result obtained by this approach still require improvement. It makes perfect sense that the proposed design has a lot of opportunity for improvisation. Therefore, in the future, we anticipate that this method could be deployed as an adjunct tool to aid clinicians in the early screening of ROP disease.
Footnotes
Acknowledgments
The author would like to thank the retinal experts at Narayana Nethralaya, Bangalore for providing Plus disease images and its ground truth. A special appreciation goes to Dr. Renu John of IIT Hyderabad for providing the inspiration for this study.
Conflict of interest
The authors declare that they have no conflict of interest.