



Abstract
Credit fraud is a common financial crime that causes significant economic losses to financial institutions. To address this issue, researchers have proposed various fraud detection methods. Recently, research on deep forests has opened up a new path for exploring deep models beyond neural networks. It combines the features of neural networks and ensemble learning, and has achieved good results in various fields. This paper mainly studies the application of deep forests to the field of fraud detection and proposes a distributed dense rotation deep forest algorithm (DRDF-spark) based on the improved RotBoost. The model has three main characteristics: firstly, it solves the problem of multi-granularity scanning due to the lack of spatial correlation in the data by introducing RotBoost. Secondly, Spark is used for parallel construction to improve the processing speed and efficiency of data. Thirdly, a pre-aggregation mechanism is added to the distributed algorithm to locally aggregate the statistical results of sub-forests in the same node in advance to improve communication efficiency. The experiments show that DRDF-spark performs better than deep forests and some mainstream ensemble learning algorithms on the fraud dataset in this paper, and the training speed is up to 3.53 times faster. Furthermore, if the number of nodes is further increased, the speedup ratio will continue to increase.
Introduction
Credit fraud detection is a crucial area in the financial industry, aimed at identifying and preventing individuals attempting to deceive financial institutions. These fraudulent activities include applying for fake loans, credit card fraud, identity theft, and more. Credit fraud detection can help financial institutions detect fraudulent behavior in a timely manner, reducing risks and losses. Traditional methods of credit fraud detection rely mainly on rules or statistical models, which require expert knowledge and have limited model accuracy. With the development of machine learning and deep learning technologies, more and more research is exploring the use of machine learning and deep learning models for credit fraud detection, which can improve the predictive performance of models by learning features from large amounts of data [1].
Inspired by deep neural networks and ensemble learning, Zhou et al. [2] proposed a deep learning model called deep forest or gcForest, which is an ensemble method of forests. Compared to deep neural networks, it does not use complex backpropagation algorithms and avoids the problem of tedious hyperparameter tuning. The introduction of gcForest also opened a new door for the construction of non-differentiable deep models. Currently, deep forest has been widely applied in different fields and has achieved good results. Specifically, deep forest has also been applied in the field of credit fraud detection. In 2019, Huang et al. [3] found a serious customer financial cash-out fraud problem in Ant Financial’s online credit financial company. They collaborated with Zhou’s team to optimize and improve the model for the dataset and implemented it in a distributed manner on the Kunpeng system to address the online cash-out fraud detection in the face of massive data, achieving good results.
Although deep forest performs well in the field of credit fraud detection, it also has some shortcomings. Firstly, when training data with spatial or temporal correlation, deep forest tries to extract the correlation between features as much as possible by multi-granularity scanning layers to increase sample diversity and improve model performance. However, credit fraud data has no temporal or spatial relationship, making it impossible to use multi-granularity scanning layers to increase sample diversity. Additionally, in the context of the big data era, as the amount of data continues to increase, traditional single-machine machine learning algorithms will face problems such as long processing times, limited computing and storage capacity, and low scalability when dealing with large-scale data. Huang’s research is a distributed fraud detection algorithm implemented on the Kunpeng system and is not universal.
In order to maintain the advantages of deep forest in credit fraud classification tasks, we proposed a dense rotation deep forest algorithm based on the improved RotBoost algorithm, called DRDF, to improve classification accuracy and stability and reduce the risk of financial platforms. Additionally, to adapt the DRDF algorithm to the fraud detection scenarios in large data environments, we proposed a DRDF-spark algorithm based on Spark, which solves the problems of limited computing and storage capabilities and poor scalability faced by single-machine algorithms. DRDF-spark reduces the training time cost of the algorithm and makes the proposed algorithm more versatile and applicable to different data scale scenarios. The main contributions of this paper can be summarized as follows:
Since financial transaction data belongs to tabular data and does not have logical relationships in time or space, it is not possible to use multi-scale scanning layers to improve sample diversity. Therefore, this paper uses RotBoost, which is composed of rotation forest and AdaBoost as the base classifier of the model, to make up for the lack of multi-scale scanning structure. The core idea of the rotation forest is to use principal component analysis (PCA) to extract features from the training set of each base classifier, construct diversified classifiers, and maintain accuracy by retaining all principal components. In addition, RotBoost sets weights for samples, allowing different samples to contribute differently to the model during training. Due to the long training time and high single-machine computing resource requirements of DRDF when applied to fraud detection classification tasks in large-scale data scenarios, a parallel deep rotation forest algorithm called DRDF-spark is proposed. First, in the process of constructing rotation matrices, rotation forest requires random class instance sampling, bootstrap sampling, and PCA calculation for each feature subset, which is very suitable for combining with distributed computing. Secondly, in order to find a balance between parallelism and communication overhead, DRDF-spark no longer constructs a unique rotation matrix for each rotation tree, but uses a single sub-forest to make the model more suitable for parallel construction. Finally, to further reduce the network communication transmission consumption during the model’s parallel construction process, a pre-aggregation mechanism is introduced to perform local aggregation of the statistical results of sub-forests in the same node in advance, thereby reducing the network data transmission between nodes. The structural arrangement of this article is as follows. Section 2 introduces related work. Section 3 presents the specific algorithm implementation of DRDF-spark. In Section 4, the performance of the model is validated through experimental results. Finally, Section 5 summarizes the algorithm and proposes suggestions for future research.
Credit fraud detection
Credit fraud detection is an important means to prevent credit risks and is one of the most important applications in the financial industry. In recent years, domestic and foreign researchers have conducted in-depth research on credit fraud detection models through large amounts of data and machine learning technologies, which are widely used in banks, internet finance platforms, and online payment companies, among others.
Supervised learning, unsupervised learning, and association analysis are effective tools to solve credit fraud problems, widely used in data preprocessing, feature extraction, and model training. Supervised learning mainly uses algorithms such as cross-validation, decision tree, random forest, support vector machine, neural network, and Bayesian to model labeled positive and negative samples and predict whether unknown data has fraudulent behavior. Unsupervised learning mainly uses algorithms such as clustering, anomaly detection, and density estimation to discover potential fraudulent behavior through data analysis and model establishment. Association analysis mainly uses graph data structures to discover the relationships between nodes and detect possible group fraudulent behavior [4]. The research on credit fraud detection has a long history, dating back to the late 1990s and early 21st century. In the 1960s, researchers used statistical methods to identify fraudulent behavior. With the development of computer technology, fraud detection began to use computer programs to identify fraudulent behavior. At the same time, the emergence of artificial intelligence technology has also provided more possibilities for fraud detection.
In 2012, Brown et al. [5] compared the performance of several classification algorithms on imbalanced datasets in the field of credit scoring and found that Random Forest performed best in both precision and sensitivity, making it more suitable for detecting credit fraud. In 2018, Roy et al. [6] proposed a classifier model based on multilayer perceptrons and autoencoders, which outperformed traditional algorithms in terms of performance and could effectively detect credit card fraud. In 2019, Monika et al. [7] proposed using heterogeneous ensemble learning methods for two-stage consumer credit risk modeling, which performed better than a single algorithm and could improve the accuracy of credit risk management and evaluation. Feng et al. [8] also verified the performance advantages of ensemble learning over single models and proposed a dynamic weighted ensemble classification model that can effectively improve the prediction accuracy of credit scoring. In 2023, Srivastava et al. [4] proposed a fraud detection method based on graph analysis, which effectively detected fraudulent behavior in distributed graph databases.
In recent years, more and more researchers have been using decision tree-based ensemble algorithms to handle binary classification problems. In 2017, Zhou et al. proposed Deep Forest, a decision tree-based ensemble method that uses a multi-granularity scanning layer to extract logical relationships in time or space from samples using a sliding window mechanism and a cascade layer to enhance feature processing layer by layer. In 2019, Ant Financial and Zhou’s team collaborated to optimize Deep Forest for imbalanced datasets, improving the accuracy of detecting cash-out fraud transactions [9]. In 2021, Huang et al. [10] proposed an improved Deep Forest model for identifying fraudulent online transactions, improving the security of transactions. In 2022, Wang Xiaoxiao et al. studied a credit risk assessment method for P2P online lending borrowers based on Deep Forest, which improved the accuracy and stability of borrower credit evaluation by collecting data and using Deep Forest algorithm for feature extraction and model training.
Deep forest
Deep Forest is a deep non-neural network model that is based on the ideas of random forests and deep learning. It consists of two important parts: the multi-grained scanning layer and the cascade layer. The multi-grained scanning layer is located at the beginning of the model and is used to process datasets with spatial or temporal relationships to improve the model’s performance. The multi-grained scanning layer introduces a sliding window scheme similar to convolutional neural networks, using three different window sizes to slide over the original data with a certain stride to extract features and increase sample diversity. Figure 1a illustrates the process of the multi-grained scanning layer in processing the MNIST dataset with spatial correlation. Suppose the original input consists of 60,000 images, each of which is a 28
The cascade layer is inspired by the layer-by-layer processing of deep neural networks, where each layer of the cascade receives the feature information processed by the previous layer and outputs its processing results to the next level. However, each level of the cascade is an ensemble of decision tree forests, i.e., an ensemble of ensembles. Additionally, the model uses different types of forests to encourage diversity, two random forests and two completely-random tree forests, respectively. Figure 1b illustrates the process of the cascade layer structure. After multi-grained scanning, the generated feature vectors arrive at the entrance of the cascade layer. The feature vectors pass through each layer and produce the estimated class distribution, forming a class probability vector. The class probability vector is concatenated with the original input feature vector as an enhanced feature and becomes the input feature vector for the next layer. With the cascaded layer being trained layer by layer, the model’s learning ability is improved as the number of layers increases. Additionally, to reduce the risk of overfitting, the model evaluates the accuracy of its predictions through k-fold cross-validation after each layer of the cascade layer. If the evaluation criteria meet the pre-set termination condition, the model will terminate the training process early.
The overall procedure of Deep Forest trained using MNIST datasets.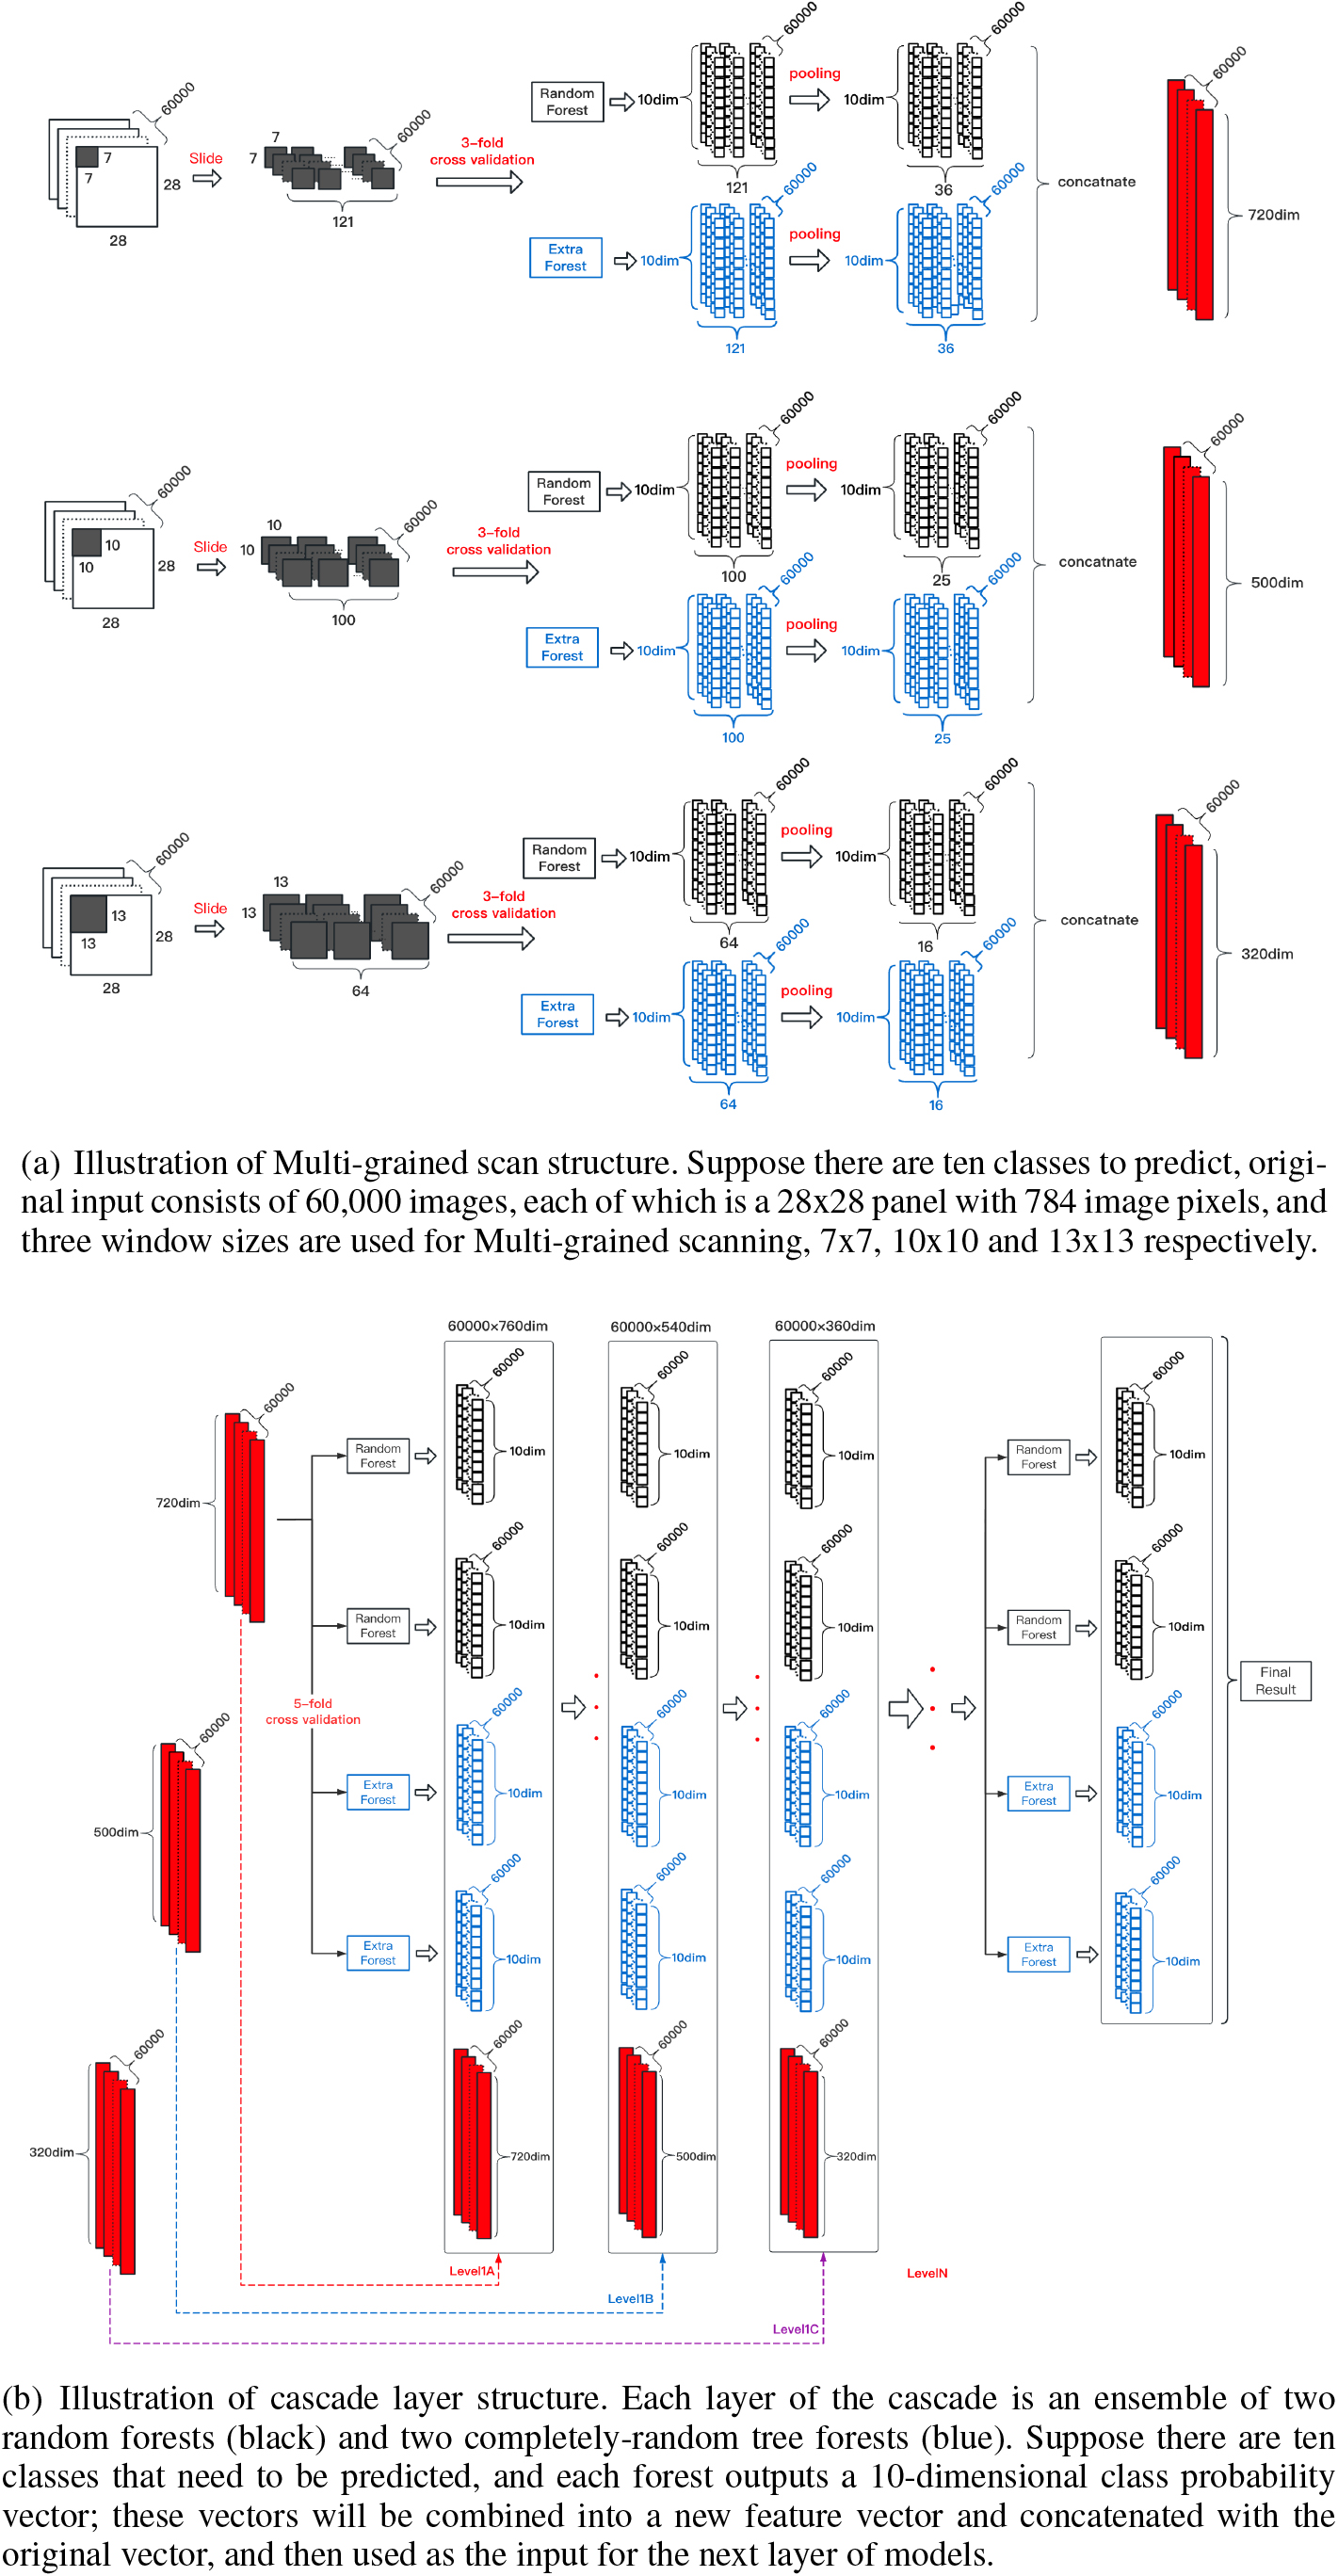
Deep forest has opened a new door for building non-differentiable deep models and provided new ideas for solving classification problems. Compared to deep neural networks, deep forest does not require tuning a large number of hyperparameters, and the model consists of a set of tree-based classifiers, with each tree can be viewed as a series of decision rules. In contrast, the decision process of deep neural networks is more difficult to explain. In addition, deep neural networks require a large amount of training data to avoid overfitting, while deep forest can achieve good classification performance even on small training sets. Currently, deep forest has been widely applied in various fields and has achieved good results. Guo et al. [11] improved deep forest and applied it to cancer subtype classification on small-scale biological datasets. Zhang et al. implemented deep forest in the Kunpeng system and applied it to credit card fraud detection. Gao et al. [12] proposed an improved version of deep forest called IMDF and applied it to imbalanced data. Yang et al. [13] extended deep forest to multi-label learning, and then Wang et al. [14] applied multi-label learning to the medical field and achieved good results. Wang et al. [15] proposed weakly labeled deep forest, which used the transitivity of cascade forest to improve performance layer by layer, achieving excellent results in the field of weak label learning. He et al. [16] proposed the Mondrian deep forest model, which is based on the improvement of deep forest and supports incremental learning. It can gradually learn and update models from data streams and has efficient applications in processing data streams and online learning.
Rotation Forest is an ensemble algorithm that is based on the improvement of Random Forest. This algorithm focuses on improving the accuracy and diversity of base classifiers by utilizing the idea of feature transformation. The experimental results on 33 selected datasets from the UCI Machine Learning Repository showed that Rotation Forest outperforms the standard Random Forest algorithm to a large extent [17]. Assuming a training set
Randomly divide the feature space Use bootstrap sampling to randomly select 75% of the samples from the training set and select the corresponding Use PCA to obtain the eigenvectors
Rearrange the columns of the coefficient matrix Finally, train the classifier
Zhang et al. combined the ideas of rotation forest and another successful strong classifier algorithm AdaBoost, and named the resulting algorithm RotBoost [18]. Similar to AdaBoost, RotBoost focuses on the misclassified samples from the previous iterations and updates the distribution of training data weights during the training process. Based on rotation forest, Giving the reconstructed training set
The coefficient
In the subsequent iterations, the weight distribution of the training set is adjusted by increasing the weights of the instances that were misclassified by previously trained classifiers and decreasing the weights of the correctly classified instances. This way, the subsequently trained classifiers can better predict these harder-to-classify instances. The weight distribution is updated using the following formula, where
The ensemble model can enhance the representational power and generalization performance of individual models. Zhang et al. demonstrated through experiments that RotBoost not only reduces the bias and variance of individual trees, but also generates lower prediction error than Rotation Forest and AdaBoost.
The flowchart of RotBoost-ICA training process. Suppose the input dataset contains N instances with p features. There are T decision trees, and within each decision tree, the rotation matrix 
Single layer structure of cascade layer
Each layer of the cascade in the deep forest model is an ensemble of random forests and completely-random tree forests, which are both ensemble learning algorithms that integrate multiple decision trees. The difference is that completely-random tree forests are more random in the process of building the forest, and exhibit better generalization ability. When training data with spatial or sequential structures, deep forest utilizes a multi-granularity scanning structure to handle the relationships between features and encourage diversity. However, credit fraud datasets lack spatial or temporal structural relationships, which makes the multi-granularity scanning layer inapplicable and thus fails to fully leverage the superior performance of deep forest.
To address the aforementioned issues, DRDF uses RotBoost as a component of the cascade layer to rebuild the training set for each decision tree in the ensemble, which to some extent replaces the diversity of multi-scale scanning structures in enriching the samples and enhances the model’s representation learning ability. Diversity is crucial for model building, and deep forests contribute to diversification by introducing extreme forests into the model. Similarly, in DRDF, RotBoost-ICA is introduced to increase the diversity of the model, and each layer of the cascaded layers is ultimately an ensemble of RotBoost and RotBoost-ICA. In the process of constructing rotation matrices with RotBoost-ICA, ICA is used instead of PCA for feature transformation of data, with the aim of building accurate and diverse classifiers. The introduction of ICA also gives the model greater advantages. First, it can better identify the concentration of data in the dimensional space. Second, it can find a basis that is not necessarily orthogonal, which may better reconstruct the data in the presence of noise than PCA. Figure 2 is the training flowchart of RotBoost-ICA. In order to better illustrate the process, Algorithm 3.1 shows the pseudocode of RotBoost-ICA.
[h]
the class lable for
For
RotBoost integrates the ideas of rotation forest and the strong classifier AdaBoost. In the construction of each decision tree, the rotation forest performs bootstrap sampling on the original dataset and then divides the resulting new training set into several subsets. After performing principal component analysis on each subset, a rotation matrix can be obtained, which is used to linearly transform the original dataset. Because the angles of linear transformations on the training sets of each decision tree are different, the diversity of the model is also ensured. At the same time, this also solves the problem of the inability to apply multi-scale scanning layers. In addition, the AdaBoost algorithm introduces the idea of weights, which updates the weights of the samples so that the previously misclassified samples receive more attention in the later stages. The introduction of weights allows different samples to make different contributions to the model during the training process. However, deep forests have not made good use of this.
The overall structure of DRDF. Suppose there are two classes to predict, and the raw features are 14-dimensional. P.RotBoost (black) represents the original RotBoost algorithm that uses the PCA version, and I.RotBoost (red) represents RotBoost-ICA, which is the improved version that uses ICA.
Figure 3 shows the overall architecture of DRDF. Each layer of DRDF is an ensemble of RotBoost and RotBoost-ICA, and each classifier consists of 50 decision trees. For simplicity, P.RotBoost represents the original RotBoost algorithm and I.RotBoost represents the RotBoost-ICA algorithm. Assuming the original input is N 14-dimensional data samples, if it is a binary classification task, each layer of DRDF will generate N 4-dimensional class vectors. Subsequently, these 4-dimensional class vectors are combined with the input vectors of the previous layer as enhanced features, concatenated into an 18-dimensional feature vector, and used as the input vector of the next layer. With the increase of the number of cascaded layers, the dimension of the feature vector linearly increases until the end of the last layer, where the model training is successful. After passing through the last layer of the model, the test set will obtain N 4-dimensional class vectors. Then, the average distribution probabilities of each forest output are calculated, and the maximum value is taken as the final prediction result. In addition, the output class probability vectors of each layer in the cascaded layers are obtained through 5-fold cross-validation, and the model will evaluate the predictive performance. If the performance does not improve after three consecutive layers, the training process will be terminated early. Therefore, the complexity of the model can be adaptively determined. The algorithm pseudo-code for this process is shown in Algorithm 3.2.
1. Load the initial training data sets
1. Load the initial test data sets
However, in the context of the big data era, traditional single-machine machine learning algorithms face problems such as long processing time, limited computing and storage capabilities, and low scalability when dealing with large-scale data due to the continuous increase in data volume. Therefore, distributed computing has become an important means of processing large-scale data. Spark, as a popular distributed computing framework, has the advantages of high performance, high scalability, and strong fault tolerance, and has been widely used in the fields of big data processing and machine learning. In this context, in order to make DRDF more universal, this chapter proposes a distributed deep rotation forest algorithm based on Spark, DRDF-spark, and applies it to the fraud detection scenario, aiming to improve the speed and efficiency of data processing.
Based on the compatibility between the construction process of rotation forest and distributed computing, a distributed deep rotation forest algorithm based on Spark is proposed, and a pre-aggregation mechanism is added to perform local aggregation of the statistical results of sub-forests in the same node in advance, thereby reducing network data transmission between nodes and improving communication efficiency. In the improved cascading layer structure, since each rotation forest base classifier needs to perform multiple PCA calculations to obtain the rotation matrix, and then rotate the training and test sets through the rotation matrix, such operations bring diversity to the model while increasing the runtime.
Based on the above observations, this section designs a parallel deep rotation forest model, which makes good use of some characteristics of rotation forest in the construction process to improve the efficiency of model parallel computing. As can be seen from Section 2.3, in the process of constructing the rotation matrix, each feature subset of the rotation forest needs to perform operations such as random class instance extraction, bootstrap sampling, and PCA calculation. This construction process is very compatible with the combination of distributed computing. Figure 4 shows the algorithm flow of parallel construction of rotation matrix in the deep rotation forest model.
At the entrance of the model, there is a training set
The Flowchart of parallel construction rotation matrix algorithm. Suppose the input dataset contains N instances with p features, and randomly divide the feature space 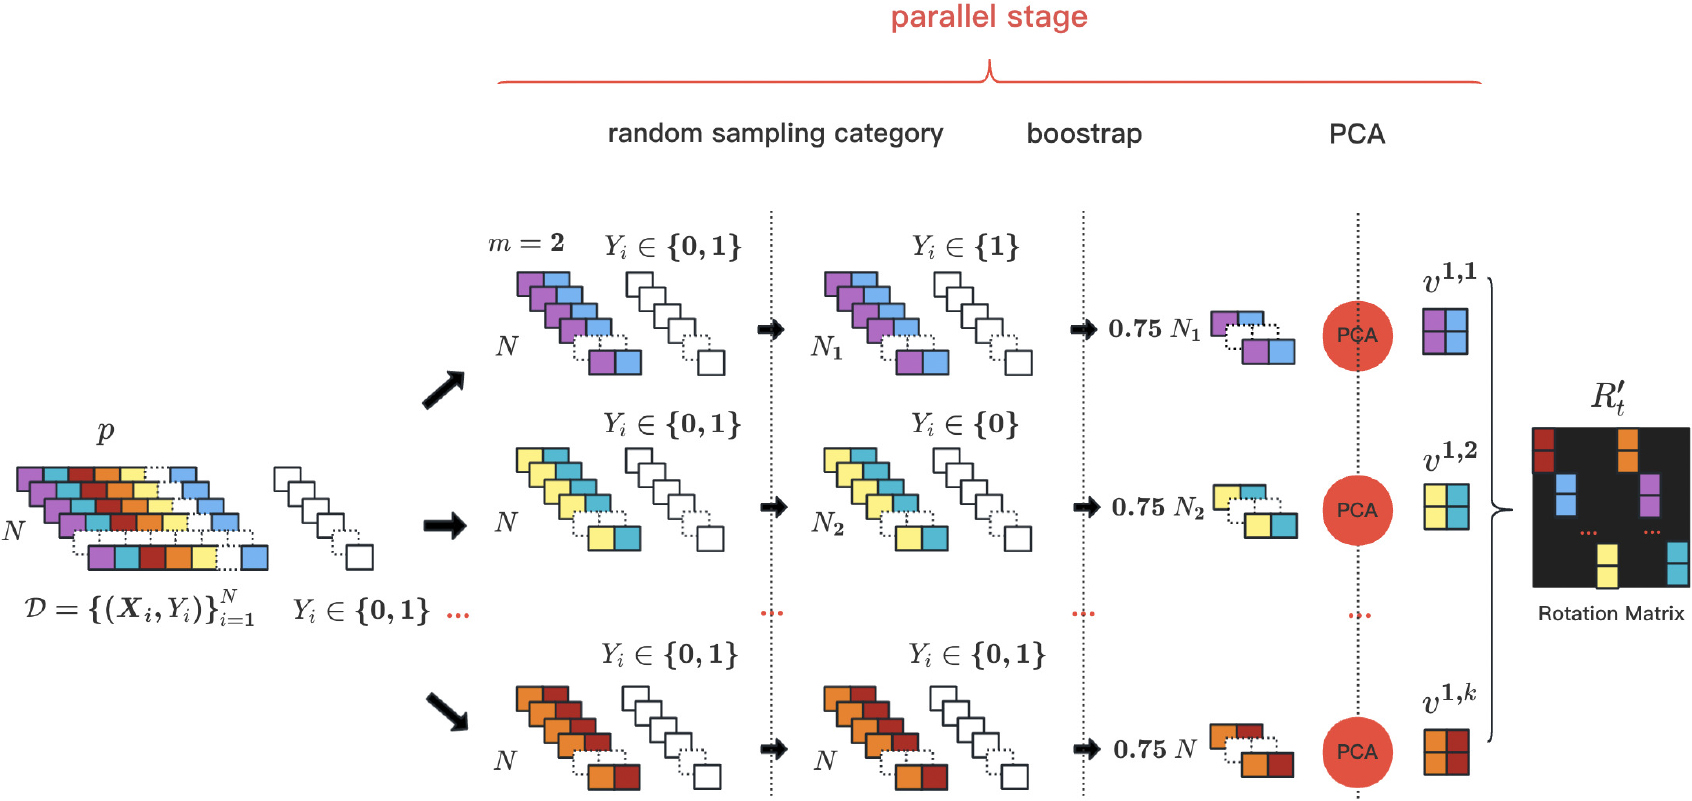
According to Fig. 4, multiple rotation matrices need to be constructed within each rotation forest. The rotation forest can be seen as a collection of rotation trees, each of which requires a unique rotation matrix. Therefore, each tree in the forest represents a parallel task. When the number of rotation trees in the rotation forest is
To address the aforementioned issues, DRDF-spark no longer builds a unique rotation matrix for each rotation tree, but instead uses a single sub-forest. As shown in Fig. 5, the process of parallel training of rotation forests involves dividing each rotation forest into S sub-forests, and constructing a rotation matrix for each sub-forest of the model. Multiple decision trees within a sub-forest share the same rotation matrix because decision trees in a random forest randomly select a subset of samples with replacement. Therefore, sharing rotation matrices does not affect the results. At this point, the parallelism of the cascade layer is no longer
Assuming that each level of the cascade layer contains 4 rotation forests, each consisting of 100 decision trees, the parallelism of the cascade layer before improvement is 400. As mentioned above, higher parallelism is not always better, and sometimes it can have a negative effect. In the Spark framework, if there are many tasks, more resources can be utilized, and higher parallelism is better. However, if the number of tasks is too high and machine resources are insufficient, the machine will execute tasks in batches and only proceed to the next batch after completing the previous one, resulting in a decrease in parallel efficiency due to the time required to start and stop tasks. After improvement, the introduction of parameter
Algorithm 4 presents the pseudocode for the distributed algorithm of the cascade layer, which shows the workflow of the l-th level of the cascade layer. The input of Algorithm 4 is the training set
[h]
Randomly split the feature space
The Flowchart of parallel construction rotation forest algorithm. Suppose there are S sub-forests, where 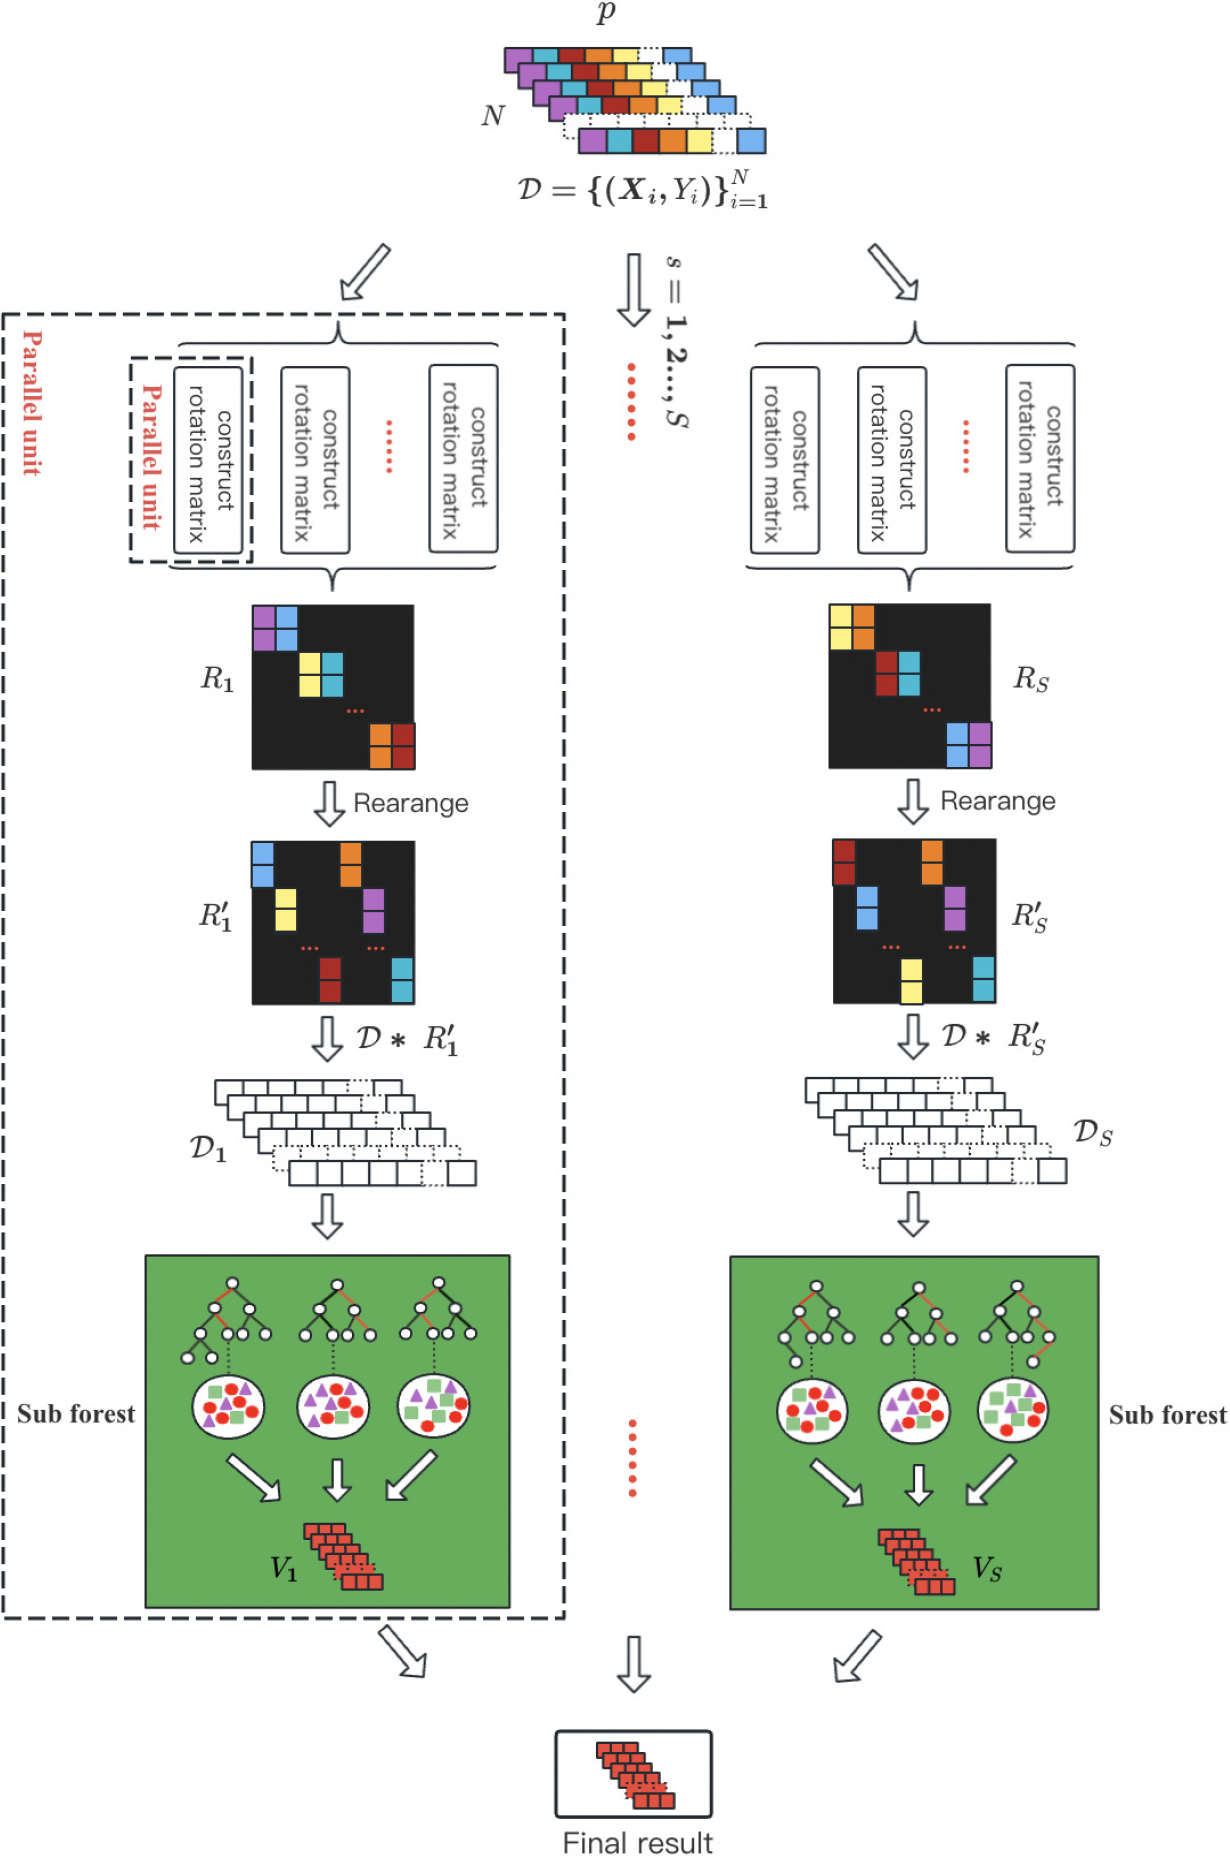
The estimated class distribution of the s-th subforest in the f-th rotation forest in the cascaded layer is denoted as
Where
When constructing the forest in a single-machine environment, the probability vectors of all decision trees are aggregated in memory to obtain the final result. However, in a distributed environment, the forest is divided into multiple sub-forests that are distributed on different nodes of the cluster. After computing the class vectors of all sub-forests, each node directly sends its results to the host for intermediate result merging. When the intermediate result data is large, network communication may become a performance bottleneck [22]. To address this potential bottleneck, this section introduces a pre-aggregation mechanism to further improve the network communication efficiency of the distributed deep rotation forest. Although a balance has been found between parallelism and communication costs in the design of parallelism, to further reduce network communication costs, this mechanism mainly performs local aggregation of the statistical results of sub-forests on the same node before aggregating all results in a sub-forest. This reduces the network data transmission between nodes.
The parallel computing pre-aggregation process flowchart.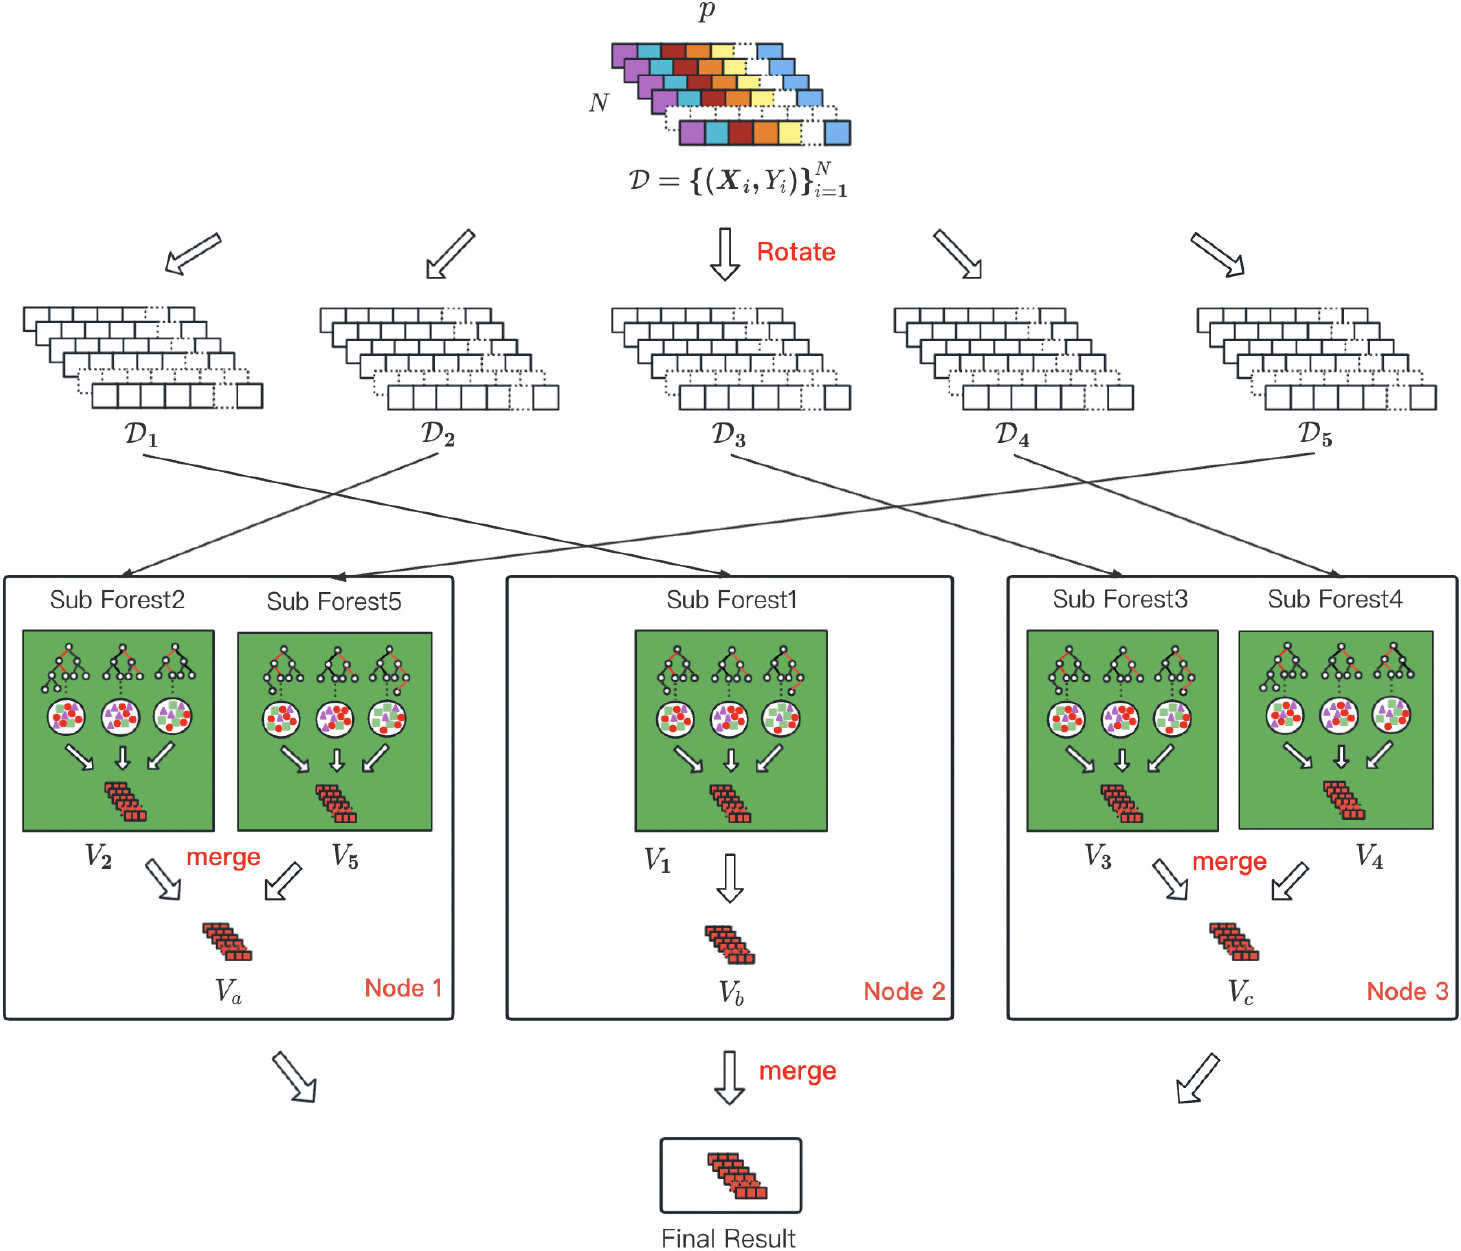
Figure 6 shows the flow chart of the forest with the pre-aggregation mechanism added during the parallel process. In the cascade layer, assuming that the rotation forest is divided into five sub-forests after being rotated five times, i.e., the dataset
The experiments of DRDF
The experiment uses two datasets, Credit Approval and Lending Club, to evaluate the performance of DRDF. Lending Club is an online lending platform based in the United States that provides unsecured personal loans between $1,000 and $40,000 to borrowers. The platform evaluates applicants based on their personal information, personal credit situation, loan amount, loan purpose, and other factors before deciding whether to approve the loan. The loan approval decision involves two types of risks. Firstly, if an applicant is likely to repay the loan but the loan is not approved, the company may lose business and suffer financial losses. Secondly, if an applicant engages in credit fraud and is unlikely to repay the loan, approving the loan could result in the applicant defaulting and lead to financial losses for the company. The Credit Approval dataset belongs to relevant data for credit card applications. Due to the high confidentiality and privacy of bank data, all feature names and values have been changed to meaningless symbols to protect the security of the data. The processed data contains 690 samples and 15 features. The Lending Club dataset is loan data from Lending Club from 2016 to 2017, containing information about past loan applicants and whether or not they have defaulted. Its purpose is to determine whether the applicant has the risk of default, which can be used as a reference for staff to reject loans, reduce loan amounts, or loan to risky applicants at higher interest rates. The loan data contains over 20 million records, including both approved and rejected applications. Only the approved application data is used in the experiment, with a total of 759,338 records and 72 features.
The performance of DRDF was validated on the preprocessed Lending Club and Credit Approval datasets, and compared with deep forest and some mainstream machine learning algorithms. The DF21 algorithm is a deep forest open-source library introduced by the Zhou Zhihua team in February 2021, which optimized and encapsulated gcForest. In addition, for ease of expression, random forest is abbreviated as RF. The experiment was run on a Windows 10 operating system using PyCharm Professional version 2022.3, with an Intel Core i7-8700 processor, 6 cores, and 16GB of RAM.
The experiment compared the results of DRDF and common machine learning algorithms, evaluating the model’s performance using evaluation metrics such as accuracy, precision, recall,
ROC Curve (receiver operating characteristic curve): a curve that plots the TPR (true positive rate) against the FPR (false positive rate) by continuously adjusting the classifier’s classification threshold, to evaluate the classification performance of a model. TPR is the recall rate, and FPR represents the proportion of negative samples that are misclassified. The closer the curve is to the upper left corner, the better the performance of the model. AUC (Area Under Curve): usually refers to the area below the ROC curve in a two-dimensional coordinate system where TPR is on the y-axis and FPR is on the x-axis, used to evaluate the classification performance of a model. The AUC value ranges from 0 to 1, where a value closer to 1 indicates better model performance. It also represents the probability that a randomly chosen positive sample will be ranked higher than a randomly chosen negative sample.
In the experiment, the original dataset was split into a training set (70% of the data) for model training and a testing set (30% of the data) for evaluating the model’s classification performance. Since the original dataset was imbalanced with a large difference in the number of normal and default samples, the experiment chose default samples as positive samples. Due to the small sample size of the Credit Approval dataset and the strong randomness of the results obtained in a single run, the experiment took the average of 20 runs as the final result.
The experiment compared MLP, SVM, Logistic, RF, RotBoost, gcForest, DF21, and the proposed DRDF algorithm on the original dataset using five metrics: accuracy, precision, recall,
The performance of each algorithm on the Credit Approval dataset (%)
The performance of each algorithm on the Lengding Club dataset (%)
Tables 1 and 2 show the test results of the five metrics for each algorithm on the two datasets. The best-performing algorithm in each dataset is highlighted in bold, and it can be seen that DRDF is competitive compared to other algorithms. In terms of accuracy, DRDF outperformed the original gcForest algorithm by 2.1% on the Credit Approval dataset and performed the best. Although DRDF’s accuracy on the Lending Club dataset was not significantly different from that of other algorithms, other metrics such as
Figure 7 shows the comparison of
Comparison of 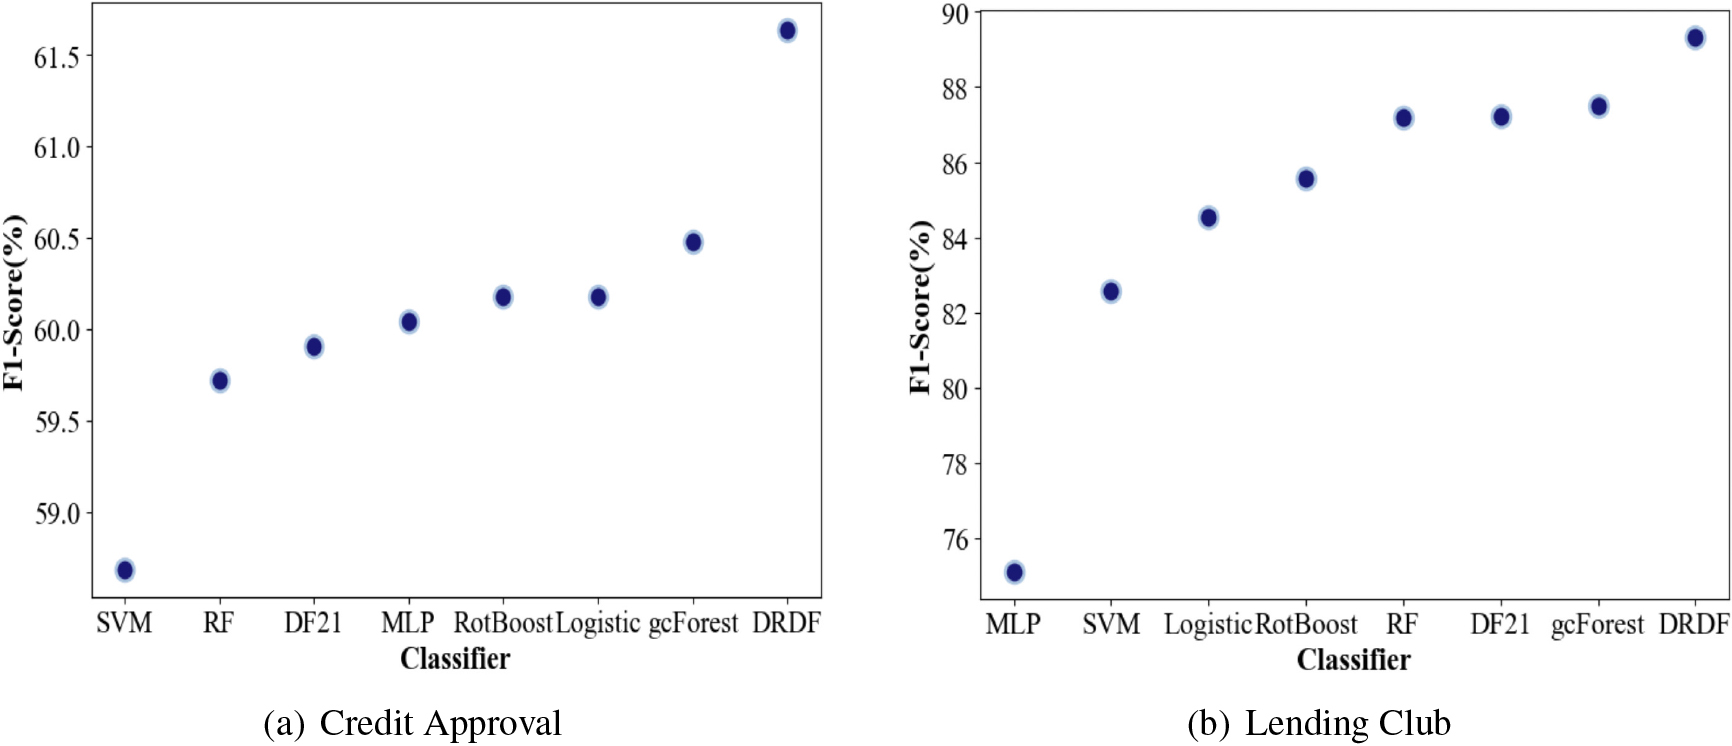
Comparison of gcForest, DF21 and DRDF in three indicator dimensions.
In addition, according to business experience, the ROC curve is always the best choice for providing visual comparison, and decisions are always based on this metric, especially in the application field of imbalanced data. Therefore, improving this metric has a greater benefit for the model. The ROC curve shows the relationship between recall rate and FPR for each possible cutoff point. Generally, compared with curves with smaller coverage areas, curves with larger coverage areas are always considered better. Figure 9 shows the comparison of ROC curves and AUC values of various classifiers on the Lending Club dataset. In the ROC curve, the closer the curve is to the upper left corner, the better the performance. As shown in Figure 9, under the same FPR, the TPR of the DRDF classifier is higher than that of other classifiers. The corresponding AUC value shows that the DRDF method is 2.4% higher than the gcForest classifier and 9% higher than the lowest SVM, indicating that the DRDF algorithm has better performance than other classifiers on this dataset.
Comparison of ROC curve and AUC value of each classifier on the Lending club dataset.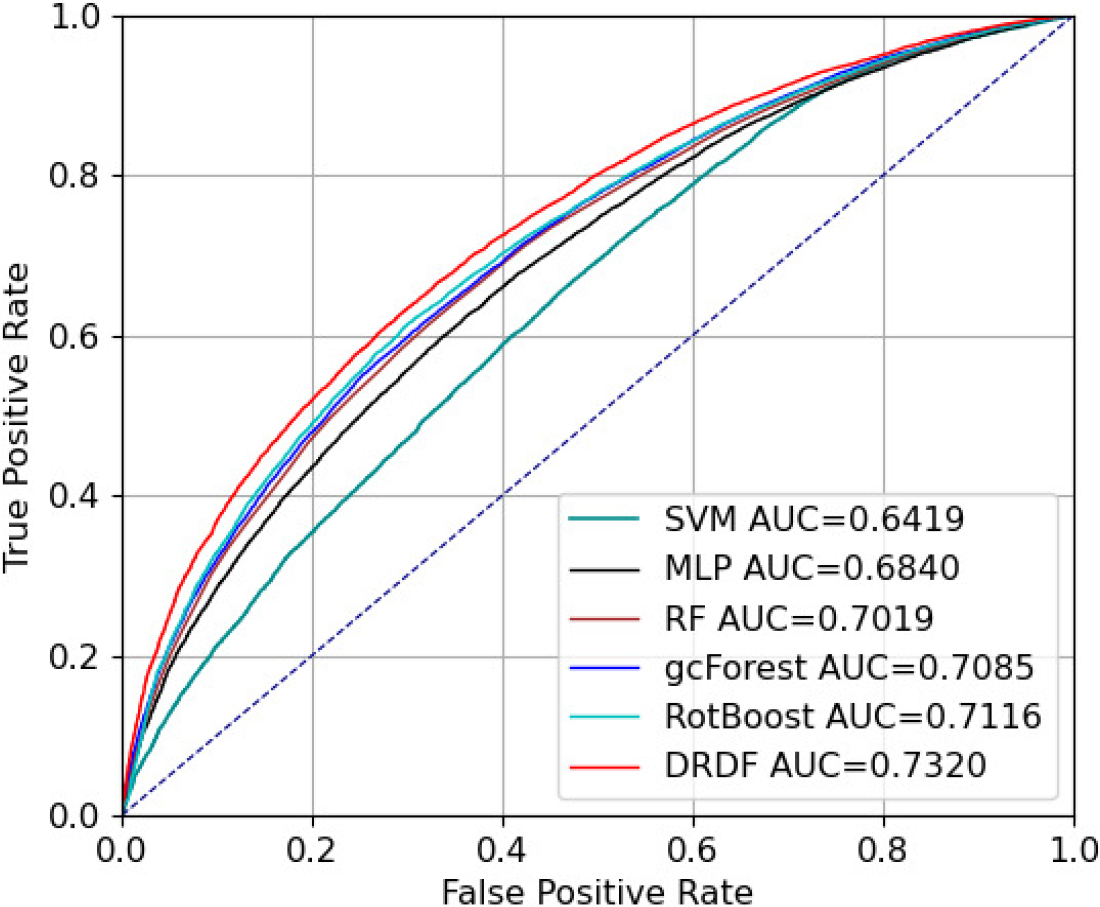
To verify the performance of DRDF-spark, experiments evaluated the feasibility of the algorithm using evaluation metrics such as speedup ratio and scalability ratio. In the cluster environment of this experiment, Hadoop Distributed File System (HDFS) was used for file storage, Spark was used as the distributed computing component, and Hadoop Resource Manager (Yarn) was responsible for resource scheduling and management. The cluster was built using six nodes, with one node serving as the master node responsible for metadata management, cluster resource allocation, and task scheduling, and all other nodes serving as worker nodes responsible for data storage and task computation. All nodes were configured with Intel Xeon Cascade Lake 8255C, four-core CPUs, and 32 GB of memory.
The distributed experiments continued to use the Lending Club dataset from the DRDF experiment. Since the Credit Approval dataset is small in scale and not suitable for big data experiment environments, it was not used as experimental data in this section. In addition, to better verify the performance of distributed algorithms in different data environments, the Creditcard Transaction v2 dataset and the Lending Club All dataset were added. The Creditcard Transaction v2 dataset has a sample size of over ten million and a file size of 6.6 GB. This dataset contains over 20 million transactions generated by a multi-agent virtual world simulation executed by IBM, covering 2,000 consumers who reside in the United States but travel worldwide. The data also covers decades of purchase records, including multiple cards for many consumers. Data analysis shows that it matches real data reasonably well in many aspects, such as fraud rate, purchase amount, merchant category codes, and other indicators. Additionally, Lending Club All contains all lending data from 2007 to 2018, with over one million preprocessed records, making it suitable for big data experiments. The scale of the three datasets is shown in Table 3, with sample sizes ranging from tens of thousands to tens of millions and feature numbers ranging from low to high dimensions. The experiments will evaluate the parallel performance on three datasets of different scales and the evaluation metrics are detailed as follows:
Introduction of dataset size
Introduction of dataset size
(1) Speedup ratio
Speedup ratio is one of the performance metrics that can evaluate the overall improvement of parallel algorithms in horizontal scalability, which is widely used to evaluate distributed algorithms in big data environments. Specifically, the speedup ratio refers to the ratio of the time consumed by running the same task in a parallel processing environment to that in a serial processing environment. It is usually represented using the calculation Eq. (7).
The variable
(2) Scalability
This metric, also known as cluster efficiency, is obtained by dividing the speedup ratio by the current number of nodes and belongs to one of the scalability metrics of Spark. The calculation formula is shown in Eq. (9).
Where
During the construction of the original Rotation Forest, the bootstrap sampling technique was used to randomly select 75% of the samples from the training set in order to avoid obtaining the same principal components repeatedly and to maximize sample diversity. However, in distributed deep Rotation Forest, there are multiple layers of parallel computing logic, and a 75% sampling ratio will lead to significant memory usage problems. In fact, this sampling ratio can be lower because distributed deep Rotation Forest is applied in scenarios with massive amounts of data, and even lower sampling ratios can contain sufficient information. However, a lower sampling ratio will lead to reduced memory usage and an increased training speed for the cascade layers.
As shown in Fig. 10, experiments were conducted on the Lending Club dataset using different bootstrap ratios to evaluate whether the size of the bootstrap ratio affects the accuracy, with 5 parameter samples selected for the sampling ratio ranging from 10% to 75%. The box plot in Fig. 10 indicates that the size of the bootstrap ratio has no significant effect on the accuracy of the rotation forest, except for a slight decrease in accuracy when the sampling ratio drops to 10%, in the big data environment. Therefore, for big data environments, faster training time and lower memory usage can be achieved by using a smaller sampling ratio, such as 25%.
Experimental results graph showing the impact of bootstrap sample rate on accuracy.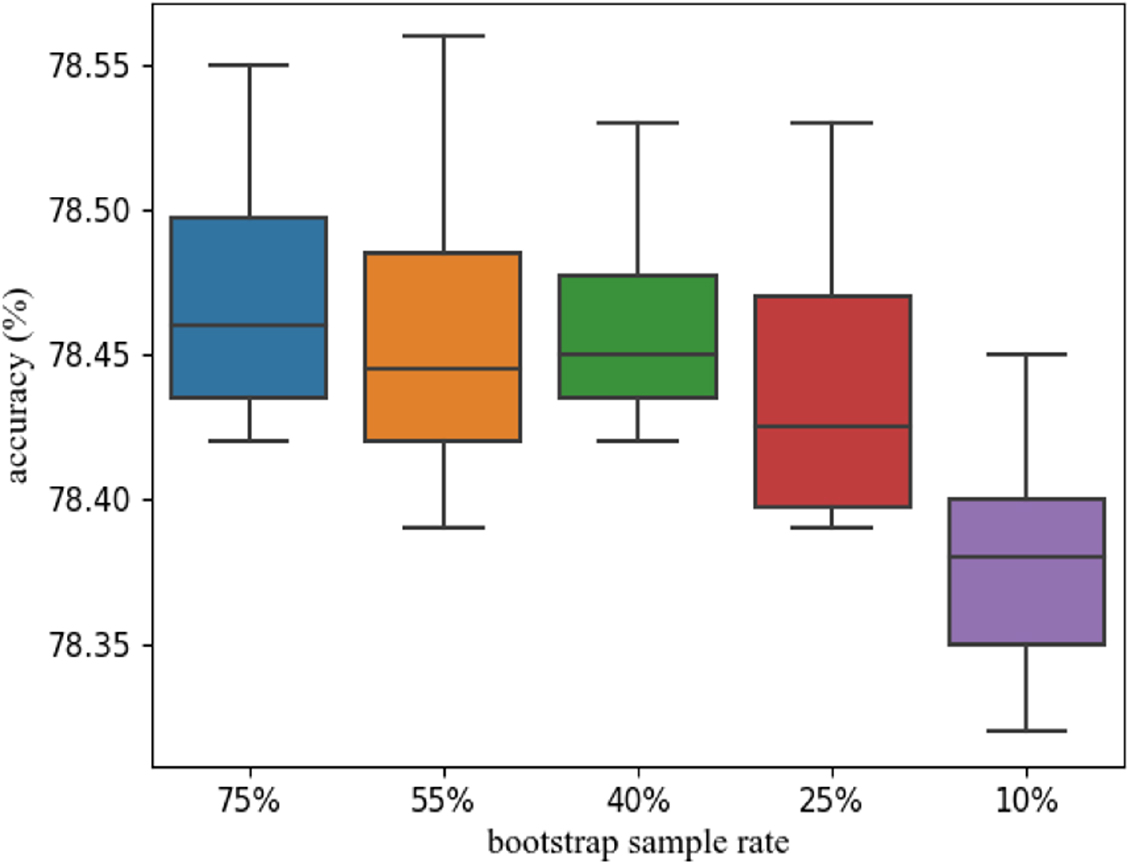
As the absolute speedup requires recording the running time of the algorithm in serial processing, i.e., the running time of the single-machine version of the algorithm, a series of performance benchmarks were first conducted on the DRDF single-machine version algorithm. The running time and classification accuracy of DRDF are shown in Table 4. For datasets with small amounts of data, the running time is measured in seconds, while for datasets with millions or tens of millions of records, the running time is measured in minutes due to the long running time of the algorithm. However, during the benchmark experiment, the newly added Creditcard Transaction v2 dataset had too many samples, and the original file size occupied 6.6 GB of space, resulting in insufficient memory during the execution on a single machine with 16 G of RAM. Therefore, the running time and classification accuracy of the DRDF algorithm on this dataset could not be obtained, and it is indicated by a dash in Table 4. In the subsequent calculation of the speedup ratio, special treatment will be applied to this dataset, and the running time on the minimum runnable node will be used to replace
DRDF algorithm stand-alone version performance
DRDF algorithm stand-alone version performance
Based on the benchmark experiment results, Table 5 shows the performance indicators of DRDF, including runtime and speedup ratio, on three different scaled datasets tested in a cluster environment consisting of six nodes. It can be observed from the table that, in the limited cluster configuration environment, the performance of DRDF-spark is significantly better than DRDF. Under the condition of ensuring the accuracy indicator remains unchanged, the training speed is increased up to 3.53 times faster, and if the number of nodes continues to increase, the speedup ratio will continue to improve.
Regarding the results of the Creditcard Transaction v2 dataset in Table 5, a special explanation is required. Because this dataset encountered an out-of-memory issue during the single-machine benchmark experiment and cannot obtain the
It can be clearly seen from Table 5 that as the number of nodes increases, the running time decreases continuously, and the corresponding speedup ratio also increases. Figure 11 shows the change of the speedup ratio more intuitively. In the Lending Club data set, before the fourth node is added, the speedup ratio increases significantly. After the fourth node is added, the speedup ratio increases relatively slowly, indicating that the benefits obtained by adding cluster nodes at this time are increasing. keeps decreasing. This is also very reasonable, because the amount of data in the Lending Club dataset is not huge, and the degree of parallelism is close to the upper limit at this time. On the contrary, increasing the number of nodes will also increase the cost of network communication, thereby increasing the running time of the program. In addition, because the Lending Club All data set has slightly increased the data size, the overall performance of the speedup ratio index is better than that of the Lending Club data set, and there is still a slight upward trend after the sixth node, but not obvious. Subsequently, this problem was also verified on the Creditcard Transaction v2 dataset with a huge amount of data. Since the Creditcard Transaction v2 dataset is huge, it can be seen that when the number of nodes increases to the sixth, the speedup ratio still increases significantly. If you continue to increase the number of nodes, you can still get higher returns.
The performance of DRDF-spark on each dataset
The Performance of DRDF-spark on each dataset
The schematic diagram of DRDF-spark speedup ratio.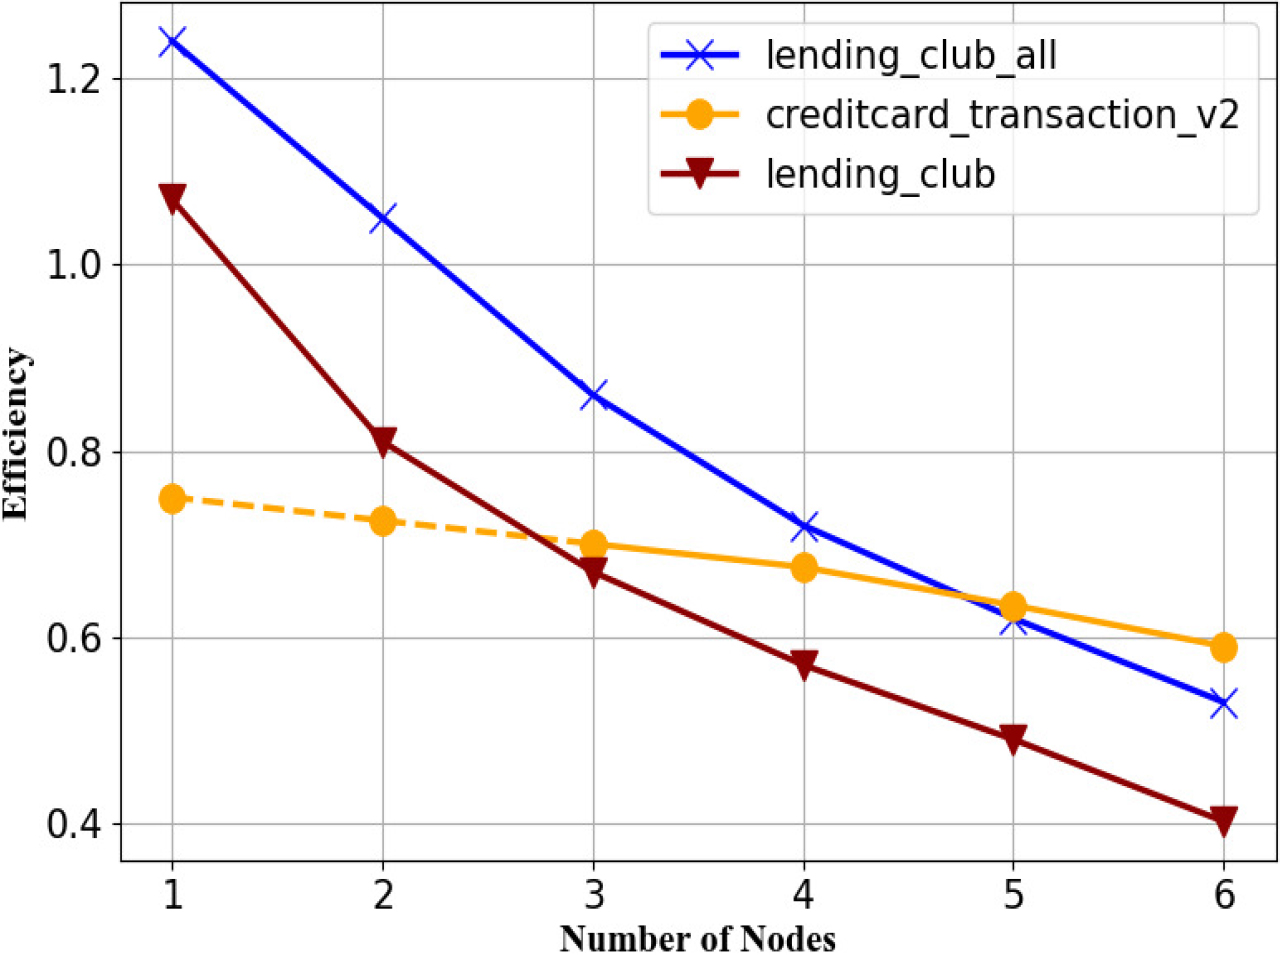
The schematic diagram of DRDF-spark scalability ratio.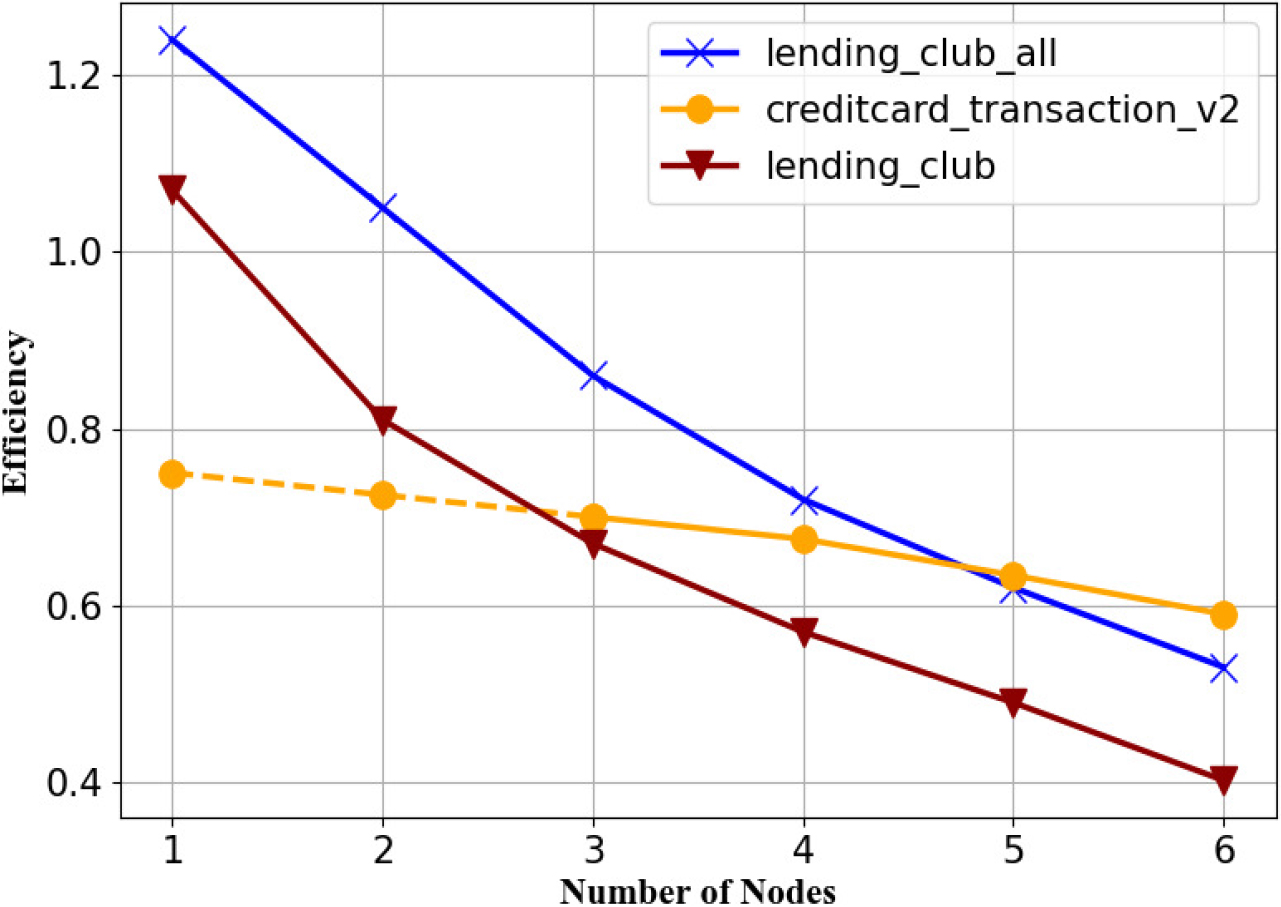
To evaluate the performance of the DRDF-Spark algorithm from different perspectives, the experiment continues to assess the scalability of DRDF-Spark, and the detailed data and visualization of the scalability ratio for the three datasets are shown in Table 6 and Fig. 12, respectively. As the Creditcard Transaction v2 dataset has no acceleration ratio data at node numbers 1 and 2, there are no scalability index data, represented by a horizontal line in the table. The algorithm’s scalability ratio of DRDF-Spark decreases with an increase in the cluster’s computational nodes, as shown in Fig. 12, and with a greater number of computation nodes, the scalability tends to be more moderate. According to the distributed index, when the scalability is better, it results in a slower decline trend of the Efficiency value. It can be observed from Fig. 12 that the scalability ratio of the Creditcard Transaction v2 dataset with a massive amount of data decreases very slowly as the number of nodes increases, while the Lending Club dataset has the fastest declining trend, and the Lending Club All dataset is next. This suggests that when the DRDF-Spark algorithm deals with larger data sizes, its scalability improves to a certain extent.
Conclusion
Credit fraud detection is an important means to prevent credit risks and is also one of the most important applications in the financial field. In recent years, with the continuous development of financial technology and internet technology, domestic and foreign researchers have conducted in-depth research on credit fraud detection models through large amounts of data and machine learning techniques, which have been widely applied in banks, internet finance platforms, online payment companies, etc., and achieved good results.
This paper mainly studies the application of deep forest in the field of fraud detection. It proposes a dense deep rotation forest algorithm (DRDF) based on the improved RotBoost, which utilizes the advantages of deep forest and the characteristics of application scenarios, aiming to improve the accuracy and stability of classification and reduce the risk of financial platforms.
Firstly, gcForest has a similar problem to deep neural network models when dealing with data without spatial or temporal correlations, which is the inability to use multi-scale scanning layers to improve the diversity of samples through sliding window mechanisms. Therefore, this paper introduces the improved RotBoost algorithm into the cascade layer, which not only constructs diversified classifiers but also endows the model with the idea of weight, thereby enhancing the representation learning ability of the model. Experimental results demonstrate that the proposed DRDF has better predictive classification performance than other deep forest models and some mainstream ensemble algorithms. However, in the era of big data, single-machine algorithms will face problems such as limited computing and storage capabilities and poor scalability. Based on the compatibility of the construction process of the rotation forest with distributed computing, a distributed parallel DRDF algorithm based on Spark is proposed to adapt to the credit fraud detection scenario under the background of massive data. Experimental results verify that the training speed of DRDF-Spark is up to 3.53 times faster, and the acceleration ratio will continue to increase if the number of nodes is further increased.
However, in the parallel process of the DRDF-spark algorithm, there are three parallel operations that require a large amount of memory space. The maximum dataset used in the experiment is 6.6 GB, and if the data volume continues to increase to the TB level, it may face memory computing bottlenecks. Even with the addition of pre-aggregation mechanisms, it seems that such problems cannot be solved. Therefore, memory optimization will be a research direction in the future. In addition, in the research on the setting of parallelism, although the method of multiple forests sharing a rotation matrix balances the model between parallelism and communication overhead in the process of implementing distributed deep rotation forests, the segmentation granularity, that is, the setting of parallelism, still needs to be manually set. Considering that grid search takes a long time, it is hoped that a linear adaptive algorithm can be found to find the best segmentation granularity, which requires further research.