
Abstract
Empirical evidence has shown that forecast combination can improve the prediction accuracy of tourism demand forecasting. This paper aimed to develop a more accurate grey forecast combination method (GFCM) with multivariate grey prediction models In light of the practical applicability of grey prediction, which is not required to apply any statistical test to examine data series this research features the use of multivariate grey models through the genetic algorithm to synthesize forecasts from univariate grey prediction models commonly used in tourism forecasting into composite forecasts Empirical results showed that the proposed GFCM significantly outperformed the other combination methods considered. The results also suggested that the risk of forecast failures caused by selecting an inappropriate single model for tourism demand forecasting can be reduced by using the GFCM.
Introduction
With the growth of the tourism industry worldwide, forecasting tourism demand has received increasing attention from the industry because it is important for the private sector to formulate apt pricing and revenue management strategies [1]. Tourism demand forecasting can help authorities with investments in tourism infrastructure such as airports and highways. The tourism policies formulated by the relevant authorities significantly influence the intention of investment by the private sector [2]. Therefore, accurate forecasts of tourism demand are of great importance to both tourism policymakers and industry practitioners [1,3].
Due to the importance of tourism demand forecasting, there is an extensive range of forecasting methods available in the field of tourism. Time-series models, causal econometric approaches, and artificial intelligence-based methods prevail in tourism forecasting [2,4]. Related studies include vector autoregressive models [5,6] regression analysis [30], autoregressive integrated moving average models (ARIMA) [7,8,9], autoregressive models [10,11], support vector regression (SVR) [12], and neural networks (NNs) [13,14,15]. Time-series models and econometric approaches require the available data to follow specific statistical properties such as stationarity, to obtain reasonable performance [16,17]. Nevertheless, the requirement for statistical properties in statistics and economics is unrealistic with respect to the real world [18,19].
It is acknowledged that no single forecasting model has been found to be superior to all others in all situations [3,4,20]. Even though forecasting uncertainty suggests that the final selected model will not always be the best in future cases, combination forecasting is a feasible approach to considerably reduce such a risk by synthesizing forecasts generated from different models [2,20]. Empirical evidence has shown that combining forecasting can improve accuracy in tourism forecasting as well [3,4,21,22]. Linear combination methods such as those proposed by Gunter and Önder [23], Shen et al. [22,24]. Song et al. [20], Sun et al. [3], and Wu et al. [25], dominate tourism forecast combination, although. Cang [21] demonstrated the superiority of nonlinear combinations, including the support vector regression (SVR), the radial-basis function network (RBFN), and multi-layer perceptron (MLP), over linear combination methods. Altogether, the persistent development of more accurate forecast combination methods is of great importance to tourism practitioners [2,4]. It should be noted that combination forecasting is different from the decomposition ensemble approaches. A decomposition ensemble approach usually divides the original series into different modalities through decomposition methods, then a combination method is applied to obtain combined forecasts.
Interestingly, grey prediction receives relatively less attention in tourism forecasting [4], although it does not require the collected samples to satisfy any statistical property such that the inherent defects in statistical time series models can be avoided [26,27,28,29]. Little attention has been paid to exploring how grey prediction models can be used in the context of tourism forecasting, with some exceptions such as passenger demand with interval models [31] tourism demand [15,32,33,34,35,36,37,38,39,40] tourism flows [41], and tourist income [42]. Overall, much attention should be paid to the application of grey prediction to tourism demand.
In light of the advantages of grey prediction, the purpose of this research was to develop a grey forecast combination method (GFCM) by using univariate grey models commonly used in the tourism context to generate single-model forecasts. A multivariate grey model can then be applied to synthesize these single-model forecasts into a composite forecast Among multivariate grey models, GM(1,
The remainder of this paper is structured as follows Section 2 focuses on the proposed GFCM by briefly introducing four candidate models and GM(1,
Grey forecast combination method
Four univariate grey models, commonly used in the tourism context, are considered in this study. Individual single-model forecasts obtained from candidate models are synthesized by GM(1,
Candidate models
First-order grey model with one variable (GM(1,1))
Given an original sequence

The following equation can serve as the mathematical form of the GM(1,1):

The corresponding time response function is expressed as


The Bernoulli equation is used as the mathematical form of the NGBM(1,1) [57]:


Here,
A sequence

in which

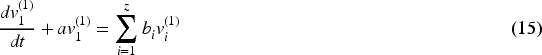
The following differential equation with order


The Bernoulli equation with order


Here,
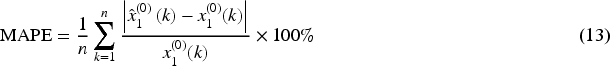
The mean absolute percentage error (MAPE), which is the most commonly used measure of forecasting performance in tourism forecasting, is used to assess the forecasting performance as follows:
We used quarterly data of 2008Q1-2019Q4 with respect to the Taiwan inbound tourism demand from Japan, China, Hong Kong/Macau, the US, South Korea, and Southeast Asia to verify the forecasting accuracy of different combination methods. Over 15 forecasts in the period of 2010Q3-2014Q1, a rolling mechanism is employed to find the optimal series length to construct a single grey model. We take one-quarter-ahead forecasting as an example. For four-point rolling, for instance, a forecast at 2010Q3 is generated by constructing a single model using the period of 2009Q3-2010Q2. Then the period of 2009Q4-2010Q3 is used to construct a single model to generate a forecast at 2010Q4. This process continues until a forecast at 2014Q1 is computed. As a result, the average MAPE is computed over 15 forecasts for four-point rolling. The optimal length, say
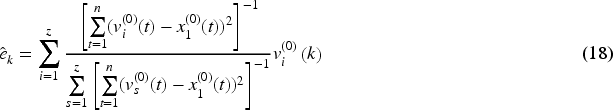
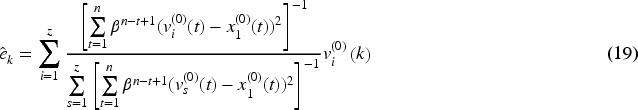
GM(1,

and
With initial condition

Finally, with 1-IAGO, the combined forecast of
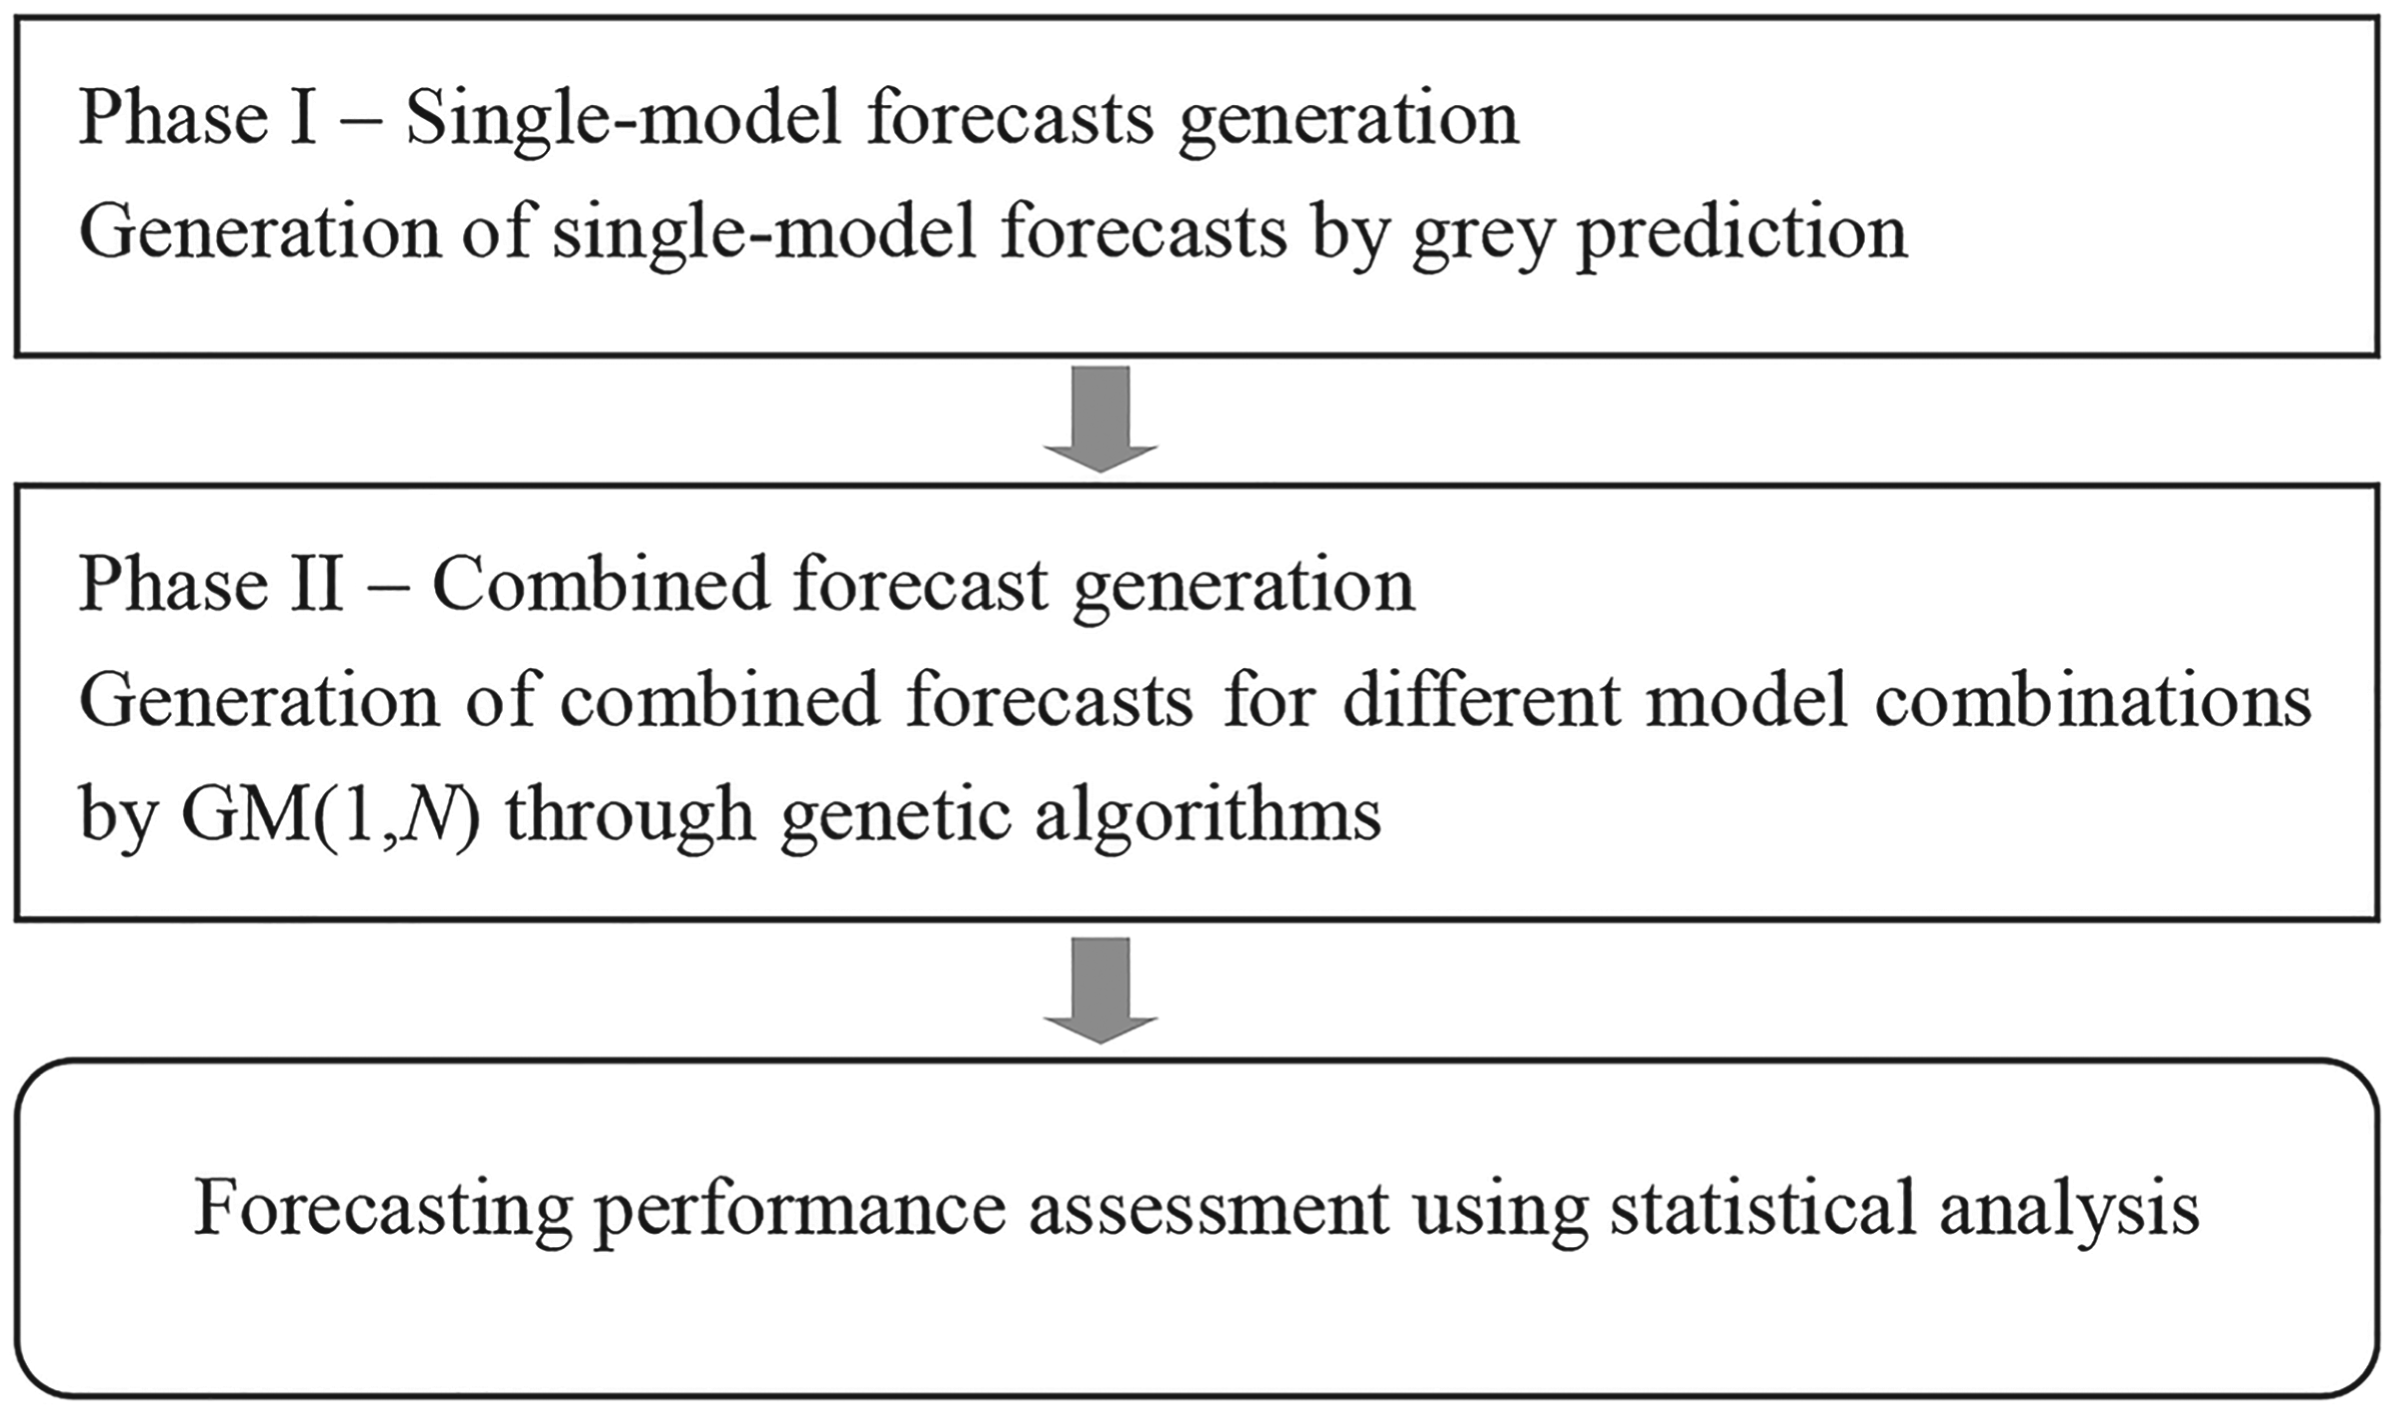
Methodological framework for the study.
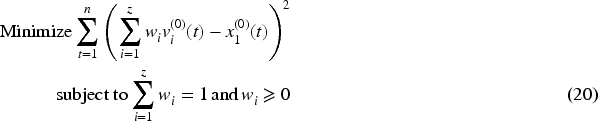
Linear combination methods
Simple average (SA), variance – covariance (VACO), the discounted mean-squared forecasting error (DMSFE), and quadratic programming (QP) are adopted to combine individual forecasts generated by the candidate models. Let
VACO generates
and
Commonly used nonlinear methods in the tourism literature include MLP, SVR, and RBFN. For each such method, forecasts from candidate models serve as the inputs. One hidden layer is sufficient for approximating any continuous function for NNs [61], and the number of nodes in the hidden layer should be twice the number of input nodes, as suggested by Heaton [62]. Python with the “scikit-learn” package was used to construct the MLP and SVR for a given period of weight estimation, and the “PyTorch” package was used to set-up the RBFN. A grid search was performed to determine the appropriate hyperparameters, including the learning rate of MLP and the kernel function for SVR. For simplicity, the details of MLP, SVR, and RBFN are omitted here, but they can be found in [21].
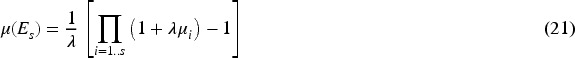
As for the fuzzy integral, the Choquet fuzzy integral along with a

Data description
This study collected quarterly data from the Tourism Statistics Database of the Taiwan Tourism Administration (
Results
Tables 1 and 2 show that no single forecasting model outperformed all others in all situations for three model combinations, all source markets, and both forecasting horizons. In three-quarter-ahead forecasting among the single models, for example, GM(1,1) yielded the best average result (2.552) in the case of Japan, but NGBM(1,1) delivered the best performance (7.707) in the case of China. Tables 1 and 2 illustrate that, except for MLP and RBFN, three-model combinations outperformed two-model combinations in terms of average accuracy, while four-model combinations were more accurate than three-model combinations. This finding is consistent with the results reported by Song et al. [20], who found that forecasting accuracy increased with the number of single models considered in a combination set.
Forecasting accuracy of one-quarter-ahead single-model and combined forecasts.
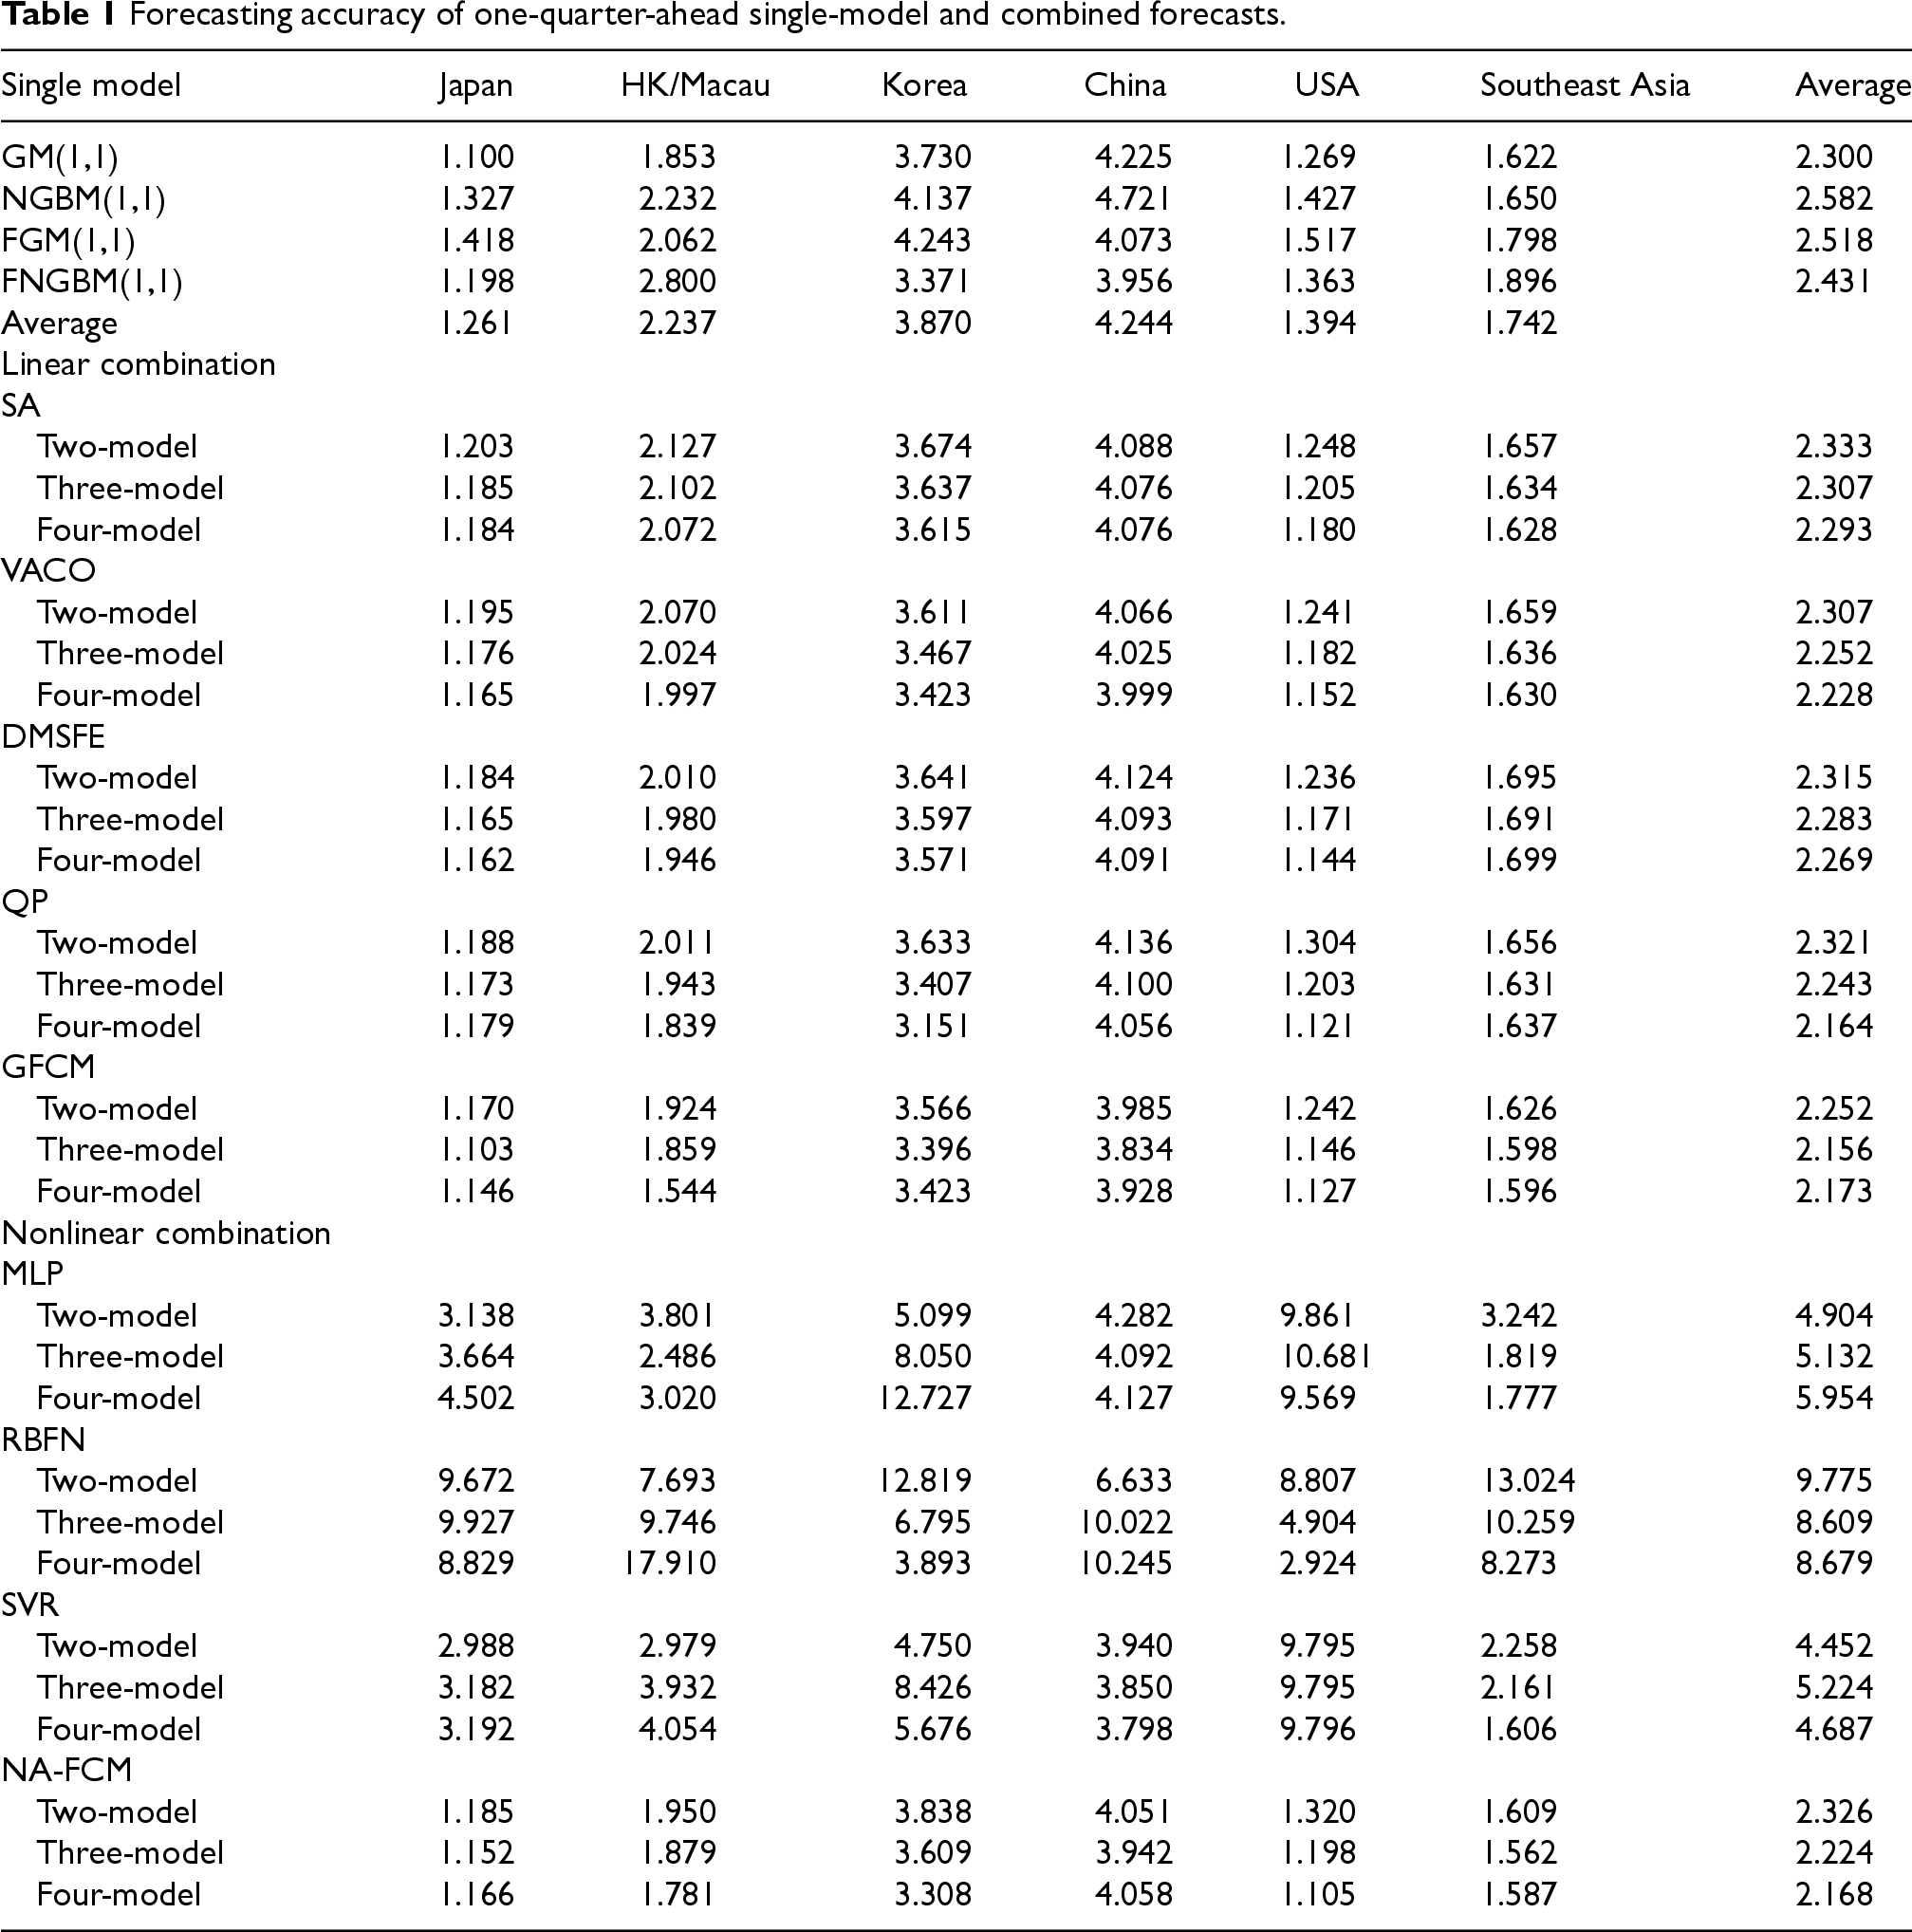
Forecasting accuracy of one-quarter-ahead single-model and combined forecasts.
Forecasting accuracy of three-quarter-ahead single-model and combined forecasts.
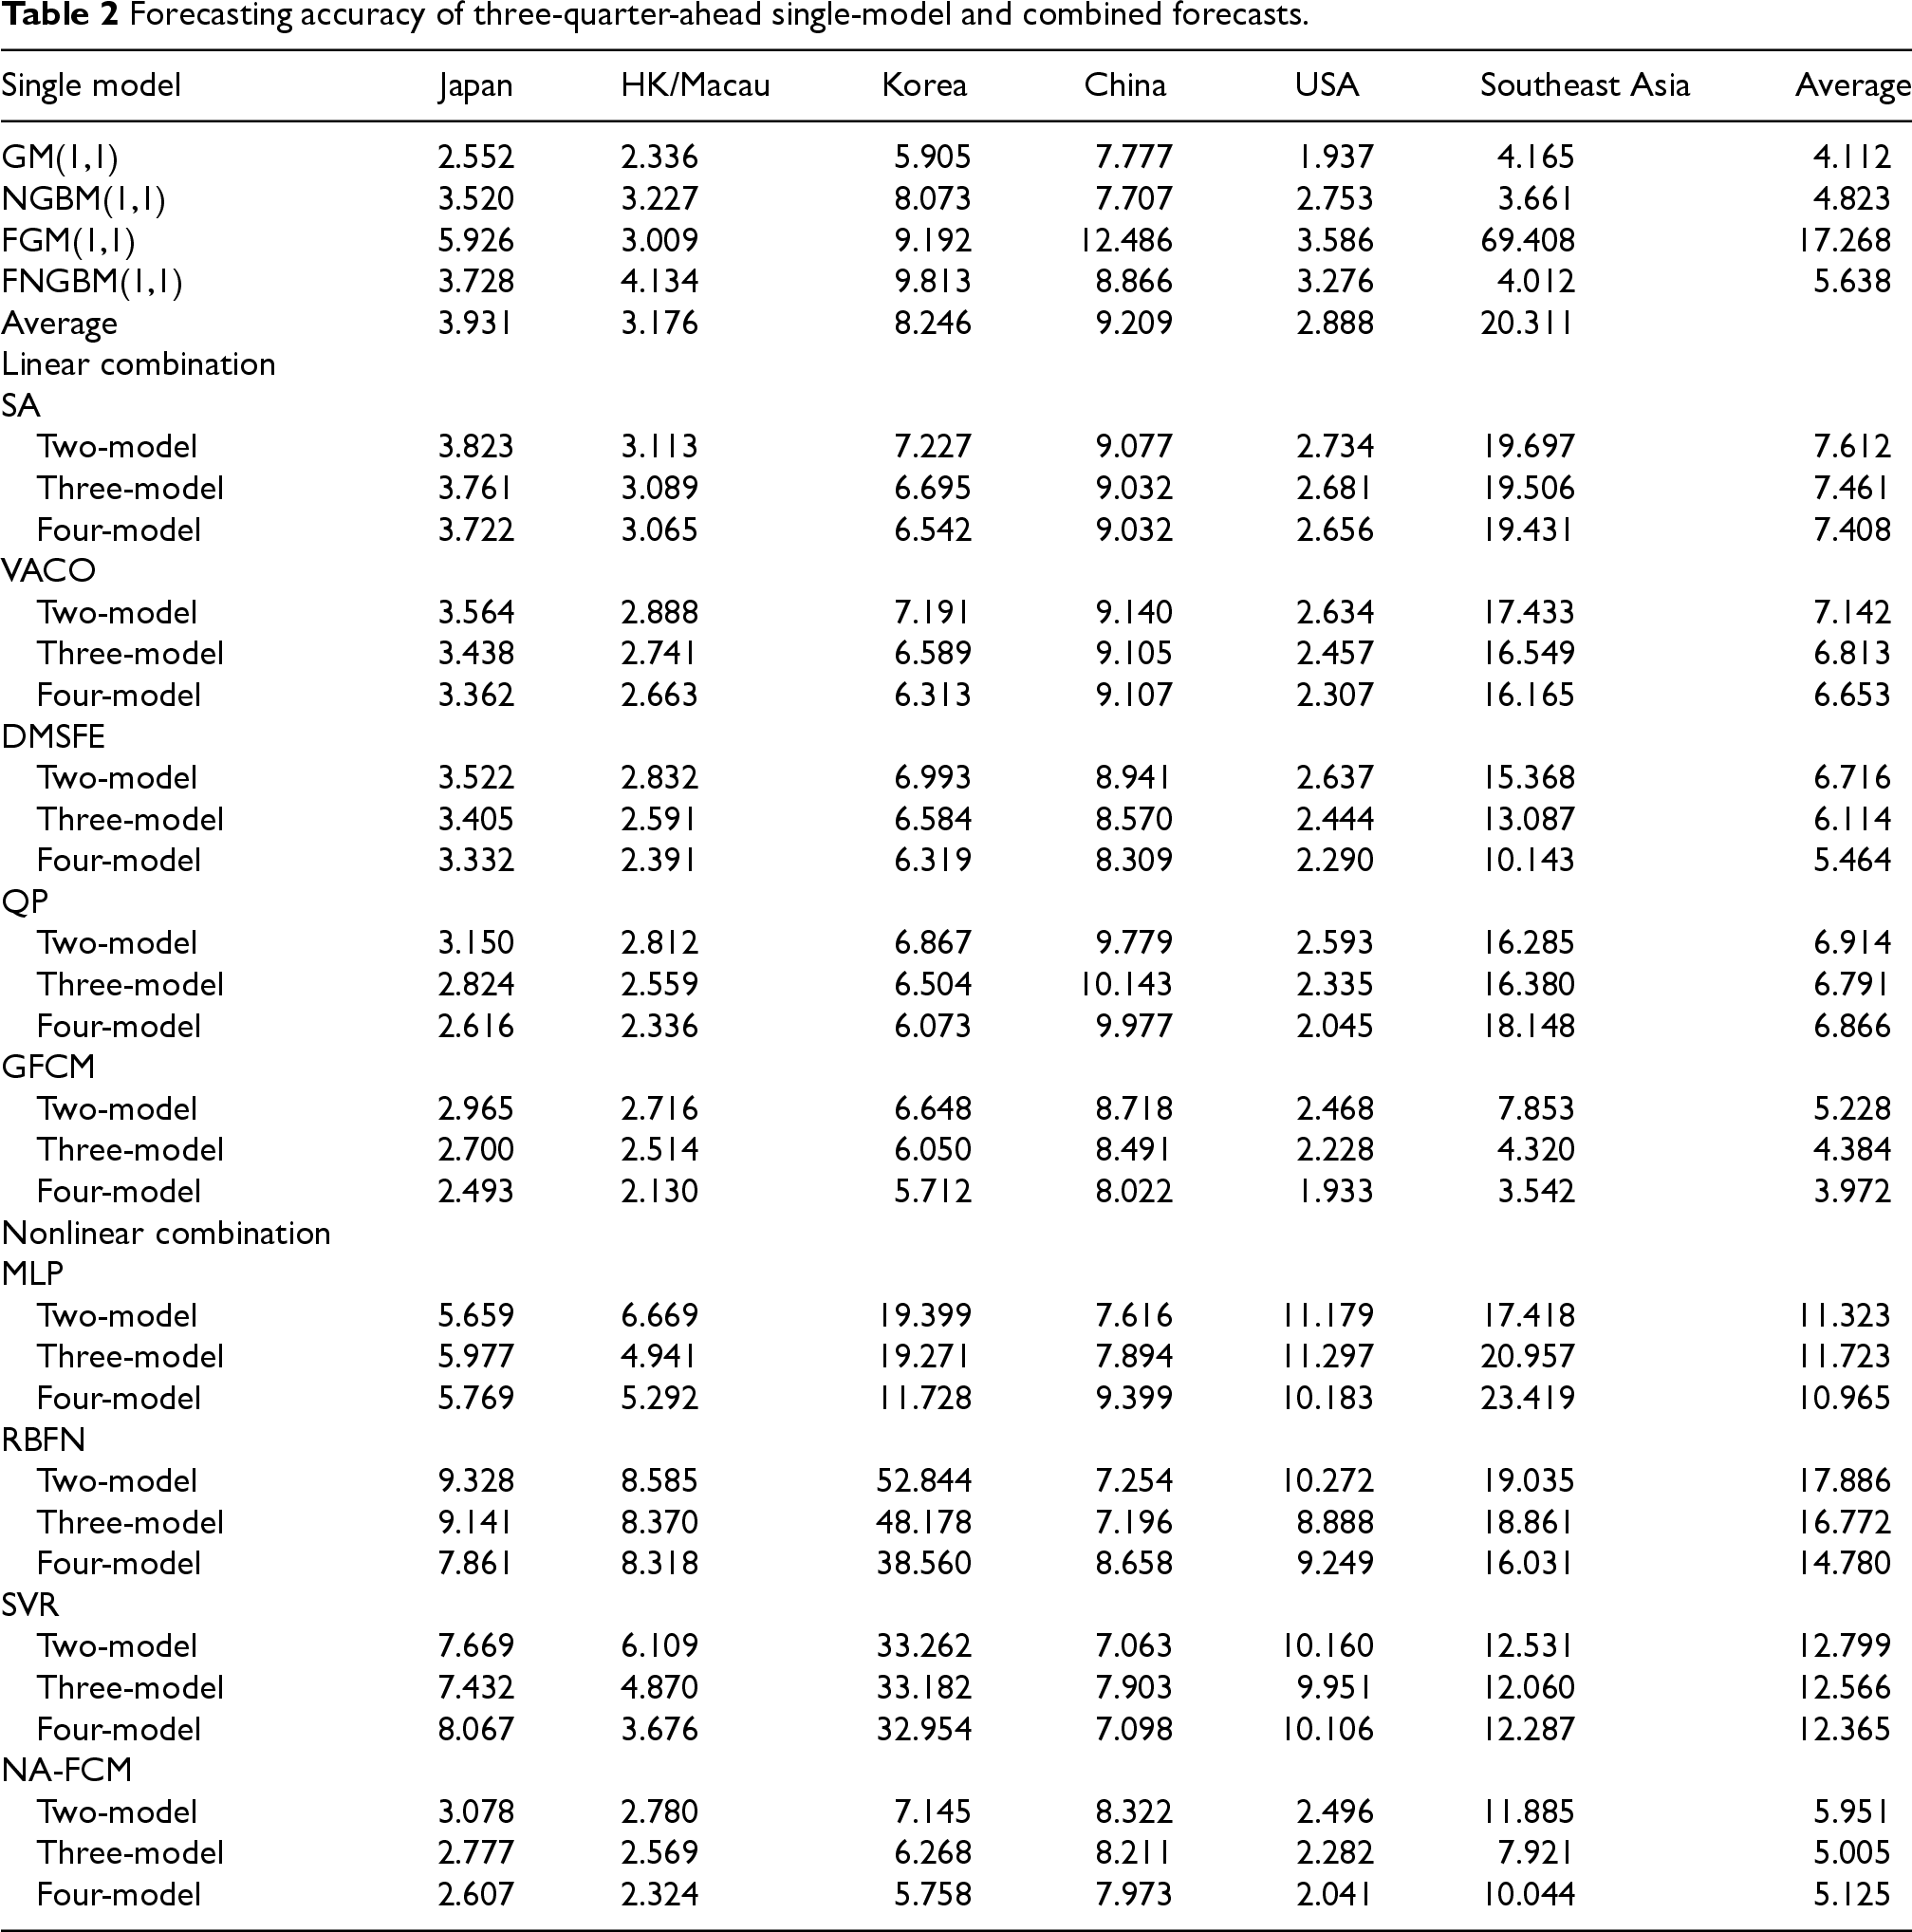
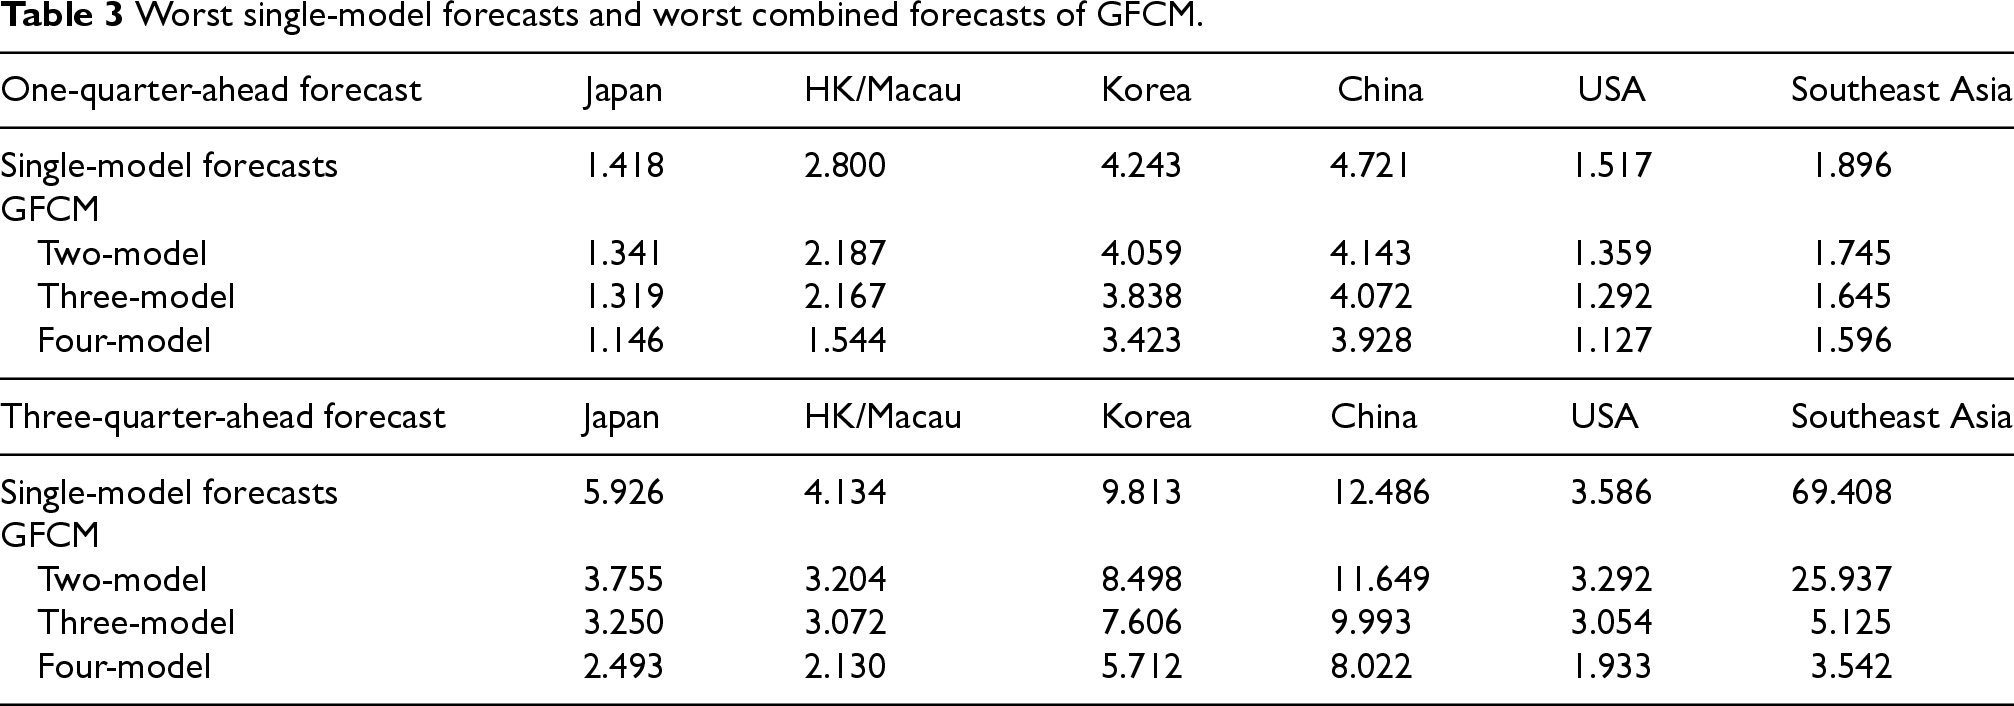
As for each model combination, Tables 1 and 2 show that the combined forecasts of the proposed GFCM outperform single-model forecasts when the average accuracy is considered for all source markets and on both forecasting horizons. Table 3 shows that the worst forecasts of the GFCM were superior to the corresponding worst single-model forecasts from two- to four-model combinations for all source markets and on both forecasting horizons. The combined forecasts of the GFCM outperform not only the worst single-model forecasts but also the average forecasting accuracy of single models. These results confirm that the use of the GFCM can help decision-makers reduce the risk of uncertainty of model selection that one single model performs well in one time period but declines in other time periods. This has been noted for the advantage of combination forecasting in previous studies such as Hu and Wu [33], Li et al. [1], Shen et al. [22], and Sun et al. [3].
Worst single-model forecasts and worst combined forecasts of GFCM.
Results of the Friedman test with a post-hoc test for GFCM and nonlinear combination methods.
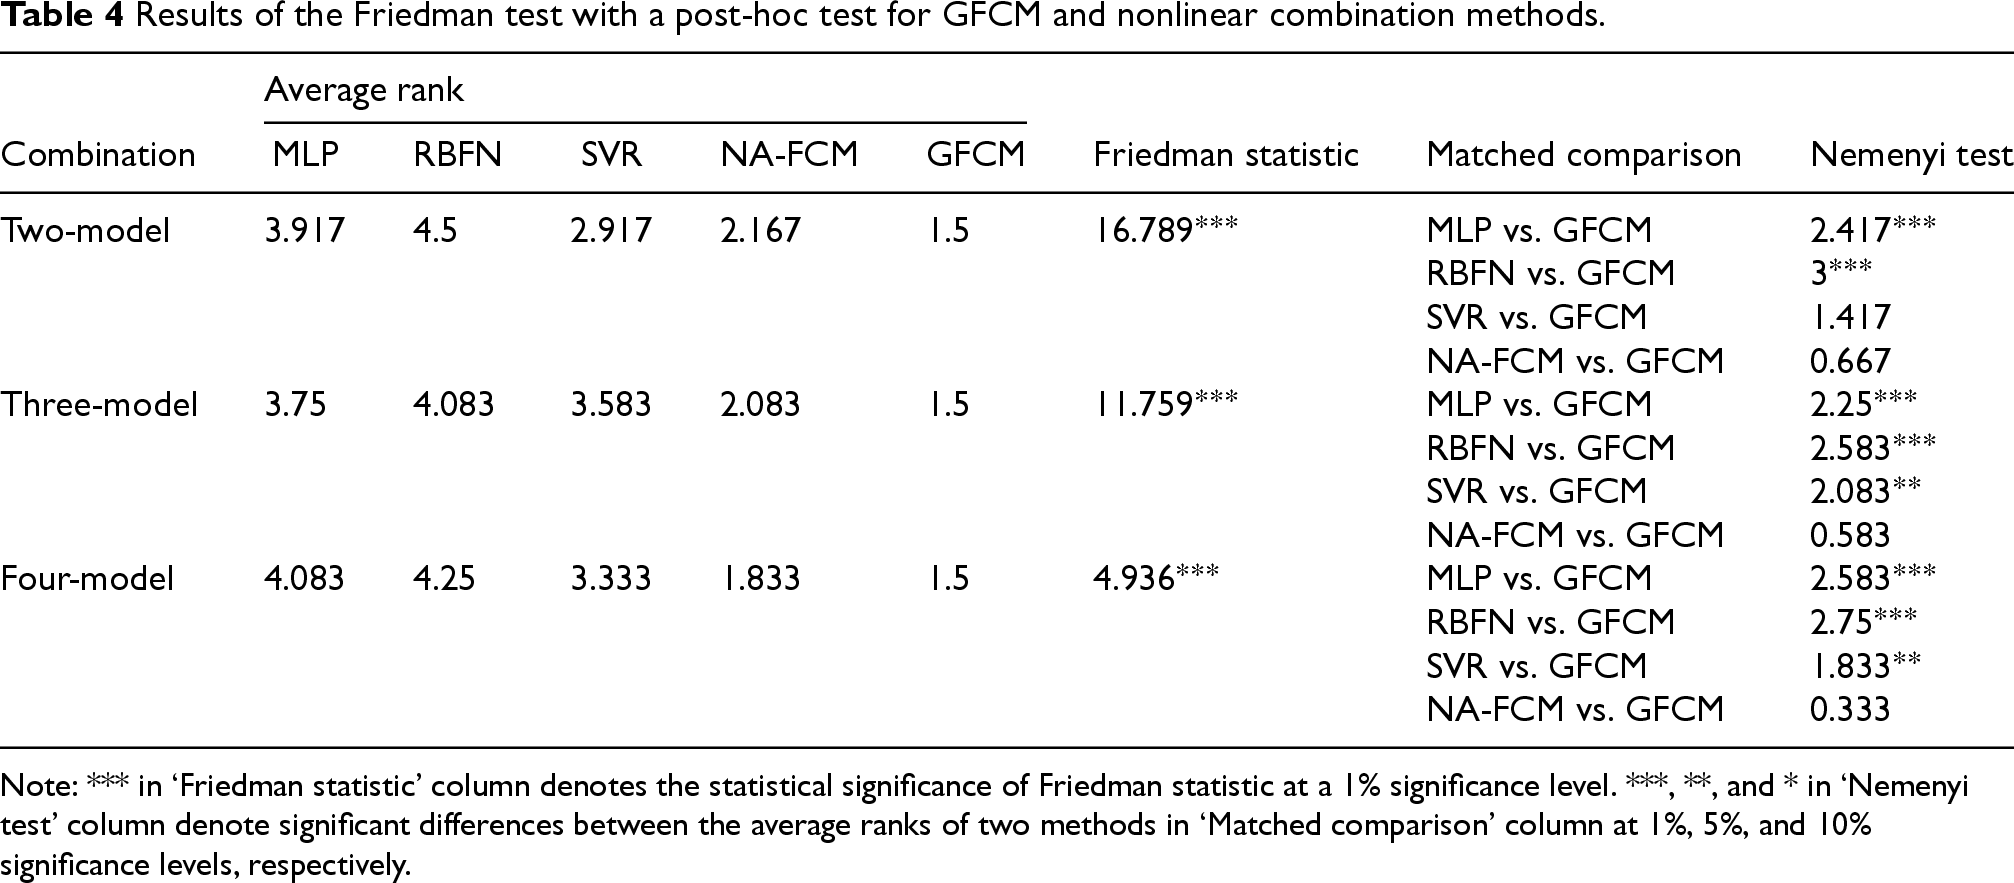
Note: *** in ‘Friedman statistic’ column denotes the statistical significance of Friedman statistic at a 1% significance level. ***, **, and * in ‘Nemenyi test’ column denote significant differences between the average ranks of two methods in ‘Matched comparison’ column at 1%, 5%, and 10% significance levels, respectively.
Additionally, the validation on the forecasting results requires the multiple comparisons tests. Demšar [66] pointed that the nonparametric Friedman test is suitable for comparing multiple classifiers. In this study, the Friedman test has been used to validate whether the forecasting results of GFCM and the other combination methods considered here have a significant difference or not. For each model combination, Table 4 shows that the null hypothesis – which states that the average ranks of the GFCM and the nonlinear and linear combination methods are equal respectively – was rejected because the test results of the Friedman statistic indicates that the forecasting results of these methods have a significant difference at a 1% significance level. Table 5 likewise shows a significant difference. The post hoc Nemenyi test was conducted to detect differences between the two methods by comparing differences in their average ranks and critical differences between them. The “Matched comparison” columns in Tables 4 and 5 show pairwise comparisons between the GFCM with nonlinear and linear combination methods, respectively. The two methods delivered significantly different performance at significance levels of 1%, 5%, and 10% if their corresponding averages differed by critical differences of at least 2.101, 1.761, and 1.587, respectively. The results in the “Nemenyi test” column show that the GFCM significantly outperformed the MLP and RBFN across all model combinations. Although the proposed GFCM was not significantly superior to the NA-FCM with the Choquet integral for all model combinations, its average rank was less than that of the NA-FCM for each model combination. Table 5 shows that the GFCM significantly outperformed VACO, DMSFE, and SA across all model combinations. Because the results in the “Nemenyi test” column indicate that the GFCM was significantly superior to QP on two- and three-model combinations, and the difference between them was just below the critical difference of 1.587 for four-model combinations, we can conclude that the GFCM outperformed QP. Overall, the proposed GFCM showed superior forecasting accuracy compared to the linear and nonlinear methods considered here.
Because of the importance of accurate predictions of tourism demand for tourism practitioners, the methodological contribution of this study is to produce more accurate results for tourism demand forecasting through the development of the two-phase GFCM. In the first phase, four commonly used univariate grey models served as candidate models to produce individual single-model forecasts. In contrast with time series models and econometric approaches, grey prediction models have the characteristic of being free from the requirement for any statistical properties imposed on the collected data series. In the second phase, GM(1,
Results of the Friedman test with a post-hoc test for GFCM and linear combination methods.
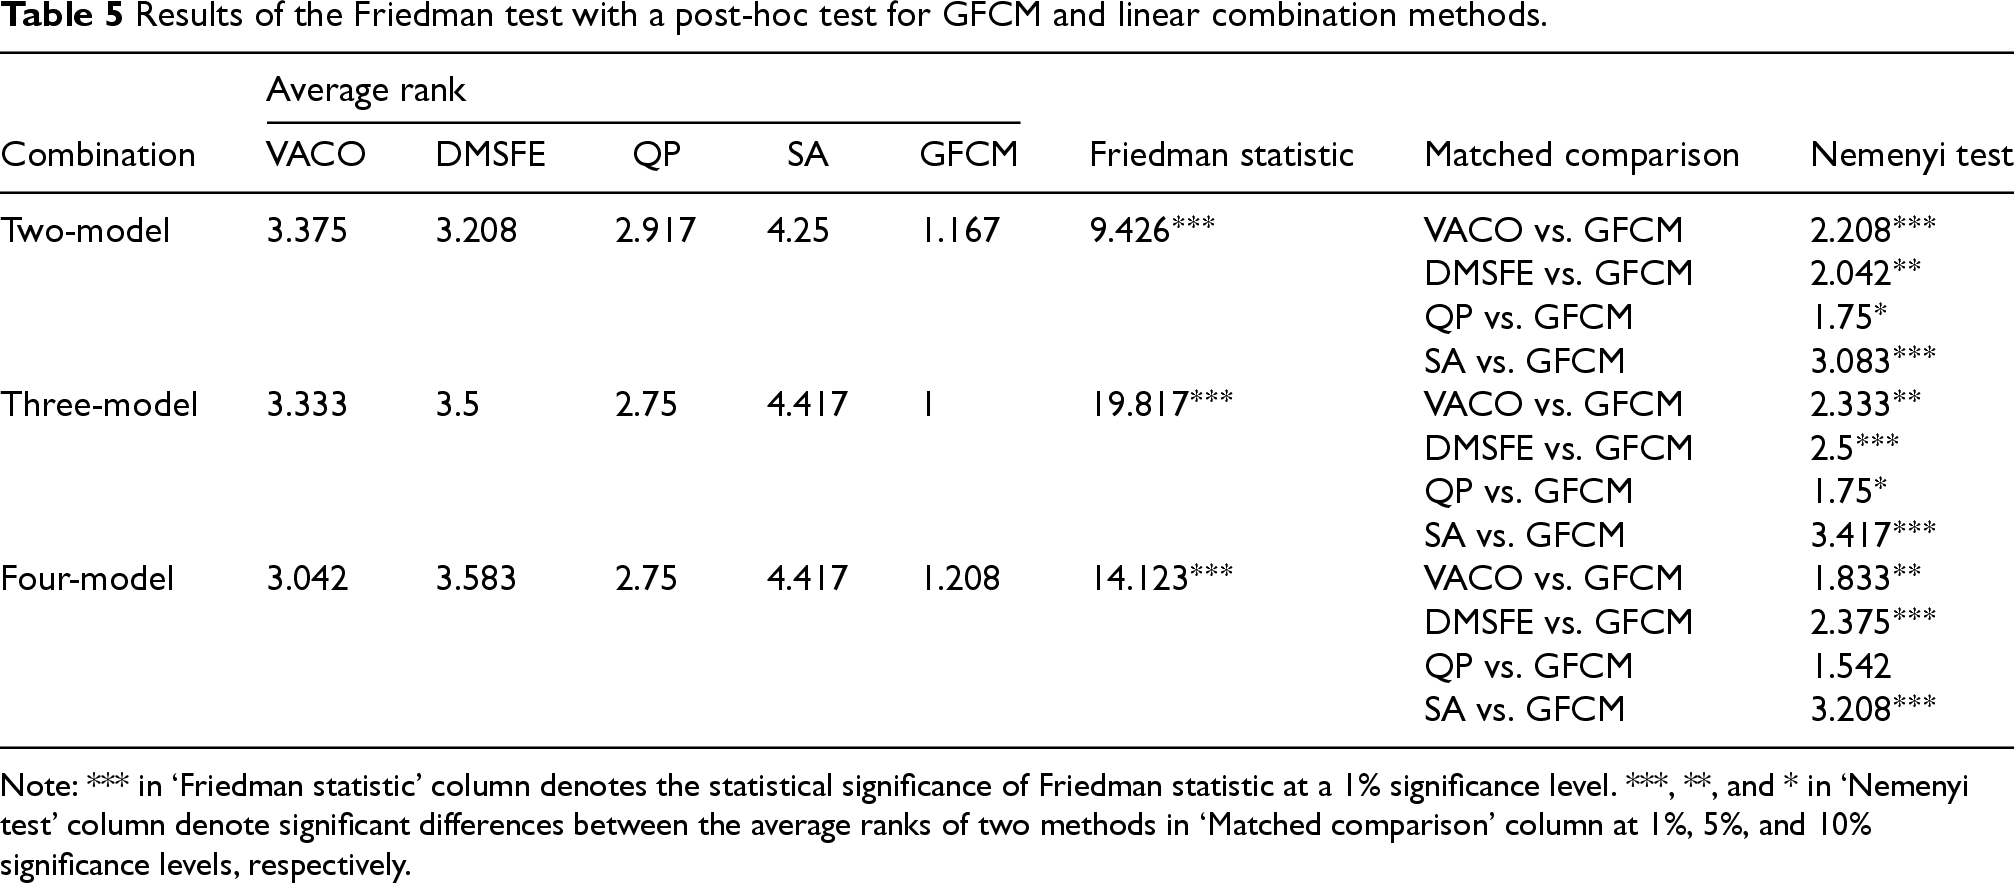
Note: *** in ‘Friedman statistic’ column denotes the statistical significance of Friedman statistic at a 1% significance level. ***, **, and * in ‘Nemenyi test’ column denote significant differences between the average ranks of two methods in ‘Matched comparison’ column at 1%, 5%, and 10% significance levels, respectively.
The combined forecasts generated by the GFCM outperformed not only the worst single-model forecasts but also the average forecasting accuracy of single models for each source market over different forecasting horizons, which suggests that the GFCM helps avoid the risk of forecasting failures that arise from the selection of an inappropriate single model from GM(1,1), NGBM(1,1), FGM(1,1), and FNGBM(1,1). As no single grey model can outperform the others in all situations, the GFCM is a superior alternative among the combination methods considered because it can generate more accurate combined forecasts of tourism demand. In the practice of tourism demand forecasting, the GFCM can help tourism practitioners predict the trend of a source market so as to formulate more appropriate pricing and revenue strategies.
Interestingly, Tables 1 and 2 show that the linear combination methods outperformed the nonlinear methods considered in terms of the average accuracy for each model combination. These results contradict the findings by Cang [21], possibly because the forecasting performance of artificial intelligence methods is sensitive to hyperparameters such as the number of samples and network architecture [7]. Additionally, although GM(1,
Additionally, the outbreak of COVID-19 pandemic has devastated international tourism since 2020. COVID-19 has presented a challenge for the development of accurate methods of forecasting tourism demand [67]. Against this backdrop, combination forecasting can play an important role for tourism demand forecasting. It would be better to re-construct candidate models for forecast combinations whenever structural changes in data series such as COVID-19 are detected [3]. Since tourism demand continues to remain complex and variable, it may not be possible to collect large samples or adhere to statistical properties in the early period when re-constructing candidate models for the late period. This means that it may be better for forecast combinations with time-varying weights to use grey prediction models instead of time-series models and econometric approaches. This highlights the practicability of the GFCM by providing forecasts to help the tourism sector formulate tourism-related strategies during the recovery from COVID-19. Our future research will explore the use of a time-varying weighting strategy for the GFCM instead of using constant weights for forecasting tourism demand.
Footnotes
Acknowledgments
The authors would like to thank the anonymous referees for their valuable comments. This research is supported by the National Science and Technology Council, Taiwan under grant NSTC 112-2410-H-033-017.
Compliance with ethical standards
The authors declare that they have no conflict of interest. This article does not contain any studies with human participants performed by the authors.