
Abstract
Trajectory-outlier detection can be used to discover the fraudulent behaviour of taxi drivers during operations. Existing detection methods typically consider each trajectory as a whole, resulting in low accuracy and slow speed. In this study, a trajectory outlier detection method based on group division is proposed. First, the urban vector region is divided into a series of grids of fixed size, and the grid density is calculated based on the urban road network. Second, according to the grid density, the grids were divided into high- and low-density grids, and the code sequence for each trajectory was obtained using grid coding and density. Third, the trajectory dataset is divided into several groups based on the number of low-density grids through which each trajectory passes. Finally, based on the high-density grid sequences, a regular subtrajectory dataset was obtained within each trajectory group, which was used to calculate the trajectory deviation to detect outlying trajectories. Based on experimental results using real trajectory datasets, it has been found that the proposed method performs better at detecting abnormal trajectories than other similar methods.
Keywords
Introduction
The development of vehicle communication and networks has generated a large amount of movement trajectory data. Analysis of these data can assist in urban planning [1], congestion detection [2], fraud detection [3], road flow prediction [4], and travel time estimation [5]. In this context, trajectory data mining and its applications have become important research topics for urban transportation systems.
Trajectory data analysis includes trajectory clustering [6, 7], trajectory classification [8], trajectory pattern mining [9], and trajectory outlier detection [10, 11, 12, 13]. This study focuses on the detection of taxi trajectory outliers. Trajectories that deviate from the norm spatially or in terms of distance are considered trajectory outliers (i.e., outlying trajectories) [14]. Many scholars have conducted research on trajectory outlier detection and achieved corresponding results, including clustering-, distance- [15] and grid-based [16, 17] methods.
However, most of the existing methods have two limitations. First, the impact of the road network environment on trajectory-outlier detection is neglected, whereas detour behaviour tends to occur in regions with dense road networks, where more roads are available for selection. Second, the trajectory dataset was considered as a whole, ignoring the deviations between the different types of normal trajectories. To solve these problems, this study proposes a trajectory outlier detection method based on group division (TODG), which is used to detect outliers from a dataset of trajectories with the same source (S) and destination (D).
The main contributions of this paper can be summarised as follows:
A method for defining grid types based on grid density calculations was proposed. The grids in the urban region were divided into high- and low-density grids. Trajectory groups were obtained based on the number of low-density grids through which each trajectory passed. A trajectory outlier detection method based on group division was proposed. In each trajectory group, a regular sub-trajectory dataset was obtained based on high-density grid sequences. This method prevents the negative effect of excessive spatiotemporal deviation of normal trajectories on trajectory-outlier detection results and improves detection efficiency and accuracy. A series of comparative experiments were conducted to verify the proposed method using real taxi trajectory datasets. The experimental results demonstrate that the TODG method performs better in trajectory outlier detection.
The remainder of this paper is organised as follows: Section 2 introduces existing methods related to trajectory-outlier detection. Section 3 provides the definitions of terms used here and related statements. The proposed method is described in detail in Section 4. The experimental evaluation and results are presented in Section 5. Section 6 summarises the study and provides suggestions for future work.
Related work
Existing trajectory outlier detection algorithms can be classified into clustering-, distance-, and grid-based methods.
Clustering-based methods
Clustering-based methods determine outlying trajectories according to clustering results. Ying et al. [18] proposed a method for identifying outliers in trajectories using the DBSCAN algorithm to cluster trajectories and identify trajectories in lower-density clusters as outliers; however, they ignored features other than position. To better express the local feature information of trajectories, Lu et al. [19] proposed a trajectory division strategy based on multi-motion features and a trajectory structure similarity measurement method, based on which they designed a distributed clustering algorithm for flow trajectories and detected outlying trajectories using the clustering results. Focusing on the problem of outlier detection in urban traffic flow, Wang et al. [20] proposed a framework that uses the fuzzy C-means clustering algorithm with optimal
Clustering-based trajectory-outlier detection methods can be run in unsupervised mode. Some clustering-based algorithms require the distances between the trajectory points to be calculated. Therefore, they are similar to distance-based outlier detection methods.
Distance-based methods
Distance-based methods calculate the distance between data objects and obtain outlying trajectories based on Euclidean distance, Manhattan distance, dynamic time warp distance, etc. [21]. Lee et al. [22] proposed a partitioning and detection framework that first segmented trajectories into a set of line segments and then detected outliers using Hausdorff distance and density-based methods. To improve the accuracy of outlier detection, Hu et al. [23] analysed a trajectory-outlier detection method based on the Hausdorff distance and proposed an Improved Moving Euclidean Distance (IMED) to replace the Hausdorff distance. Belhadi et al. [24] proposed a two-phase outlier detection model to detect group trajectory outliers. In the first stage, individual taxi trajectory outliers are determined by calculating the distance between each point. In the second stage, feature selection and sliding window strategies were used to identify group trajectory outliers.
Distance-based methods require the selection of an appropriate distance metric that is closely related to their performance.
Grid-based methods
Grid-based methods quantify trajectories into a finite number of cells and convert each trajectory into a series of grid codes used for outlier detection. Based on the fact that abnormal features are easily affected by isolation mechanisms, Zhang et al. [17] proposed an iBAT algorithm based on isolation forests and isolation mechanisms. In response to the low efficiency of the iBAT algorithm, Chen et al. [10] proposed an isolation-based online outlier detection method that utilised an inverted indexing mechanism to quickly retrieve relevant trajectories. To determine different types of outlying trajectories, Wang et al. [25] proposed a trajectory-outlier detection and classification (ATDC) method that classifies trajectories into five categories based on trajectory anomaly scores. In addition to the aforementioned methods that detect outliers from a dataset of trajectories with the same source and destination, Bhattacharjee et al. [26] proposed a grid-based outlier detection technique that calculates the point density using kernel density estimation instead of distance measurement.
The trajectory outlier detection results of clustering-based methods largely depend on the selection of clustering numbers and the existence of outliers. Distance-based methods require the selection of appropriate distance metrics to frequently calculate the distance between trajectories, which is both time-consuming and inefficient. Grid-based methods have the advantages of high processing speeds and efficiency in trajectory retrieval. In addition, grid-based methods are typicallyy used to detect outliers from a dataset of trajectories with the same source and destination places; therefore, this study adopts a grid-based method to detect outlying trajectories. Existing grid-based methods generally convert trajectories into unit sequences to detect outliers, ignoring the road network environment and deviations between different types of normal trajectories. In reality, some grids have a large number of roads, whereas others have a small number, and abnormal behaviours such as detours often occur in grids with more optional roads. Therefore, this study proposes a trajectory-outlier detection method based on group division (TODG) to address these issues.
Problem description
This section defines the relevant concepts used in this paper.
The subject of this study is trajectories with fixed source and destination.
where
where the number of trajectory codes in
Division of trajectory groups.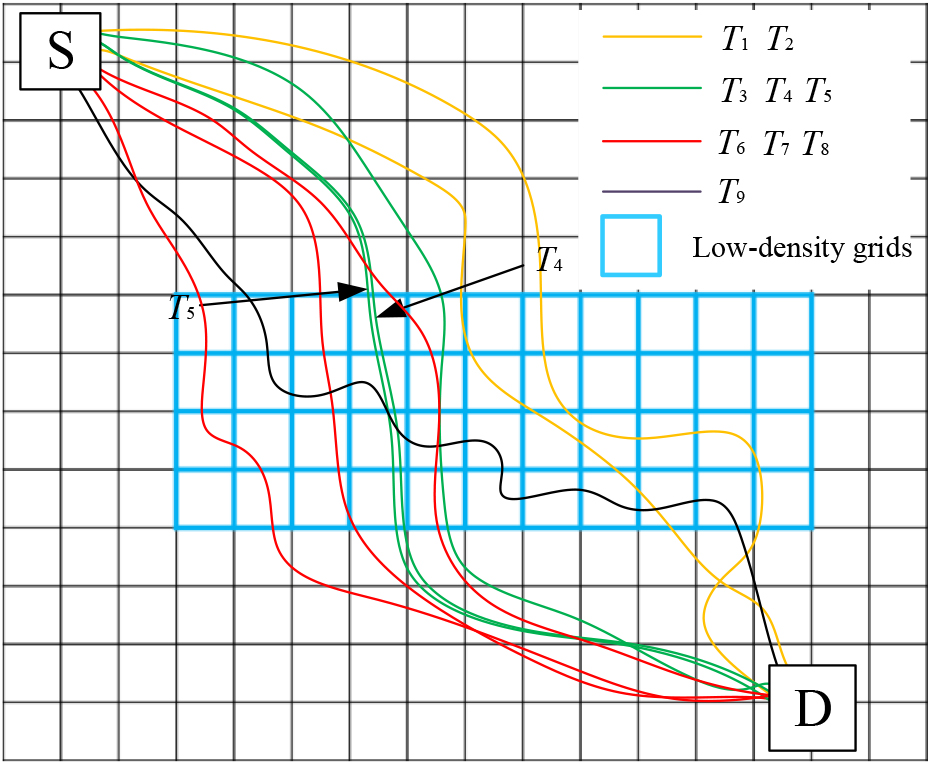
As shown in Fig. 1, the grids marked in blue are low-density grids, and the rest are high-density grids. A trajectory dataset can be divided into one or more trajectory groups according to the number of low-density grids through which all the trajectories pass. In Fig. 1, eight low-density grids passed through
Division of trajectory.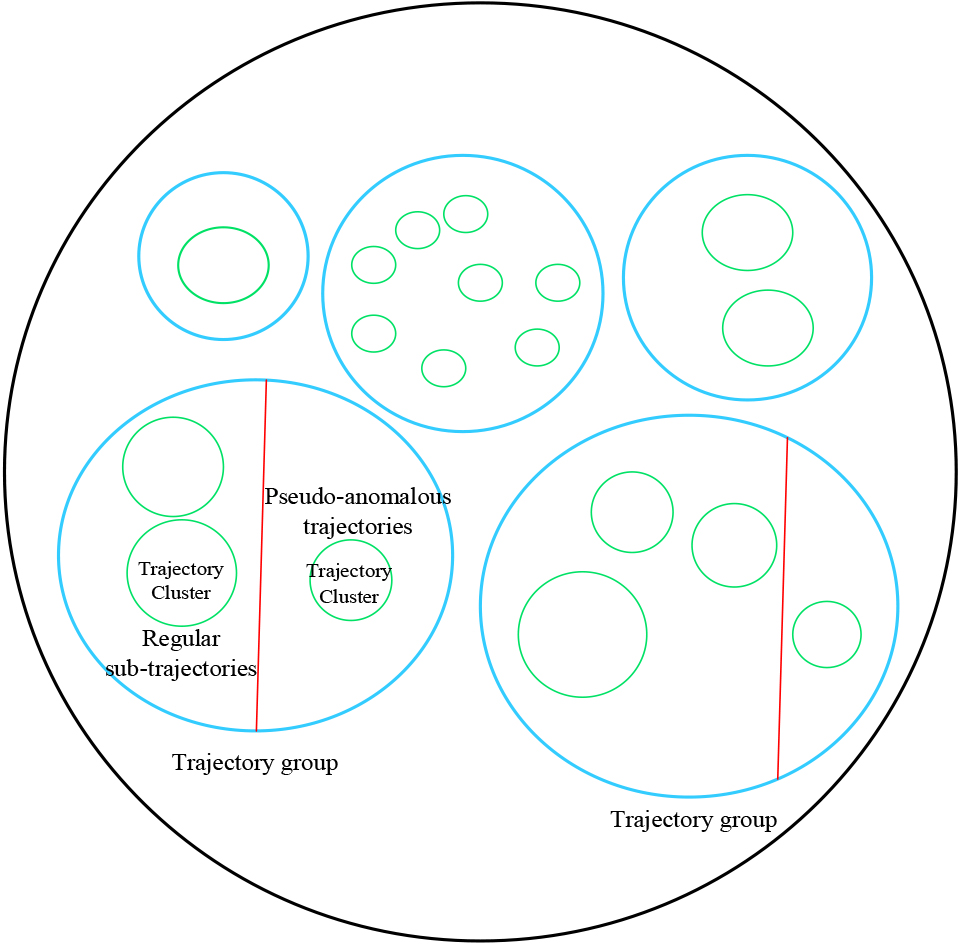
where
In the example shown in Fig. 1,
where
TODG consists of two stages: trajectory pre-processing and trajectory outlier detection. The working model of the proposed method is illustrated in Fig. 3.
Trajectory outlier detection framework.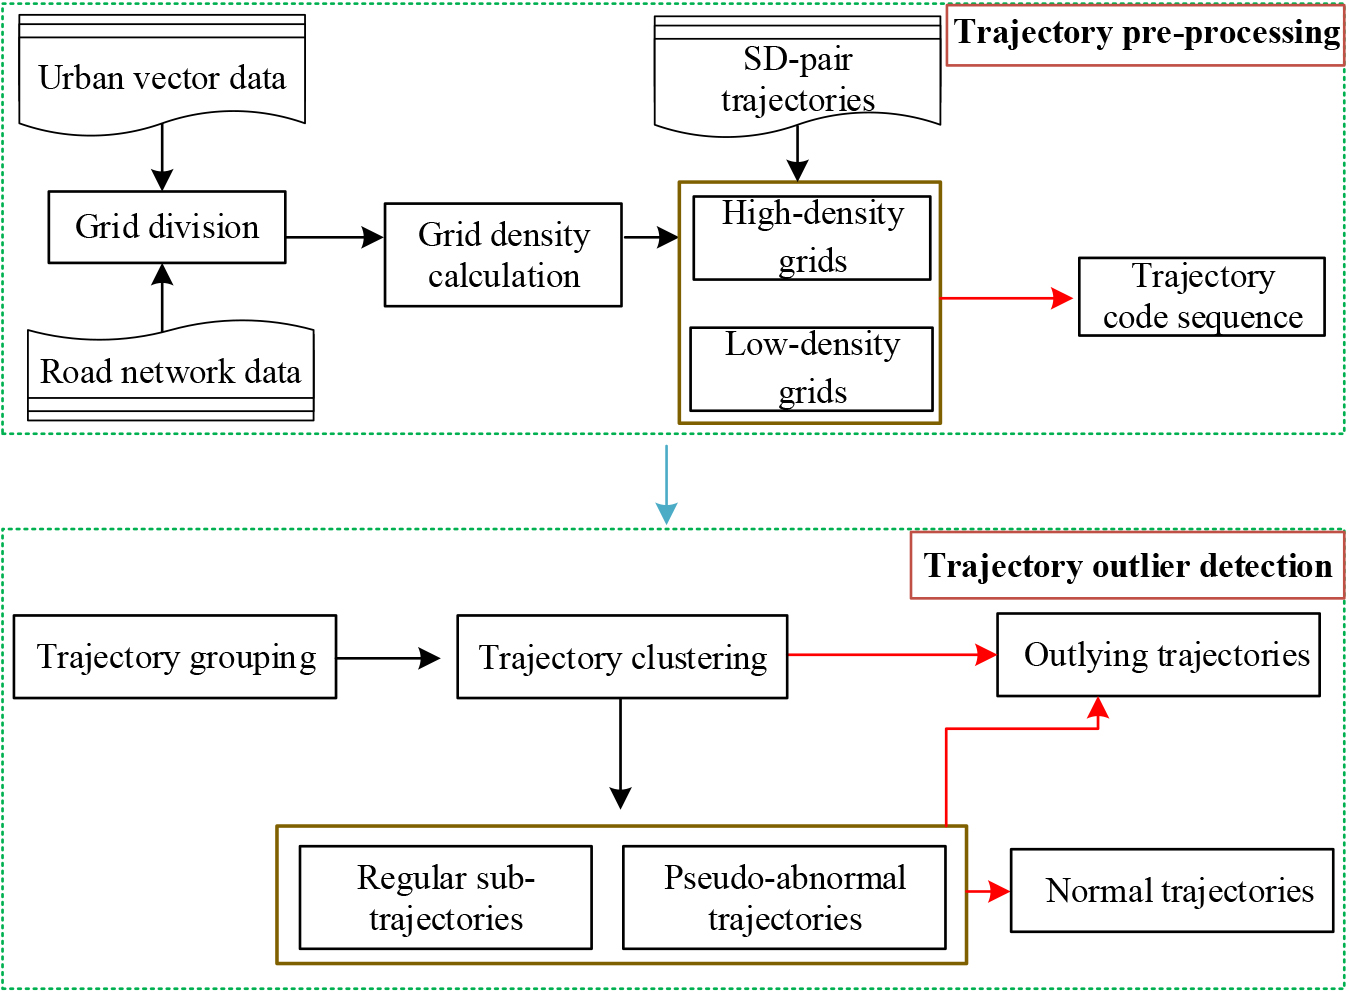
Before conducting trajectory outlier detection, each trajectory must be converted into a trajectory code sequence via trajectory preprocessing.
First, the urban vector region is divided into grids of fixed size. Each grid is assigned a different code. Subsequently, based on the urban road network data, the density of each grid was calculated using Eq. (2).
In this study, a natural interruption-point grading method was used to determine the grid density threshold
Trajectory outlier detection
In the trajectory outlier detection stage, the trajectory groups were first obtained according to the number of low-density grids. Trajectory clusters in each trajectory group were then obtained for trajectory outlier detection. In addition to the start and end codes, if the number of high-density grids in the trajectory group is zero (although the region studied in this paper is an urban centre, there is almost no such situation), outliers are detected based on the code sequence of low-density grids.
Trajectory grouping
Detours mostly occur in dense areas of the road network, where the road network is complex and there are many optional roads. However, vehicles may also pass through sparse areas of the road network with low grid density while driving. For trajectory outlier detection, the trajectory dataset is first divided into trajectory groups based on the number of low-density grids through which each trajectory passes. The trajectory grouping method is presented in Algorithm 1.
In the initialisation stage,
The time complexity of Algorithm 1 is
Trajectory clustering
Before a trajectory group is divided into trajectory clusters, it is necessary to calculate the trajectory group rate to determine whether clustering is necessary. The trajectory group rate, denoted by
where
For a trajectory group that can be divided, the first step in trajectory-outlier judgment is the acquisition of trajectory clusters. Compatible trajectories within the trajectory group are divided into trajectory clusters according to Eq. (5), such that the trajectory group is divided into one or more trajectory clusters.
The trajectory-clustering process is presented in Algorithm 2. Let us consider trajectory group
The time complexity of Algorithm 2 is
After trajectory clustering, a set of regular subtrajectories was obtained using Eq. (5). At this point, the trajectory group was divided into regular subtrajectory and pseudo-anomalous trajectory datasets. The trajectories within the pseudo-anomalous trajectory dataset were judged to be abnormal based on the regular subtrajectory set. In this study, a trajectory-scoring function was designed to judge outlying trajectories. Taking any trajectory group as an example, the trajectory score calculation is given by Eq. (7).
where
After trajectory scoring, the pseudo-anomalous trajectory dataset was divided into quasi-normal and outlying datasets. The set formed by the quasi-normal trajectory dataset and regular subtrajectory dataset is the normal trajectory dataset in the trajectory group, and the remaining trajectories in the group are the outlying trajectories. The outlying trajectory determination results of the trajectory groups were not affected by each other.
The acquisition of a regular subtrajectory dataset and judgment of the outlying trajectories are shown in Algorithm 3 (taking trajectory group
San Francisco Bay Area and trajectories.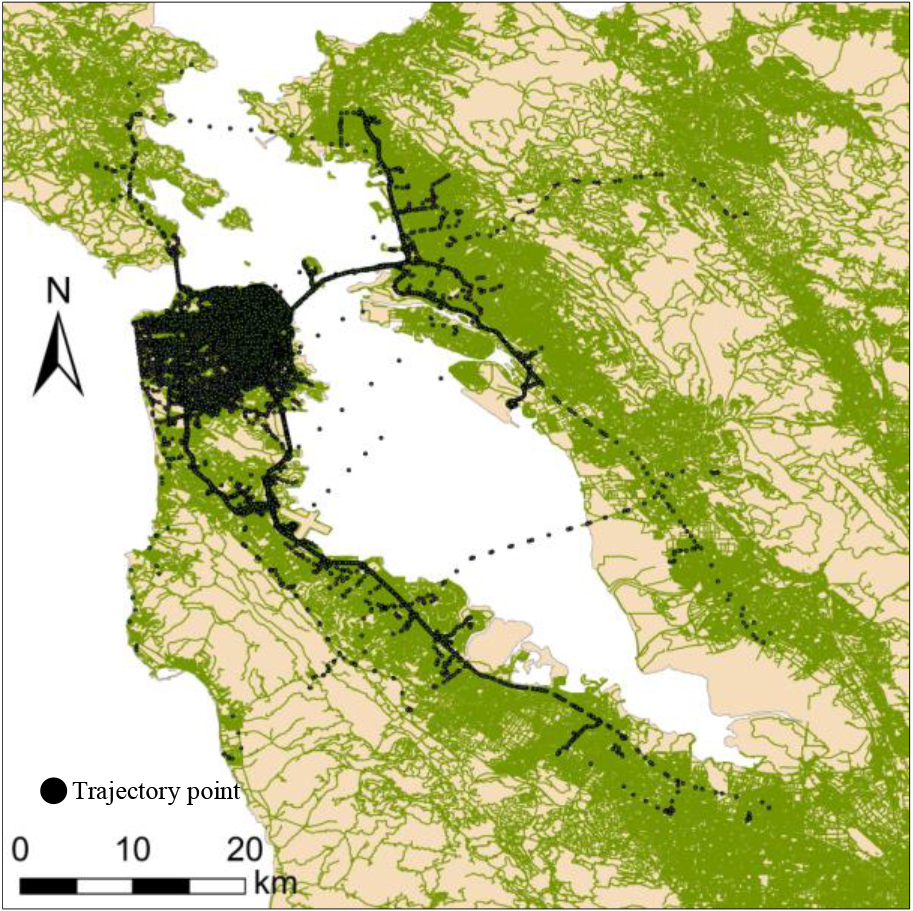
The time complexity of Algorithm 3 is
Experimental setup and dataset
The experimental setup was an Intel Corei5 processor with a 3.10 GHz CPU. The operating platform was Windows 10, and the proposed algorithm was implemented using MATLAB 2020a and ArcGIS 10.7.
This study used the dataset provided by Piorkowski et al.,1 which contains the trajectories of 536 taxis in the urban area of San Francisco, USA, over a 30-d period with an average sampling rate of 100 s. The GPS trajectory data recorded the location (latitude and longitude) of each taxi as well as the corresponding time and occupancy. The partial trajectory points and a schematic map of the San Francisco Bay Area are shown in Fig. 4. In this study, only the trajectories between the San Francisco Urban Airport and the central residential location were extracted, and the performance of the proposed trajectory-outlier detection method was measured using F-measure, Accuracy, Precision and Recall. The calculation methods are expressed in Eqs (8)–(11).
where
Based on the experimental analyses of ATDC [10] and iBAT [17], the regional vector map of San Francisco was first divided into fixed-size (300 m
Grid division.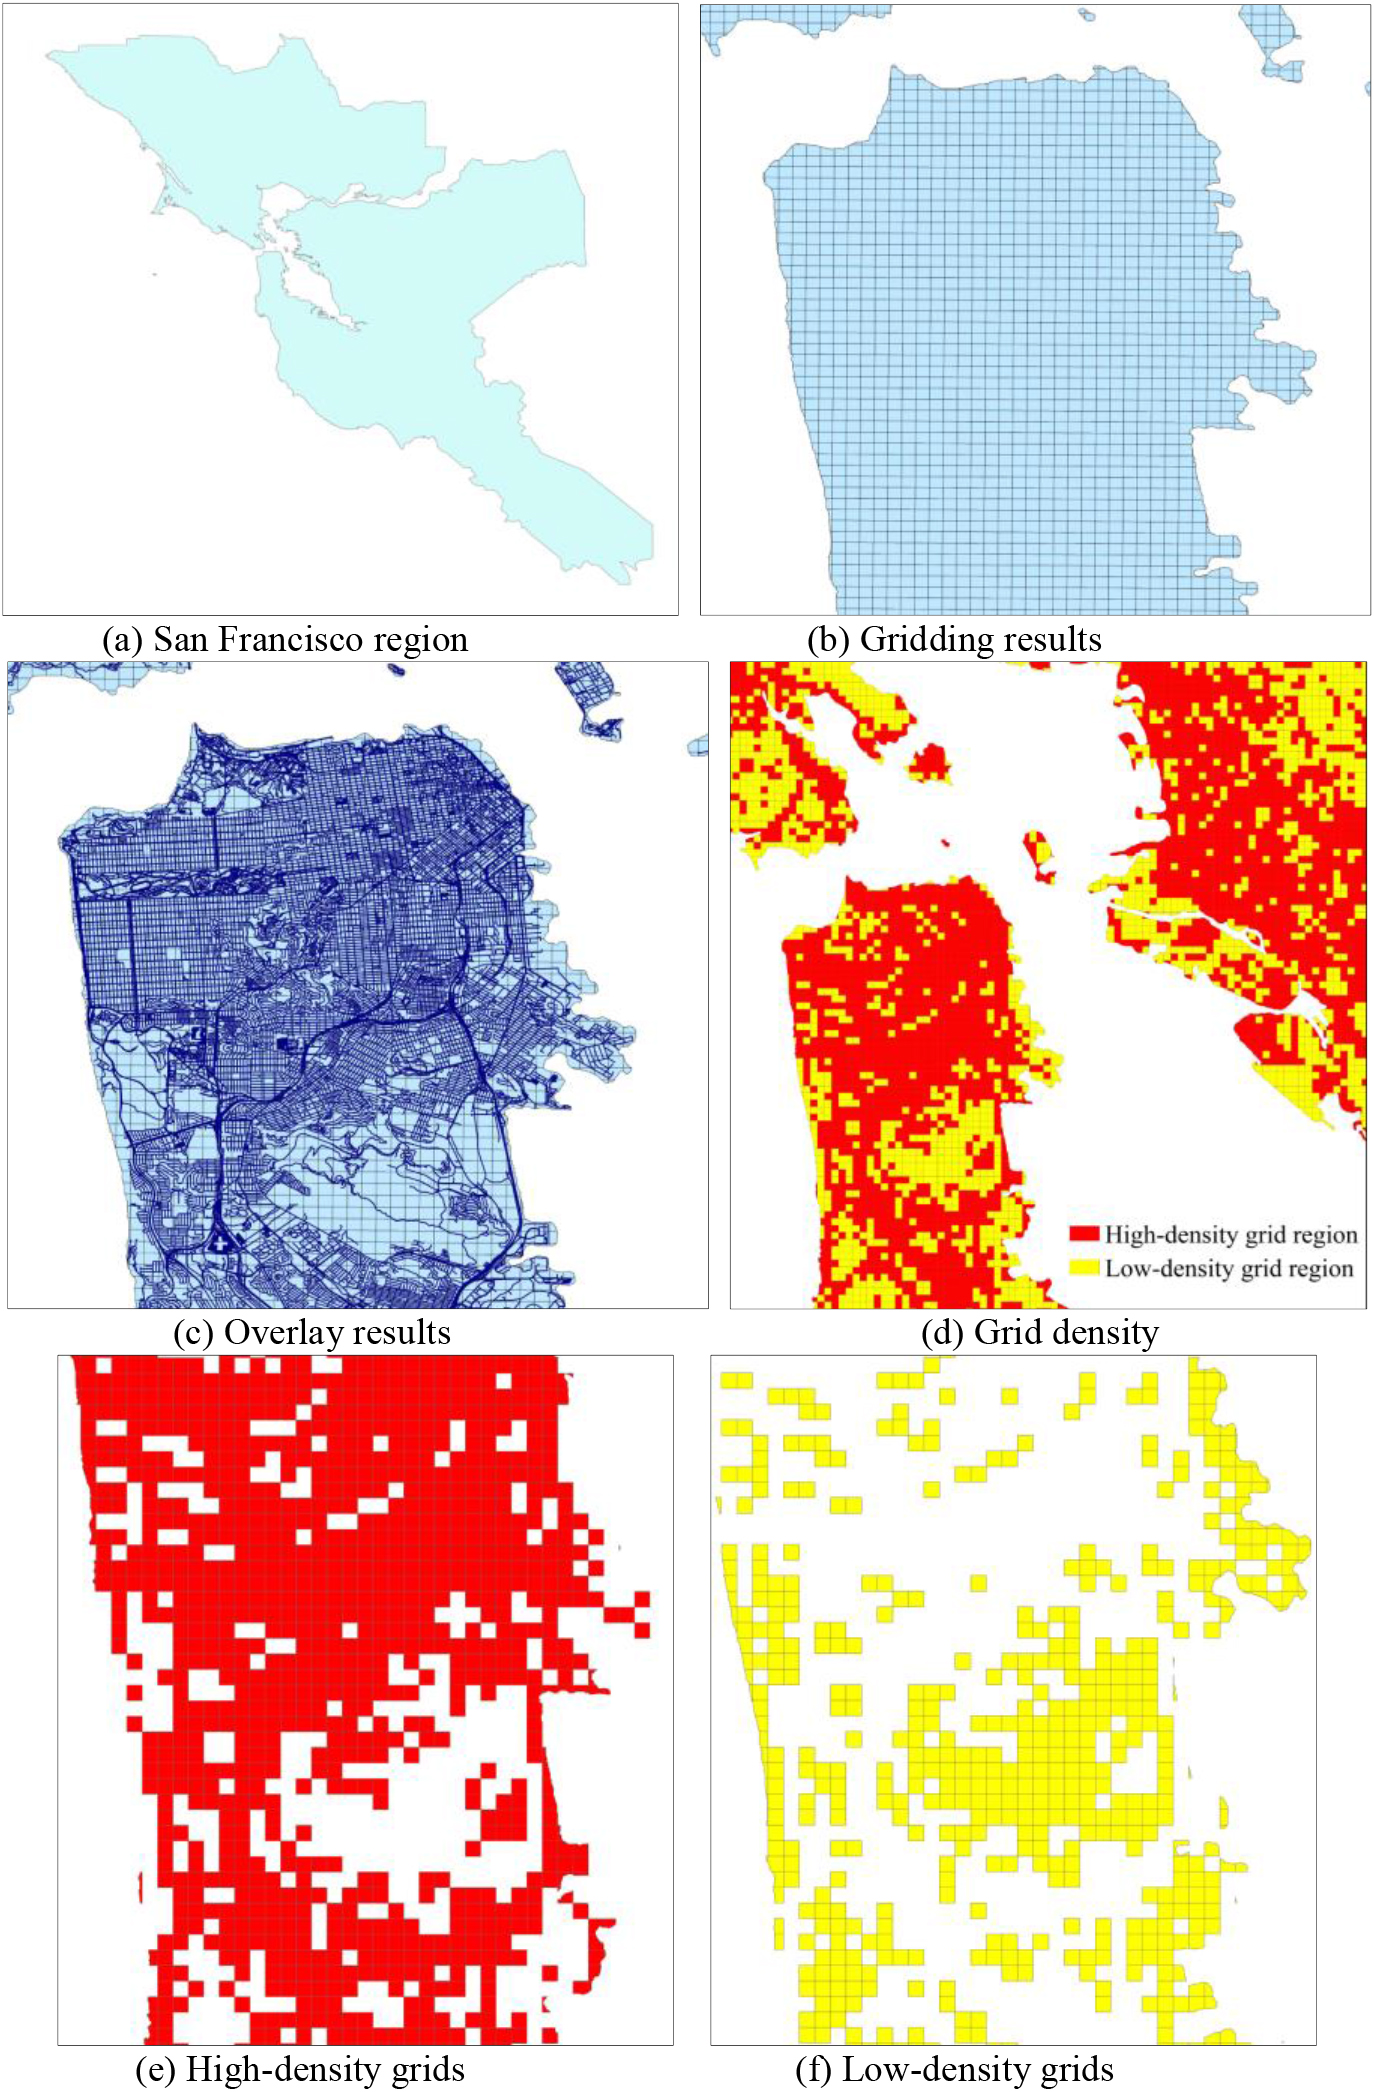
Road network information.
Trajectory dataset information
Fmeasure, Accuracy, Precision, Recall values on T-1 for different parameters.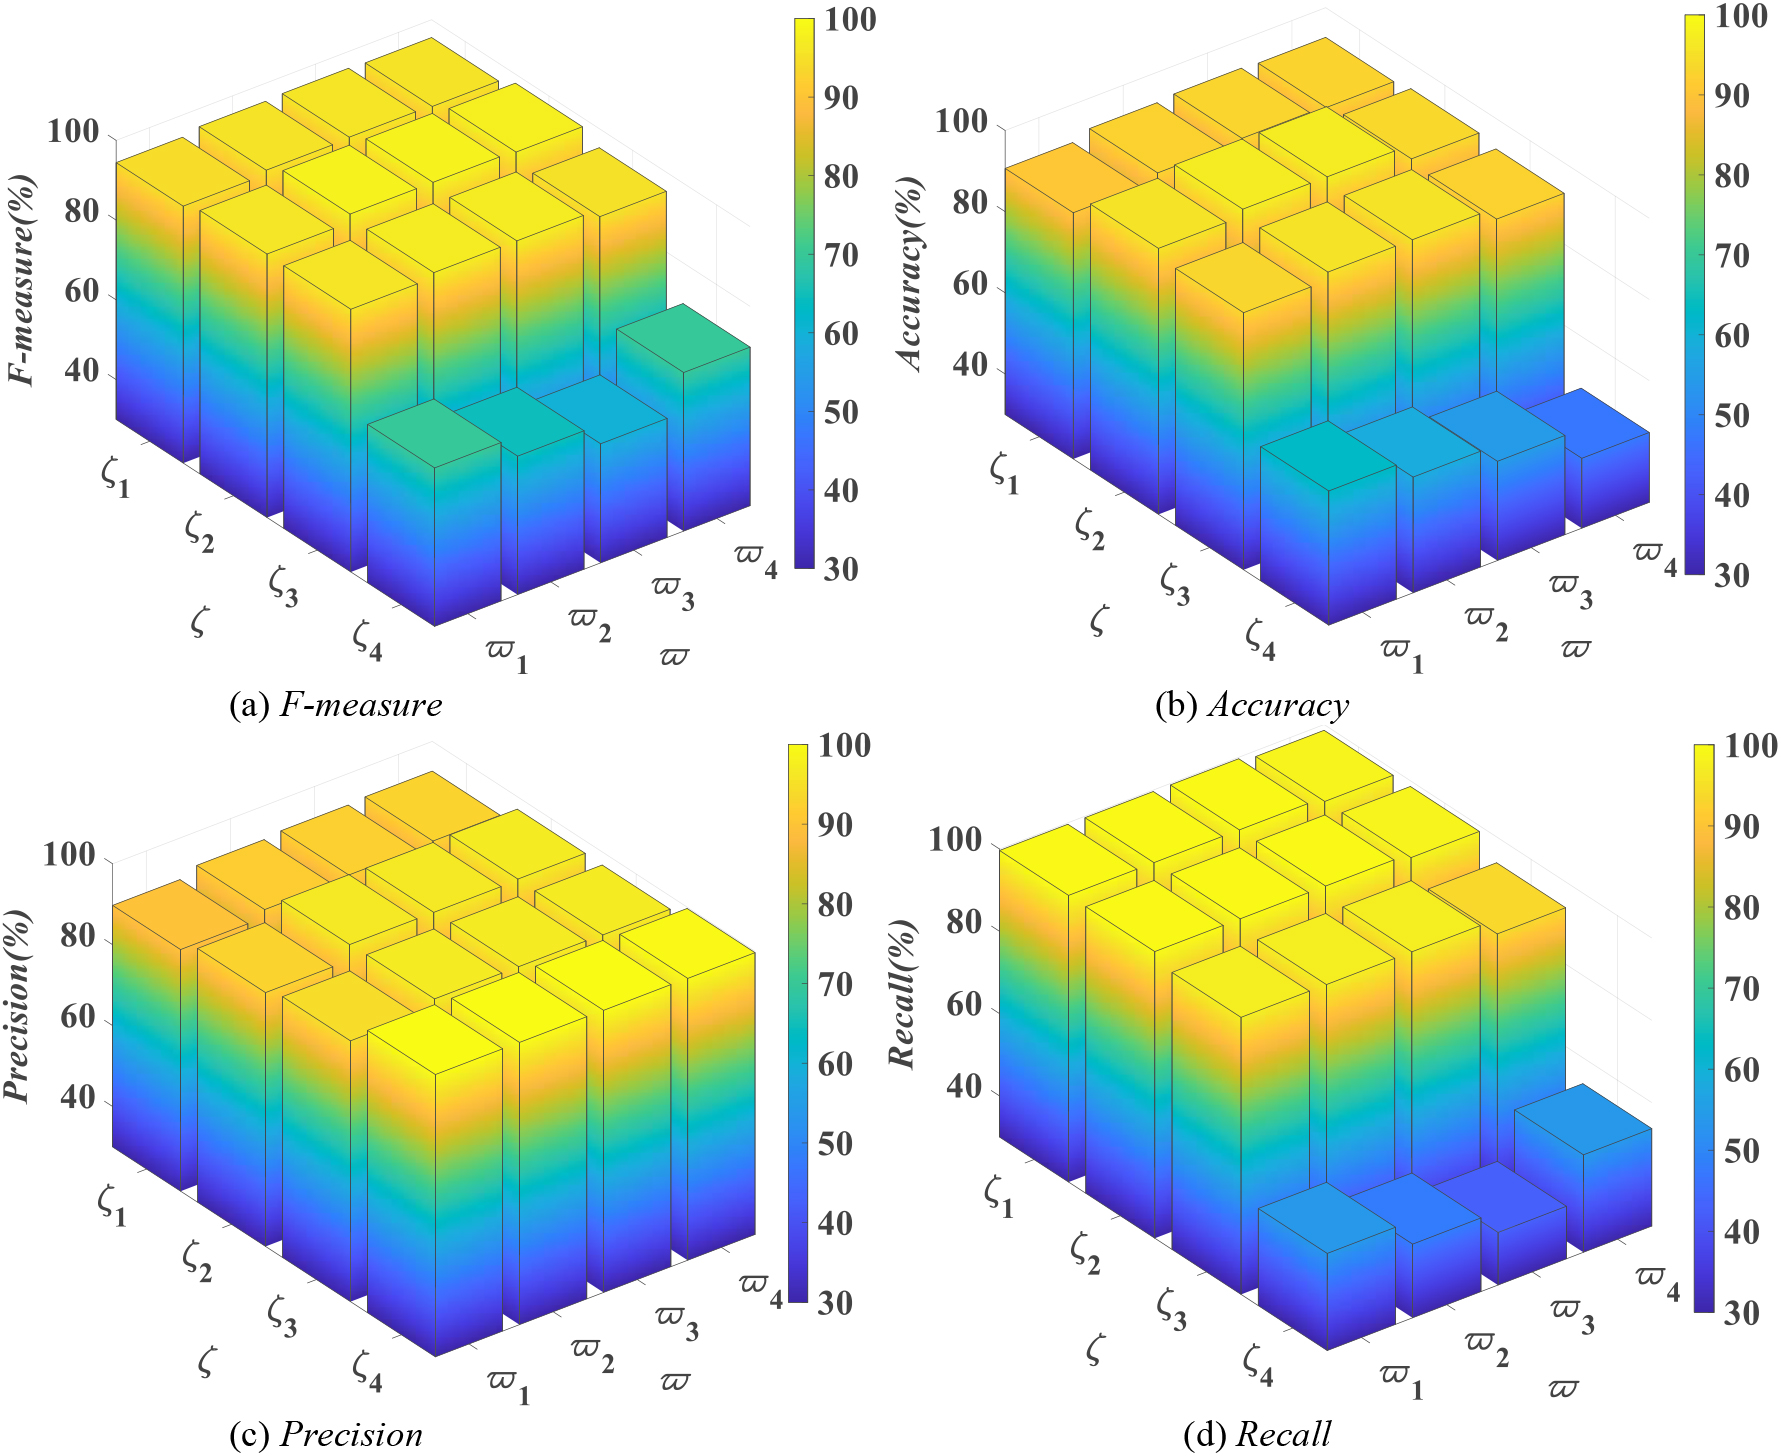
Results of other datasets.
Regular subtrajectory acquisition and abnormal judgment in trajectory outlier detection require dual-parameter settings. To verify the performance of the proposed TODG method, three SD pair (residential region to airport) trajectory sets, T-1 to T-3, were selected from 463,860 trajectories extracted from 1.122 million GPS points on 536 taxis. The roads near residential places or airports are more complex, and the roads between them are sparse, as shown in Fig. 6. T-1, T-2, and T-3 contain 1080, 1150, and 1125 trajectories, respectively. Some of the datasets are available at
From Fig. 7, the F-measure, Accuracy, Precision and Recall values are higher at (
Comparative evaluation
Efficiency of trajectory outlier detection
This section compares the time cost of TODG, Two Phase [24], ATDC [25], and iBAT [17]; the results are listed in Table 2. The running time of TODG on the three experimental datasets was always shorter than that of Two Phase, ATDC, and iBAT. Two Phase algorithm detects outliers by calculating the distance between adjacent trajectory points and requires repeated calculations of the Euclidean distance between different trajectory points. ATDC first calculates the abnormal scores of all trajectories in the trajectory dataset using a single trajectory as the standard. It then finds the trajectories with the largest number of the same score, which is used as the standard set to repeat the above operation, and calculates the abnormal scores of the remaining trajectories in the trajectory set. iBAT identifies outlying trajectories based on isolation and constructs multiple decision trees to detect trajectory outliers. The core concept is to isolate the trajectories cyclically. The Two Phase, ATDC and iBAT algorithms have a higher time complexity, and their running time is longer than that of the TODG method proposed in this study.
Accuracy of trajectory outlier detection
Based on the parameter settings in Section 5.3, this section compares the F-measure, Accuracy, Precision, and Recall values of TODG with those of Two Phase, ATDC, and iBAT to test the effectiveness of the proposed TODG method for trajectory-outlier detection. Figures 9–12 show the F-measure, Accuracy, Precision, and Recall results of the four methods, TODG, Two Phase, ATDC, and iBAT, on trajectory sets T-1, T-2, and T-3.
Running time (sec)
Running time (sec)
Fmeasure comparison.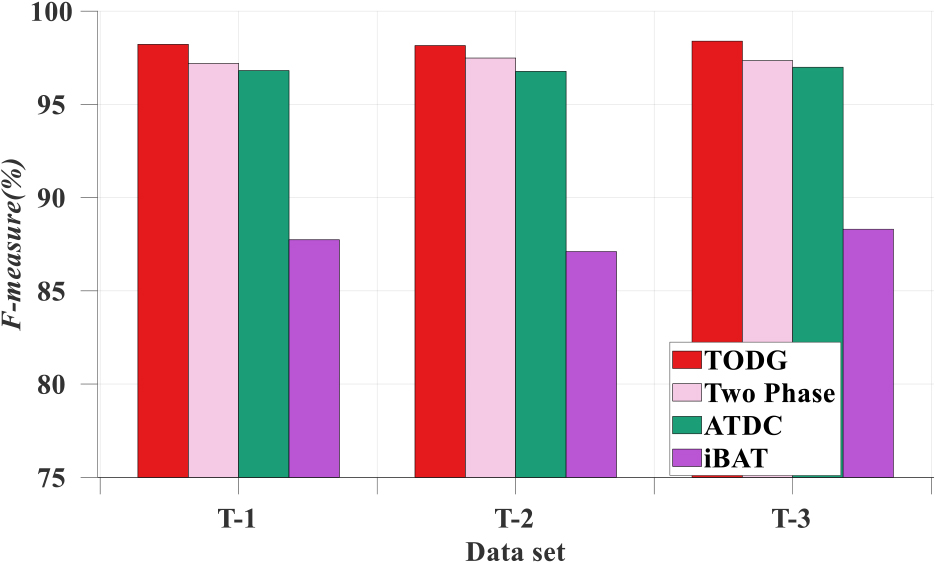
Accuracy comparison.
Precision comparison.
Recall comparison.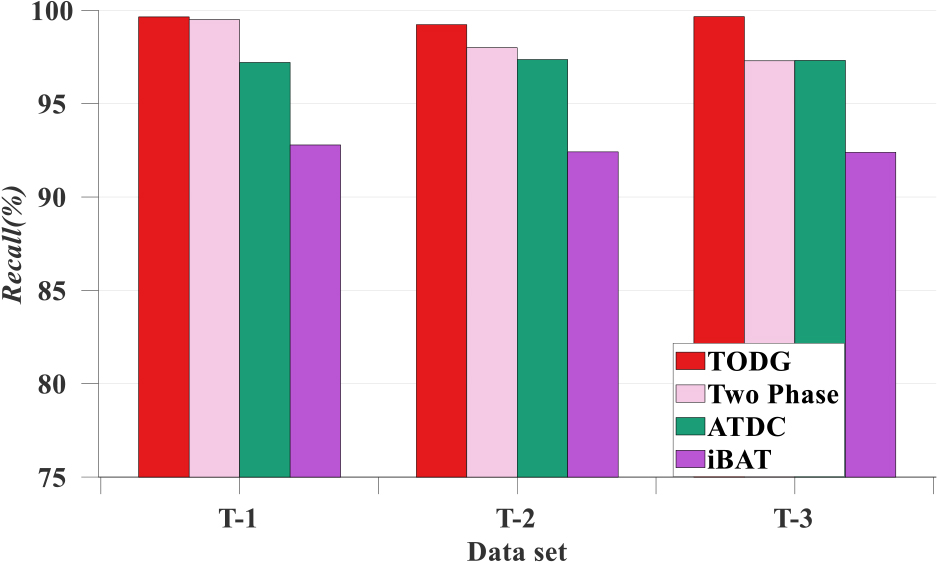
Visualization of the original trajectories.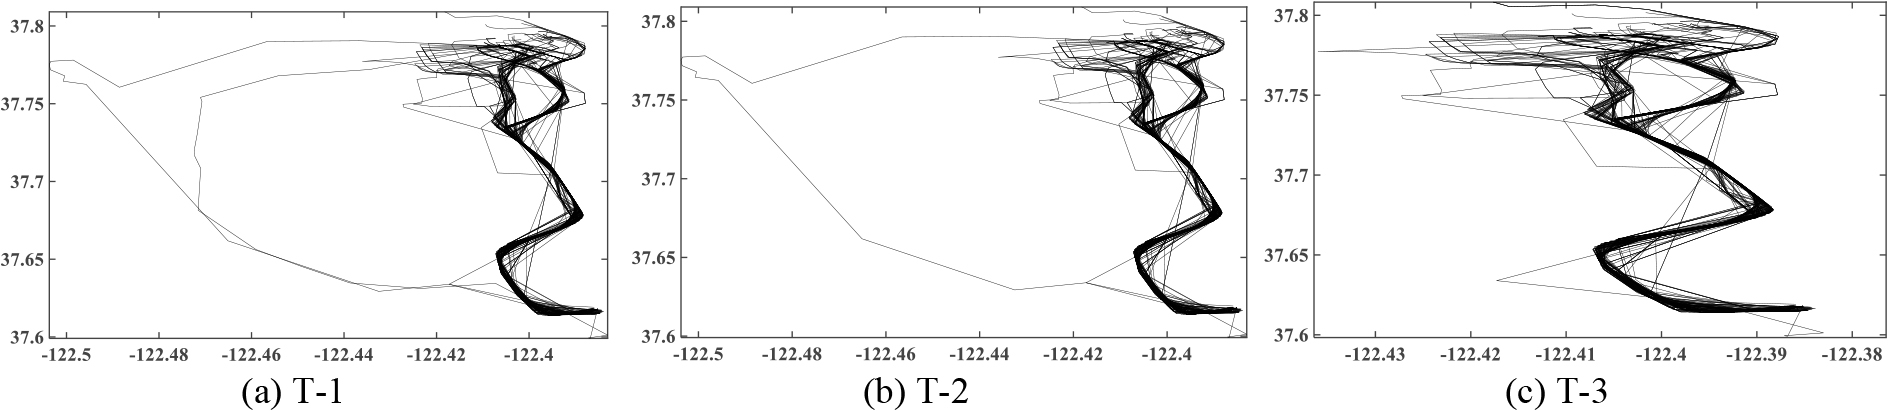
Visualization of TODG results.
As shown in Figs 9–12, although the Two Phase have higher Precision on the T-3 dataset, it has a smaller F-measure owing to a smaller Recall than that of TODG. The outlier detection results of the iBAT were worse than those of the other three methods. This is because the iBAT algorithm detects outlying trajectories according to the selected subsamples, whereas the detection results are affected by the selected subsamples. The Two Phase algorithm calculates the trajectory point density and identifies individual outliers based on the trajectory point density threshold. However, the detection results were affected by the density values of individual trajectory points. The ATDC algorithm converts the driving distance of a trajectory into several grids, and the detection results of the outlying trajectories are influenced by the number of grids. Meanwhile, Two Phase, ATDC, and iBAT ignore the objective factors that normal trajectories may contain multiple spatial types and that there may also be deviations between normal trajectories. Therefore, the F-measure, Accuracy, Precision and Recall results of the other methods were inferior to those of the TODG.
Based on the parameter settings, the detection effect of the proposed TODG method was verified on the T-1, T-2, and T-3 trajectory sets. The visualization results are shown in Fig. 13.
The detection results of TODG on T-1, T-2 and T-3 datasets are shown in Fig. 14a–c respectively.
The outlying trajectories detected by the TODG are marked in green in Fig. 14. The experimental results show that the proposed TODG algorithm performs well in trajectory-outlier detection.
Conclusions
Most existing trajectory outlier detection methods use the trajectory as an entire object to detect outlying trajectories and do not consider situations in which the deviation between individual trajectories in the trajectory dataset is too large. To address these issues, this study proposes a trajectory outlier detection method based on group divisions. This method divides the trajectory dataset into multiple trajectory groups according to the trajectory features and detects outlying trajectories in the trajectory groups to prevent the influence of trajectory deviation in the trajectory dataset on outlying trajectory judgment. Simultaneously, the road length was considered under fixed grid conditions, and the trajectories were coded and divided into trajectory groups according to the number of codes with low grid density. Experimental results show that the proposed method has better detection accuracy and operational efficiency than similar methods.
However, TODG has certain limitations. Although it can distinguish between normal and outlying trajectories, it cannot identify outlying subsegments. In addition, when there is collective detour behaviour, the detection effect may not be good. In future work, we will conduct a more detailed classification of normal and outlying trajectories, integrate temporal and semantic attributes, analyse road traffic conditions, and further improve the accuracy of trajectory-outlier detection.
Footnotes
Acknowledgments
The work was supported by the National Natural Science Foundation of China under Grant Nos. 62272006 and 61972439, the Anhui Provincial Natural Science Foundation of China under Grant Nos. 2208085MF164 and 2108085MF214, the University Natural Science Research Program of Anhui Province under Grant No. KJ2021A0125, and the Key Research and Development Project of Wuhu under Grant No. 2022yf55.